Parametric Analysis and Stiffness Investigation of Extended End-Plate Connection

Abstract
1. Introduction
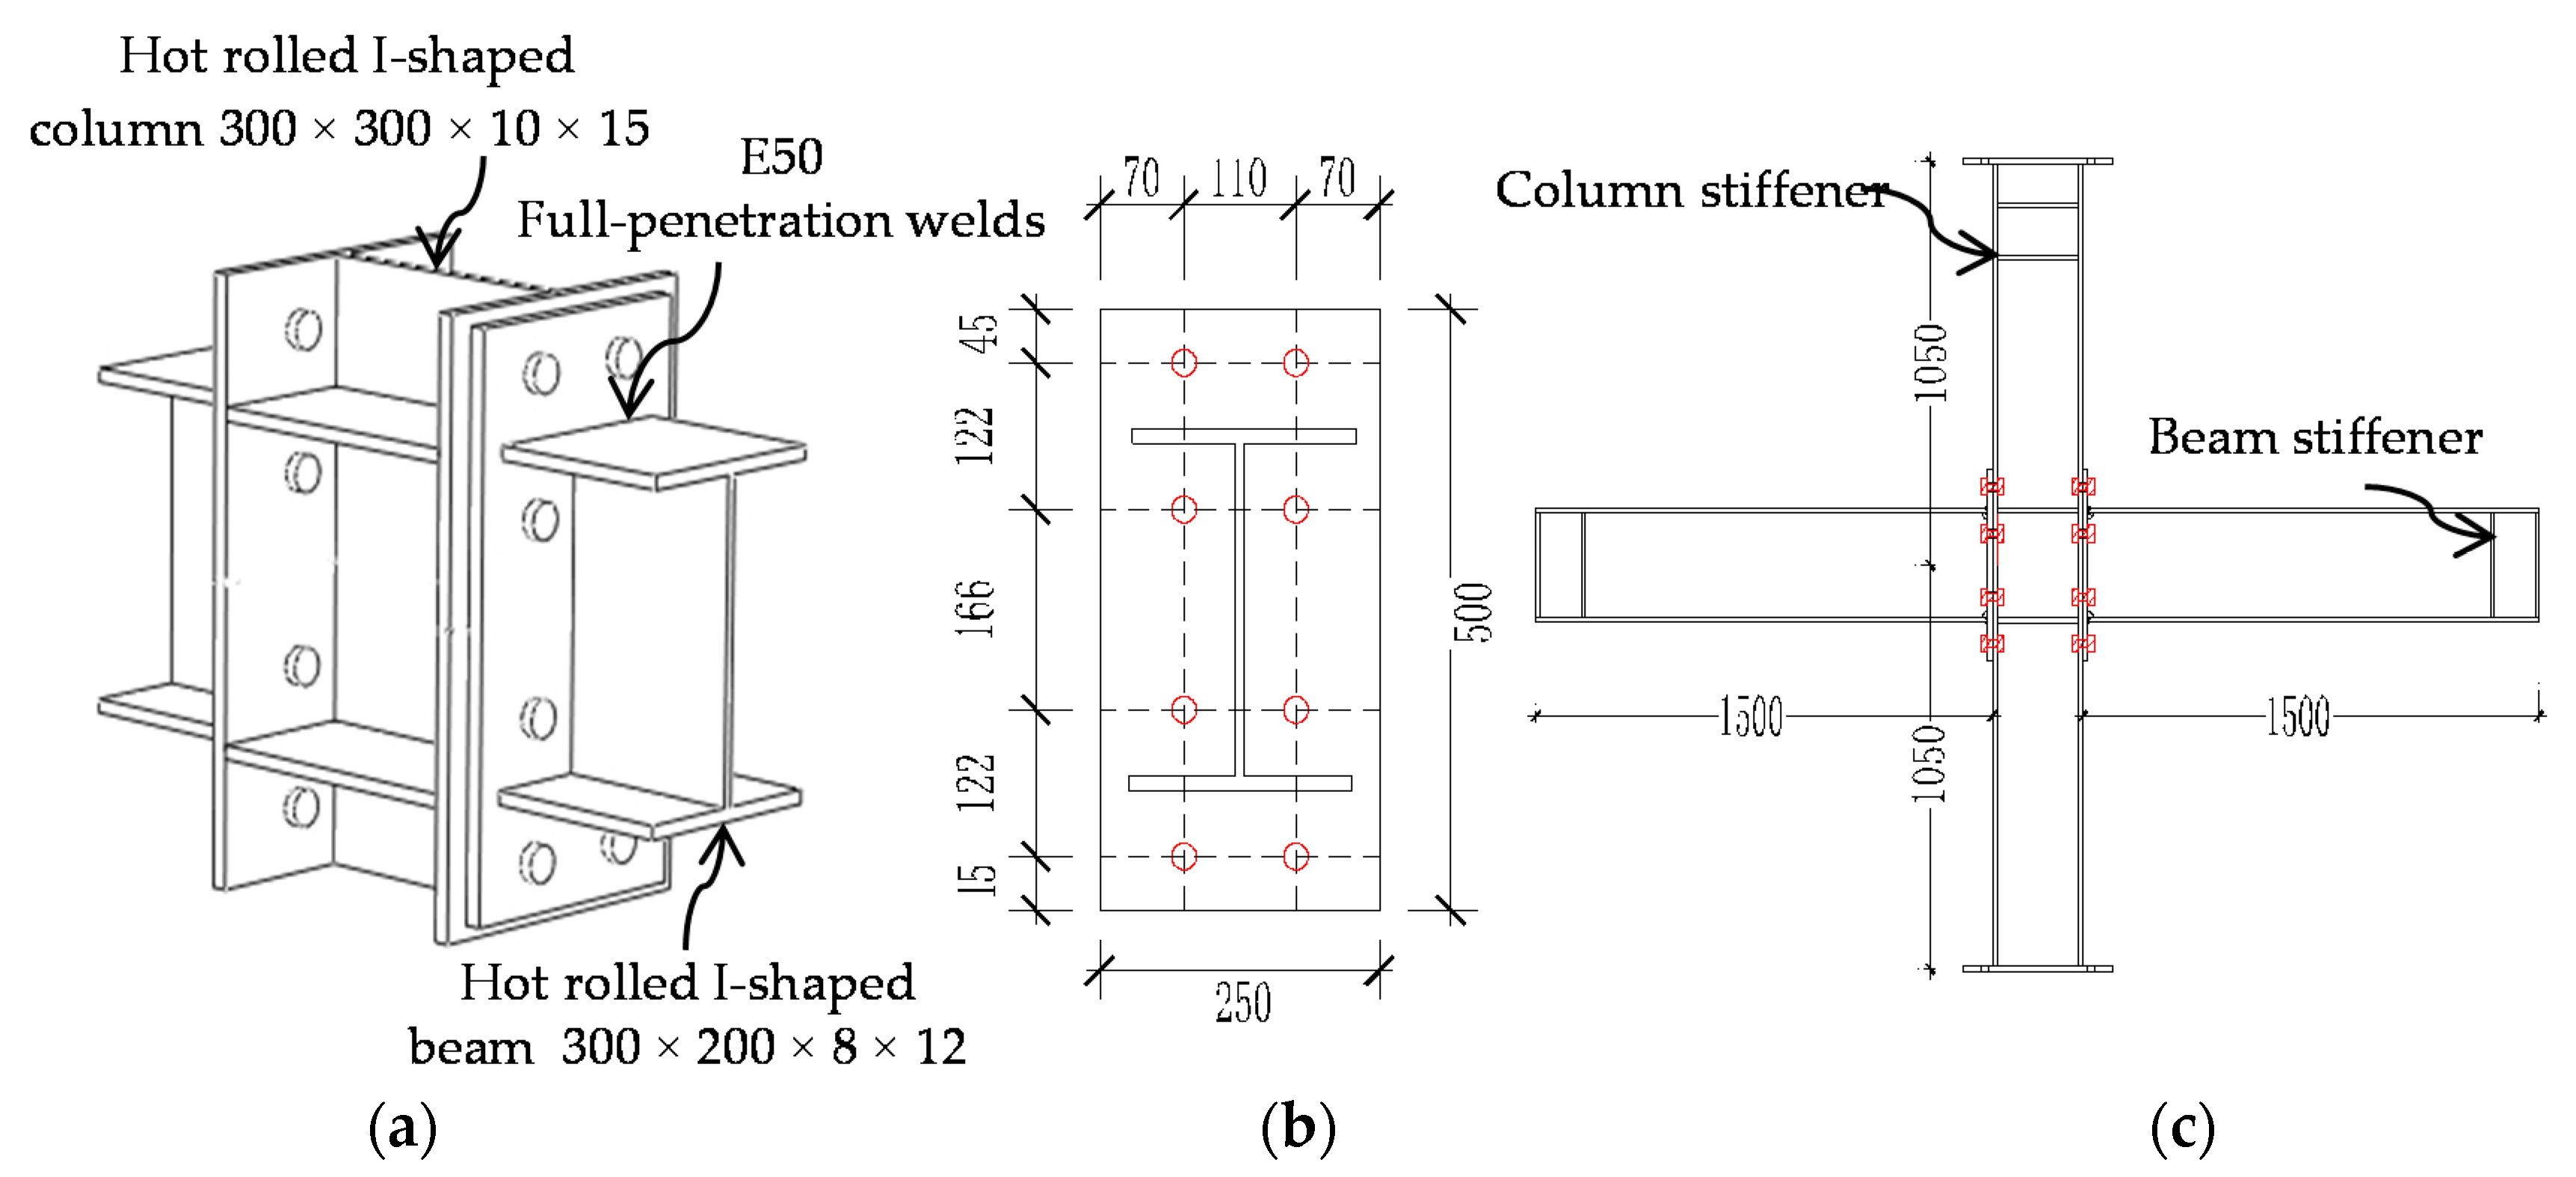
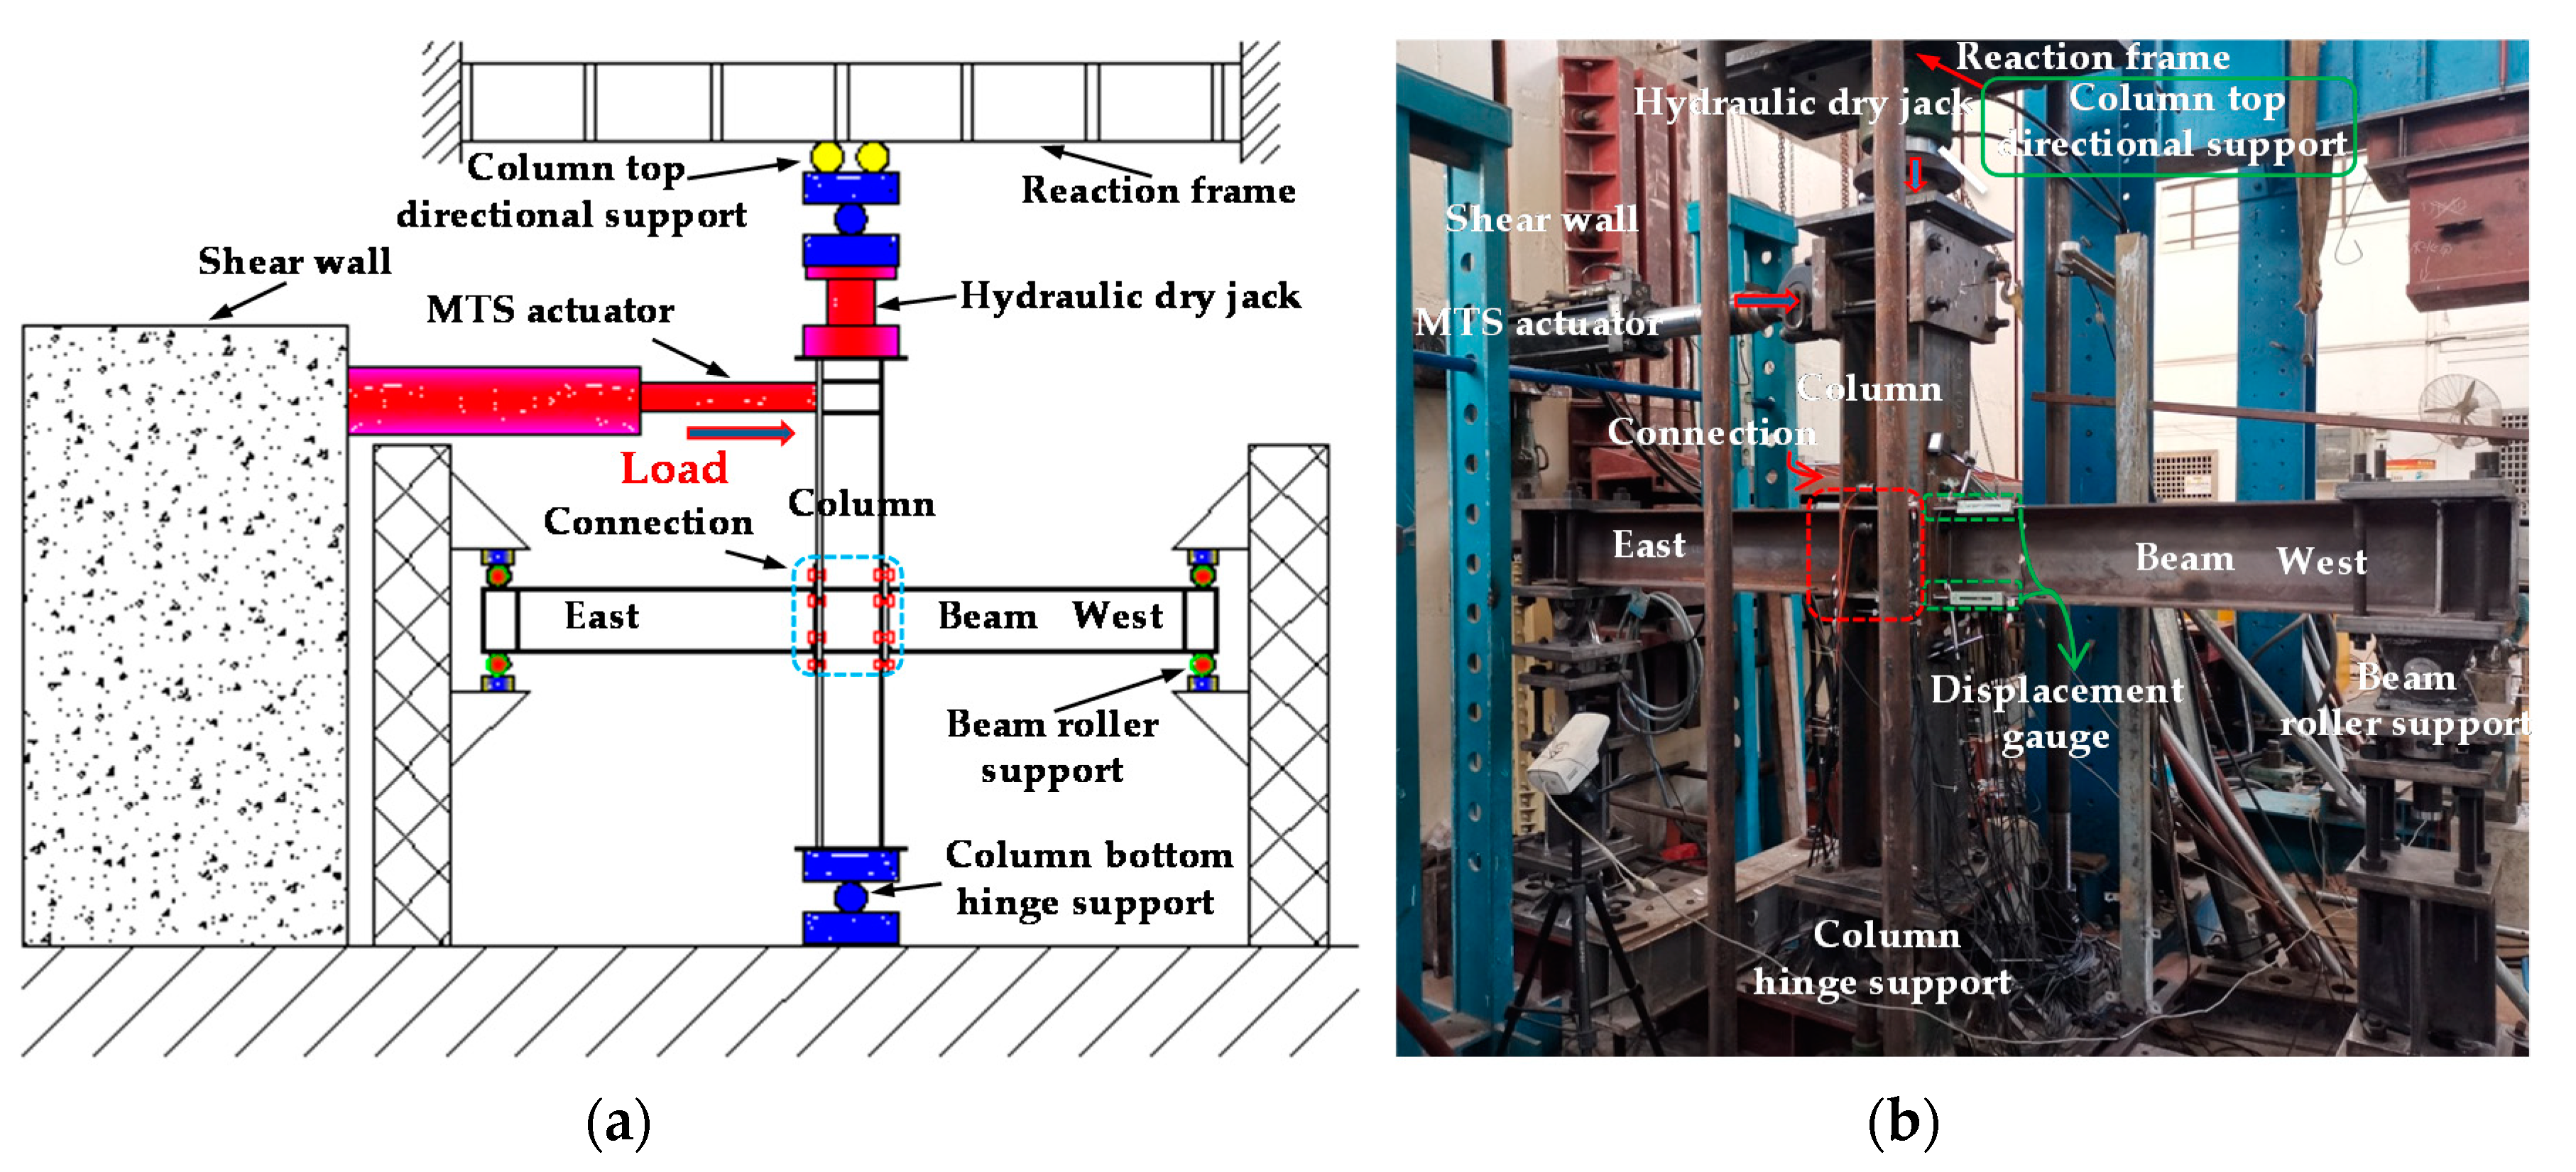
2. Test Overview
3. Finite Element Modeling
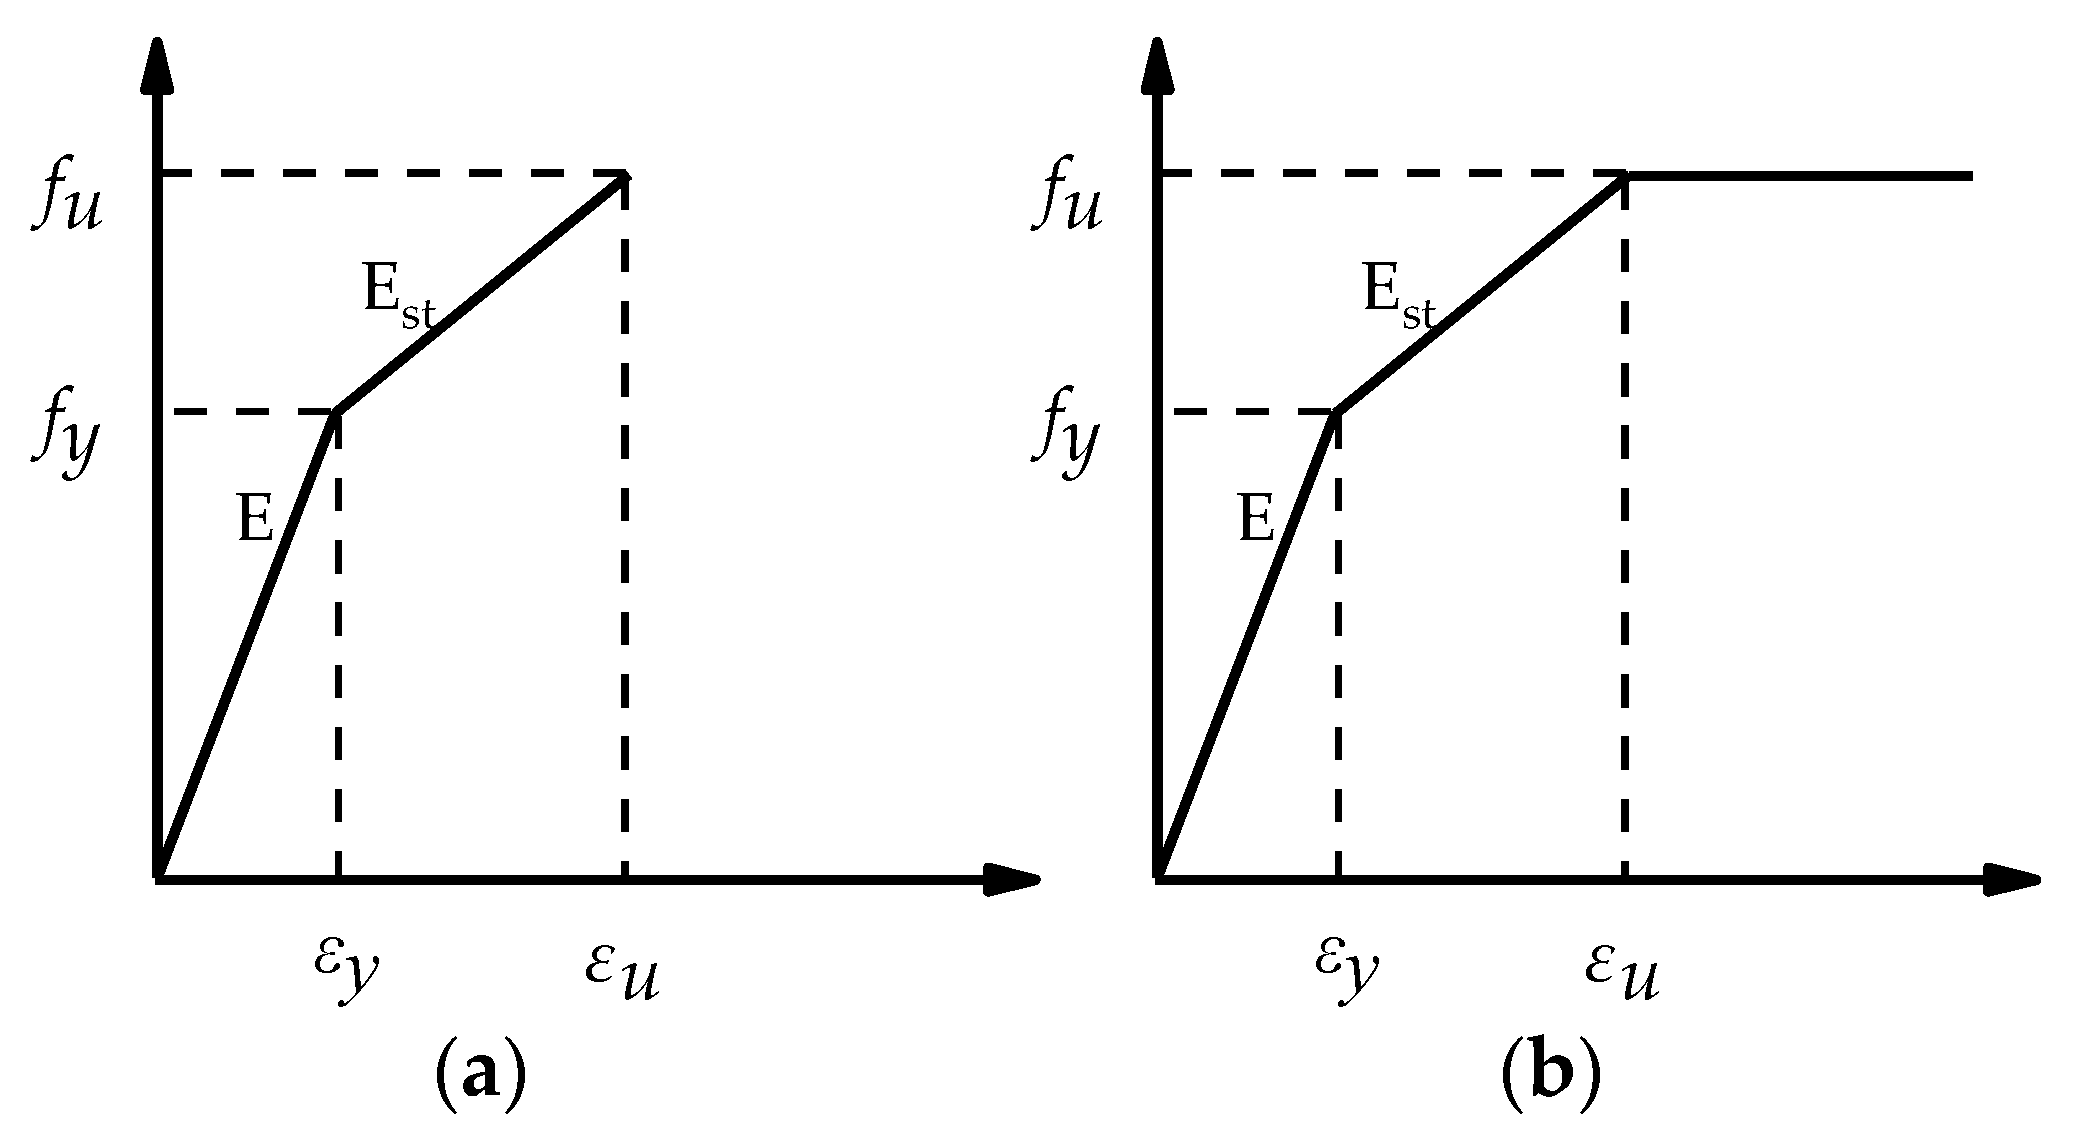
3.1. Material Models
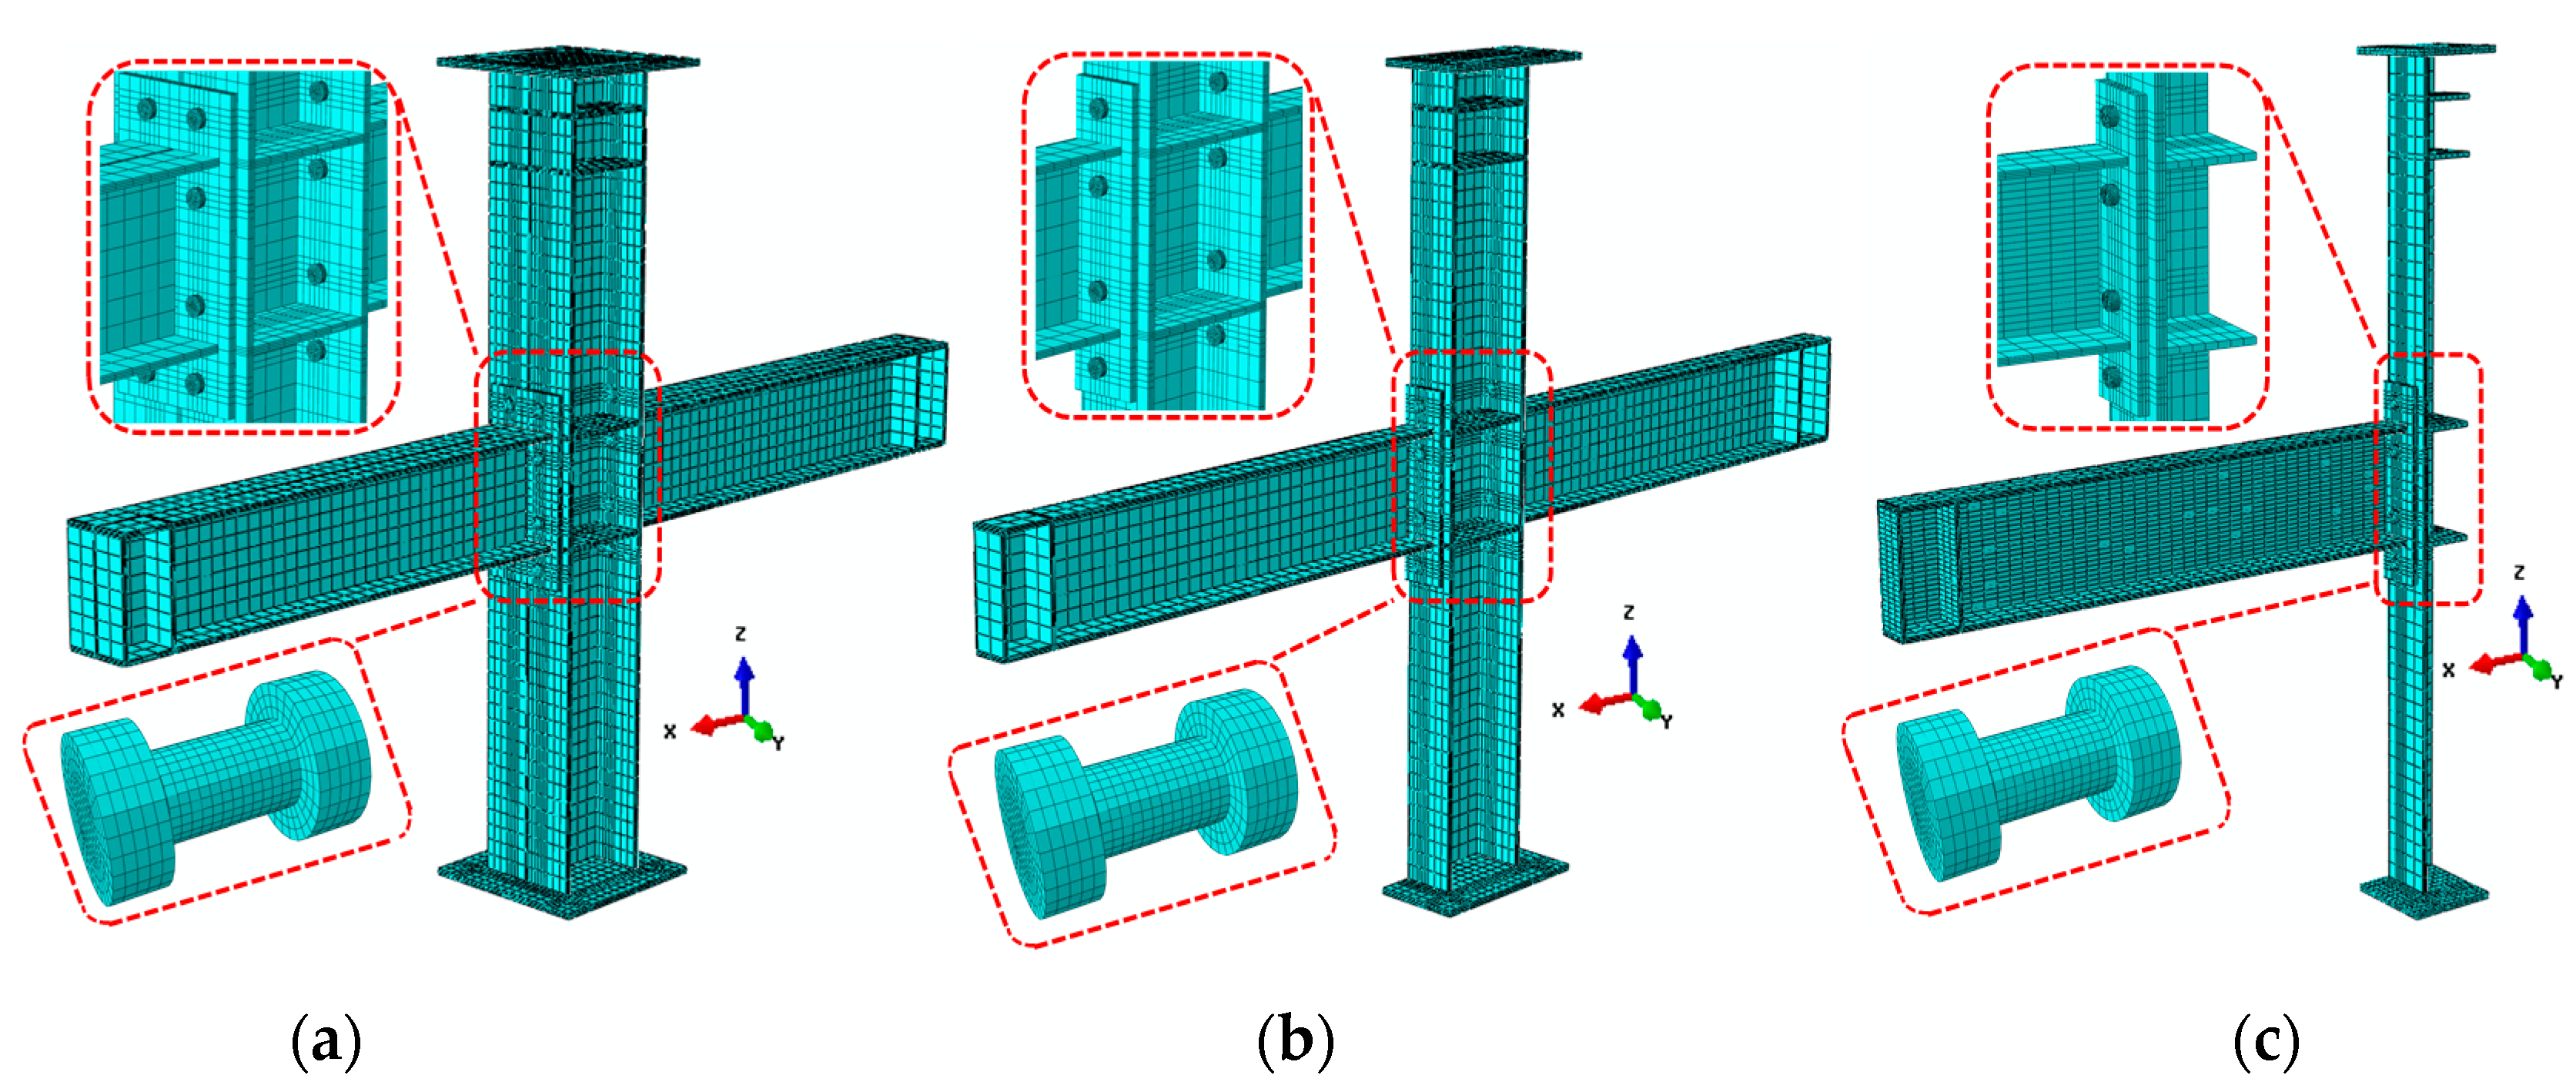
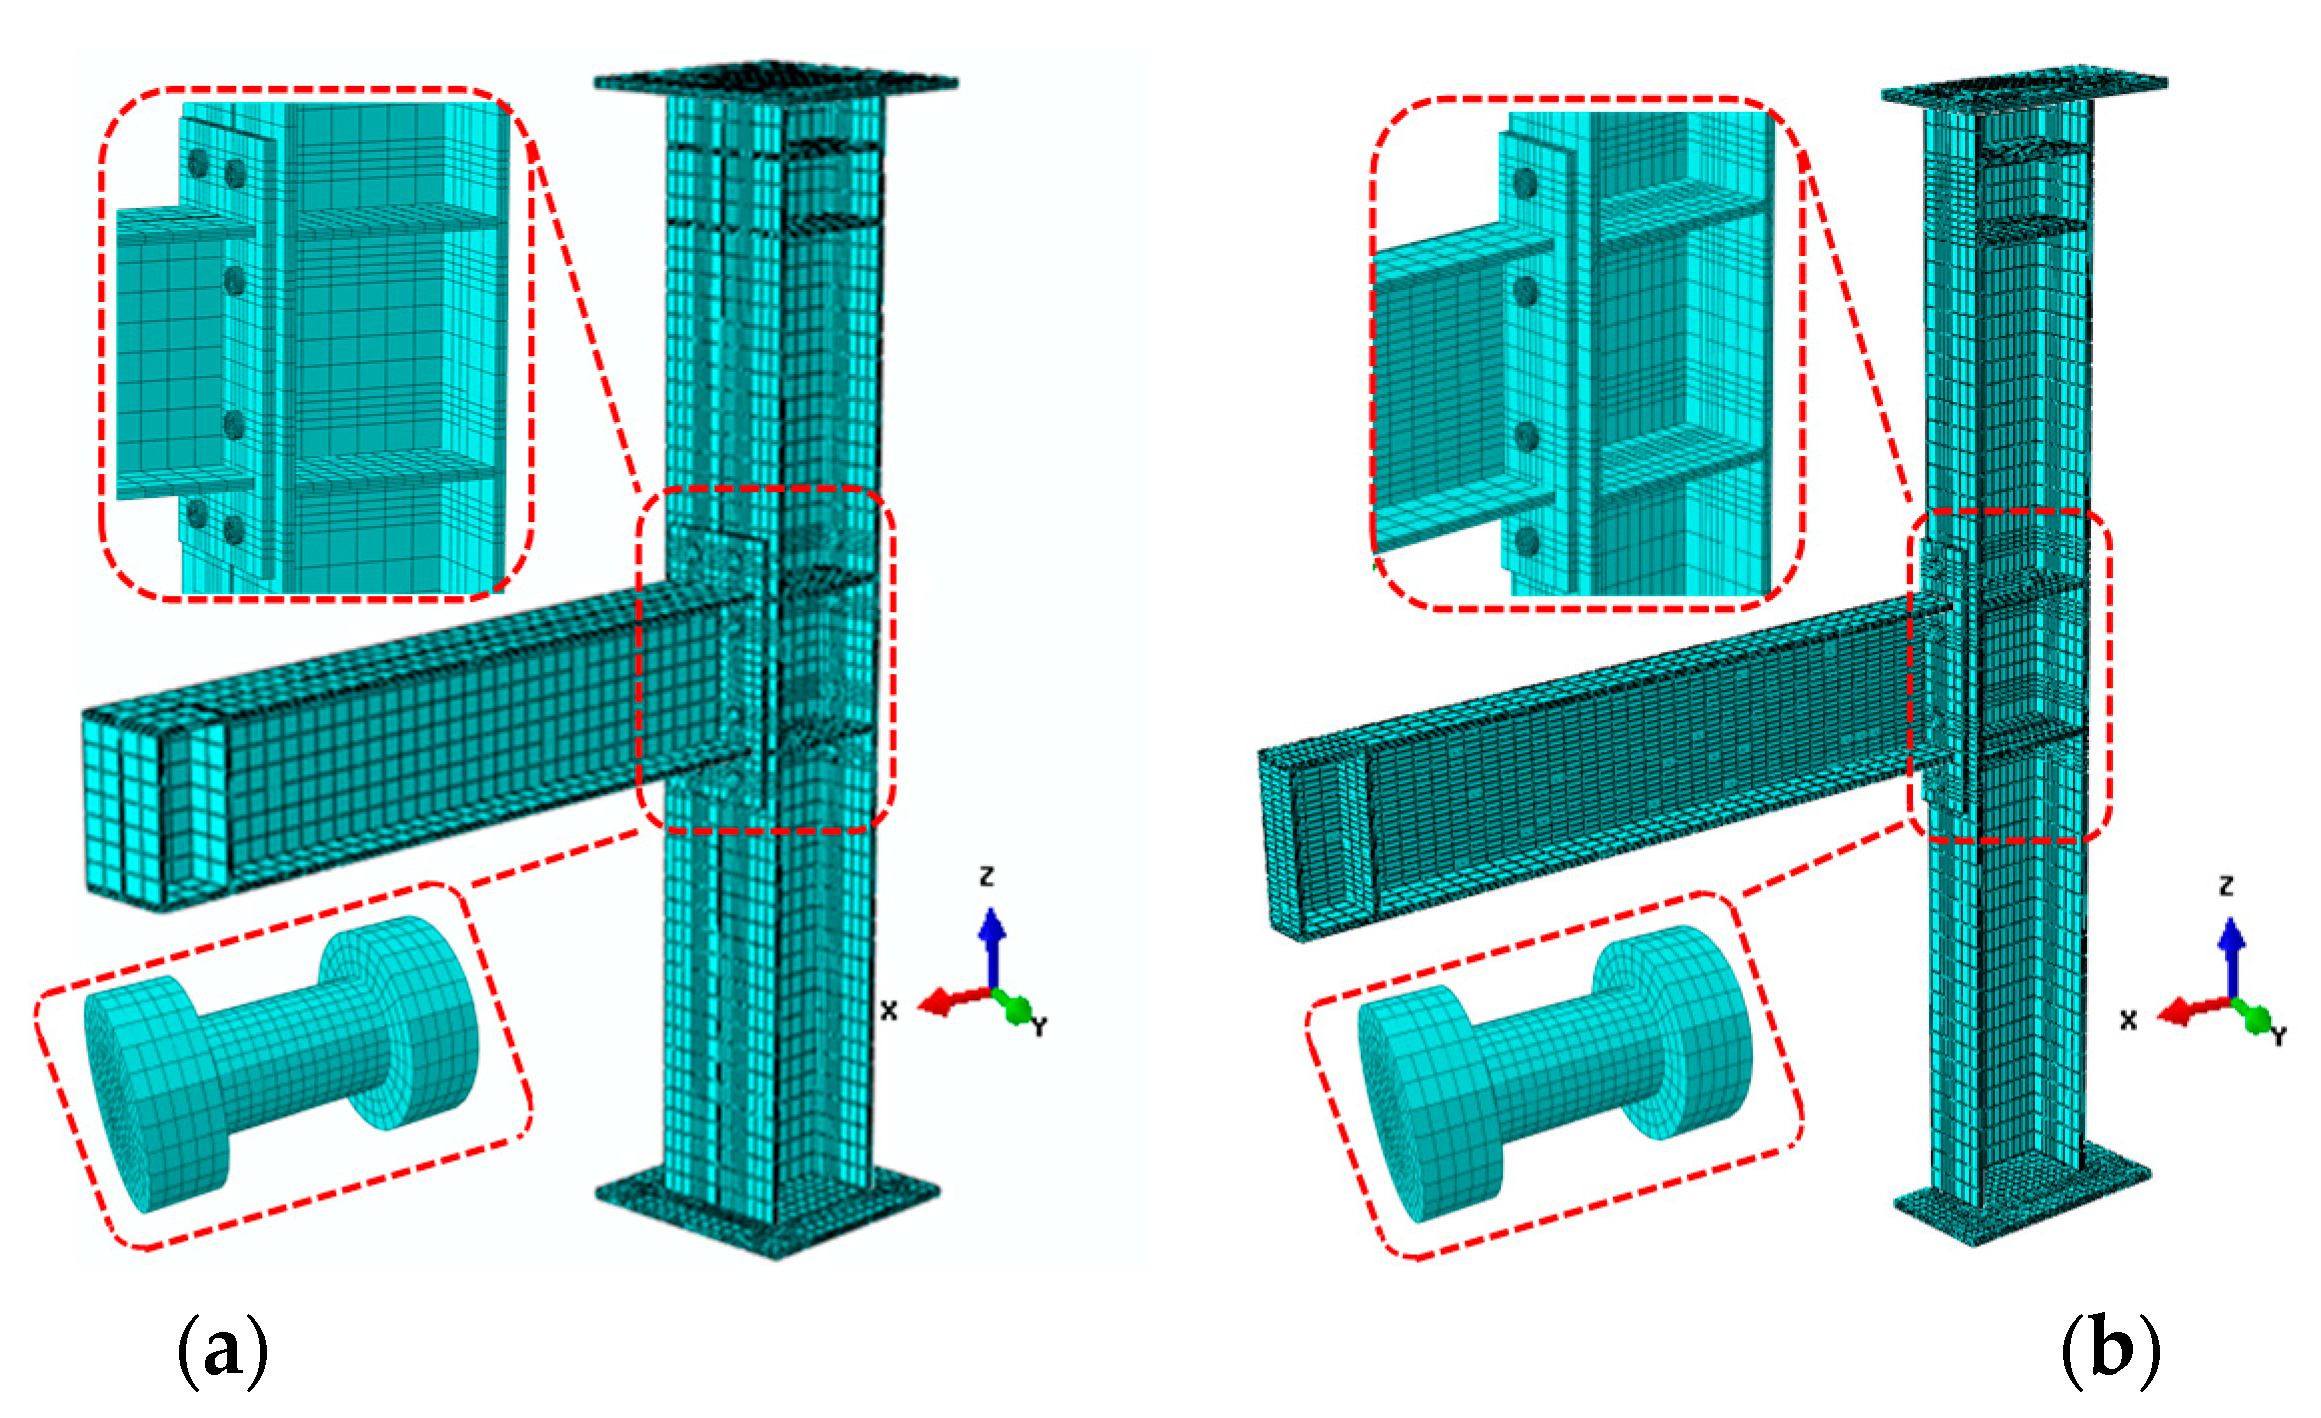
3.2. Finite Element Modeling
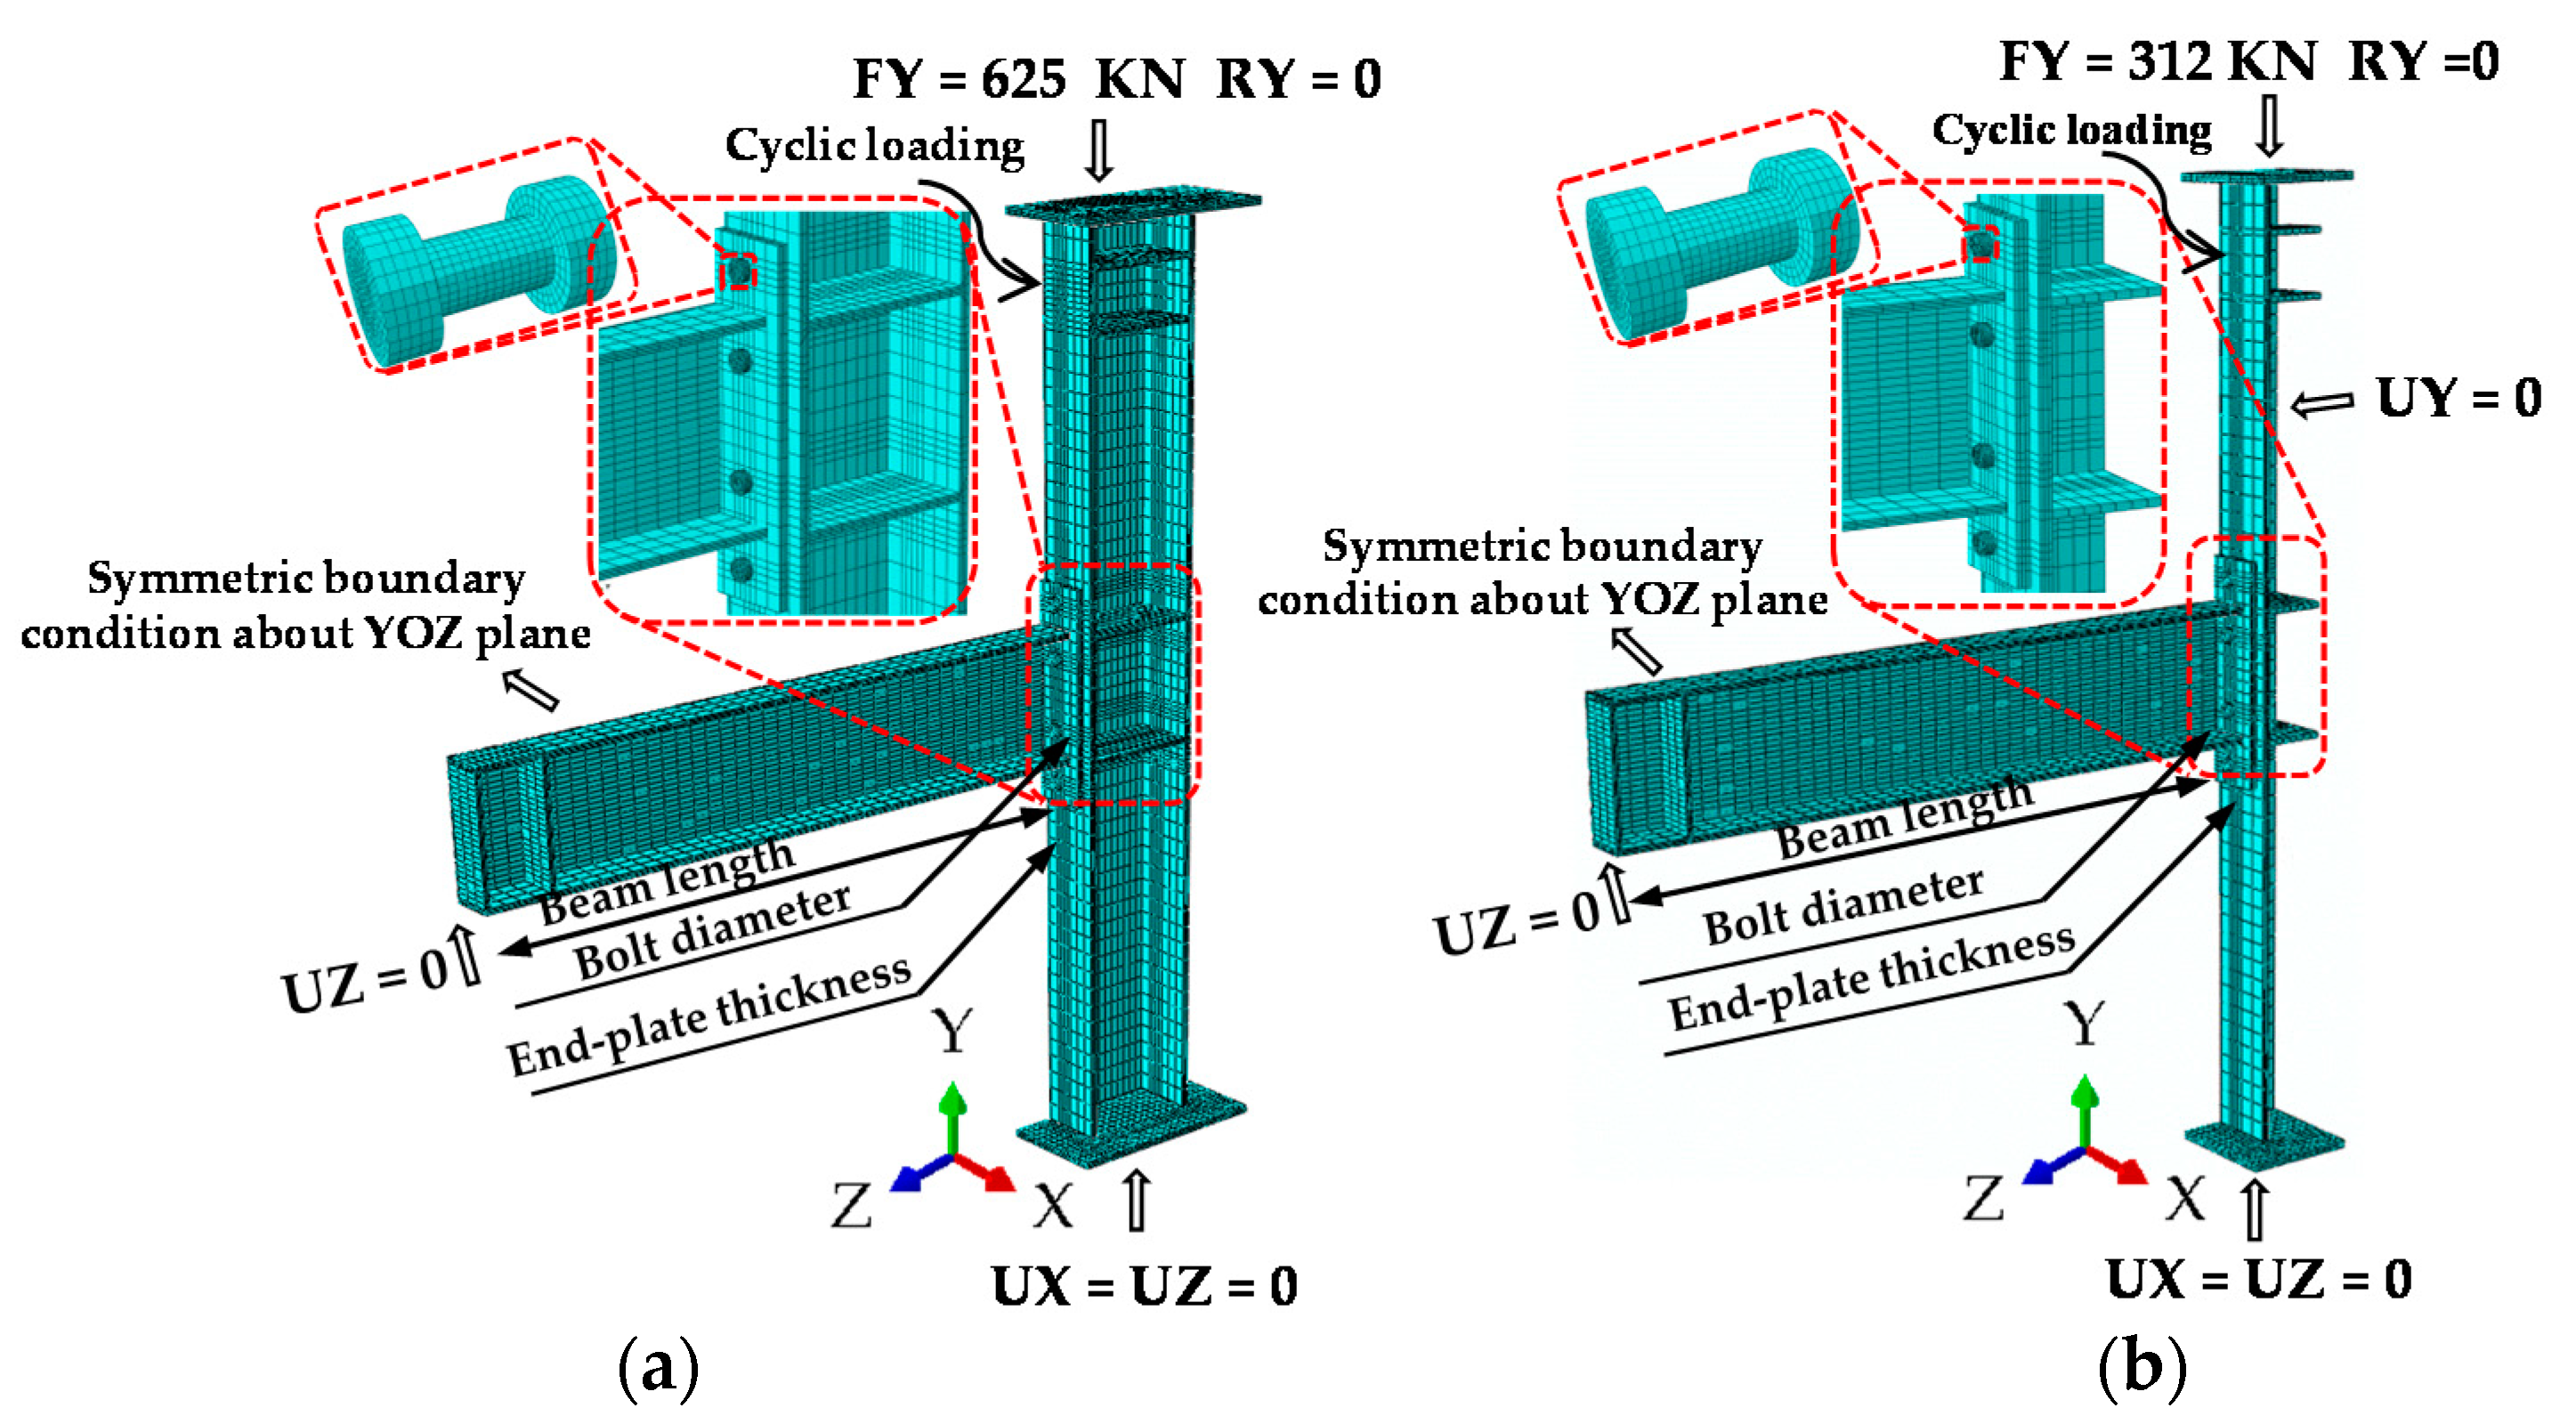
3.3. Boundary Conditions and Symmetry
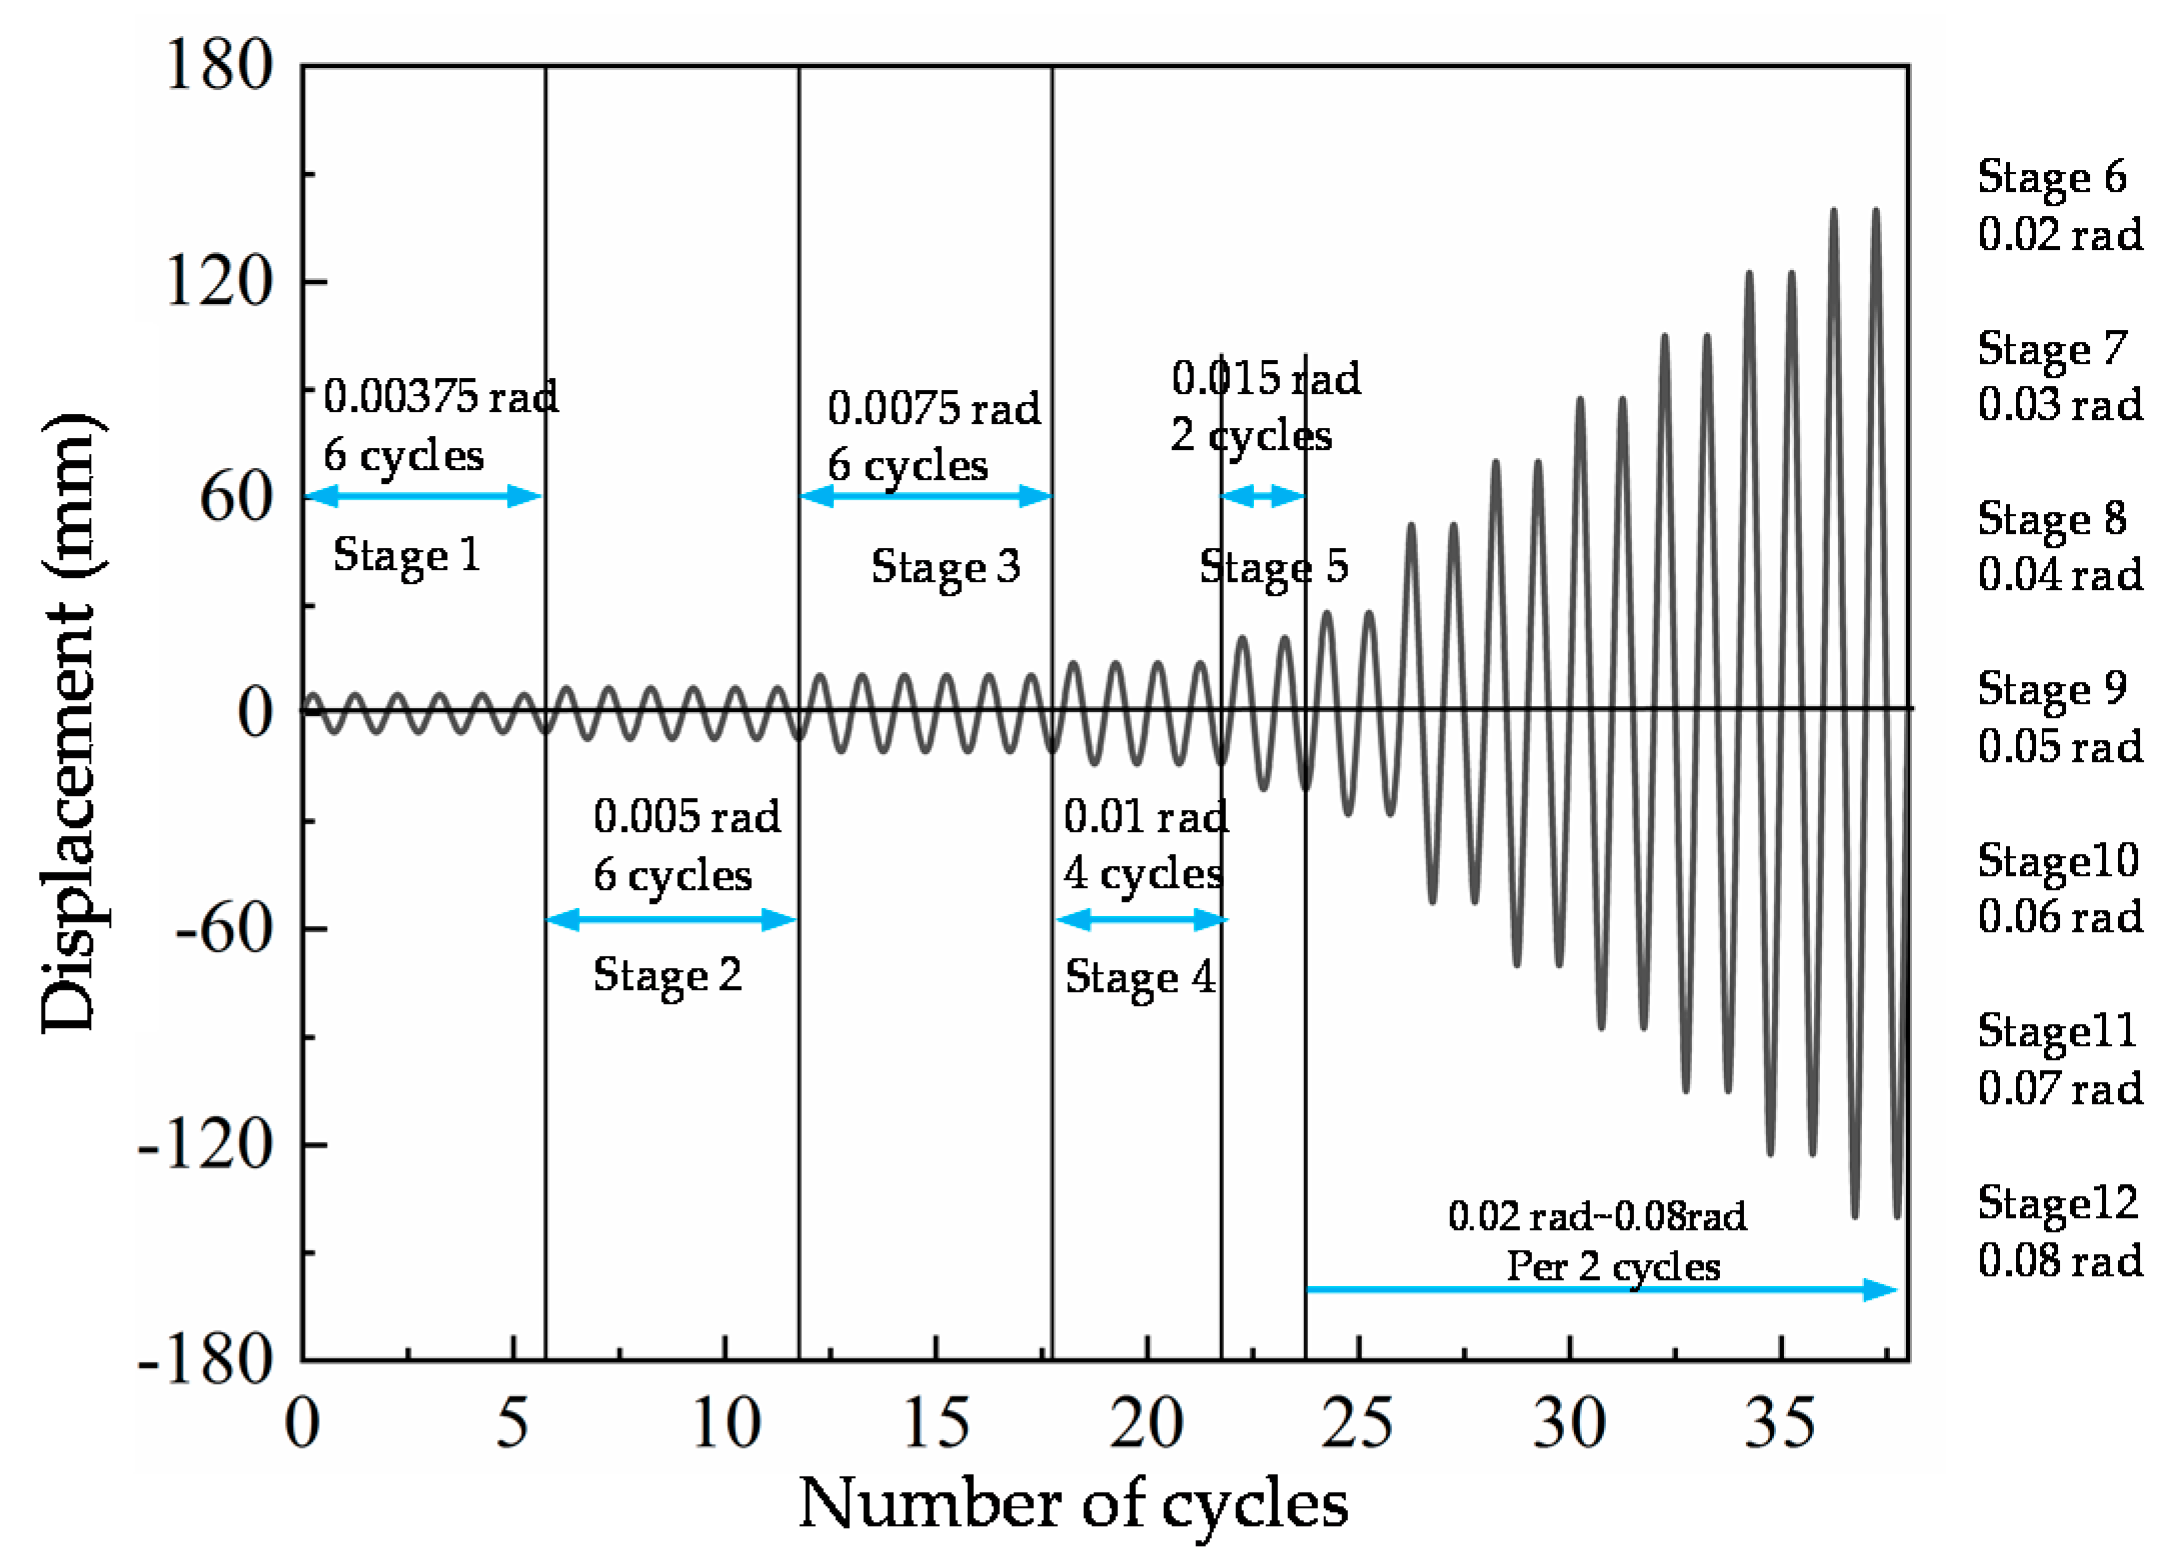
3.4. Loading Type
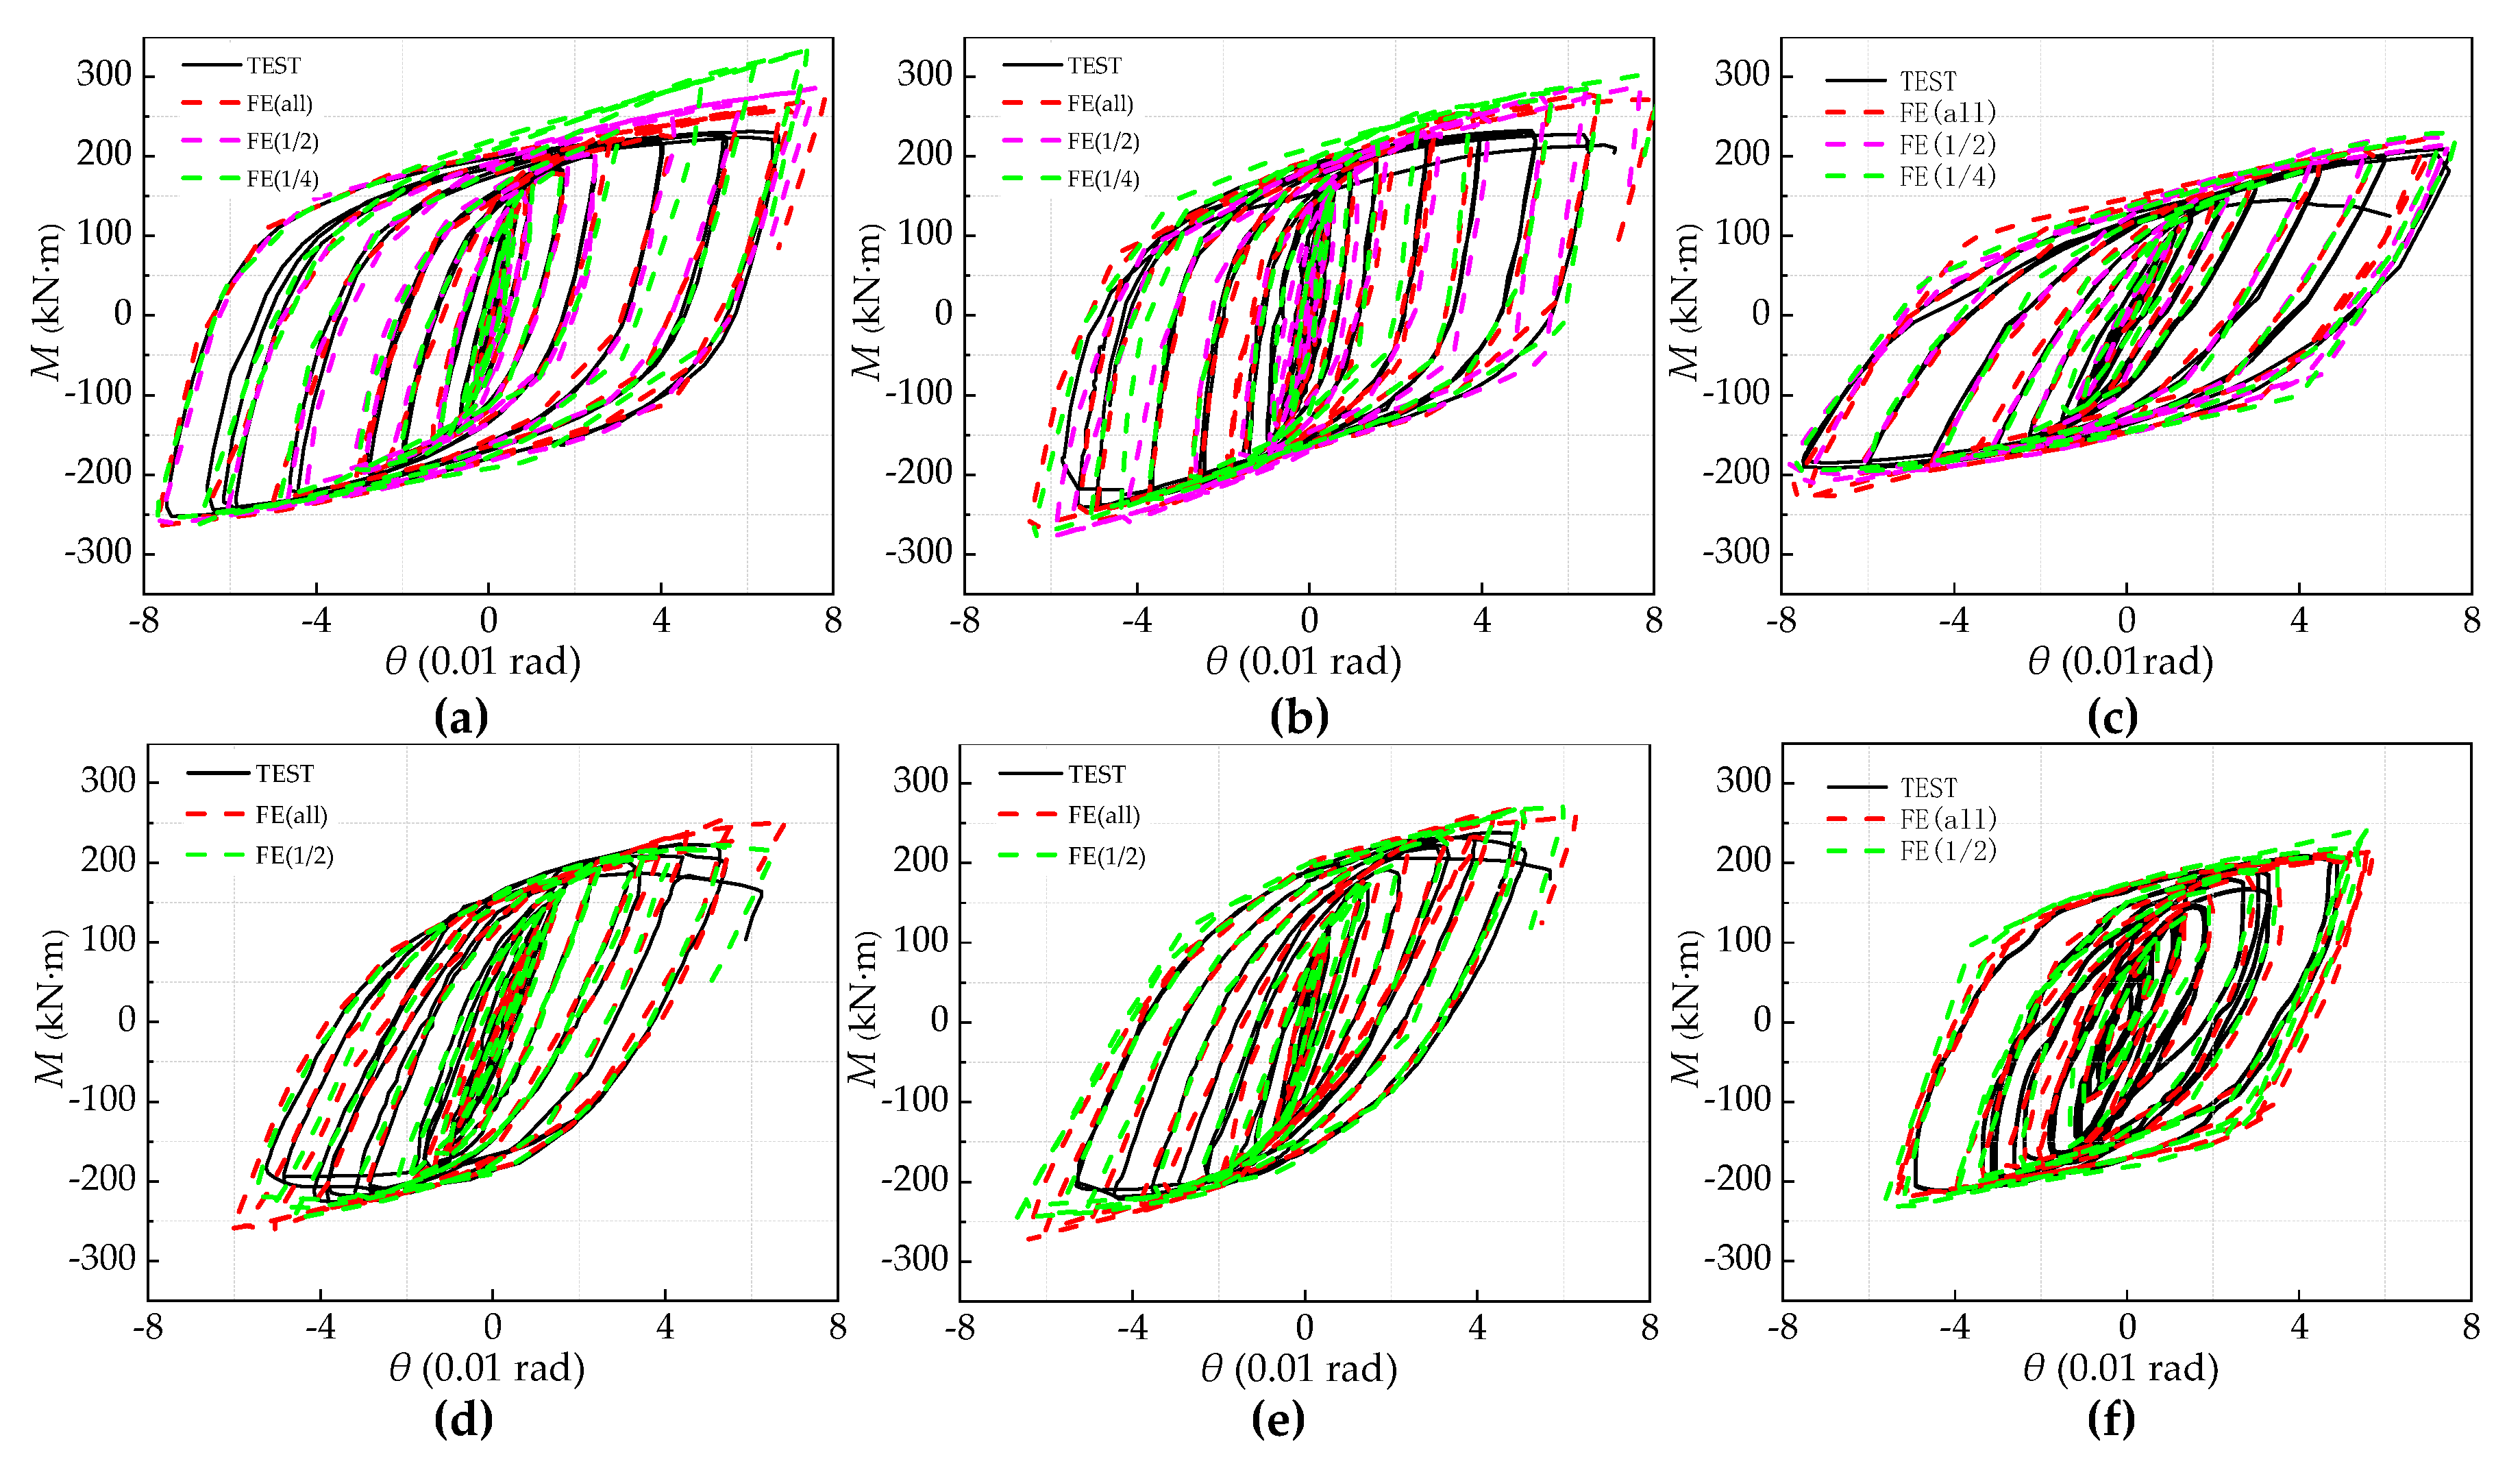
4. Finite Element Analysis and Test Result Comparison
5. Parametric Research
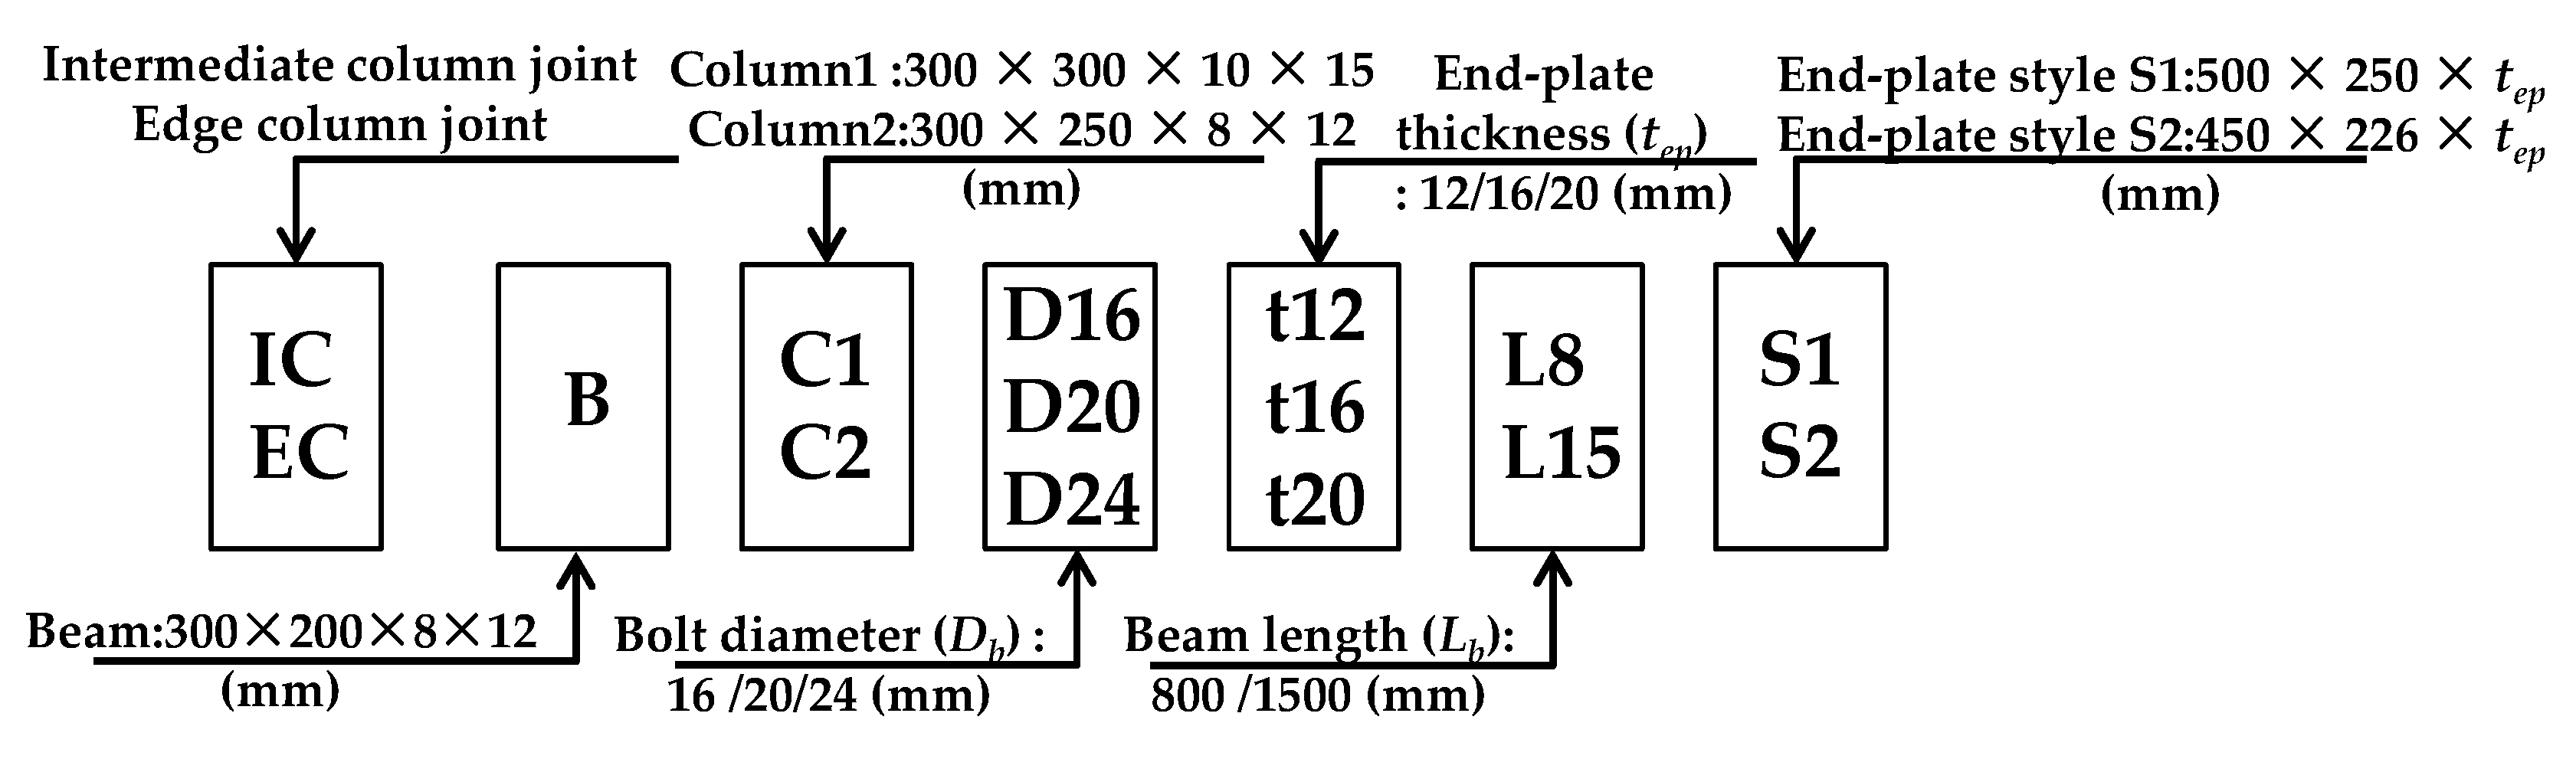
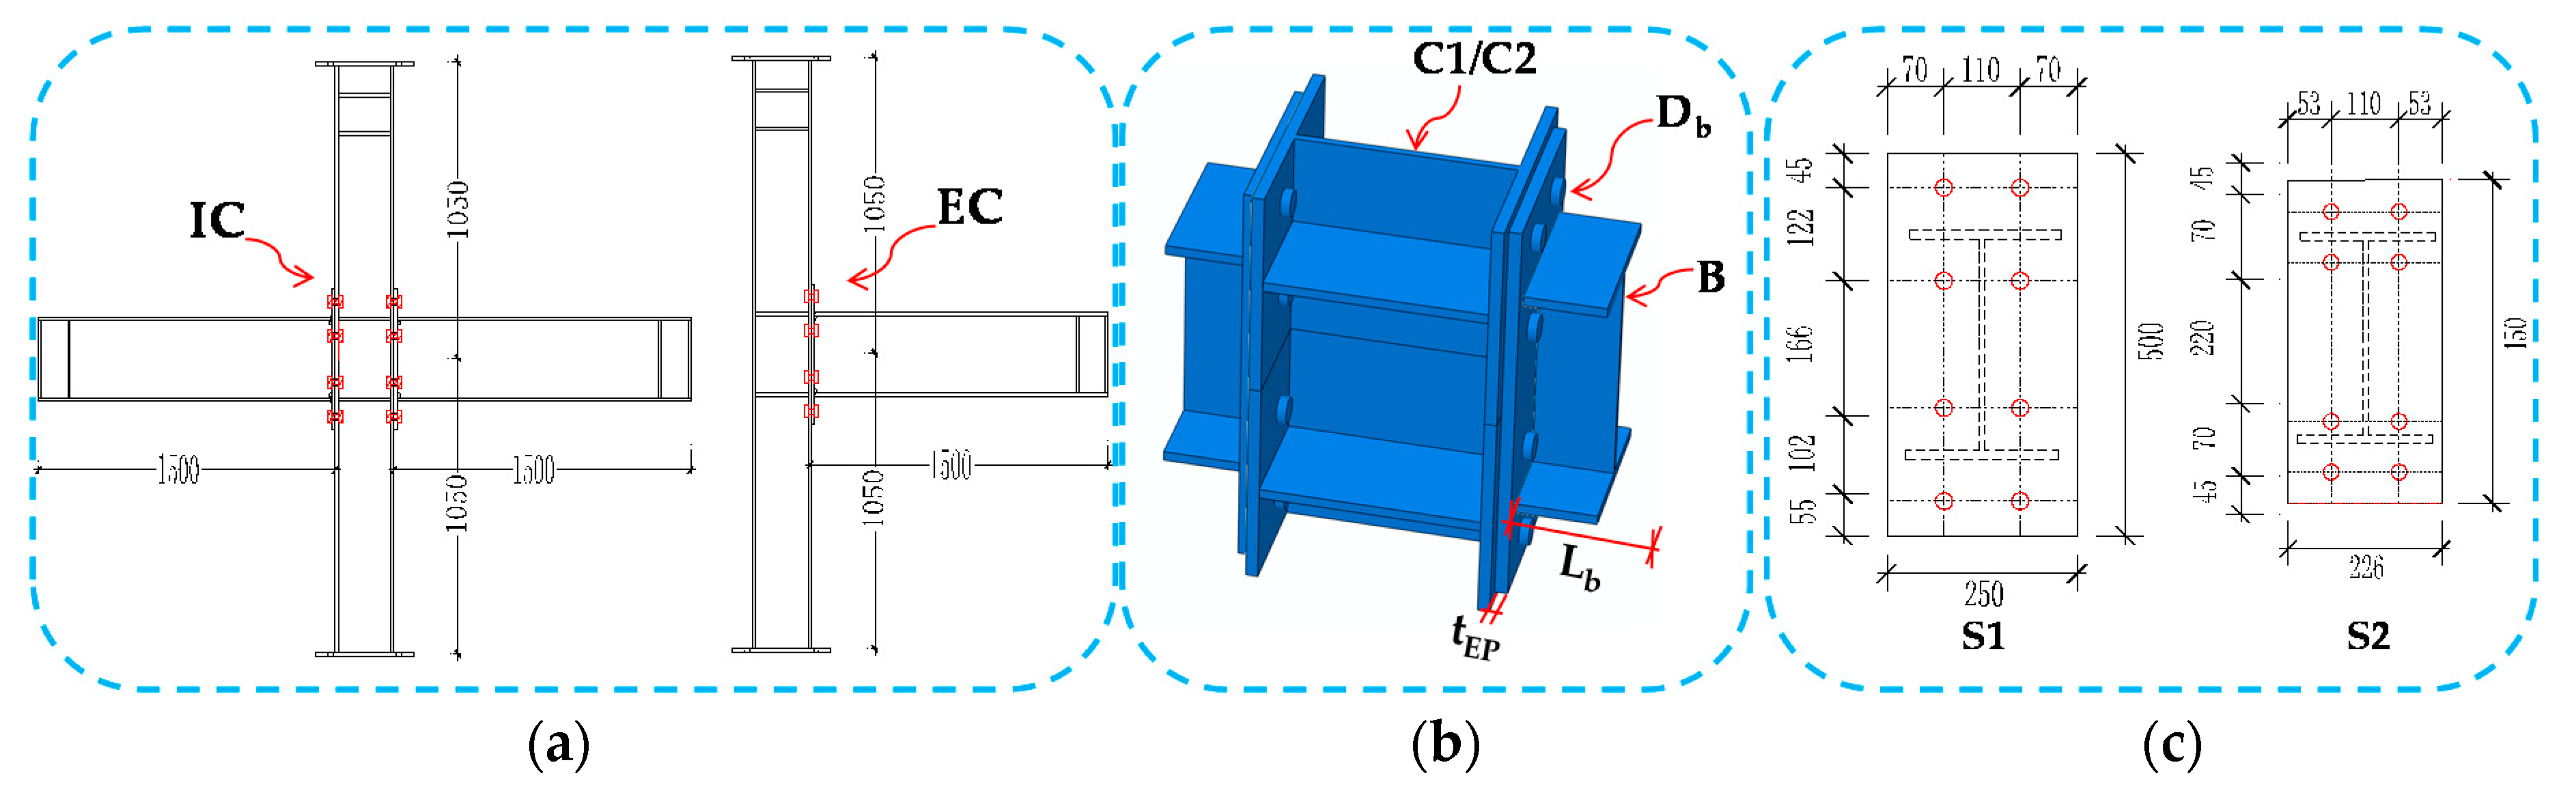
5.1. Model Description
5.2. Results and Discussion
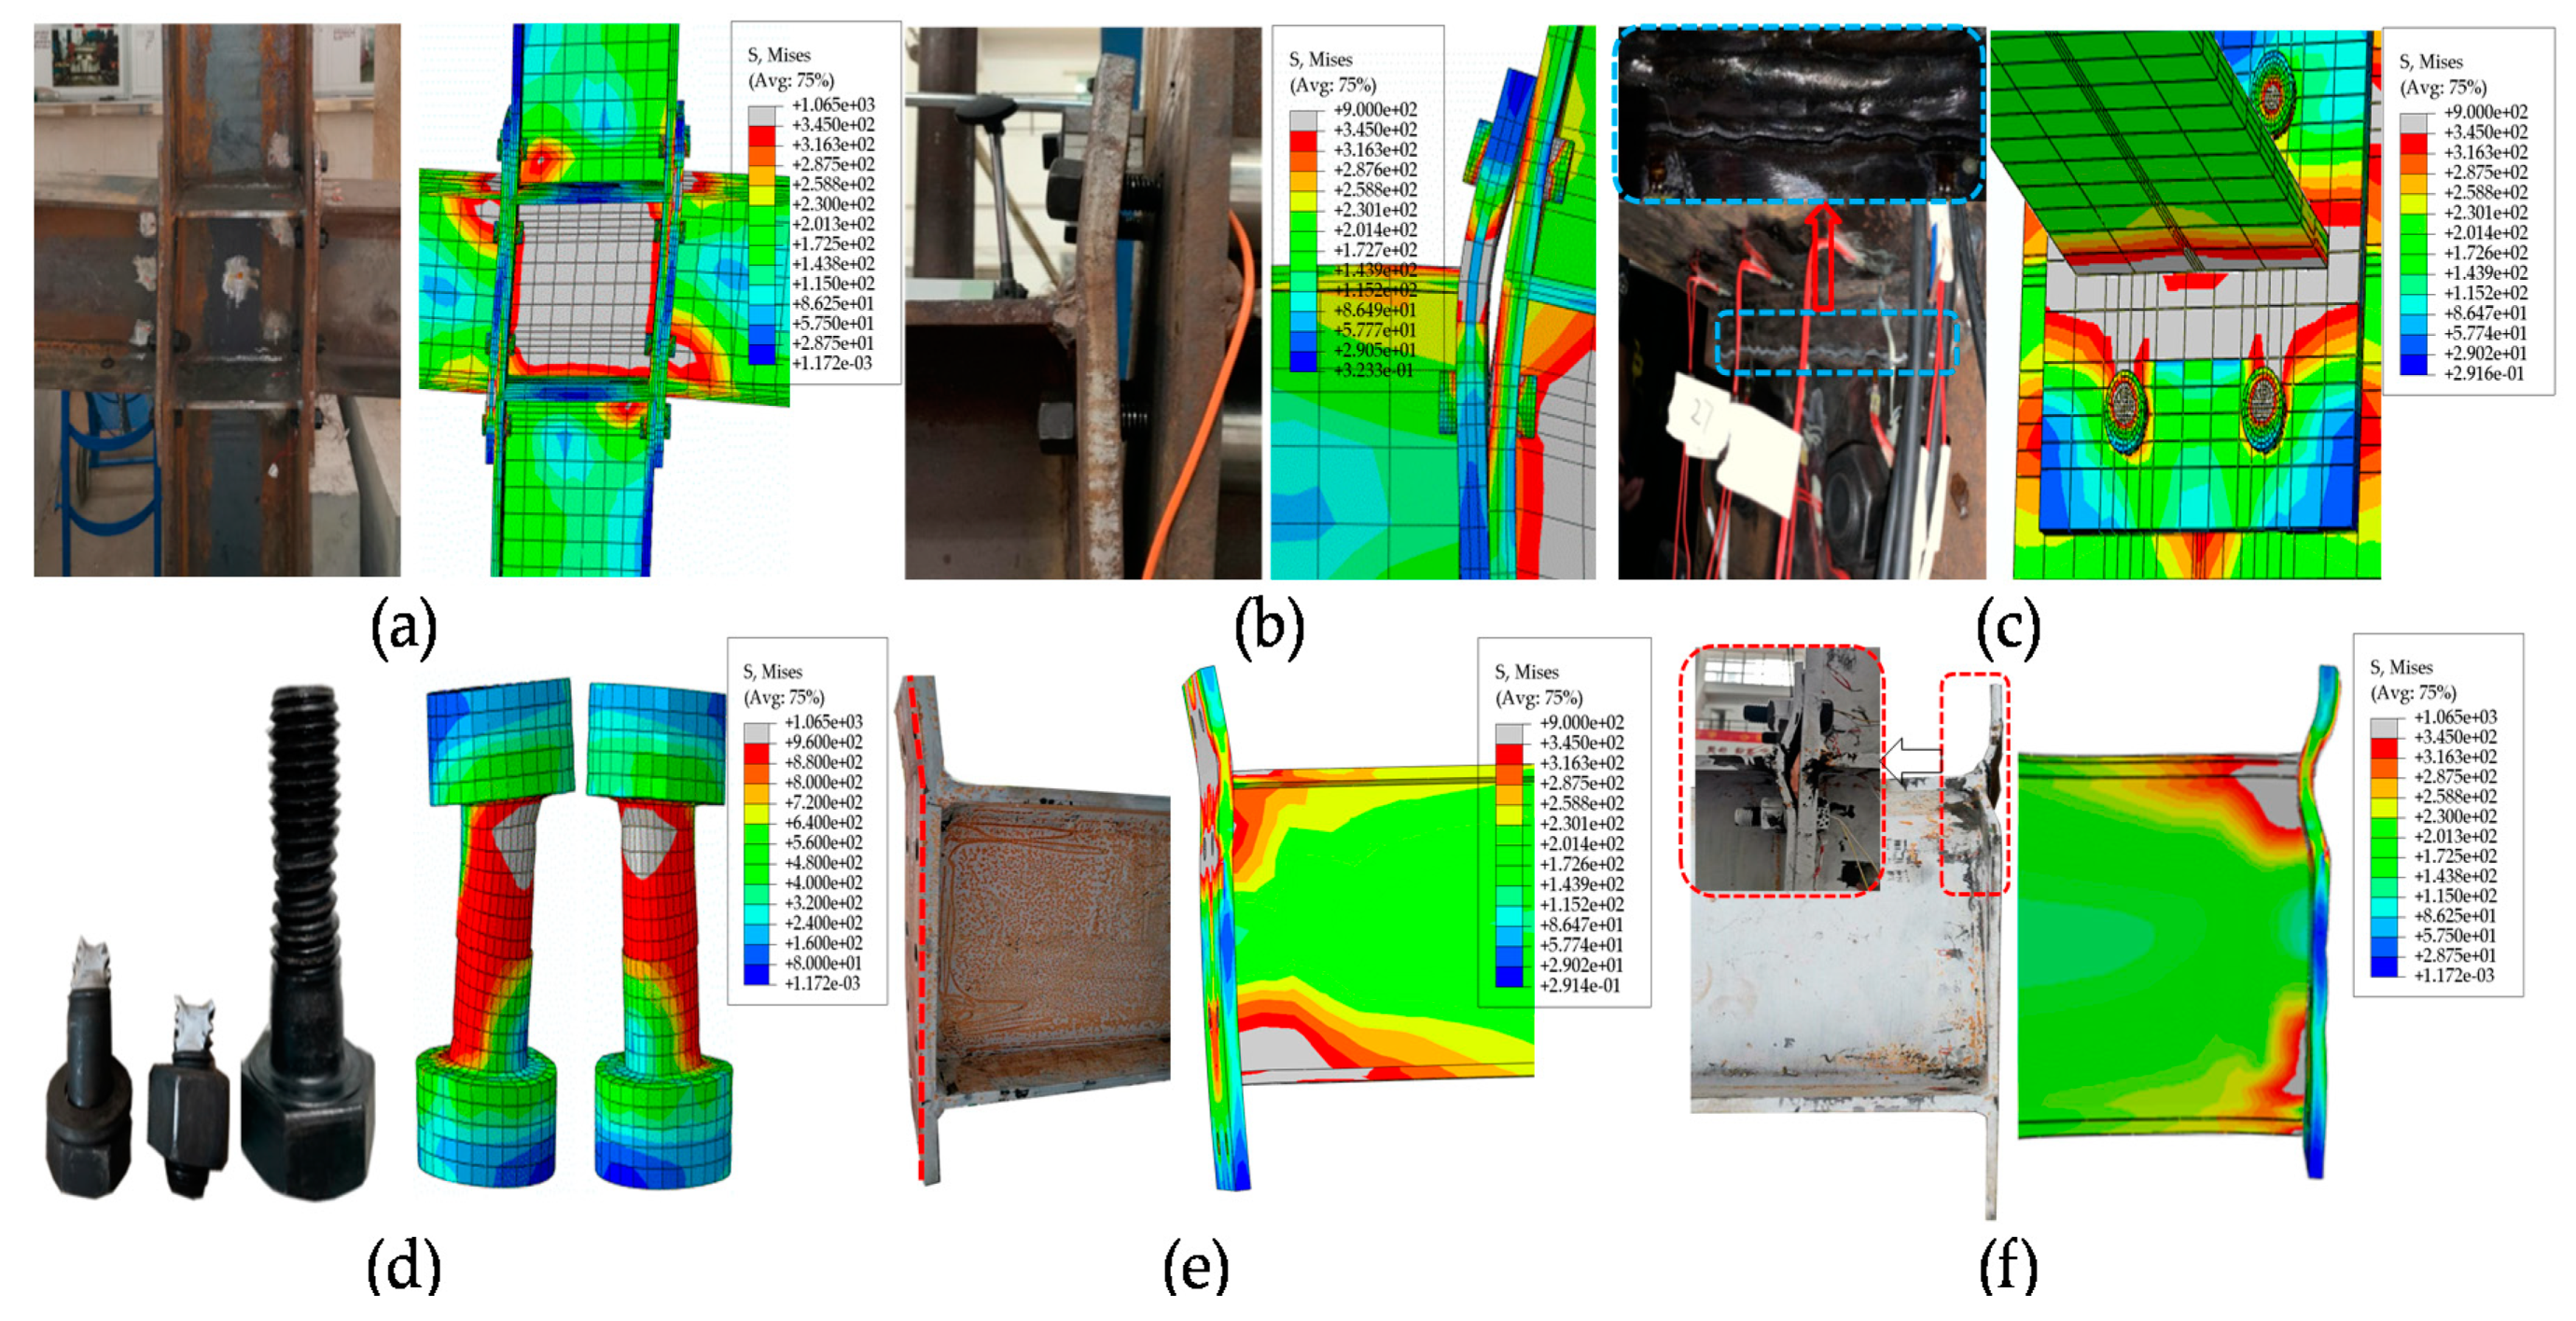
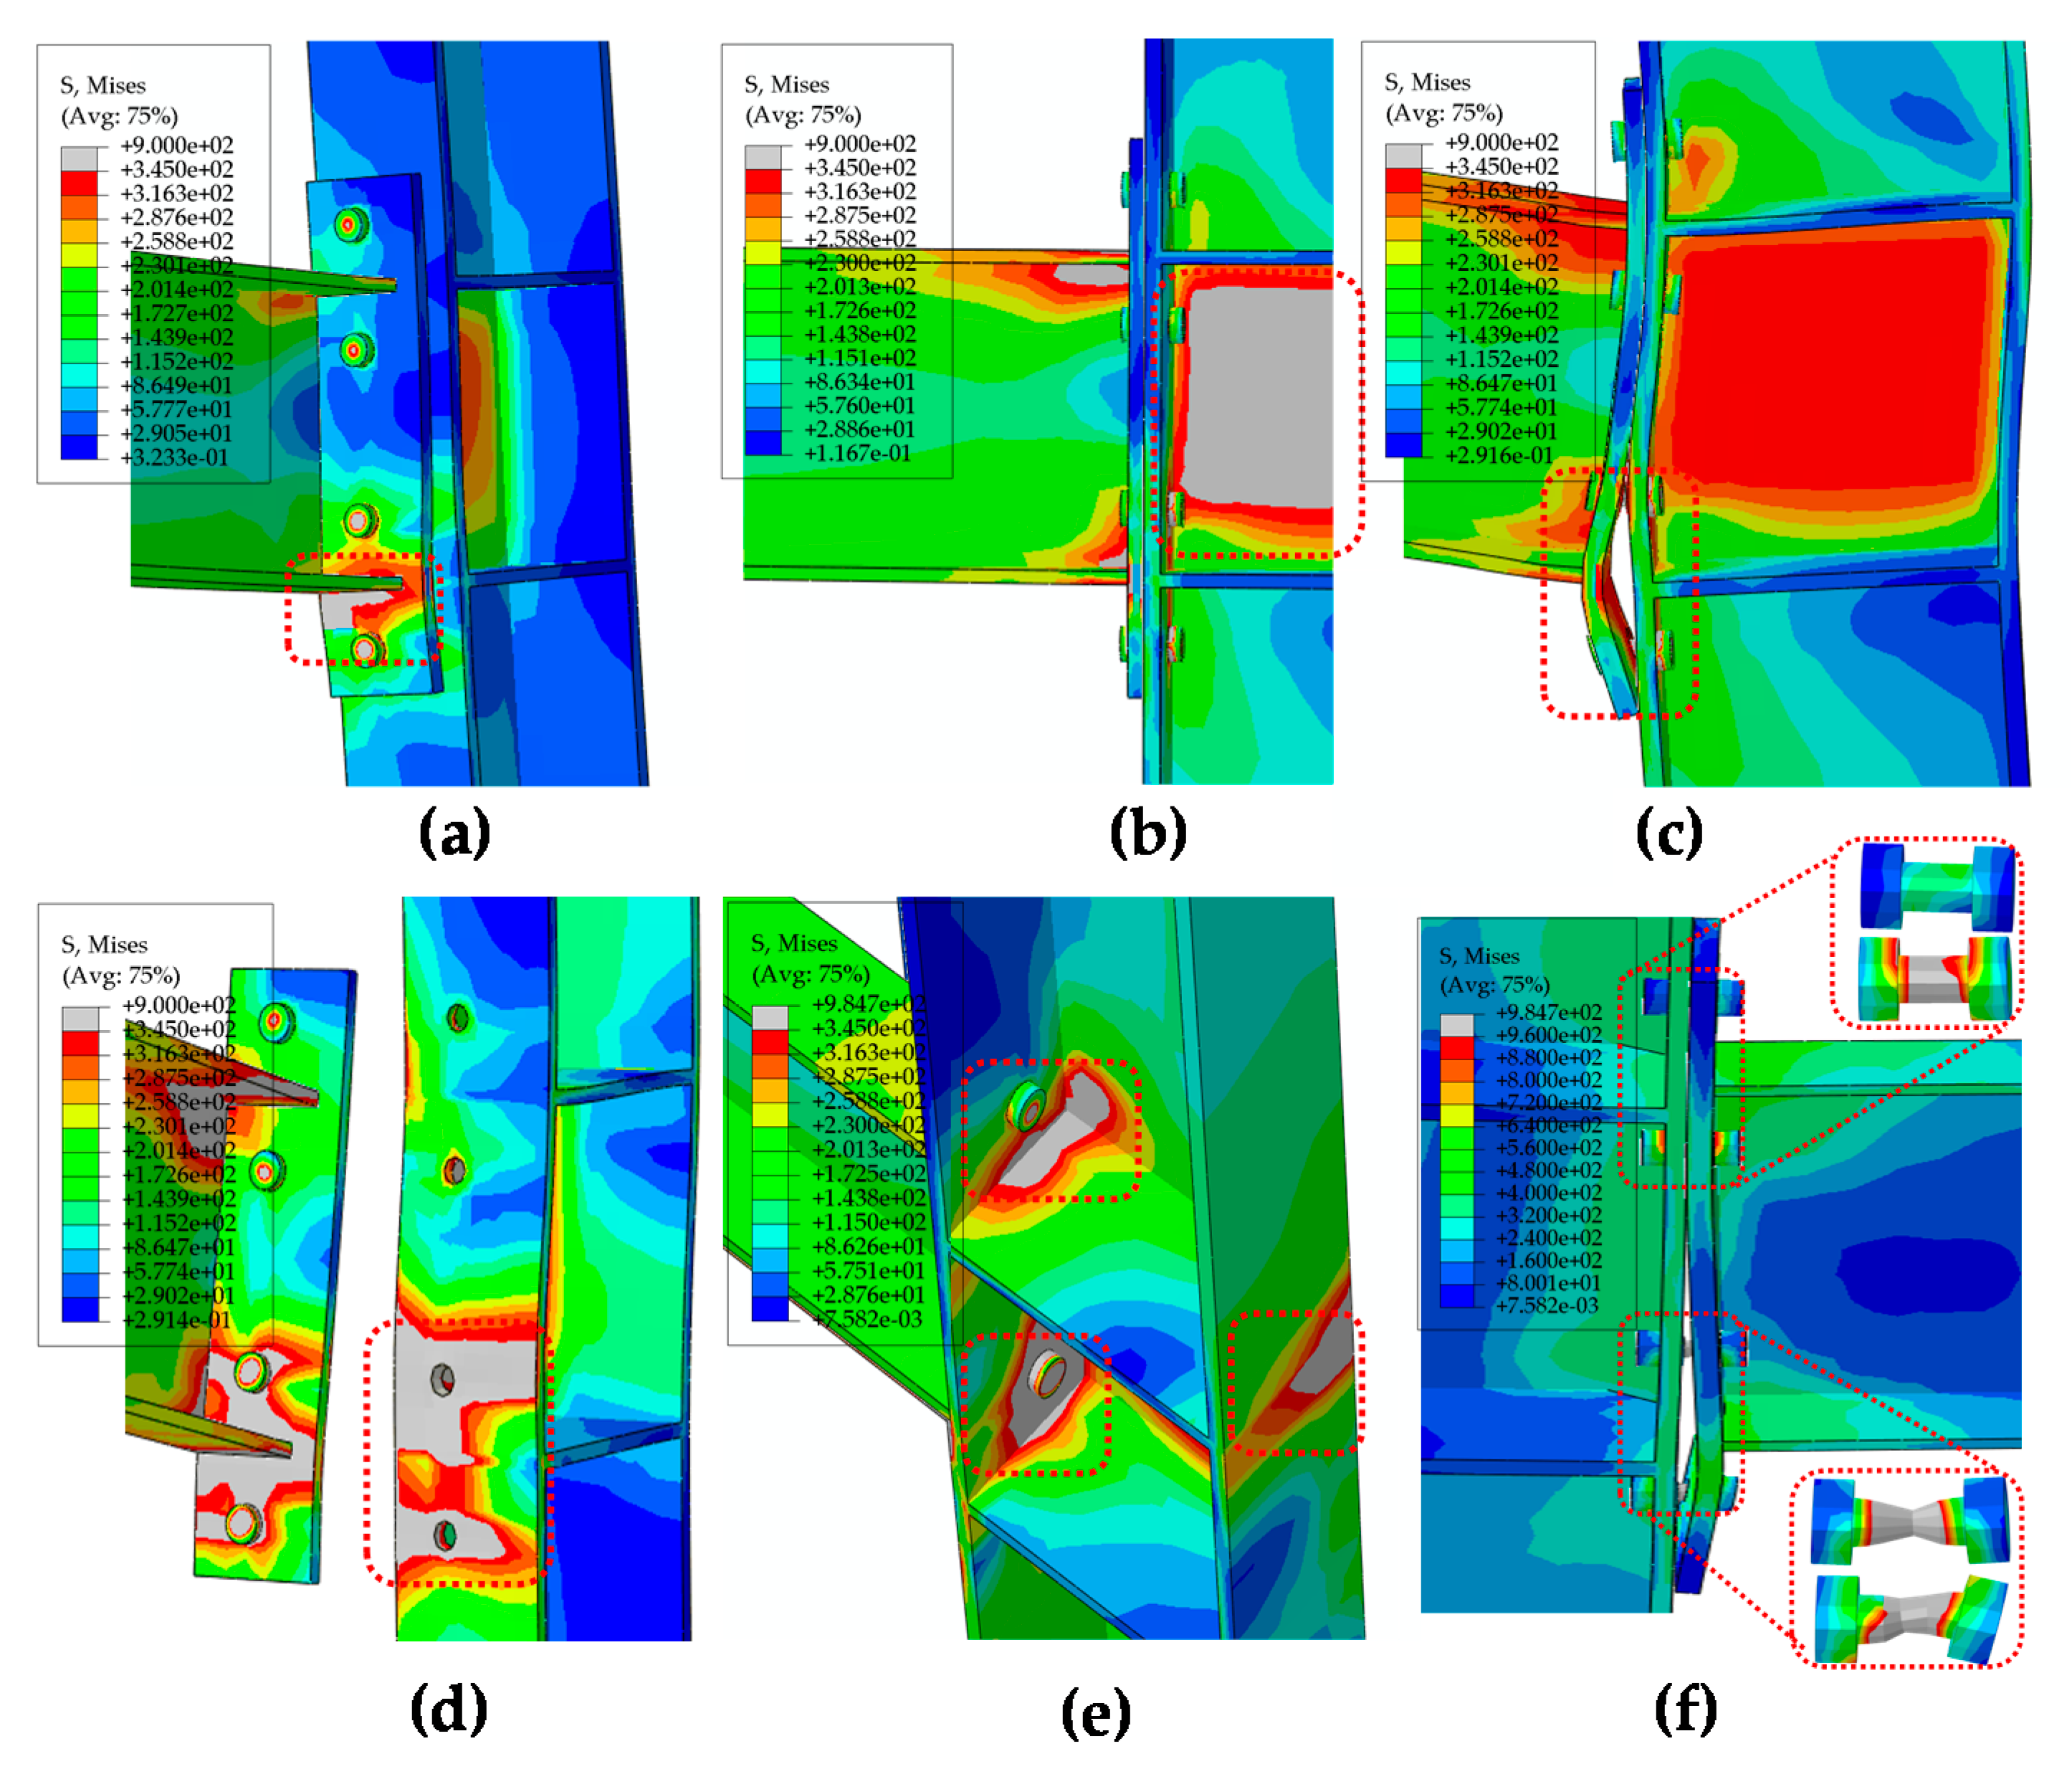
5.2.1. Failure Modes
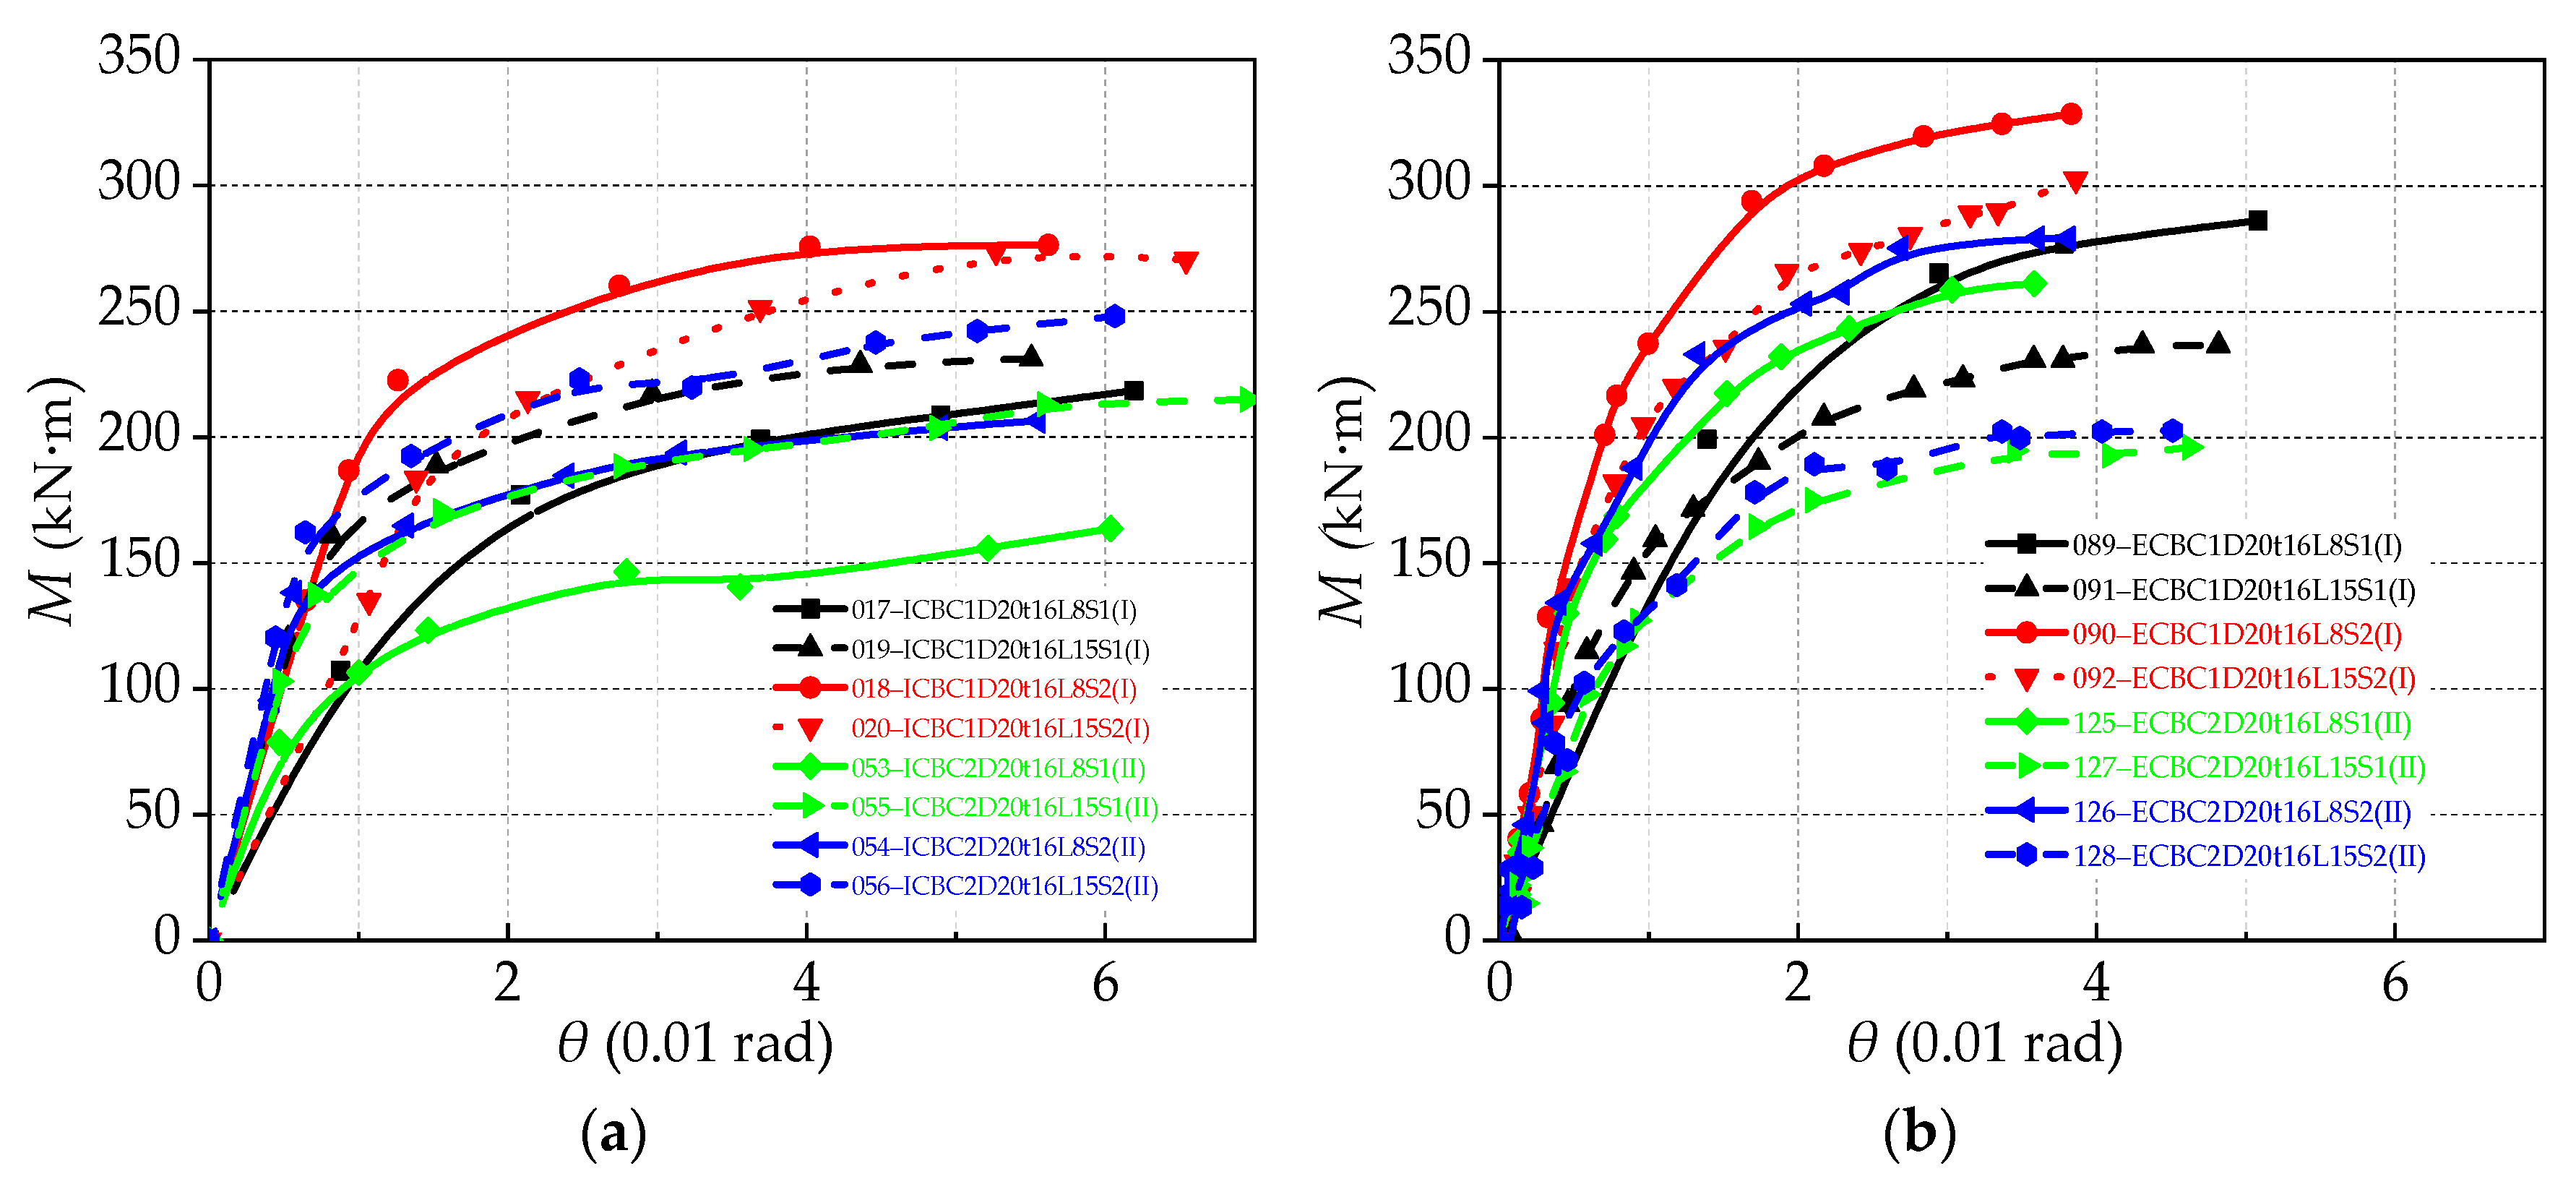
5.2.2. Effect of Shear and Column Size
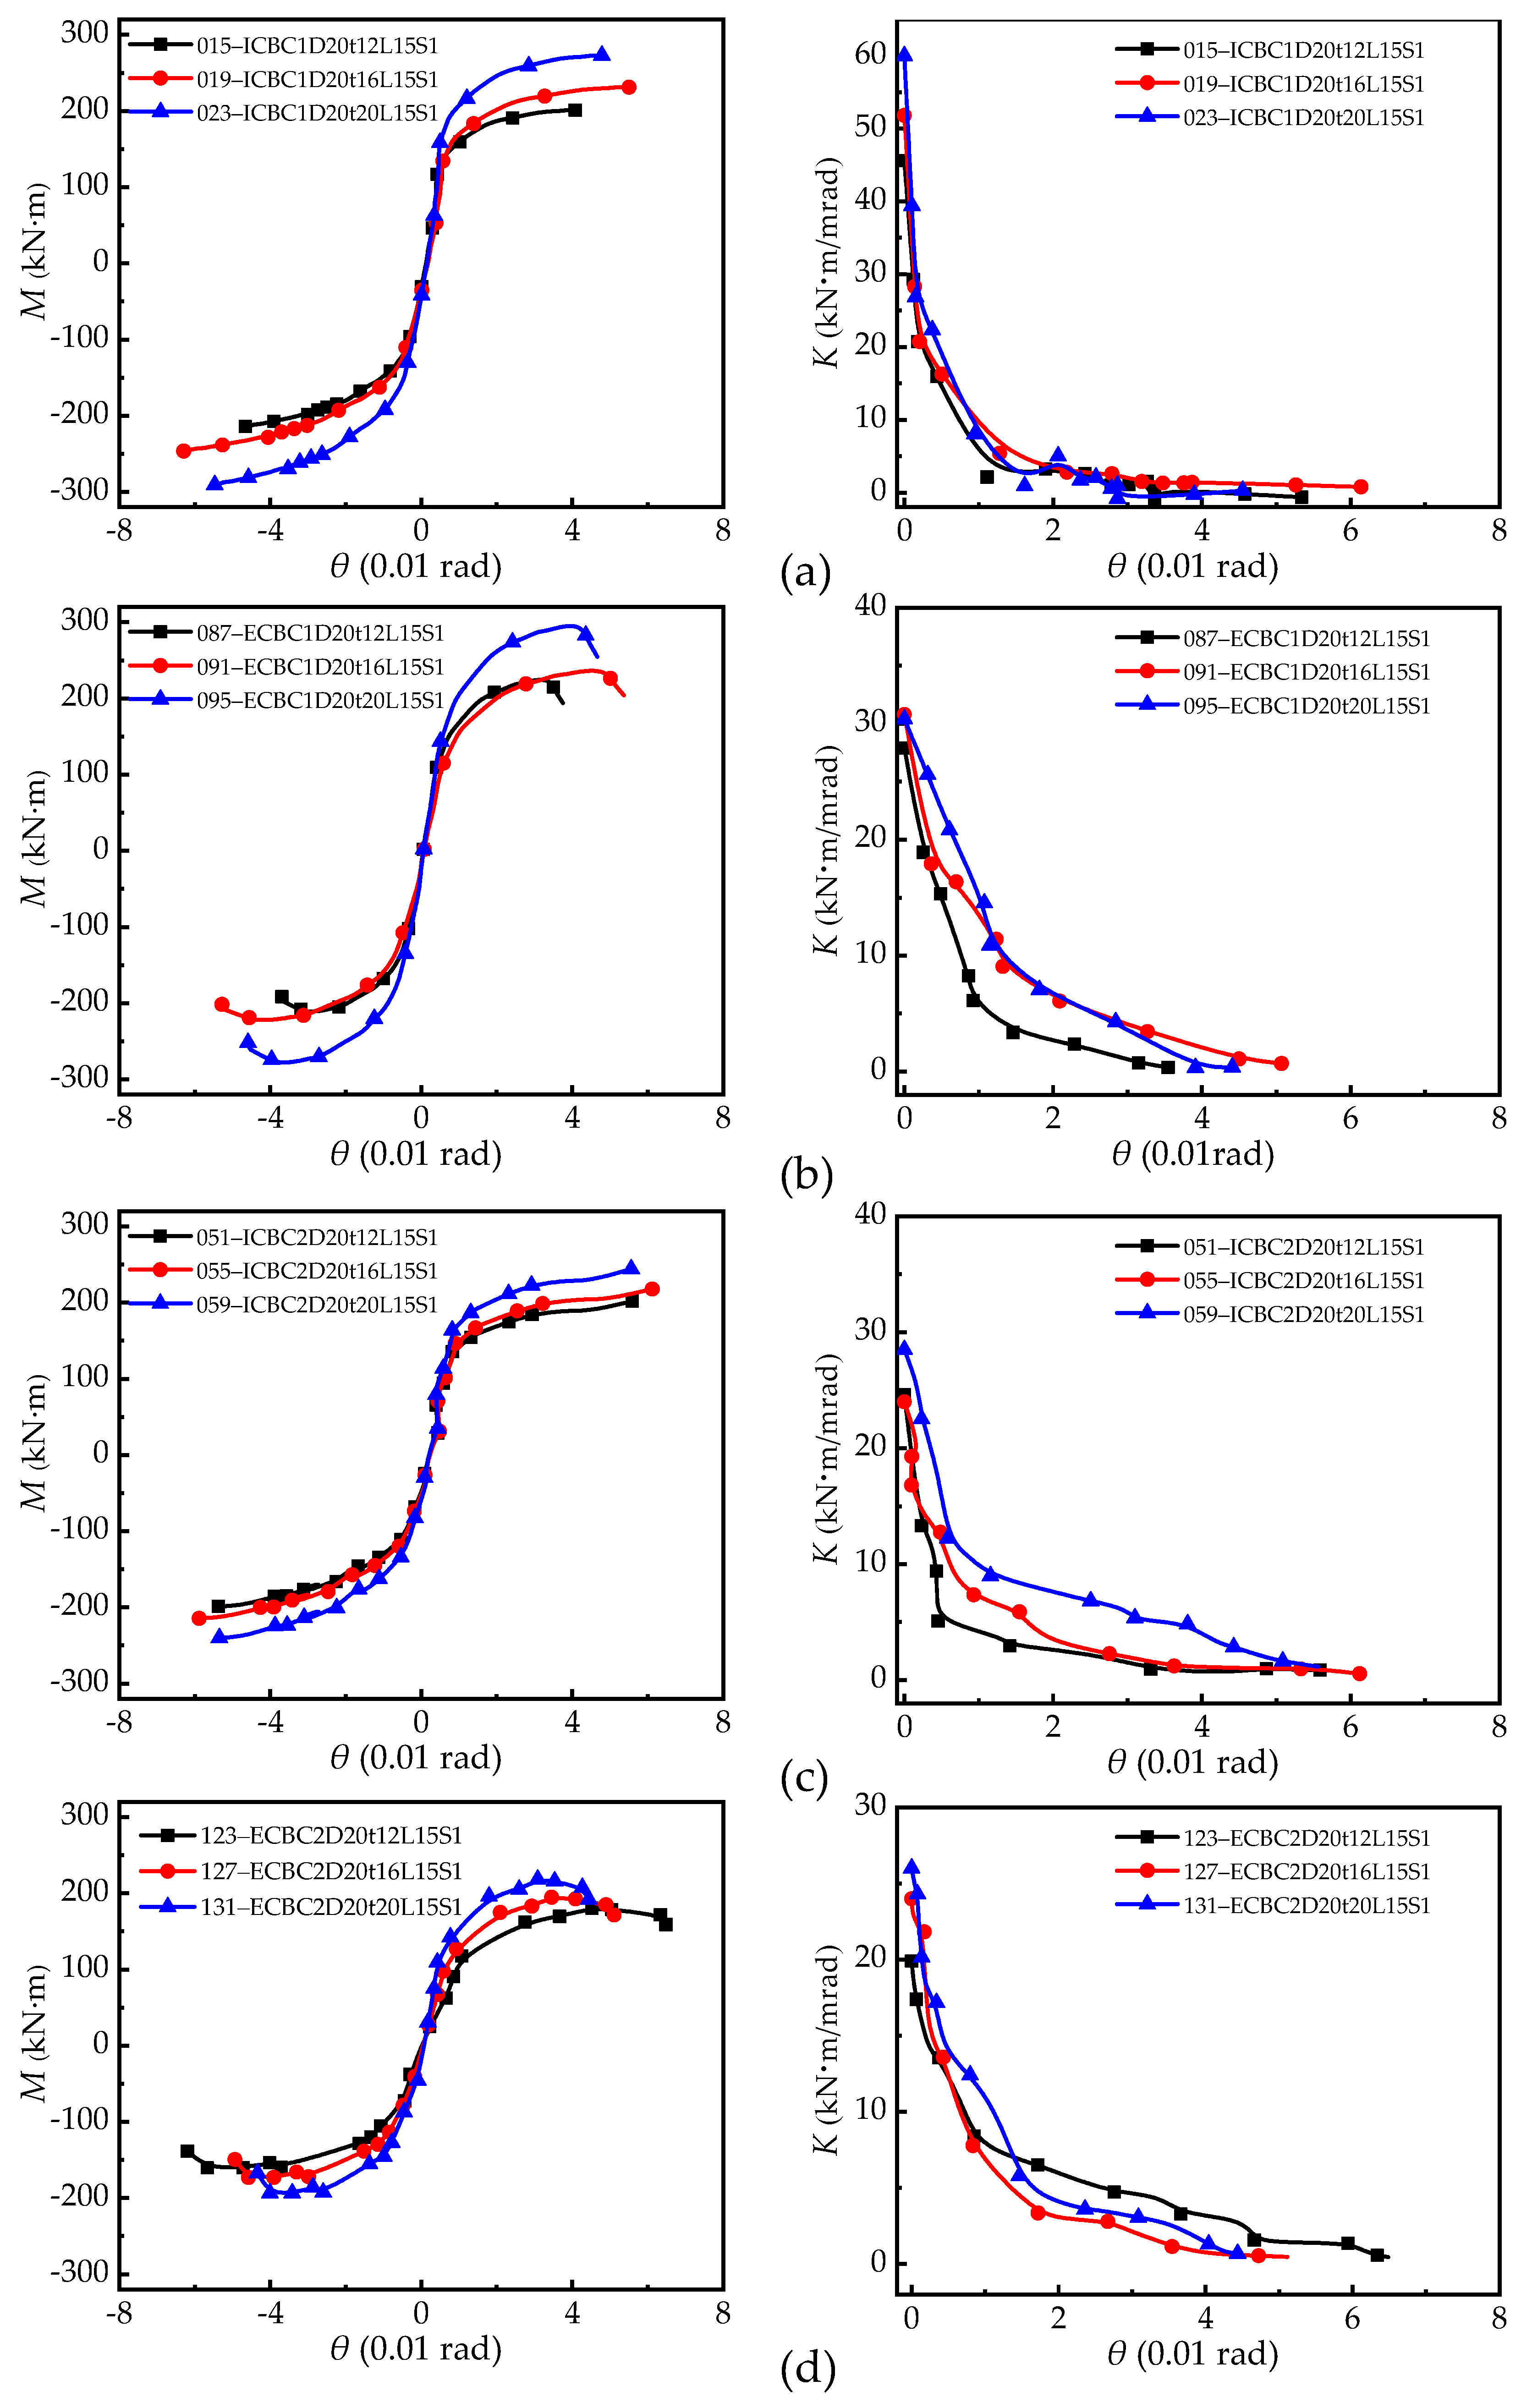
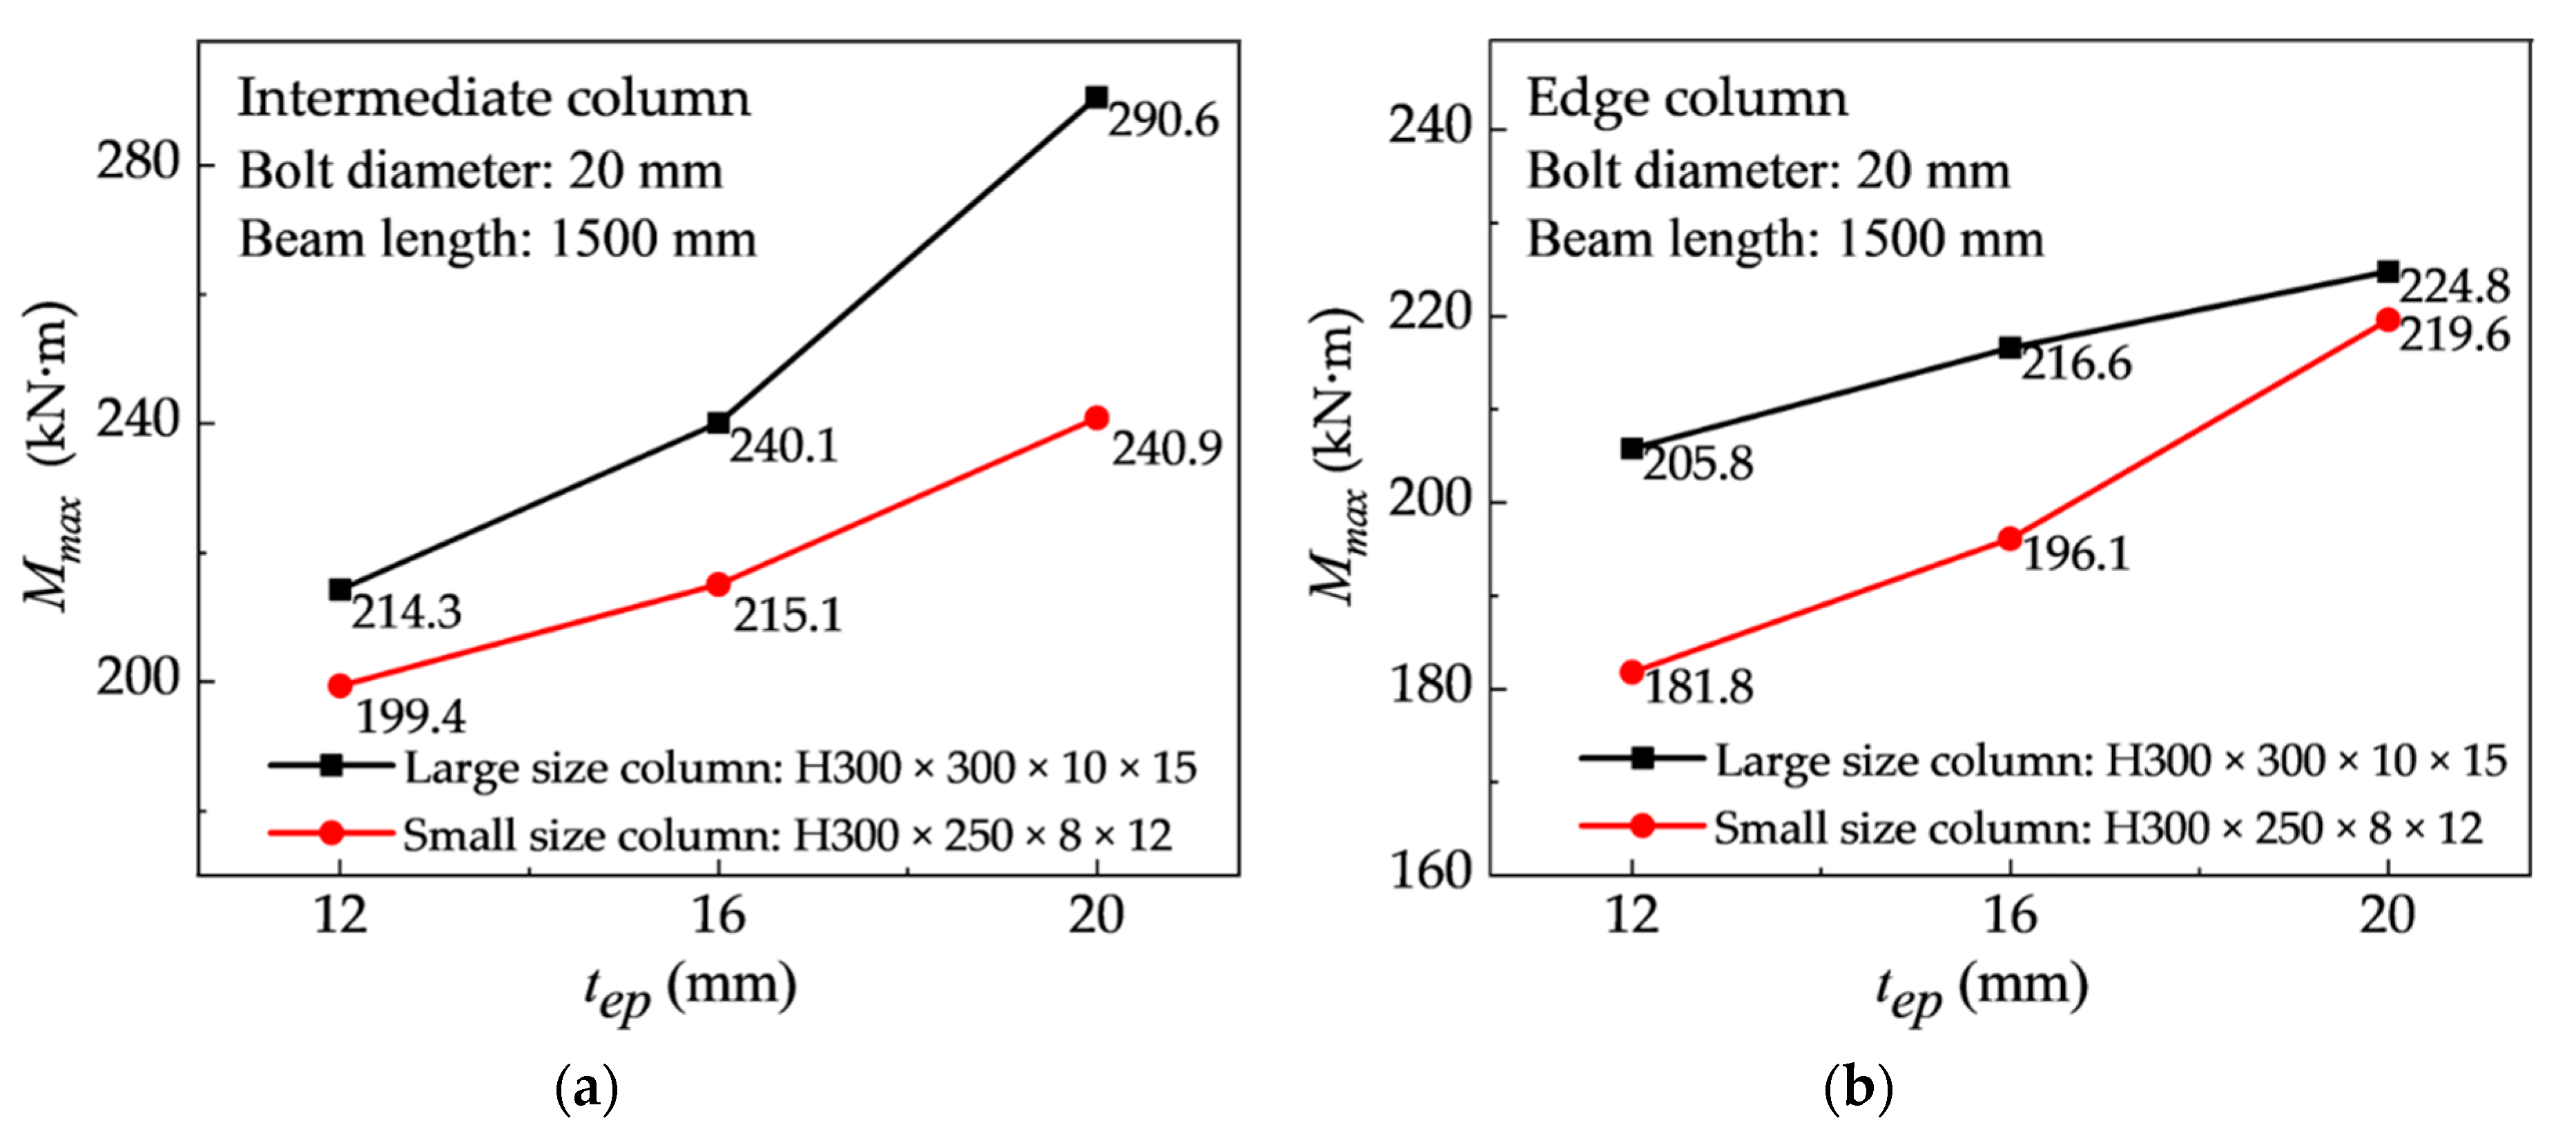
5.2.3. Effect of End-Plate Thickness
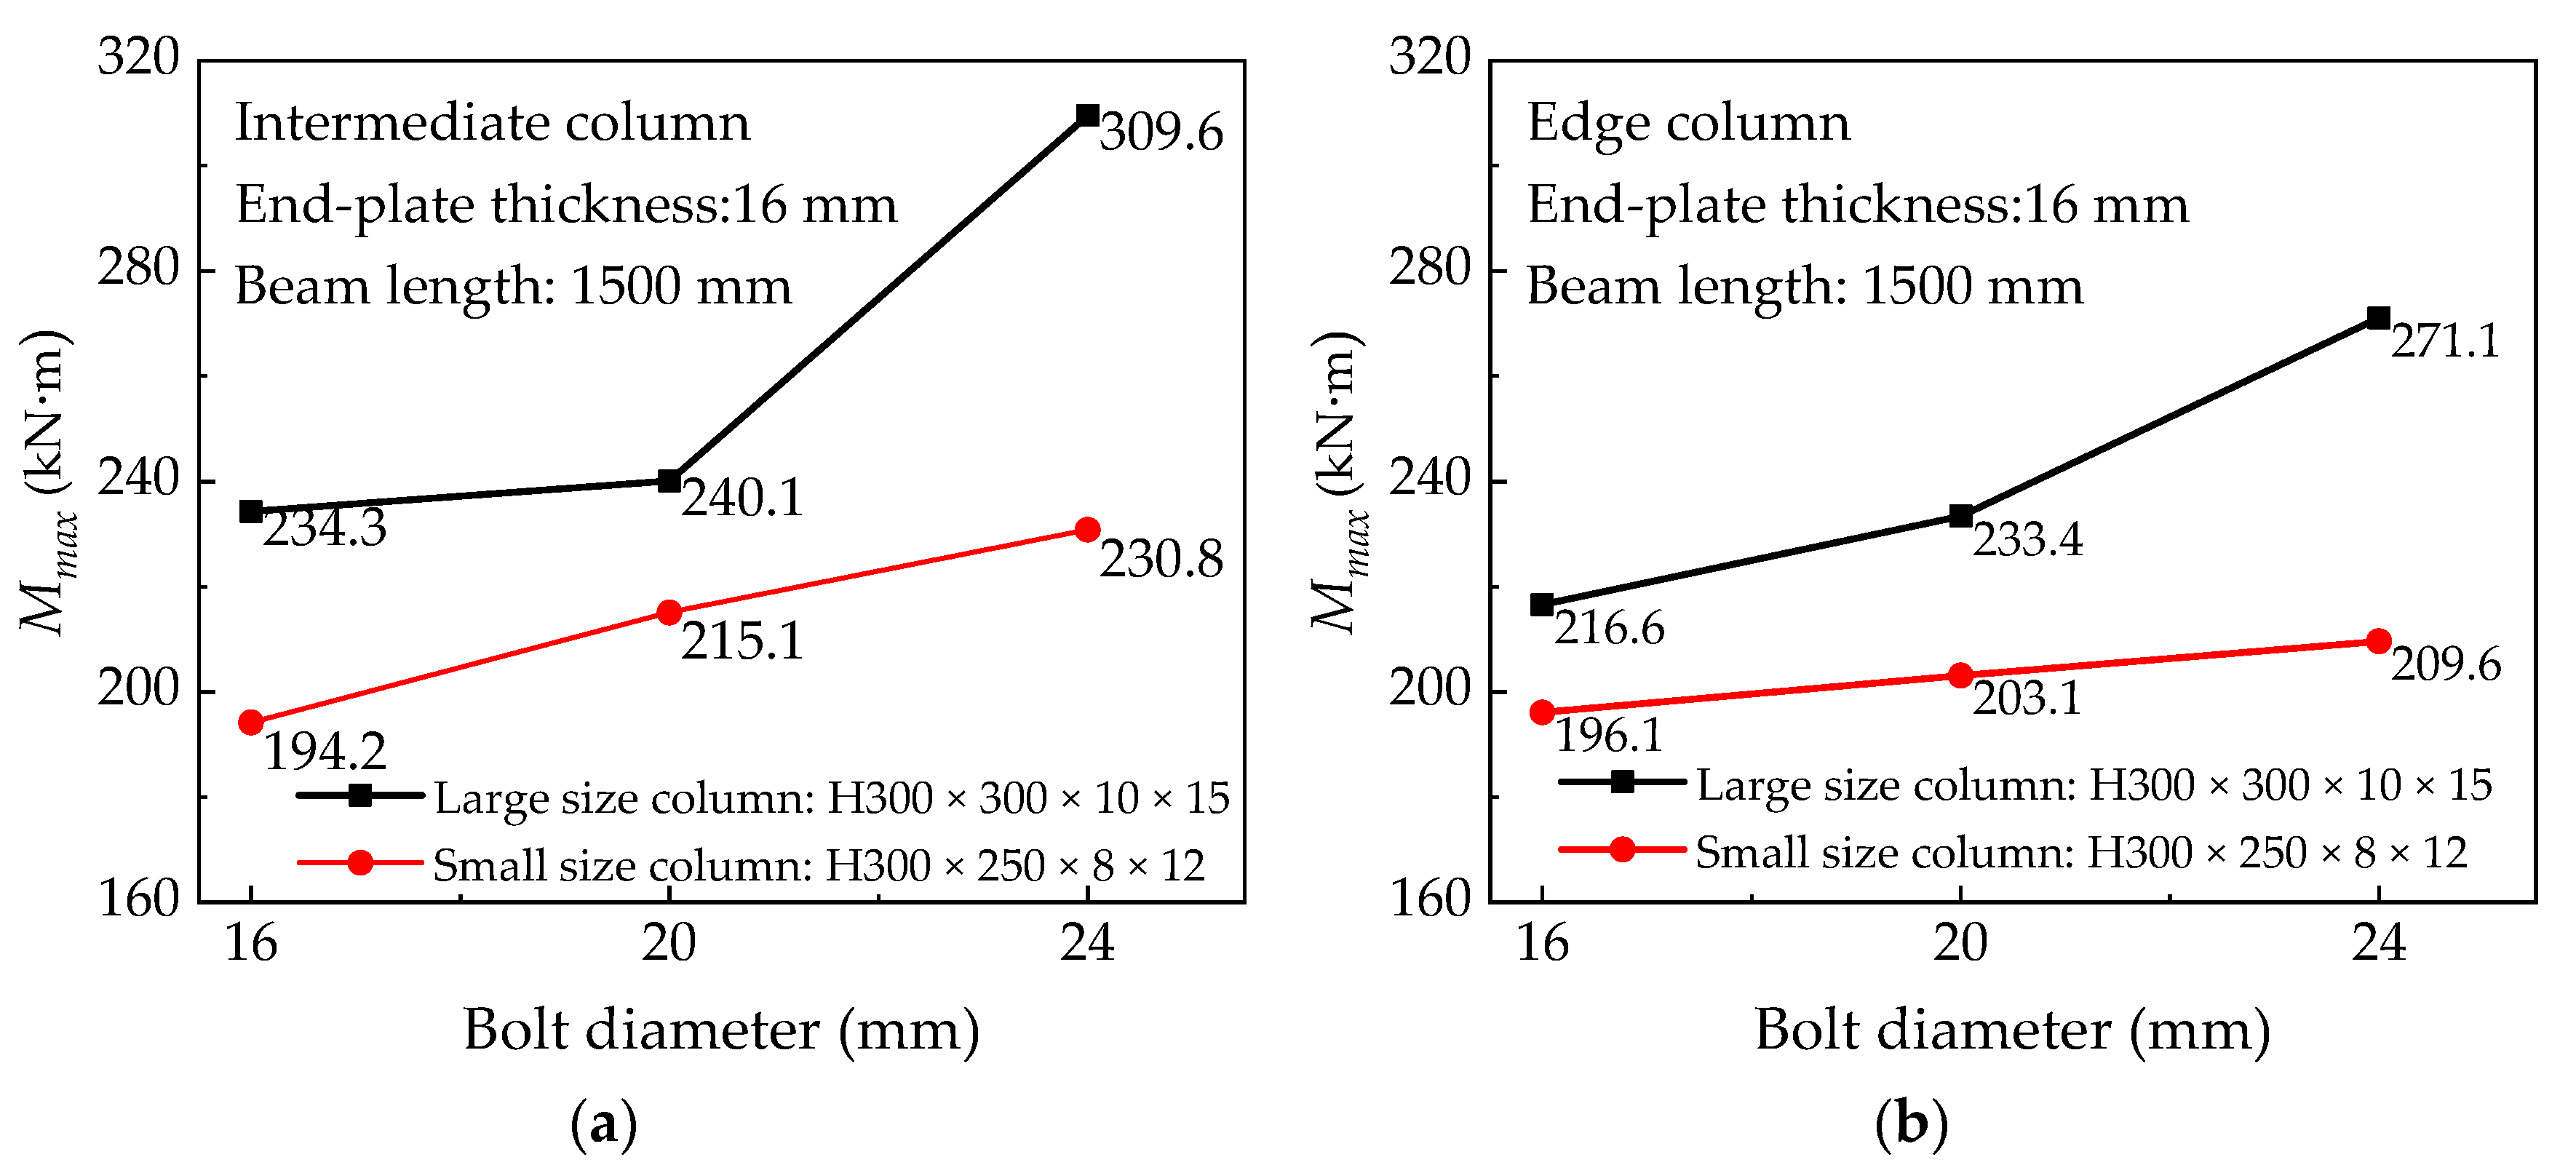
5.2.4. Effect of Bolt Diameter
5.2.5. Effect of End-Plate Section Size
5.2.6. Differences between IC Joint and EC Joint
6. Research on the Initial Stiffness of Connection
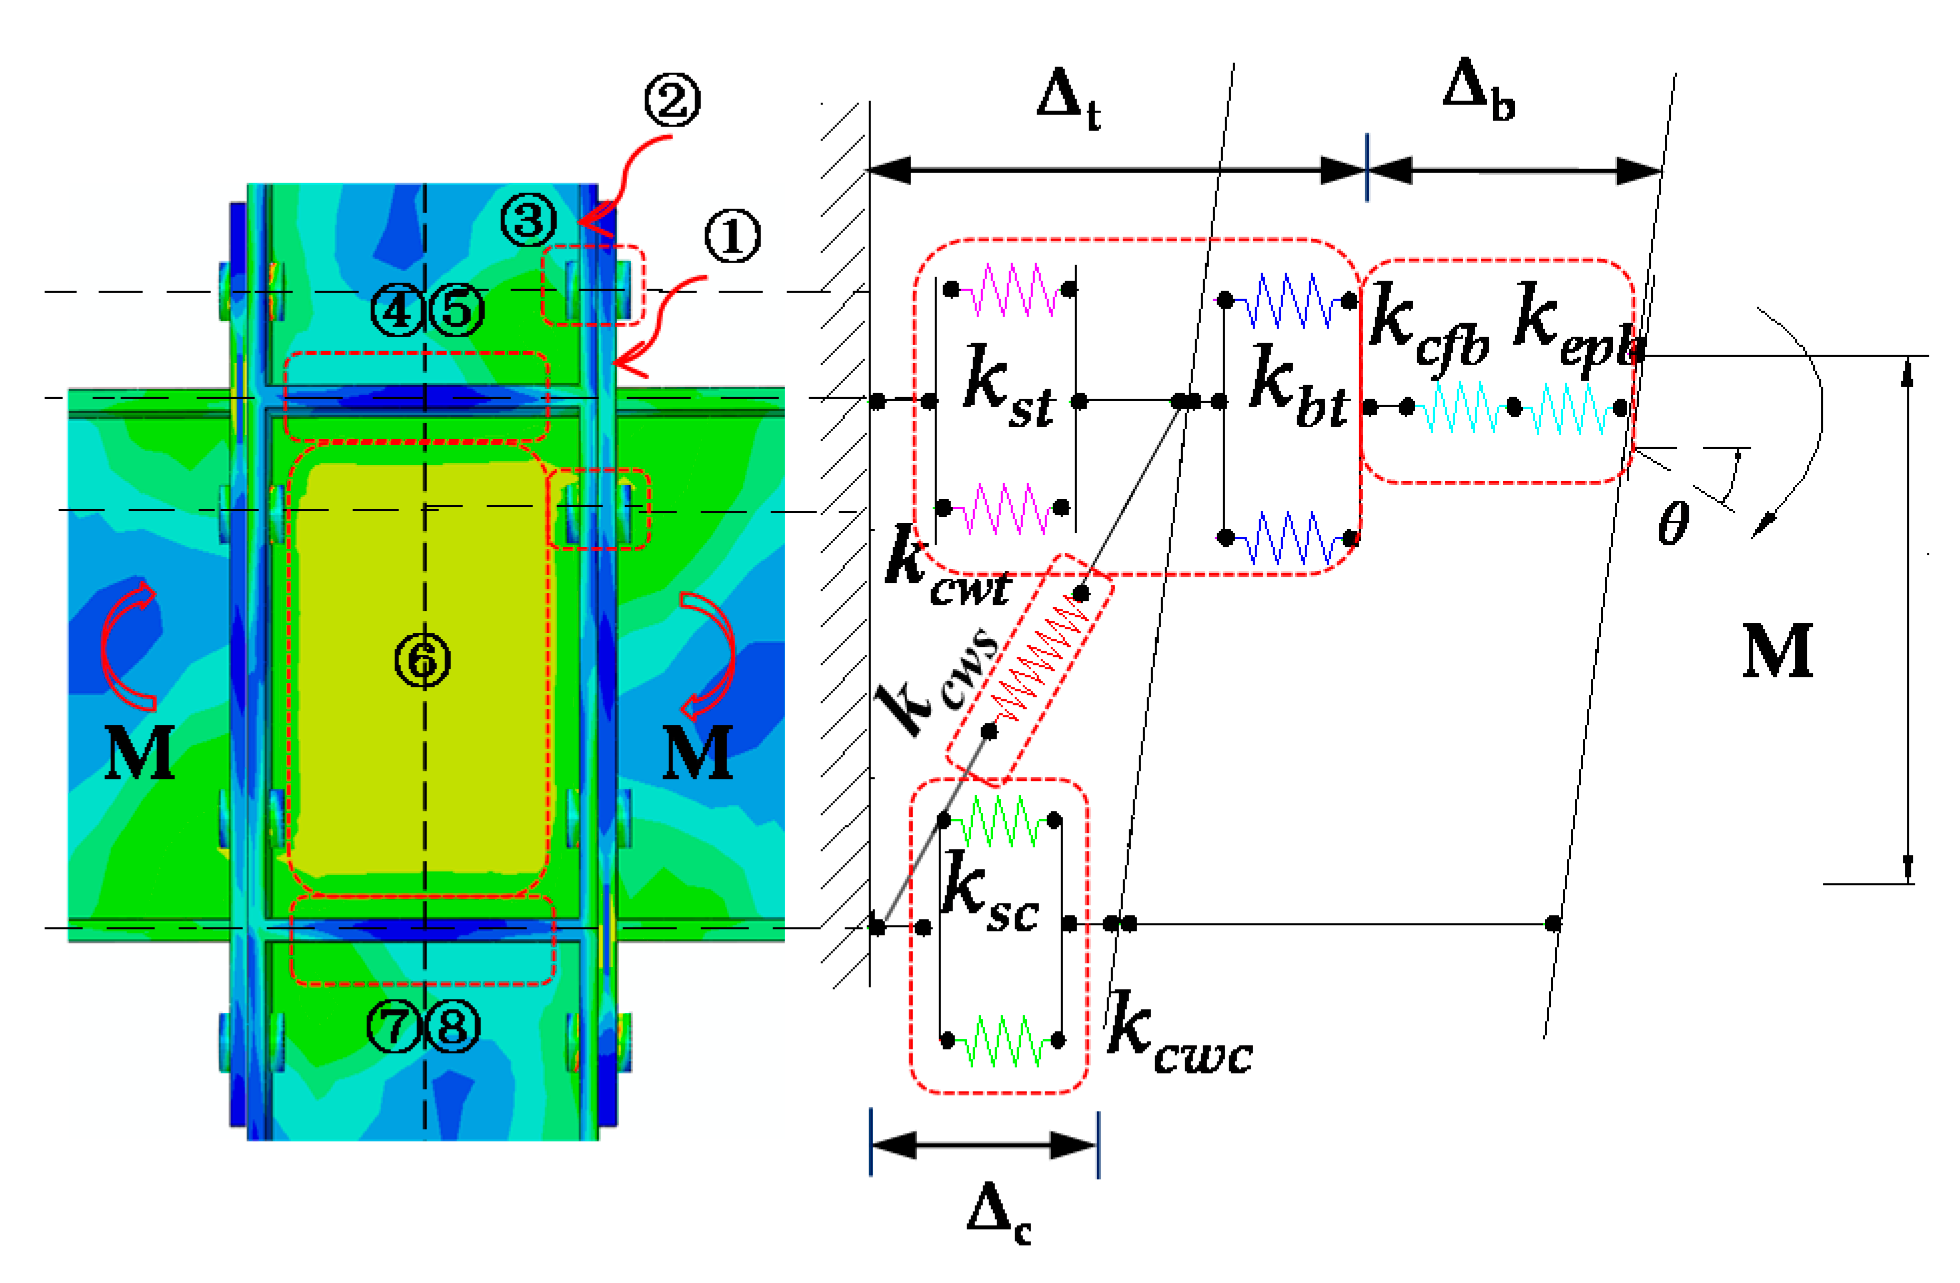
6.1. Mechanical Model of the Initial Stiffness
6.2. Calculation of Connection Stiffness
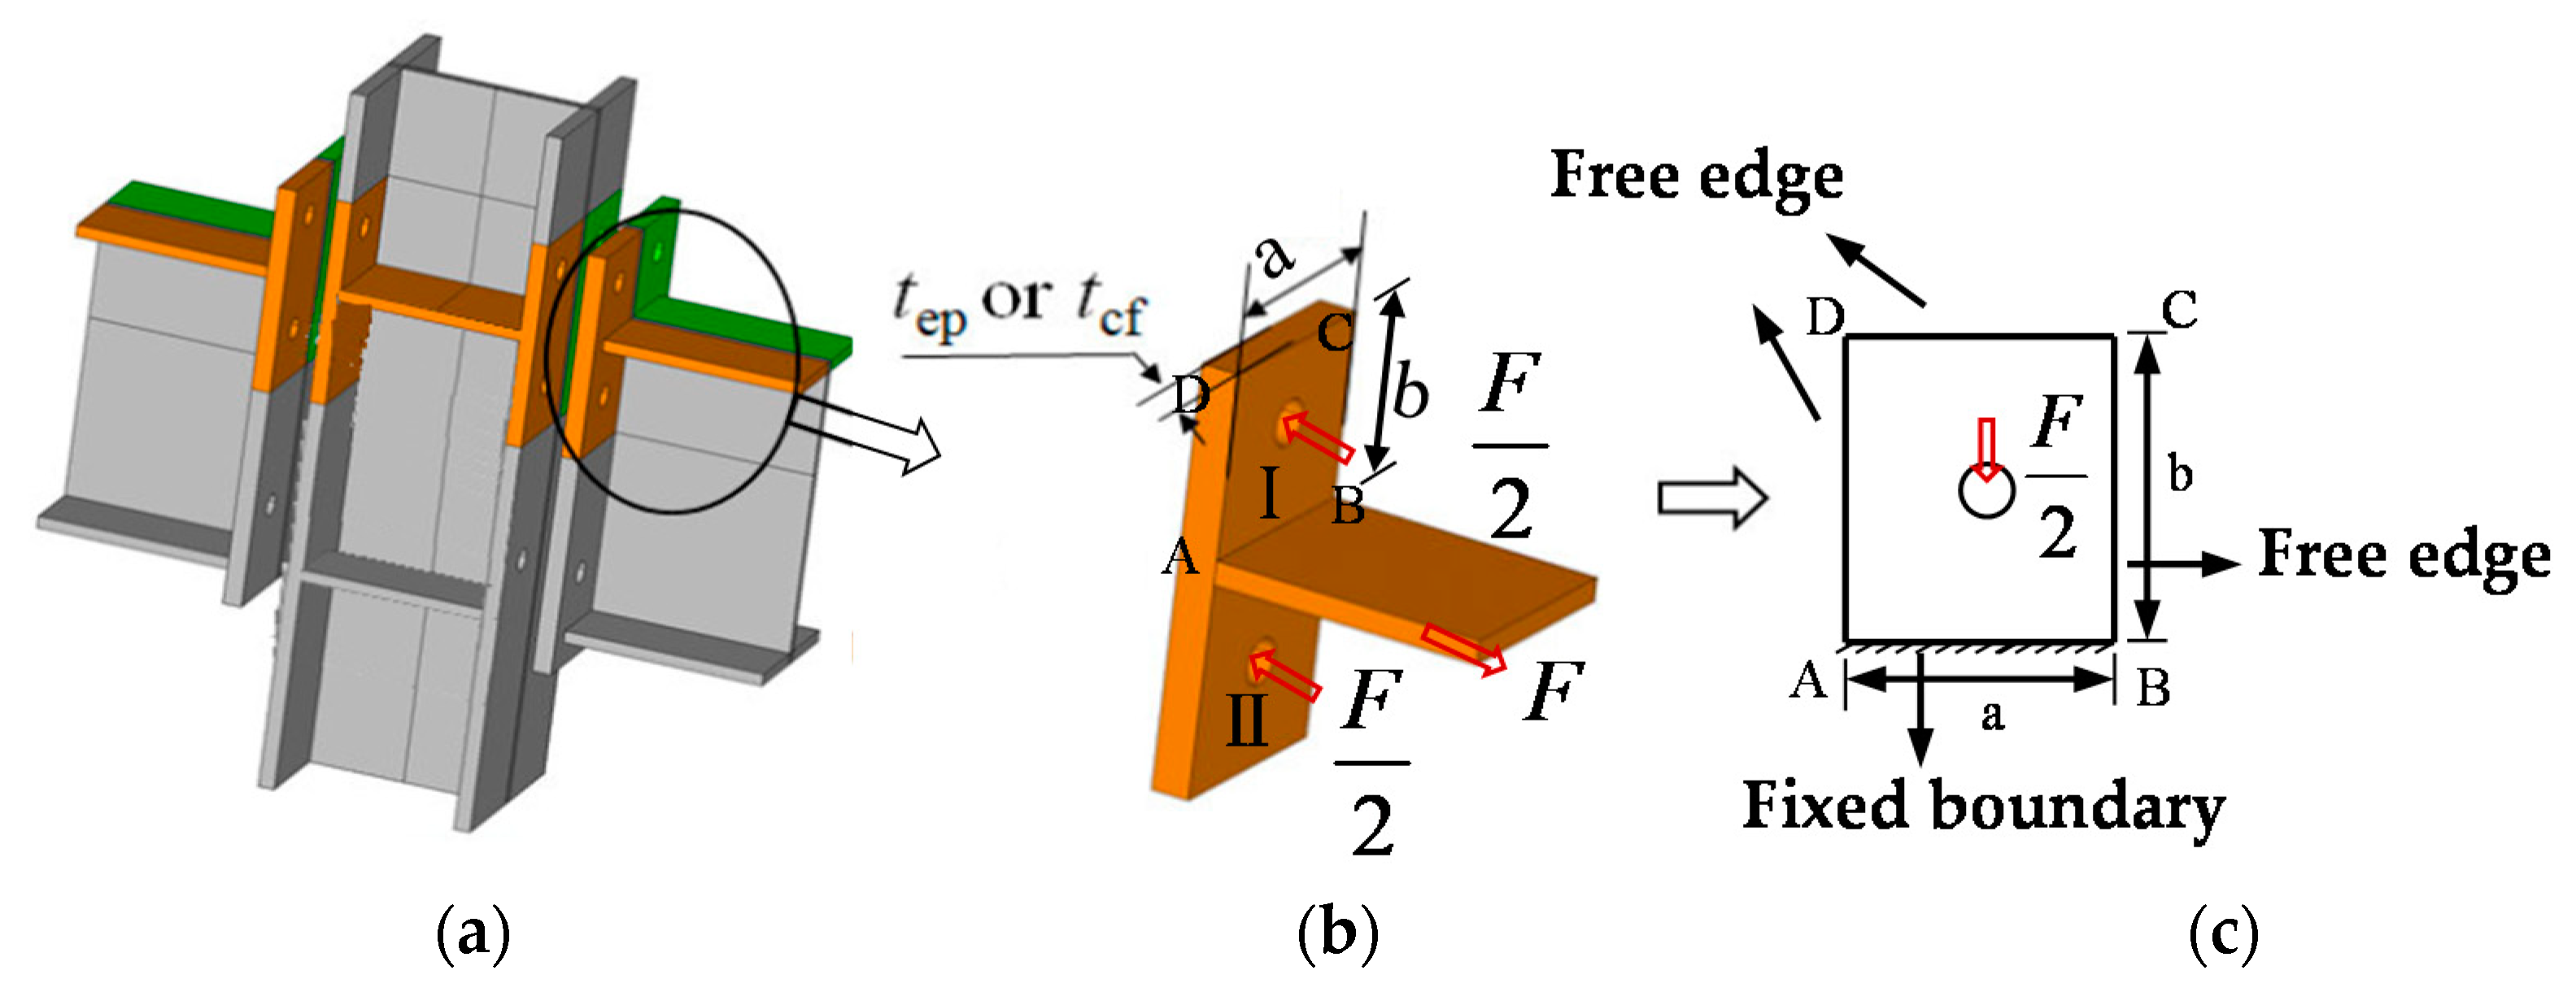
6.2.1. Stiffness Calculation of the End-Plate and Column Flange in Bending
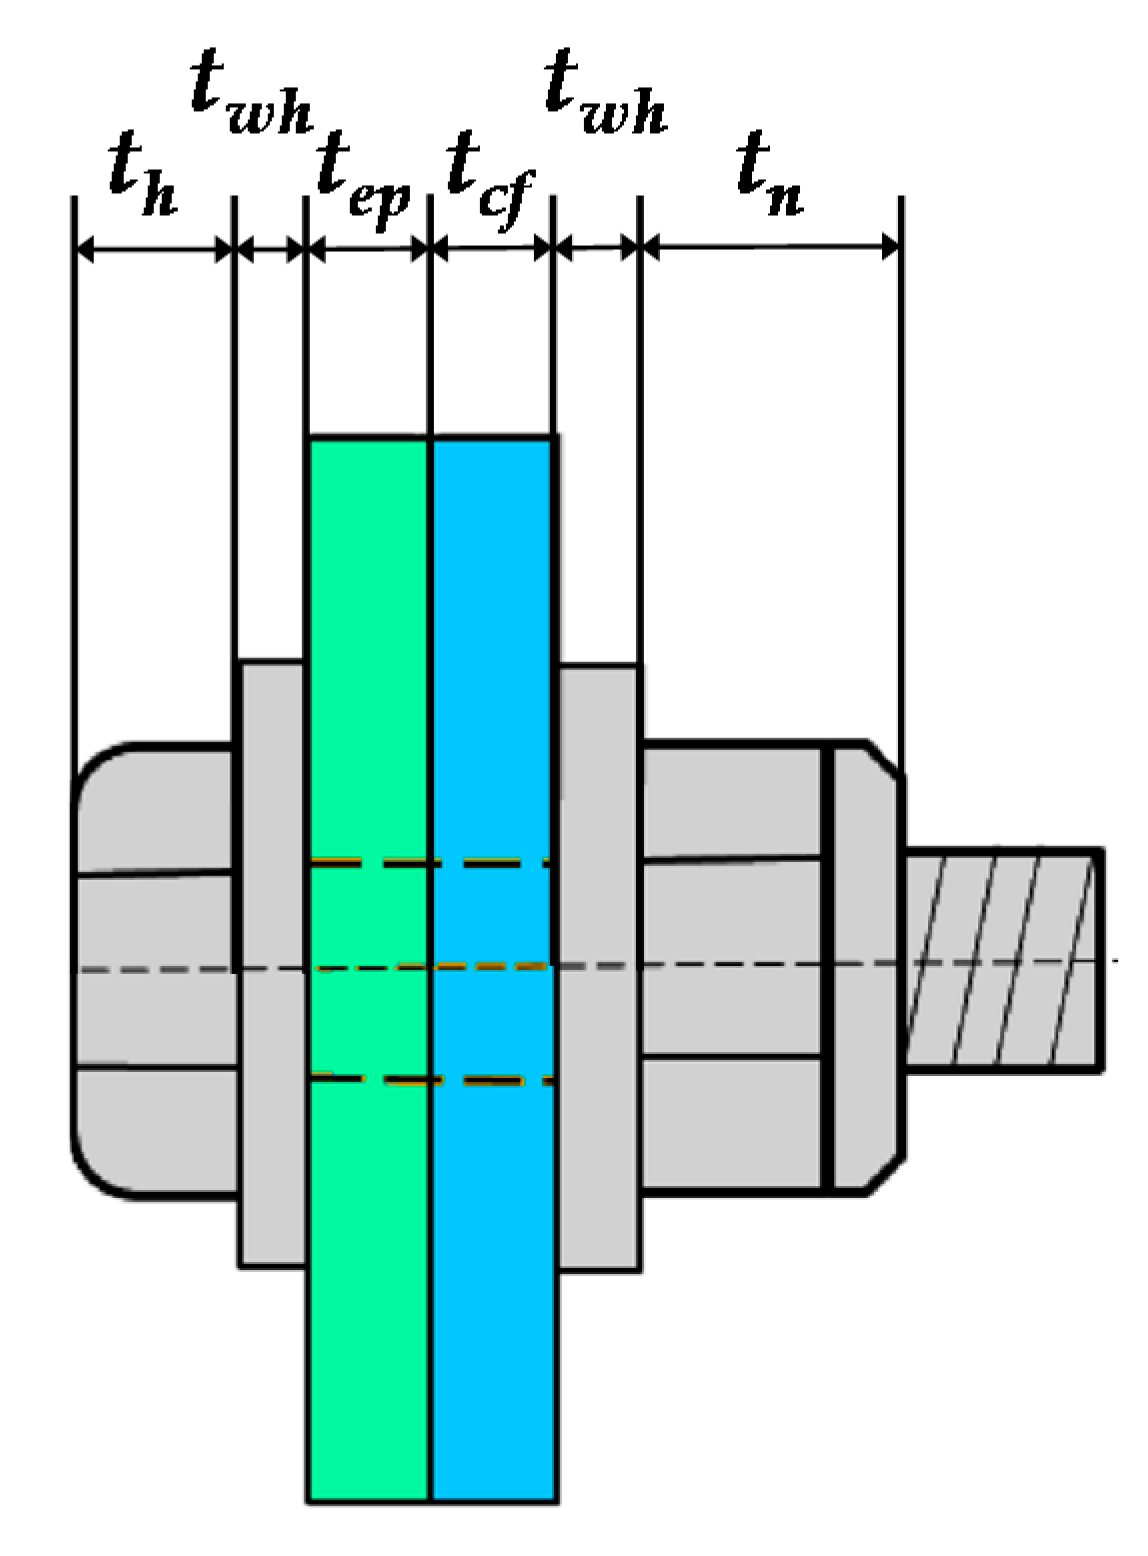
6.2.2. Stiffness Calculation of the Bolt in Tension
6.2.3. Integrated Connection Stiffness
6.3. Calculation of the Stiffness of the Column Web
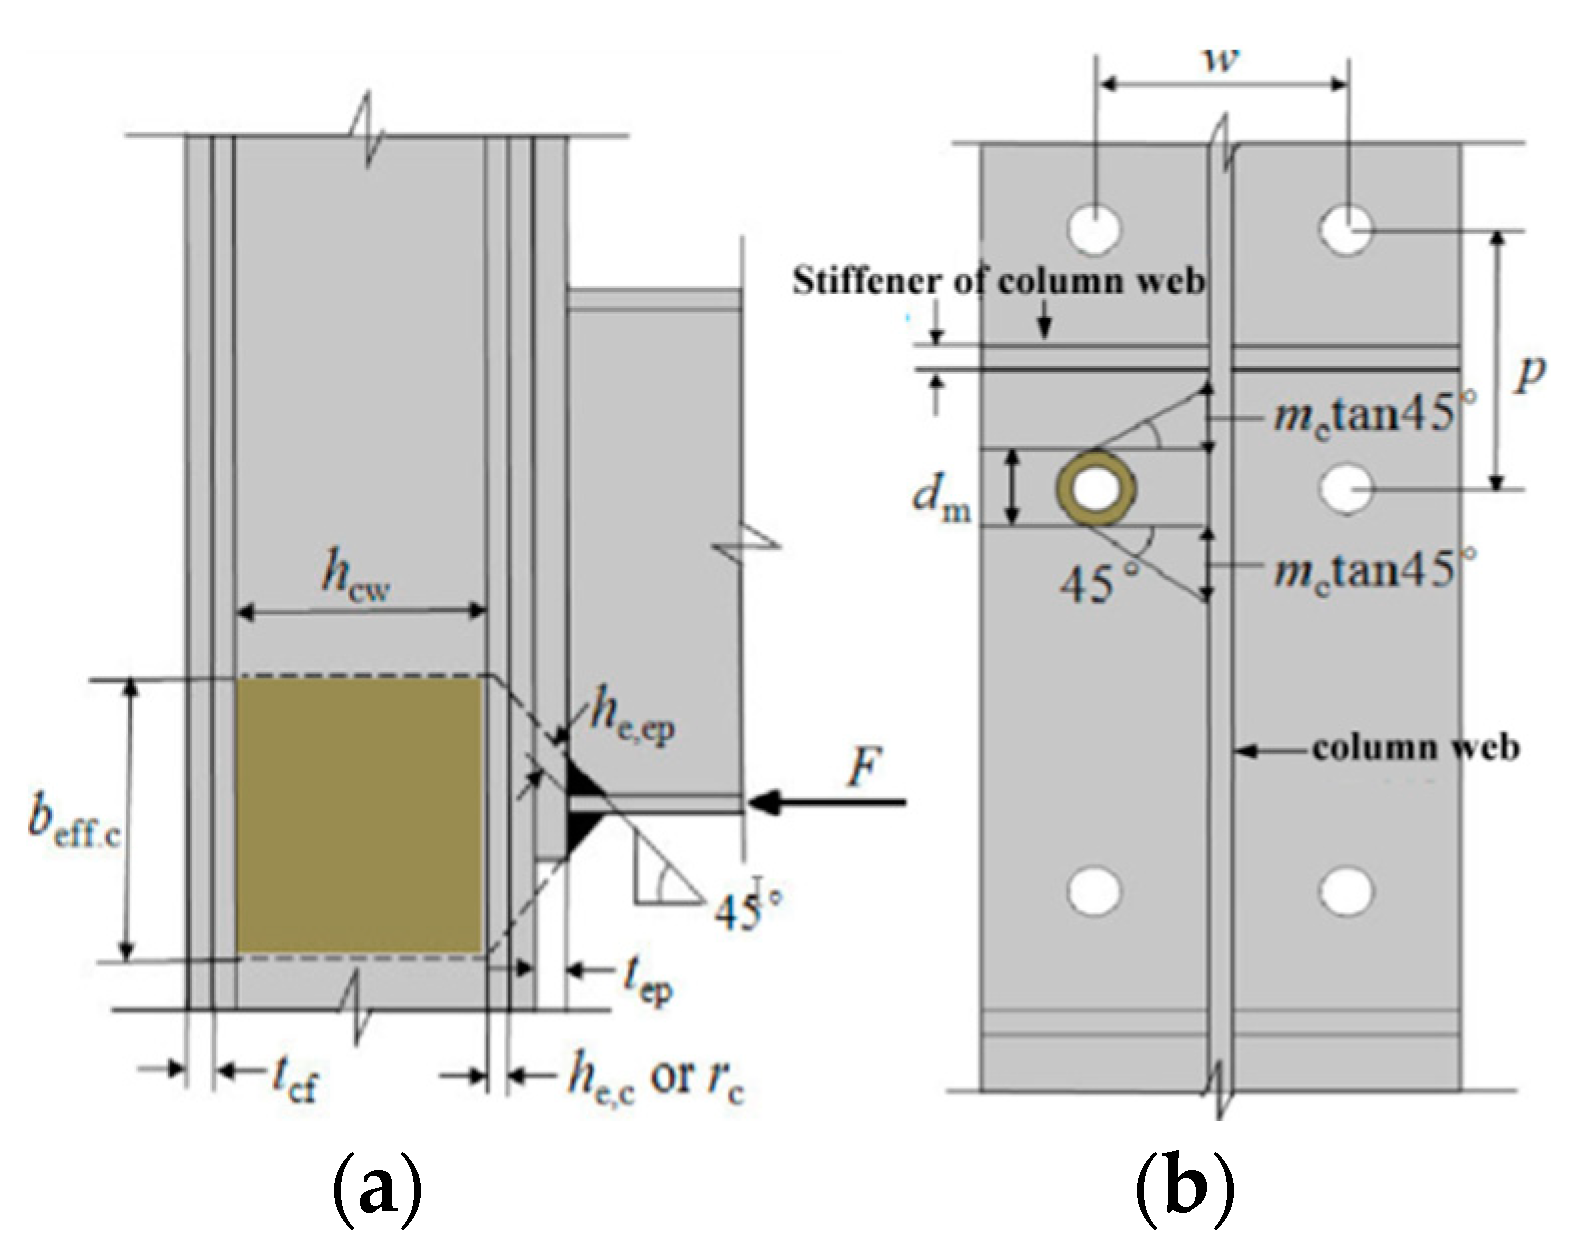
6.3.1. Tension and Compression Stiffness of the Column Web
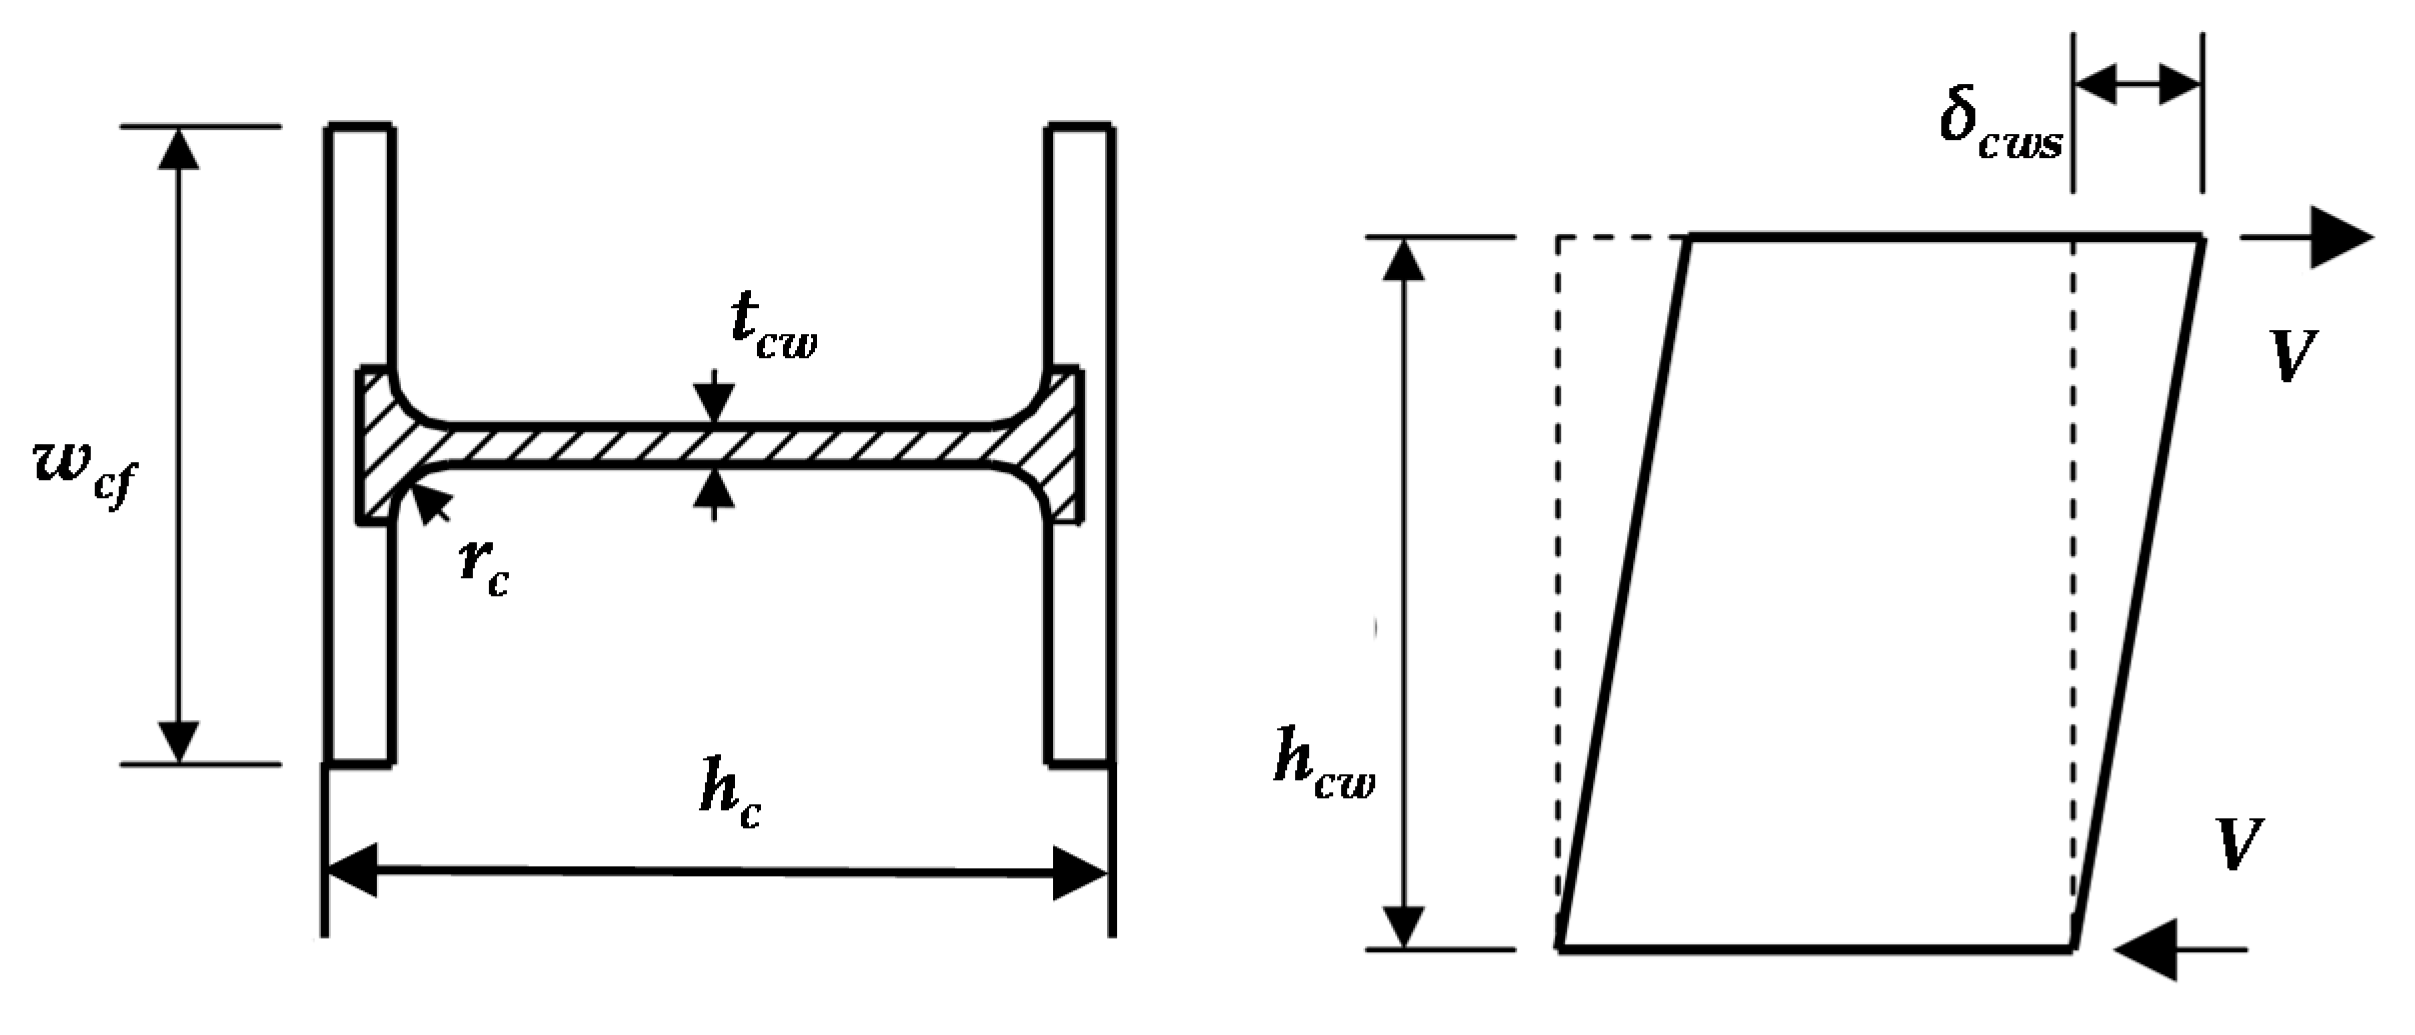
6.3.2. Shear Stiffness of Column Web
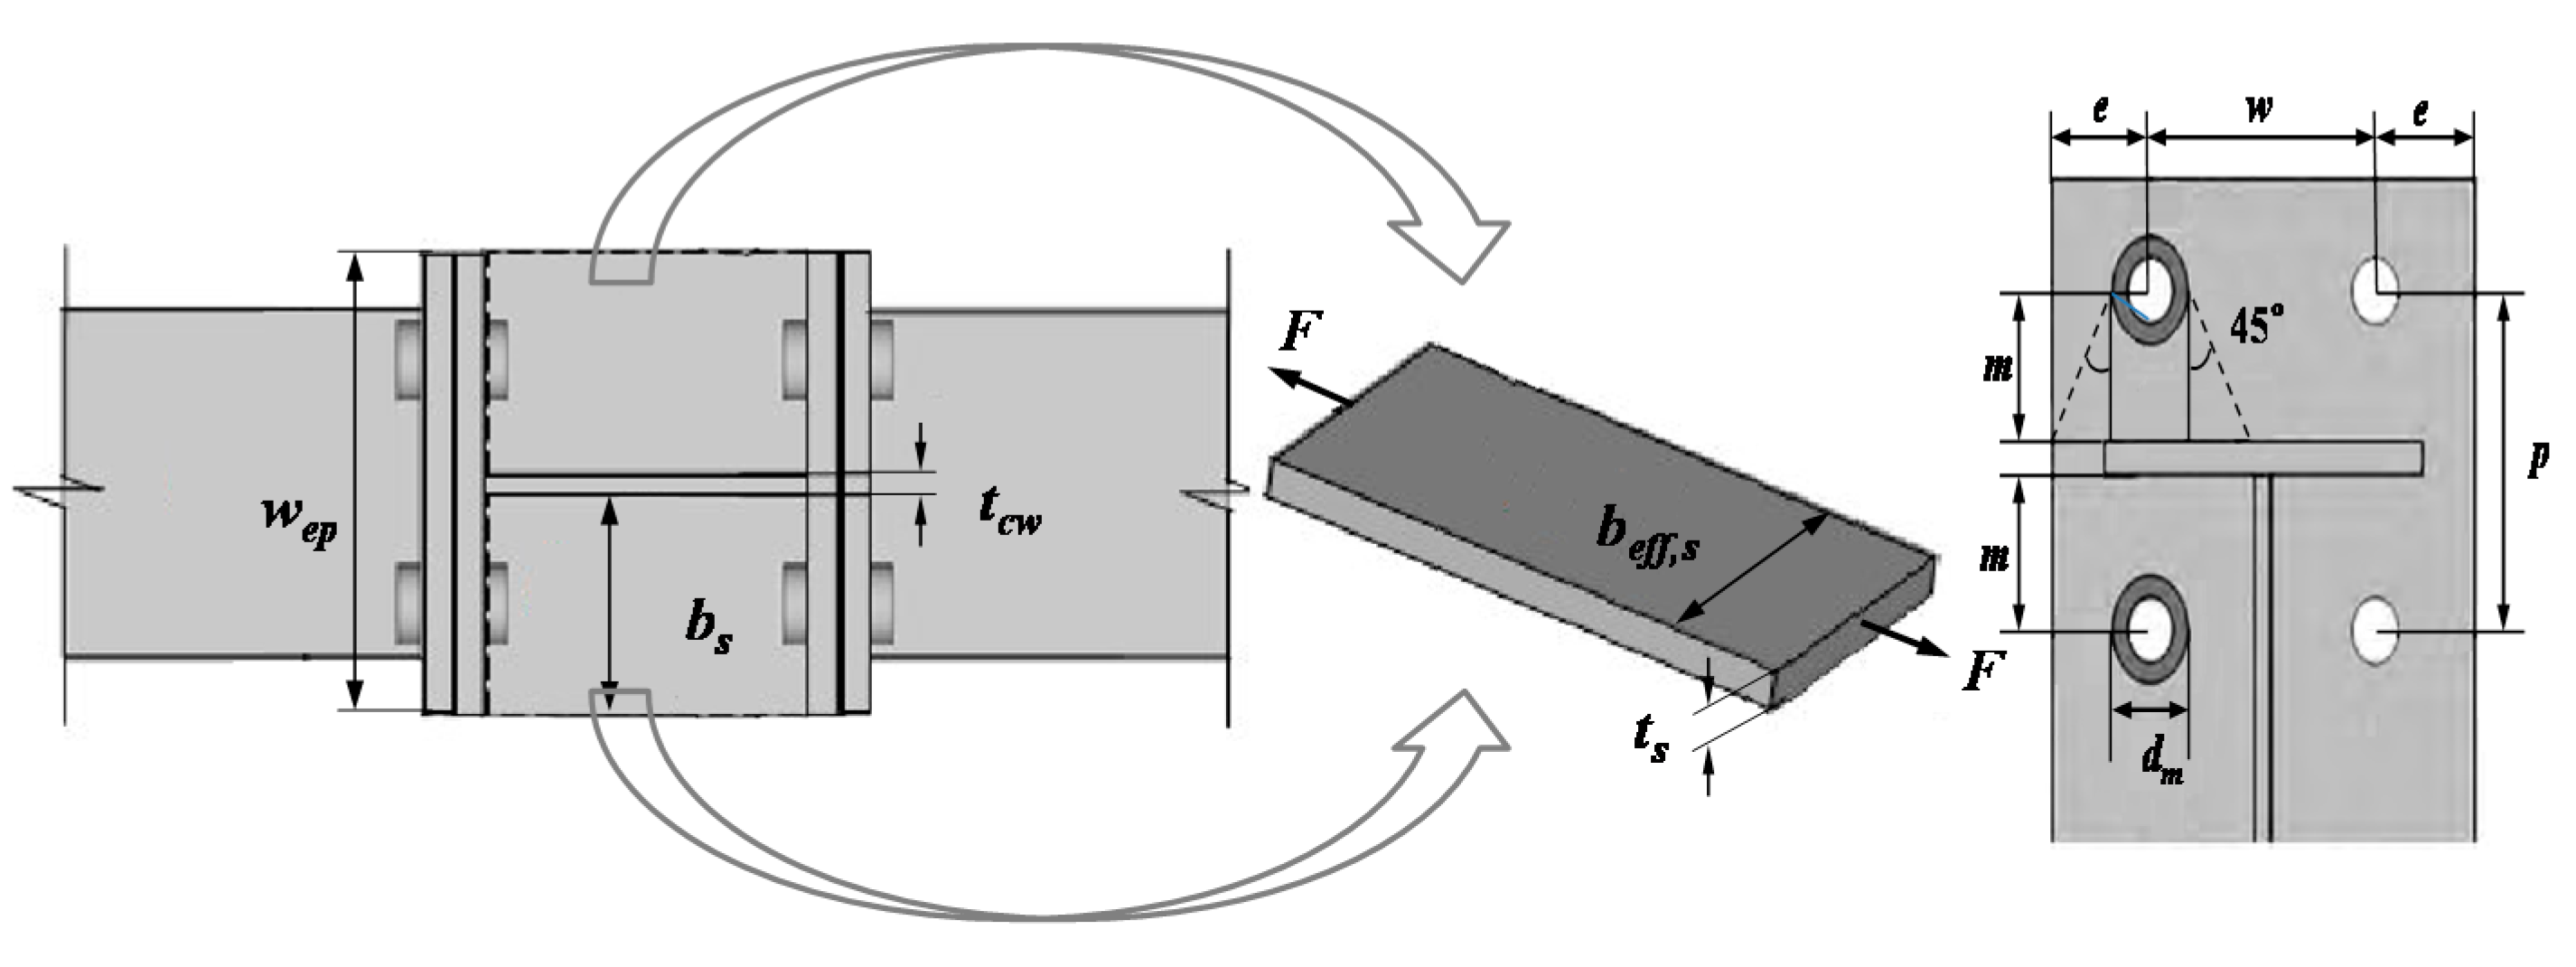
6.3.3. Tension and Compression Stiffness of Column Web Stiffener
6.3.4. Integrated Column Web Stiffness
6.4. Validation
7. Conclusions
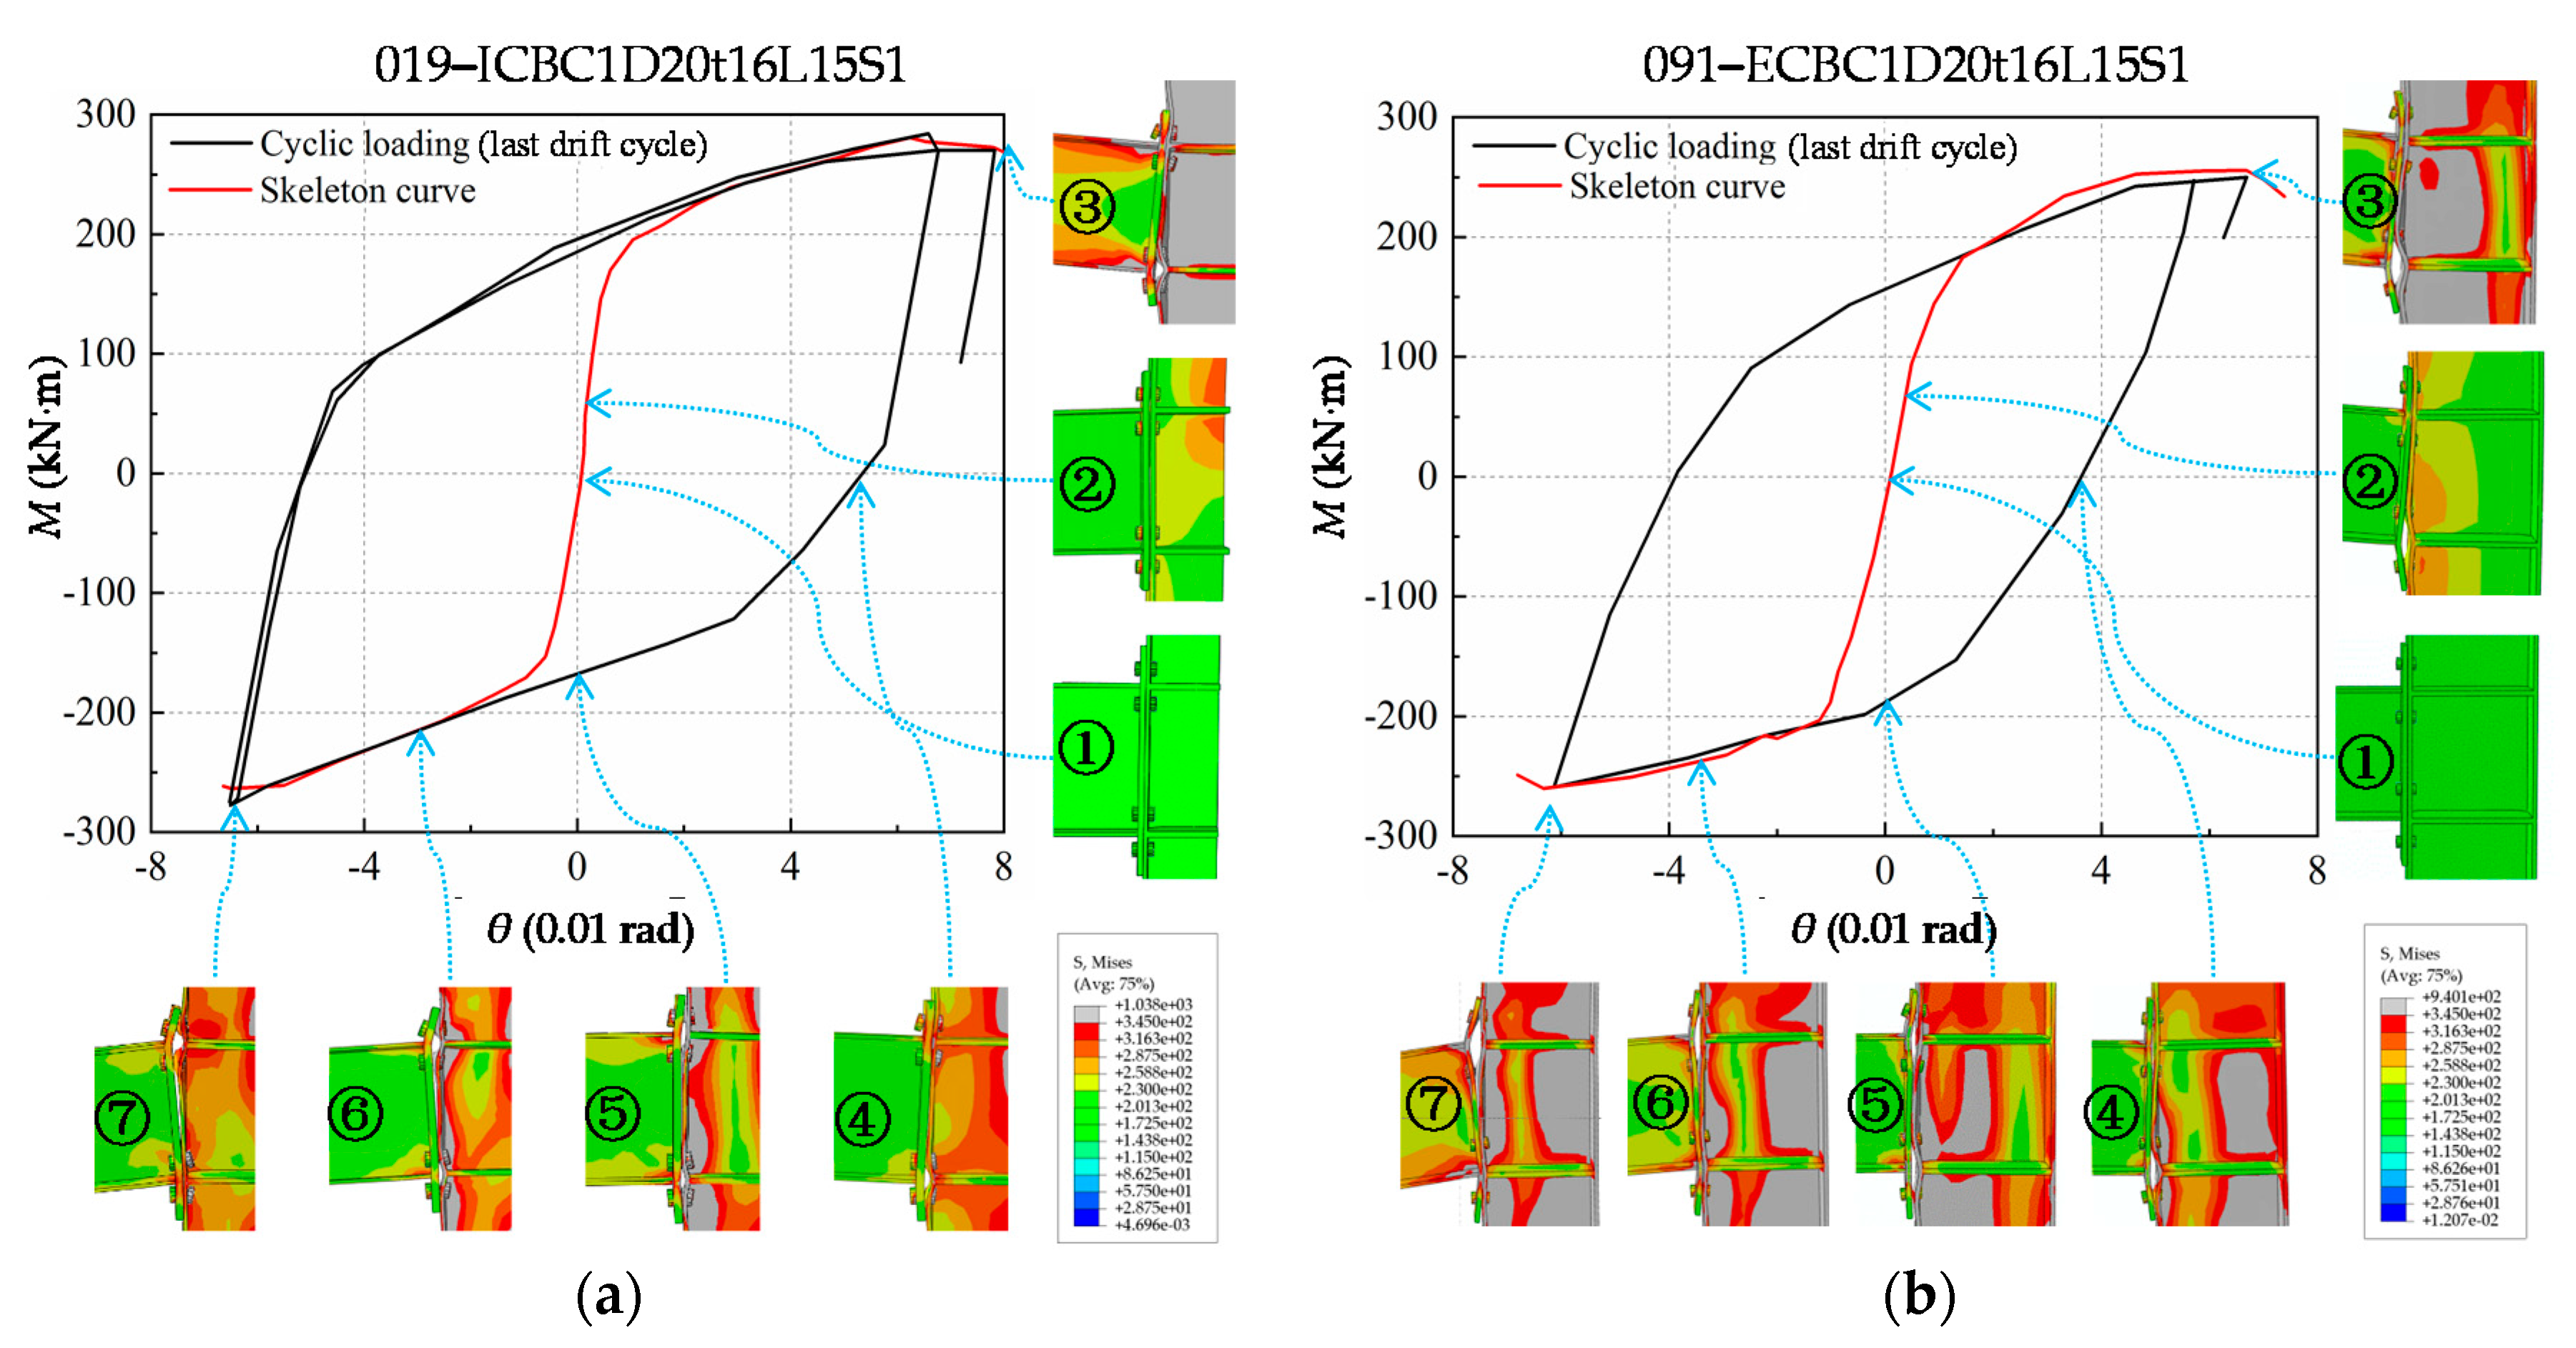
- According to the influence of different parameters on the mechanical behavior of the extended end-plate connection, the parametric FE models were established, and the effects on the flexural capacity, rotational stiffness and limit rotation of the joints are studied. Meanwhile, the joint typical failure model is divided into six types. It is also found that the joints also show nonlinear characteristics in the early stage, and some connected components have already yielded in the initial stage, and each component will not respond uniformly as a whole. The behavior of joints in the whole process is nonlinear.
- In most studies in the past, the main focus has been on the study of the moment-rotation relationship of the connection under the beam tip loading method, but this article focuses on some force forms in actual engineering, using the column top-side loading method to study the parameter’s comprehensive impact on joint performance. Additionally, the research on the panel zone shearing effect is focused, and it is concluded that the value of shearing force acting on the connection has a great influence on the mechanical behaviors of joints in this type of loading. Meanwhile, the shear rotation of the IC joint parameter model accounts for about 2/3 of the total connection rotation times, and the shear force in the panel zone is twice that of the EC joint. However, under the control of the failure mode of the weakest component, the ultimate flexural resistance capacity of the IC joint and EC joint remains consistent.
- Increasing the diameter of bolts or the thickness of the end-plate in most cases enhances the behavior of the connection, in other words, increases both moment capacity and rotation capacity by a certain percentage. However, the yield rotation of the connection is decreased with an increase in the thickness of end-plates, resulting in low connection ductility. In spite of this, the use of medium-thickness end-plates with bolts of appropriate diameters can greatly improve the overall mechanical properties of joints.
- According to the mechanical behavior of the joint components. The component model of the joint under the column top-side loading method is proposed, and the initial stiffness expression is established. The bending stiffness of the component was improved by adopting the large deflection calculation of the plate and shell theory, and considering the significant difference in the contribution of the shear stiffness component of the panel zone between the IC joint and EC joint. The expression is verified by experimental results and the 144-parameter FE model, which proves the reliability of the initial stiffness expression.
Author Contributions
Funding
Acknowledgments
Conflicts of Interest
Nomenclature
| Symbols | Content | Symbols | Content |
| a: | The calculated length of the cantilever rectangular plate | acf: | The calculated length of the column flange T-stub |
| aep: | The calculated length of the end-plate T-stub | As: | The effective area of the bolt rod |
| Asc: | The shear area of the column web | b: | The calculated height of the cantilever rectangular plate |
| bcf: | Calculate the height of column flange T-stub | beff,c: | Effective height of the column web in compression |
| beff,sc: | The effective compression width of column web stiffener | beff,st: | The effective tensile width of column web stiffener |
| beff,t: | The effective height of the column web in tension | bep: | The calculated height of the end-plate T-stub |
| bs: | The width of the column web stiffener | D: | The unit width of the plate bending rigidity |
| db: | The nominal diameter of the bolt | dm: | The effective diameter of the bolt head, dm = 1.5db |
| e: | The horizontal distance from the center of the bolt hole to the external edge | E: | Elasticity modulus |
| Est: | Elastoplastic modulus | hb: | The height of beam section |
| hc: | The height of the column section | hcw: | Calculation height of the column web |
| hcw,c: | The equivalent calculation height of the column web in compression | hcw,t: | The equivalent calculation height of column web in tension |
| he,c: | Effective heights of welded of the column | he,ep: | Effective heights of welded of the end-plate |
| kbt: | The tensile stiffness in the height of each row of bolts | kcfb: | The bending stiffness of the column flange |
| Kcon: | The stiffness of the connection part | Kcw: | The stiffness of the column web part |
| kcwc: | The compressive stiffness of column web | kcws: | The shear stiffness of column web |
| kcwt: | The tensile stiffness of column web | kepb: | The bending stiffness of end-plate |
| Kji: | Joint initial rotation stiffness | ksc: | The compressive stiffness of column web stiffener |
| kst: | The tensile stiffness of column web stiffener | Lb: | The calculation length of the bolt |
| leff,cf: | The effective lengths of the equivalent T-stubs of the column flange | leff,ep: | The effective lengths of the equivalent T-stubs of the end-plate |
| m: | The distance from the bolt hole to the surface of the beam flange | M: | Elastic ultimate moments |
| mc: | The distance from the center of the bolt hole to the welding foot of the column web | p: | Horizontal distance bolt holes |
| rc: | The root radius of the column flange weld | tbf: | The thickness of the beam flange |
| tcf: | The thickness of the column flange | tcw: | The thickness of the web |
| tep: | The thickness of the end-plate | th: | The thickness of bolt head |
| tn: | The thickness of the bolt nut | ts: | The thickness of column web stiffener |
| Symbols | Content | Symbols | Content |
| twh: | The thickness of the bolt washer | w: | The vertical distance between bolt holes |
| wbf: | Width of the beam flange | wcf: | Width of the column flange |
| wep: | Width of the end-plate | α: | The rectangular plate coefficient related to the length and constraints |
| γ: | The coefficient of prestress effect | θu: | Ultimate rotation |
| λ: | The influence coefficient of the bolt hole spacing, and the value λ = (p/w)3 | μ: | The Poisson’s ratio of the steel |
| Φ: | The influence coefficient of the joints type | ωepb1: | The center deflection of the No.I plate of end-plate T-stub |
| ωepb2: | The center deflection of the No. II plate of end-plate T-stub | ωm: | The center deflection of the cantilever rectangular plate |
| △b: | The bending deformation of the end-plate and column flange | △c: | The compressive deformation of the column web |
| △s: | The shear deformation of the column web | △t: | The tensile deformation of the bolts |
References
- Tremblay, R.; Filiatrault, A.; Timler, P.; Bruneau, M. Performance of steel structures during the 1994 Northridge earthquake. Can. J. Civ. Eng. 1995, 22, 338–360. [Google Scholar] [CrossRef]
- Mahin, S.A. Lessons from damage to steel buildings during the Northridge earthquake. Eng. Struct. 1998, 20, 261–270. [Google Scholar] [CrossRef]
- Miller, D.K. Lessons learned from the Northridge earthquake. Eng. Struct. 1998, 20, 249–260. [Google Scholar] [CrossRef]
- Anderson, J.C.; Duan, J.; Xiao, Y.; Maranian, P. Cyclic testing of moment connections upgraded with weld overlays. J. Struct. Eng. 2002, 128, 509–516. [Google Scholar] [CrossRef]
- Chen, C.-C.; Chen, S.-W.; Chung, M.-D.; Lin, M.-C. Cyclic behaviour of unreinforced and rib-reinforced moment connections. J. Constr. Steel Res. 2005, 61, 1–21. [Google Scholar] [CrossRef]
- American Institute of Steel Construction (AISC). Manual of Steel Construction–Allowable Stress Design, 9th ed.; American Institute of Steel Construction (AISC): Chicago, IL, USA, 1989. [Google Scholar]
- Standardization, E. EN1993-1-8. Eurocode 3: Design of Steel Structures-Part 1-8 In Design of Joints; European Committee for Standardization: Brussels, Belgium, 2005. [Google Scholar]
- Load, A. Resistance Factor Design Specification for Structural Steel Buildings; American Institute of Steel Construction. Inc.: Chicago, IL, USA, 1999; SAC. [Google Scholar]
- Krishnamurthy, N. A fresh look at bolted end-plate behavior and design. Eng. J. 1978, 15, 39–49. [Google Scholar]
- Shi, G.; Shi, Y.; Wang, Y.; Bijlaard, F. Monotonic loading tests on semi-rigid end-plate connections with welded I-shaped columns and beams. Adv. Struct. Eng. 2010, 13, 215–229. [Google Scholar] [CrossRef]
- Tao, W.; Zhan, W.; Junqi, W. Experimental study and finite element analysis of hysteretic behavior of end-plate connection semi-rigid space steel frames. Open Civ. Eng. J. 2013, 7, 68–76. [Google Scholar] [CrossRef]
- Abidelah, A.; Bouchaïr, A.; Kerdal, D. Experimental and analytical behavior of bolted end-plate connections with or without stiffeners. J. Constr. Steel Res. 2012, 76, 13–27. [Google Scholar] [CrossRef]
- ElSabbagh, A.; Sharaf, T.; Nagy, S.; ElGhandour, M. Behavior of extended end-plate bolted connections subjected to monotonic and cyclic loads. Eng. Struct. 2019, 190, 142–159. [Google Scholar] [CrossRef]
- Grimsmo, E.L.; Clausen, A.H.; Langseth, M.; Aalberg, A. An experimental study of static and dynamic behaviour of bolted end-plate joints of steel. Int. J. Impact Eng. 2015, 85, 132–145. [Google Scholar] [CrossRef]
- Chen, S.; Pan, J.; Wang, Z.; Zhou, C. Rotation Stiffness Investigation of Spatial Joints with End-Plate Connection. Adv. Civ. Eng. 2019, 2019, 1–15. [Google Scholar] [CrossRef]
- Zhan, W.; Tao, W. Experiment and finite element analysis for the end plate minor axis connection of semi-rigid steel frames. China Civ. Eng. J. 2012, 45, 83–89. (In Chinese) [Google Scholar]
- D’Alessandro, E.; Brando, G.; De Matteis, G. Design charts for end-plate beam-to-column steel joints. Proc. Inst. Civ. Eng. Struct. Build. 2018, 171, 444–462. [Google Scholar] [CrossRef]
- Faella, C.; Piluso, V.; Rizzano, G. Structural Steel Semirigid Connections: Theory, Design, and Software; CRC Press: Boca Raton, FL, USA, 1999; Volume 21. [Google Scholar]
- Bahaari, M.R.; Sherbourne, A.N. Finite element prediction of end plate bolted connection behavior. II: Analytic formulation. J. Struct. Eng. 1997, 123, 165–175. [Google Scholar] [CrossRef]
- Shi, G.; Shi, Y.; Wang, Y.; Bradford, M.A. Numerical simulation of steel pretensioned bolted end-plate connections of different types and details. Eng. Struct. 2008, 30, 2677–2686. [Google Scholar] [CrossRef]
- Guo, B.; Gu, Q.; Liu, F. Experimental behavior of stiffened and unstiffened end-plate connections under cyclic loading. J. Struct. Eng. 2006, 132, 1352–1357. [Google Scholar] [CrossRef]
- Wang, Y.; Wang, Z.; Pan, J.; Wang, P.; Qin, J.; Chen, S. Cyclic Behavior of Anchored Blind-Bolted Extended End-Plate Joints to CFST Columns. Appl. Sci. 2020, 10, 904. [Google Scholar] [CrossRef]
- Zhao, D.; Wang, Z.; Pan, J.; Wang, P. Error Analysis Method of Geometrically Incomplete Similarity of End-Plate Connection Based on Linear Regression. Appl. Sci. 2020, 10, 4812. [Google Scholar] [CrossRef]
- Tartaglia, R.; D’Aniello, M.; Landolfo, R. The influence of rib stiffeners on the response of extended end-plate joints. J. Constr. Steel Res. 2018, 148, 669–690. [Google Scholar] [CrossRef]
- Francavilla, A.B.; Latour, M.; Piluso, V.; Rizzano, G. Design of full-strength full-ductility extended end-plate beam-to-column joints. J. Constr. Steel Res. 2018, 148, 77–96. [Google Scholar] [CrossRef]
- Vértes, K.; Iványi, M. Investigation of minor axis and 3D bolted end-plate connections-experimental and numerical analysis-load tests. Period. Polytech. Civ. Eng. 2005, 49, 47–58. [Google Scholar]
- Loureiro, A.; Moreno, A.; Gutiérrez, R.; Reinosa, J. Experimental and numerical analysis of three-dimensional semi-rigid steel joints under non-proportional loading. Eng. Struct. 2012, 38, 68–77. [Google Scholar] [CrossRef]
- Yang, P.; Eatherton, M.R. A phenomenological component-based model to simulate seismic behavior of bolted extended end-plate connections. Eng. Struct. 2014, 75, 11–26. [Google Scholar] [CrossRef]
- Miller, C.J.; Sexsmith, R.G.; Nilson, A.H. Analysis of Multistory Frames with Light Gauge Steel Panel Walls; Rep. 349; Department of Structural Engineering, Cornell University: Ithaca, NY, USA, 1972. [Google Scholar]
- Pham, A.T.; Lim, N.S.; Tan, K.H. Investigations of tensile membrane action in beam-slab systems under progressive collapse subject to different loading configurations and boundary conditions. Eng. Struct. 2017, 150, 520–536. [Google Scholar] [CrossRef]
- Luo, L.; Qin, J.; Zhao, D.; Wu, Z. Seismic Behavior of Extended End-Plate Connections Subjected to Cyclic Loading on the Top-Side of the Column. Materials 2020, 13, 3724. [Google Scholar] [CrossRef]
- PRC, M. ChineseStandard.GB 50017-2017. Code for Design of Steel Structure; China Building Industry Press: Beijing, China, 2017. [Google Scholar]
- ABAQUS Analysis User’s Manual ABAQUS Standard; Version 6.14; SIMULIA: Johnston, RI, USA, 2014.
- Sherbourne, A.N.; Bahaari, M.R. 3D simulation of end-plate bolted connections. J. Struct. Eng. 1994, 120, 3122–3136. [Google Scholar] [CrossRef]
- Pengcheng, L. Bending of rectangular cantilever plate under concentrated load. Appl. Math. Mech. 1982, 5, 36–46. [Google Scholar]
- Jing, G.; Wenlong, S.; Guoqiang, L.; Zhiming, Y. Initial rotational stiffness of semi-rigid composite beam-to-clumn joints with flush end plate connections. Eng. Mech. 2011, 28, 55–61. [Google Scholar]
- Bahaari, M.R.; Sherbourne, A.N. 3D simulation of bolted connections to unstiffened columns—II. Extended endplate connections. J. Constr. Steel Res. 1996, 40, 189–223. [Google Scholar] [CrossRef]
- Wu, Z.-Q.; Zhang, S.-M.; Jiang, S.-F. Calculation model of initial rotational stiffness of steel beam-to-column bolted end-plate connections. Eng. Mech. 2009, 26, 226–232. [Google Scholar]


| Joints Type | Specimen | End-Plate Thickness (mm) | Bolt Diameter (mm) | Beam Section (mm) | Column Section (mm) | Fpre (kN) | Fc (kN) |
|---|---|---|---|---|---|---|---|
| IC joint | IC-EP1 | 16 | 20 | H300 × 200 × 8 × 12 | H300 × 300 × 10 × 15 | 155 | 1250 |
| IC-EP2 | 16 | 24 | H300 × 200 × 8 × 12 | H300 × 300 × 10 × 15 | 225 | 1250 | |
| IC-EP3 | 20 | 20 | H300 × 200 × 8 × 12 | H300 × 300 × 10 × 15 | 155 | 1250 | |
| EC joint | EC-EP1 | 16 | 20 | H300 × 200 × 8 × 12 | H300 × 300 × 10 × 15 | 155 | 1250 |
| EC-EP2 | 20 | 20 | H300 × 200 × 8 × 12 | H300 × 300 × 10 × 15 | 155 | 1250 | |
| EC-EP3 | 12 | 20 | H300 × 200 × 8 × 12 | H300 × 300 × 10 × 15 | 155 | 1250 |
| Specimen | Kji (kN·m/mrad) | My (kN·m) | Mmax (kN·m) | θy (mrad) | θu (rad) | μθ | Failure Pattern | |
|---|---|---|---|---|---|---|---|---|
| IC-EP1 | west | 55.8 | 130.4 | 251.1 | 6.7 | 0.06 | 9.0 | The weld cracked at the flange and the bolt broke. |
| east | 57.5 | 124.1 | 239.1 | 6.5 | 0.06 | 9.2 | ||
| IC-EP2 | west | 63.3 | 138.6 | 239.8 | 7.9 | 0.07 | 8.9 | The large shear deformation of panel zone. |
| east | 62.6 | 112.3 | 211.7 | 7.1 | 0.06 | 8.5 | ||
| IC-EP3 | west | 43.3 | 128.5 | 209.8 | 7.3 | 0.07 | 9.6 | Moderate shear deformation of panel zone and bolt breakage. |
| east | 38.6 | 132.1 | 228.7 | 6.9 | 0.07 | 10.1 | ||
| EC-EP1 | / | 25.7 | 130.7 | 236.6 | 4.7 | 0.05 | 10.6 | The excessive end-plate bending. |
| EC-EP2 | / | 27.6 | 120.1 | 225.8 | 5.1 | 0.05 | 9.8 | |
| EC-EP3 | / | 21.7 | 110.1 | 207.4 | 5.4 | 0.06 | 11.1 | |
| Material Type | fy/MPa | fu/MPa | εy/% | E/GPa | Est/GPa |
|---|---|---|---|---|---|
| Q345B steel | 370.16 | 556.20 | 0.40 | 207.27 | 0.02E |
| 10.9-grade high strength bolt | 987.55 | 1182.10 | 0.50 | 208.23 | 0.11E |
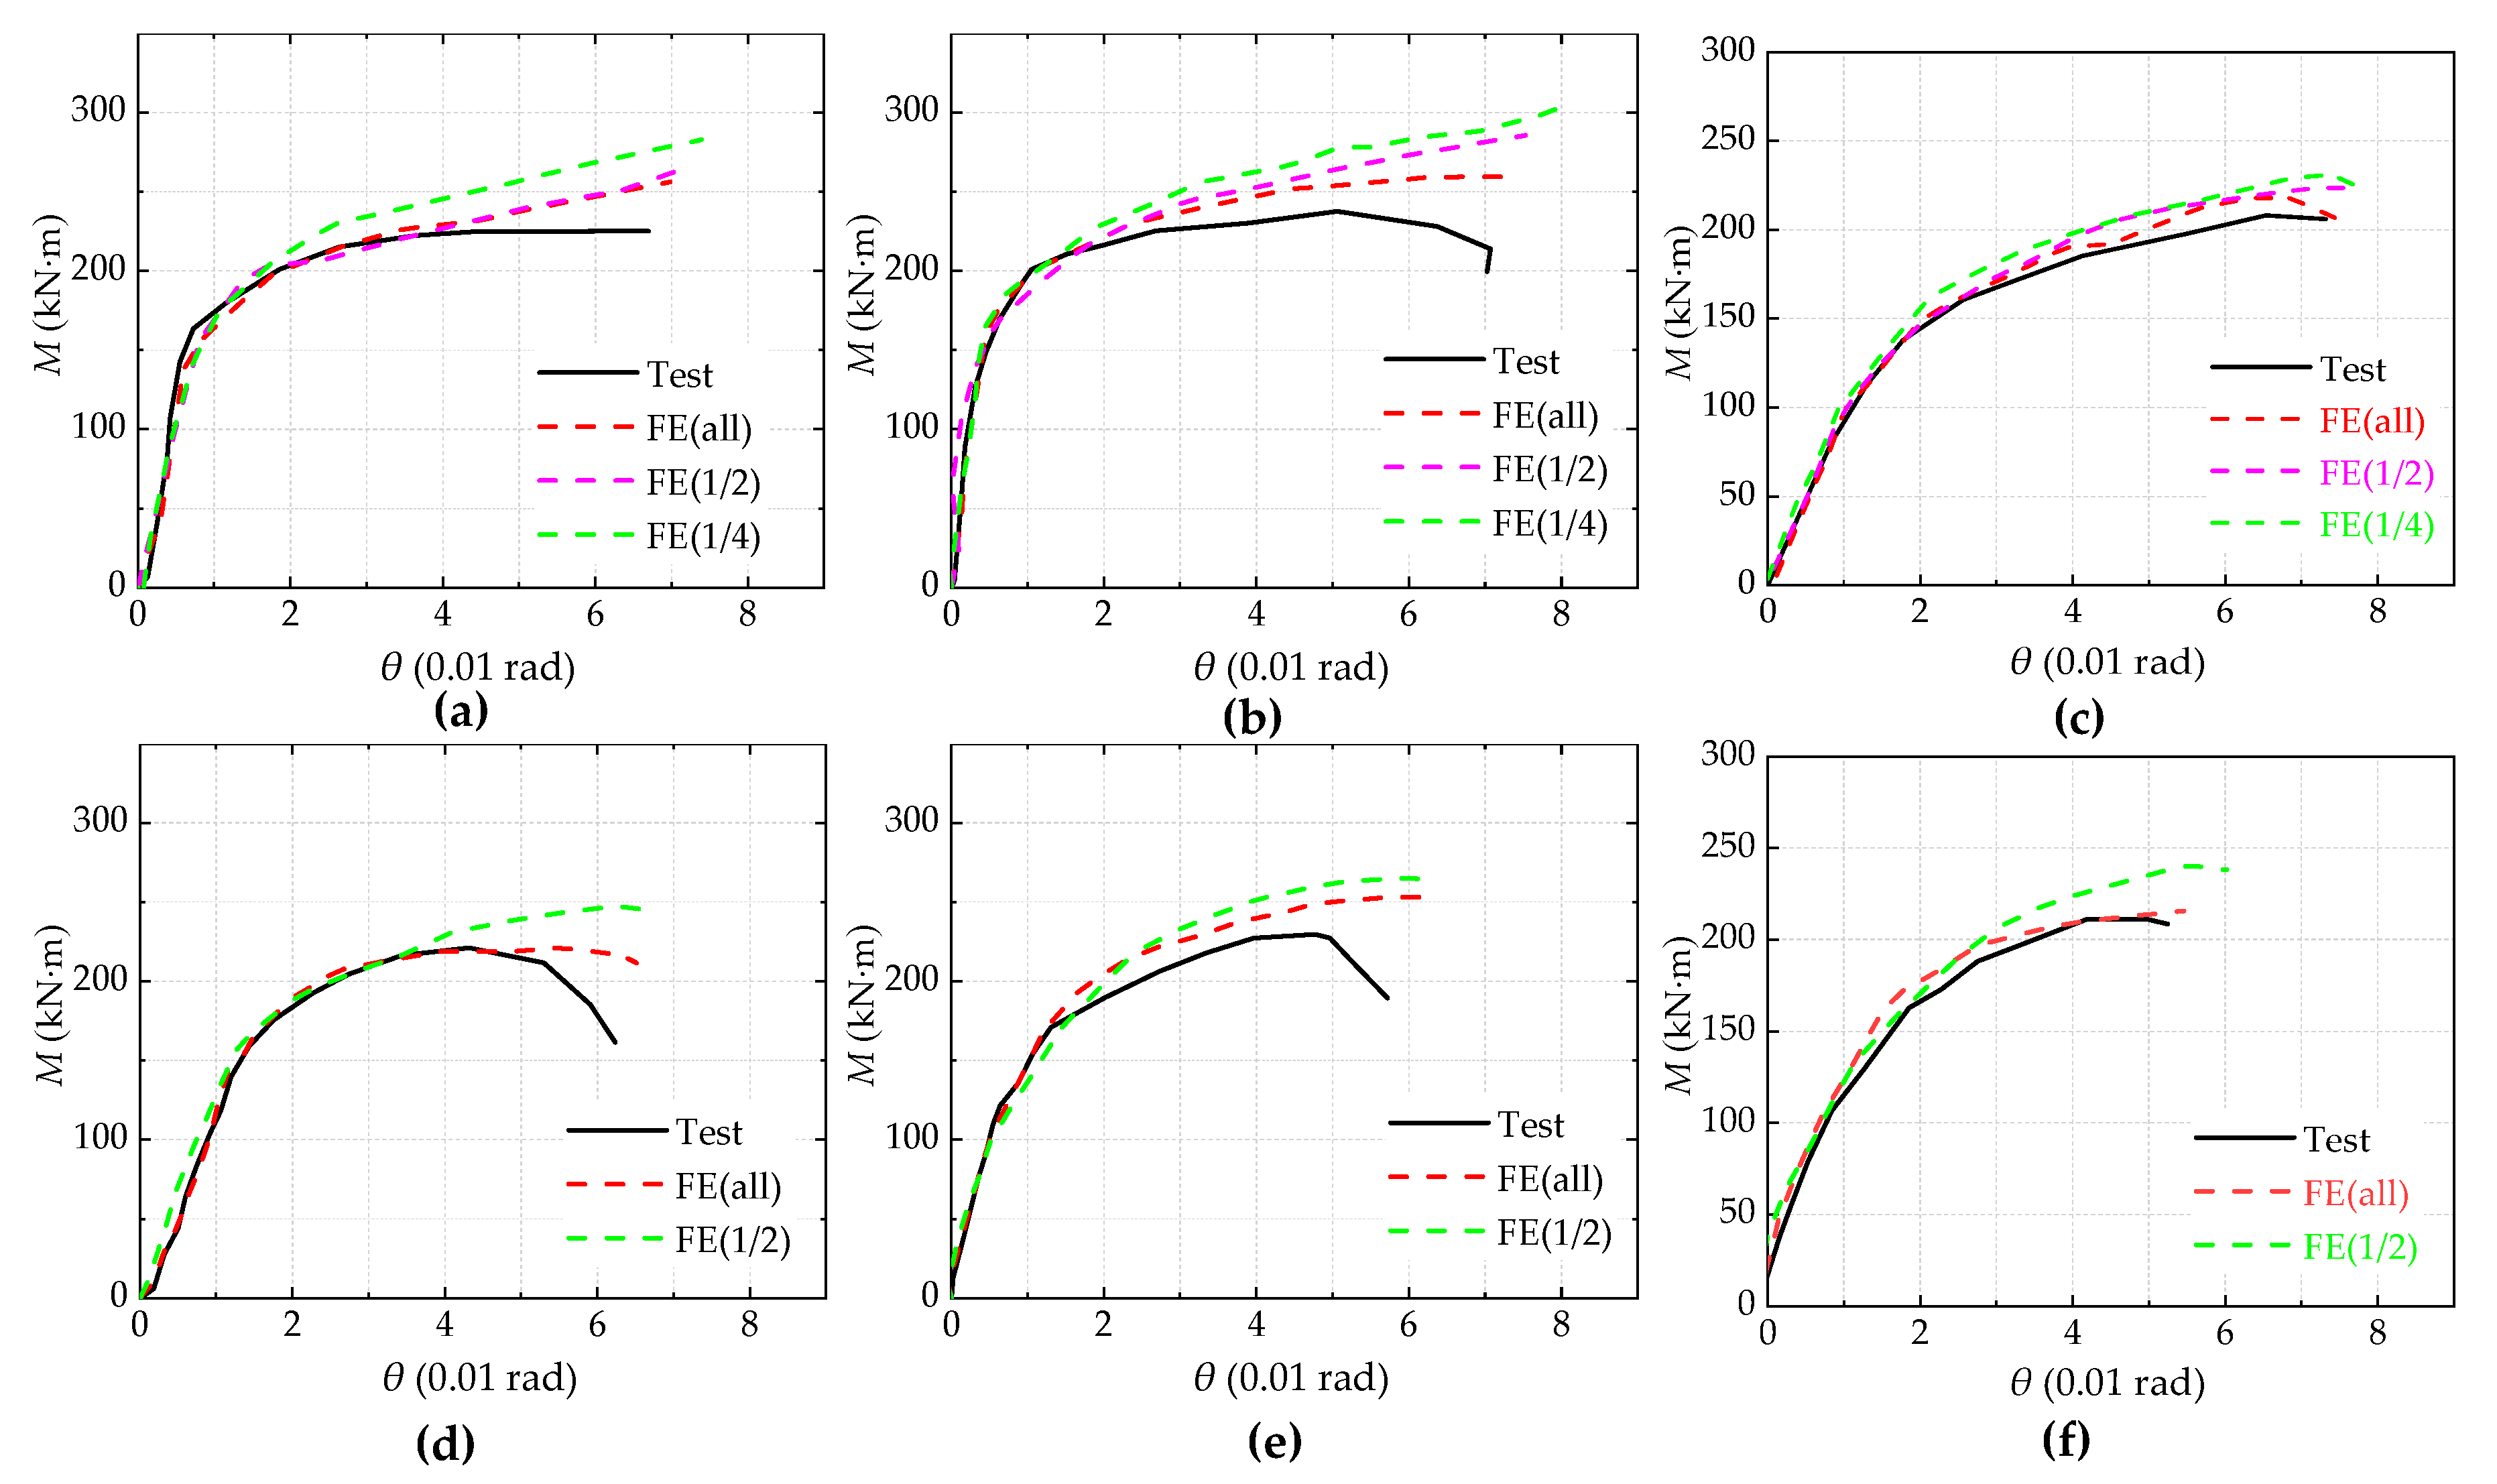
| Joints Type | FE Model | Symmetry | Corresponding Figure |
|---|---|---|---|
| IC joint | FE all, FE 1/2 and FE 1/4 | Boundary symmetry Load antisymmetric | Figure 6a–c |
| EC joint | FE all and FE 1/2 | Boundary symmetry Load asymmetry | Figure 7a,b |
| Specimen | Method | Kji (kN·m/mrad) | My (kN·m) | θy (mrad) | KFE/KTest | Method | Kji (kN·m/mrad) | My (kN·m) | θy (mrad) | KFE/KTest |
|---|---|---|---|---|---|---|---|---|---|---|
| IC-EP1/west | Test | 55.8 | 130.4 | 6.7 | / | FE 1/2 | 53.5 | 123.2 | 5.3 | 0.96 |
| FE all | 57.8 | 136.7 | 6.1 | 1.04 | FE 1/4 | 52.2 | 155.8 | 5.7 | 0.94 | |
| IC-EP2/west | Test | 63.3 | 138.6 | 7.9 | / | FE 1/2 | 65.6 | 150.6 | 6.7 | 1.04 |
| FE all | 64.9 | 146.3 | 7.8 | 1.03 | FE 1/4 | 66.1 | 163.2 | 5.5 | 1.04 | |
| IC-EP3/west | Test | 43.3 | 128.5 | 7.3 | / | FE 1/2 | 42.7 | 130.8 | 7.1 | 0.99 |
| FE all | 45.6 | 137.6 | 6.9 | 1.05 | FE 1/4 | 47.3 | 135.4 | 6.8 | 1.09 | |
| EC-EP1 | Test | 25.7 | 130.7 | 4.7 | / | FE 1/2 | 28.5 | 153.8 | 4.1 | 1.11 |
| FE all | 26.3 | 141.3 | 5.3 | 1.02 | ||||||
| PEC-EP2 | Test | 27.6 | 120.1 | 5.1 | / | FE 1/2 | 29.8 | 135.7 | 3.7 | 1.08 |
| FE all | 30.9 | 130.5 | 4.9 | 1.12 | ||||||
| EC-EP3 | Test | 21.7 | 110.1 | 5.4 | / | FE 1/2 | 22.7 | 117.4 | 5.6 | 1.05 |
| FE all | 23.4 | 105.6 | 4.7 | 1.08 |
| Num | Model Label | Kji | My | Mmax | θy | θu | Failure Mode | Num | Model Label | Kji | My | Mmax | θy | θu | Failure Mode |
|---|---|---|---|---|---|---|---|---|---|---|---|---|---|---|---|
| (kN·m/mrad) | (kN·m) | (mrad) | (kN·m/mrad) | (kN·m) | (mrad) | ||||||||||
| 1 | ICBC1D16t12L8S1 | 47.7 | 103 | 164.6 | 3.4 | 81 | EPF | 37 | ICBC2D16t12L8S1 | 25.9 | 76 | 106.6 | 4.3 | 68.2 | EPF |
| 2 | ICBC1D16t12L8S2 | 52.4 | 169.2 | 237.7 | 3.5 | 69.9 | EPF | 38 | ICBC2D16t12L8S2 | 36.8 | 125.8 | 180.1 | 7.5 | 68.8 | EPF |
| 3 | ICBC1D16t12L15S1 | 52.7 | 112.4 | 183.4 | 7.2 | 79 | EPF | 39 | ICBC2D16t12L15S1 | 25 | 83 | 115.4 | 7.6 | 71.3 | EPF |
| 4 | ICBC1D16t12L15S2 | 61.9 | 178.4 | 264.8 | 2.8 | 70.7 | EPF | 40 | ICBC2D16t12L15S2 | 40.9 | 142.4 | 205.5 | 6.8 | 67 | EPF |
| 5 | ICBC1D16t16L8S1 | 63.1 | 179.4 | 258.5 | 6 | 77 | CPZB | 41 | ICBC2D16t16L8S1 | 44.1 | 139 | 222.5 | 7 | 59 | WEP-BF |
| 6 | ICBC1D16t16L8S2 | 69.6 | 182.4 | 278.5 | 5.3 | 72.4 | CFF | 42 | ICBC2D16t16L8S2 | 43.9 | 146.4 | 223.5 | 8.8 | 55.4 | CFF |
| 7 | ICBC1D16t16L15S1 | 71.2 | 182.6 | 234.3 | 3.4 | 75.4 | CPZB | 43 | ICBC2D16t16L15S1 | 47.8 | 146.6 | 194.2 | 3.8 | 54.5 | CFF |
| 8 | ICBC1D16t16L15S2 | 71.7 | 179.2 | 257.2 | 2.9 | 72.6 | CFF | 44 | ICBC2D16t16L15S2 | 45.1 | 137.7 | 207.9 | 3.4 | 56.7 | CFF |
| 9 | ICBC1D16t20L8S1 | 87.5 | 182.8 | 240.3 | 5.4 | 68.5 | BF | 45 | ICBC2D16t20L8S1 | 36.5 | 147.4 | 222.3 | 5.4 | 66.9 | BF |
| 10 | ICBC1D16t20L8S2 | 90.1 | 189.7 | 286.2 | 6.3 | 67.8 | BF | 46 | ICBC2D16t20L8S2 | 55.6 | 151.2 | 210.8 | 7.1 | 61.4 | BF |
| 11 | ICBC1D16t20L15S1 | 91.2 | 195.6 | 300.7 | 3 | 77.7 | BF | 47 | ICBC2D16t20L15S1 | 54.3 | 147.5 | 222 | 5.2 | 59.3 | BF |
| 12 | ICBC1D16t20L15S2 | 94.6 | 199.4 | 264.3 | 4.7 | 71 | BF | 48 | ICBC2D16t20L15S2 | 57 | 155.2 | 226.7 | 8.3 | 50.4 | BF |
| 13 | ICBC1D20t12L8S1 | 49.3 | 147.3 | 208.8 | 3.6 | 78.3 | EPF | 49 | ICBC2D20t12L8S1 | 21 | 116.5 | 171.2 | 6.8 | 68.2 | EPF |
| 14 | ICBC1D20t12L8S2 | 53.5 | 169.4 | 255.8 | 6.6 | 76.8 | EPF | 50 | ICBC2D20t12L8S2 | 30.6 | 129.1 | 170.9 | 6 | 70.4 | EPF |
| 15 | ICBC1D20t12L15S1 | 45.6 | 157.4 | 274.3 | 6.1 | 62.5 | EPF | 51 | ICBC2D20t12L15S1 | 22.3 | 127.4 | 199.4 | 9.3 | 78 | EPF |
| 16 | ICBC1D20t12L15S2 | 56 | 180.9 | 265.2 | 5.3 | 68.8 | EPF | 52 | ICBC2D20t12L15S2 | 28.5 | 140.4 | 218.7 | 3.8 | 72.4 | EPF |
| 17 | ICBC1D20t16L8S1 | 57.8 | 179.4 | 218.5 | 7.2 | 71.9 | WCF-CS | 53 | ICBC2D20t16L8S1 | 38.7 | 146.7 | 163.7 | 4.8 | 60.4 | CFF |
| 18 | ICBC1D20t16L8S2 | 62.7 | 189.7 | 276.5 | 5.8 | 56.2 | WEP-BF | 54 | ICBC2D20t16L8S2 | 39.3 | 150.1 | 206.6 | 6.7 | 55.5 | WEP-BF |
| 19 | ICBC1D20t16L15S1 | 52.2 | 165.6 | 240.1 | 4.6 | 53.7 | CFF | 55 | ICBC2D20t16L15S1 | 26.4 | 125.6 | 215.1 | 7 | 69.5 | CFF |
| 20 | ICBC1D20t16L15S2 | 57.6 | 181.8 | 270.6 | 3.4 | 65.4 | EPF | 56 | ICBC2D20t16L15S2 | 42.1 | 142.6 | 248.1 | 4.8 | 63.6 | CPZB |
| 21 | ICBC1D20t20L8S1 | 63.2 | 187.8 | 285.7 | 8.3 | 65.1 | CFF | 57 | ICBC2D20t20L8S1 | 35.3 | 144.1 | 201.3 | 7.6 | 56.8 | WCF-CS |
| 22 | ICBC1D20t20L8S2 | 65.1 | 189.7 | 253 | 7.9 | 63 | WEP-BF | 58 | ICBC2D20t20L8S2 | 32.1 | 142.1 | 212.2 | 5 | 54.8 | WEP-BF |
| 23 | ICBC1D20t20L15S1 | 61.8 | 199.4 | 290.6 | 7.7 | 53 | CPZB | 59 | ICBC2D20t20L15S1 | 41 | 153.2 | 259.4 | 8.2 | 51.6 | CPZB |
| 24 | ICBC1D20t20L15S2 | 65.9 | 211.2 | 295.5 | 8.8 | 56.9 | CPZB | 60 | ICBC2D20t20L15S2 | 36.4 | 163.9 | 207.1 | 4 | 65.5 | CPZB |
| 25 | ICBC1D24t12L8S1 | 39.1 | 155.9 | 202.4 | 7.4 | 73.9 | EPF | 61 | ICBC2D24t12L8S1 | 18.8 | 125.1 | 198.7 | 4.7 | 60.7 | EPF |
| 26 | ICBC1D24t12L8S2 | 41.9 | 168.9 | 257.9 | 9 | 75.1 | EPF | 62 | ICBC2D24t12L8S2 | 30.3 | 130 | 187.4 | 3.2 | 57.8 | EPF |
| 27 | ICBC1D24t12L15S1 | 45.2 | 163.8 | 247.4 | 7.1 | 78.9 | EPF | 63 | ICBC2D24t12L15S1 | 25.2 | 122.3 | 215.1 | 7.5 | 72.7 | EPF |
| 28 | ICBC1D24t12L15S2 | 46.8 | 178.2 | 258.3 | 4 | 77 | EPF | 64 | ICBC2D24t12L15S2 | 30.9 | 135.1 | 205.3 | 9.1 | 70.3 | EPF |
| 29 | ICBC1D24t16L8S1 | 60.2 | 178.8 | 253.9 | 5.6 | 62.7 | WCF-CS | 65 | ICBC2D24t16L8S1 | 31 | 137.5 | 191.9 | 2.9 | 59.8 | WEP-BF |
| 30 | ICBC1D24t16L8S2 | 62.1 | 201 | 289.1 | 5.2 | 61.2 | WEP-BF | 66 | ICBC2D24t16L8S2 | 34.1 | 162.3 | 204 | 4.4 | 58.4 | WCF-CS |
| 31 | ICBC1D24t16L15S1 | 66.1 | 165.8 | 309.6 | 6.1 | 60 | EPF | 67 | ICBC2D24t16L15S1 | 31.5 | 130.9 | 230.8 | 5.9 | 56.4 | WEP-BF |
| 32 | ICBC1D24t16L15S2 | 45.6 | 192.7 | 248.6 | 3.8 | 53.3 | CFF | 68 | ICBC2D24t16L15S2 | 35.1 | 148.2 | 224.2 | 3.1 | 53.6 | CPZB |
| 33 | ICBC1D24t20L8S1 | 72.2 | 189.1 | 285.9 | 6.1 | 67.1 | WCF-CS | 69 | ICBC2D24t20L8S1 | 51.2 | 152.3 | 234.6 | 3.3 | 59.9 | WCF-CS |
| 34 | ICBC1D24t20L8S2 | 71.2 | 203.1 | 284.9 | 4.1 | 64.3 | WEP-BF | 70 | ICBC2D24t20L8S2 | 44 | 156.8 | 231.2 | 8.4 | 55.5 | CFF |
| 35 | ICBC1D24t20L15S1 | 74.4 | 207.6 | 297.2 | 7.3 | 63.7 | CPZB | 71 | ICBC2D24t20L15S1 | 46.2 | 163.2 | 229.7 | 8 | 54.6 | CPZB |
| 36 | ICBC1D24t20L15S2 | 76.5 | 218.6 | 295.7 | 5.5 | 62.4 | CPZB | 72 | ICBC2D24t20L15S2 | 47.1 | 168.3 | 218.2 | 6.9 | 52.6 | CPZB |
| 73 | ECBC1D16t12L8S1 | 22.3 | 99.3 | 154 | 6.4 | 62.9 | EPF | 109 | ECBC2D16t12L8S1 | 22.5 | 66.9 | 112.3 | 8.3 | 54.9 | EPF |
| 74 | ECBC1D16t12L8S2 | 30.6 | 154.2 | 168.4 | 6.7 | 54.2 | EPF | 110 | ECBC2D16t12L8S2 | 31.4 | 115.4 | 163.4 | 6.1 | 52.4 | EPF |
| 75 | ECBC1D16t12L15S1 | 30.7 | 111.9 | 179.3 | 4.4 | 62.7 | EPF | 111 | ECBC2D16t12L15S1 | 21.2 | 71.4 | 126.5 | 5.9 | 55.7 | EPF |
| 76 | ECBC1D16t12L15S2 | 34.5 | 169.4 | 171.2 | 3.6 | 53.3 | EPF | 112 | ECBC2D16t12L15S2 | 27.3 | 140.7 | 214.6 | 6 | 50.7 | EPF |
| 77 | ECBC1D16t16L8S1 | 31.2 | 168.6 | 182.5 | 7.2 | 60.1 | WCF-CS | 113 | ECBC2D16t16L8S1 | 27.8 | 129 | 196.2 | 3.3 | 46.6 | EPF |
| 78 | ECBC1D16t16L8S2 | 31.5 | 176.6 | 189.7 | 9 | 53 | WEP-BF | 114 | ECBC2D16t16L8S2 | 32.7 | 135.6 | 225.3 | 3.5 | 46.1 | WEP-BF |
| 79 | ECBC1D16t16L15S1 | 31.5 | 182.1 | 216.6 | 4.1 | 59 | CFF | 115 | ECBC2D16t16L15S1 | 23.8 | 141.8 | 216.1 | 7.4 | 42.2 | CFF |
| 80 | ECBC1D16t16L15S2 | 34.1 | 172.1 | 210.4 | 7.8 | 56.7 | CFF | 116 | ECBC2D16t16L15S2 | 28.5 | 134.3 | 187.4 | 3.2 | 45.4 | CPZB |
| 81 | ECBC1D16t20L8S1 | 36.9 | 174.2 | 216 | 5 | 55 | BF | 117 | ECBC2D16t20L8S1 | 28.2 | 148.2 | 203.8 | 6.4 | 49.5 | BF |
| 82 | ECBC1D16t20L8S2 | 43.3 | 180.5 | 215 | 6.5 | 50.5 | BF | 118 | ECBC2D16t20L8S2 | 29.2 | 145.4 | 213.2 | 6.9 | 51.1 | BF |
| 83 | ECBC1D16t20L15S1 | 41.9 | 190.3 | 224.6 | 8.6 | 61.6 | BF | 119 | ECBC2D16t20L15S1 | 29.8 | 142.8 | 220 | 5.7 | 45.9 | BF |
| 84 | ECBC1D16t20L15S2 | 45 | 195.6 | 225.2 | 8.7 | 55 | BF | 120 | ECBC2D16t20L15S2 | 33.6 | 141.5 | 223.7 | 8.3 | 40.3 | BF |
| 85 | ECBC1D20t12L8S1 | 27.1 | 145 | 228 | 4.2 | 59.9 | EPF | 121 | ECBC2D20t12L8S1 | 20.2 | 110.7 | 165.5 | 4.2 | 54.8 | EPF |
| 86 | ECBC1D20t12L8S2 | 24.4 | 171.7 | 230.9 | 8.4 | 55.5 | EPF | 122 | ECBC2D20t12L8S2 | 23.8 | 118.5 | 162.7 | 6.3 | 50.8 | EPF |
| 87 | ECBC1D20t12L15S1 | 28 | 164.6 | 225.8 | 8.9 | 47.3 | EPF | 123 | ECBC2D20t12L15S1 | 19.9 | 142.5 | 161.8 | 8.5 | 60.1 | EPF |
| 88 | ECBC1D20t12L15S2 | 28.9 | 171.8 | 275.5 | 8.4 | 55.5 | EPF | 124 | ECBC2D20t12L15S2 | 26.4 | 129.5 | 208.8 | 5.1 | 59.7 | EPF |
| 89 | ECBC1D20t16L8S1 | 38.9 | 181.2 | 283.7 | 6.7 | 56.8 | WEP-BF | 125 | ECBC2D20t16L8S1 | 22.1 | 133.3 | 262.3 | 2.7 | 45.2 | WEP-BF |
| 90 | ECBC1D20t16L8S2 | 41.9 | 186.6 | 317.7 | 7.1 | 41.9 | WEP-BF | 126 | ECBC2D20t16L8S2 | 27.6 | 135.4 | 278.9 | 3.2 | 39.9 | WEP-BF |
| 91 | ECBC1D20t16L15S1 | 28.5 | 165.7 | 233.4 | 2.7 | 44 | EPF | 127 | ECBC2D20t16L15S1 | 27.4 | 122.1 | 197.1 | 8.1 | 50.6 | EPF |
| 92 | ECBC1D20t16L15S2 | 31.2 | 171.6 | 305.2 | 7.3 | 47.2 | EPF | 128 | ECBC2D20t16L15S2 | 31.6 | 134.7 | 208.1 | 7.1 | 51.5 | CFF |
| 93 | ECBC1D20t20L8S1 | 45 | 181.6 | 230 | 6.7 | 47.5 | WEP-BF | 129 | ECBC2D20t20L8S1 | 26.7 | 143.9 | 203.4 | 4.9 | 48.1 | EPF |
| 94 | ECBC1D20t20L8S2 | 43.6 | 182.3 | 235.7 | 4.6 | 47 | WCF-CS | 130 | ECBC2D20t20L8S2 | 29.4 | 139.3 | 183.8 | 3.2 | 42.2 | WCF-CS |
| 95 | ECBC1D20t20L15S1 | 29.8 | 180.4 | 274.8 | 3.1 | 43.5 | CFF | 131 | ECBC2D20t20L15S1 | 29.6 | 151.6 | 201.8 | 6.1 | 41.5 | CPZB |
| 96 | ECBC1D20t20L15S2 | 33.9 | 200 | 233.1 | 3.6 | 46.5 | CPZB | 132 | ECBC2D20t20L15S2 | 32.3 | 161.5 | 182.5 | 7.1 | 50.4 | WCF-CS |
| 97 | ECBC1D24t12L8S1 | 22.3 | 141.3 | 229.4 | 4.8 | 55.6 | EPF | 133 | ECBC2D24t12L8S1 | 21.1 | 121.5 | 175.9 | 5 | 50 | EPF |
| 98 | ECBC1D24t12L8S2 | 21.4 | 164.4 | 245.3 | 6.3 | 60 | EPF | 134 | ECBC2D24t12L8S2 | 27.3 | 126.5 | 179.4 | 7.1 | 42.3 | EPF |
| 99 | ECBC1D24t12L15S1 | 22.9 | 162.3 | 223.2 | 9 | 59.4 | EPF | 135 | ECBC2D24t12L15S1 | 30.2 | 113 | 196.1 | 5.9 | 53.9 | EPF |
| 100 | ECBC1D24t12L15S2 | 29.6 | 176.5 | 251.6 | 5 | 58.9 | EPF | 136 | ECBC2D24t12L15S2 | 32.5 | 127.6 | 220 | 8.4 | 53.9 | EPF |
| 101 | ECBC1D24t16L8S1 | 36.2 | 165.2 | 263.2 | 7.6 | 47.2 | EPF | 137 | ECBC2D24t16L8S1 | 22.5 | 129.9 | 214.4 | 2.7 | 45.1 | EPF |
| 102 | ECBC1D24t16L8S2 | 39.3 | 193.7 | 302.7 | 3.6 | 47.3 | WEP-BF | 138 | ECBC2D24t16L8S2 | 28.7 | 148.3 | 239.6 | 7.1 | 49.5 | WEP-BF |
| 103 | ECBC1D24t16L15S1 | 36.8 | 161.5 | 271.1 | 7.4 | 45 | CPZB | 139 | ECBC2D24t16L15S1 | 32.9 | 127.7 | 209.6 | 7.1 | 45.7 | EPF |
| 104 | ECBC1D24t16L15S2 | 48.1 | 182 | 288.3 | 7.2 | 40.7 | CFF | 140 | ECBC2D24t16L15S2 | 34.8 | 140.5 | 202.8 | 3.6 | 43.7 | WCF-CS |
| 105 | ECBC1D24t20L8S1 | 48.2 | 187 | 300.2 | 3.7 | 51 | WEP-BF | 141 | ECBC2D24t20L8S1 | 30.1 | 148 | 210.2 | 3.4 | 47.8 | CFF |
| 106 | ECBC1D24t20L8S2 | 51.1 | 195.4 | 289.8 | 6.6 | 49 | WCF-CS | 142 | ECBC2D24t20L8S2 | 33.6 | 148.1 | 213.9 | 8.9 | 40.8 | CFF |
| 107 | ECBC1D24t20L15S1 | 55.2 | 202 | 276.9 | 4.2 | 47.2 | CPZB | 143 | ECBC2D24t20L15S1 | 31.3 | 159.7 | 268.8 | 6.5 | 44 | CPZB |
| 108 | ECBC1D24t20L15S2 | 56.2 | 209.8 | 306.5 | 4.6 | 47.3 | WEP-BF | 144 | ECBC2D24t20L15S2 | 32.9 | 156.6 | 267.4 | 9 | 39.3 | WCF-CS |
| Specimen | Component Model-Ktheory | Test-KTest | FE-KFE(all) | Ratio Ktheory/KTest | Ratio Ktheory/KFE(all) |
|---|---|---|---|---|---|
| (kN·m/mrad) | |||||
| IC-EP1/west | 51.5 | 55.8 | 57.8 | 0.92 | 0.99 |
| IC-EP2/west | 68.9 | 63.3 | 64.9 | 1.09 | 0.92 |
| IC-EP3/west | 47.1 | 43.3 | 44.9 | 1.09 | 1.05 |
| EC-EP1 | 26.3 | 25.7 | 26.3 | 1.02 | 0.94 |
| EC-EP2 | 31.9 | 27.6 | 30.8 | 1.16 | 1.04 |
| EC-EP3 | 23.4 | 21.7 | 22.8 | 1.08 | 1.03 |
| Model Num | Kji (kN·m/mrad) | Δ (%) | Model Num | Kji (kN·m/mrad) | Δ (%) | Model Num | Kji (kN·m/mrad) | Δ (%) | Model Num | Kji (kN·m/mrad) | Δ (%) | Model Num | Kji (kN·m/mrad) | Δ (%) | Model Num | Kji (kN·m/mrad) | Δ (%) | ||||||
|---|---|---|---|---|---|---|---|---|---|---|---|---|---|---|---|---|---|---|---|---|---|---|---|
| FE | Theory | FE | Theory | FE | Theory | FE | Theory | FE | Theory | FE | Theory | ||||||||||||
| 001 | 47.7 | 51.2 | 7.3 | 025 | 39.1 | 38.9 | 0.5 | 049 | 21.0 | 22.0 | 4.8 | 073 | 22.3 | 26.2 | 17.5 | 097 | 22.3 | 26.4 | 18.4 | 121 | 20.2 | 20.4 | 1.0 |
| 002 | 52.4 | 55.5 | 5.9 | 026 | 41.9 | 44.1 | 5.3 | 050 | 30.6 | 31.6 | 3.3 | 074 | 30.6 | 35.3 | 15.4 | 098 | 21.4 | 25.1 | 17.3 | 122 | 23.8 | 25.0 | 5.0 |
| 003 | 52.7 | 51.2 | 2.8 | 027 | 45.2 | 38.9 | 13.9 | 051 | 22.3 | 22.0 | 1.3 | 075 | 30.7 | 26.2 | 14.7 | 099 | 22.9 | 26.4 | 15.3 | 123 | 19.9 | 20.4 | 2.5 |
| 004 | 61.9 | 55.5 | 10.3 | 028 | 46.8 | 44.1 | 5.8 | 052 | 28.5 | 31.6 | 10.9 | 076 | 34.5 | 35.3 | 2.3 | 100 | 29.6 | 25.1 | 15.2 | 124 | 26.4 | 25.0 | 5.3 |
| 005 | 63.1 | 66.9 | 6.0 | 029 | 60.2 | 68.9 | 14.5 | 053 | 38.7 | 31.7 | 18.1 | 077 | 31.2 | 31.7 | 1.6 | 101 | 36.2 | 34.0 | 6.1 | 125 | 22.1 | 23.5 | 6.3 |
| 006 | 69.6 | 70.6 | 1.4 | 030 | 62.1 | 66.3 | 6.8 | 054 | 39.3 | 37.1 | 5.6 | 078 | 31.5 | 36.8 | 16.8 | 102 | 39.3 | 44.1 | 12.2 | 126 | 27.6 | 31.0 | 12.3 |
| 007 | 71.2 | 66.9 | 6.0 | 031 | 66.1 | 68.9 | 4.2 | 055 | 26.4 | 31.7 | 20.1 | 079 | 31.5 | 31.7 | 0.6 | 103 | 36.8 | 34.0 | 7.6 | 127 | 27.4 | 23.5 | 14.2 |
| 008 | 71.7 | 70.6 | 1.5 | 032 | 45.6 | 46.3 | 1.5 | 056 | 42.1 | 37.1 | 11.9 | 080 | 34.1 | 36.8 | 7.9 | 104 | 48.1 | 44.1 | 8.3 | 128 | 31.6 | 31.0 | 1.9 |
| 009 | 87.5 | 93.9 | 7.3 | 033 | 72.2 | 78.9 | 9.3 | 057 | 35.3 | 37.4 | 5.9 | 081 | 36.9 | 34.4 | 6.8 | 105 | 48.2 | 48.7 | 1.0 | 129 | 26.7 | 26.9 | 0.7 |
| 010 | 90.1 | 98.0 | 8.8 | 034 | 71.2 | 77.2 | 8.4 | 058 | 32.1 | 35.6 | 10.9 | 082 | 43.3 | 37.4 | 13.6 | 106 | 51.1 | 49.4 | 3.3 | 130 | 29.4 | 31.4 | 6.8 |
| 011 | 91.2 | 93.9 | 3.0 | 035 | 74.4 | 78.9 | 6.0 | 059 | 41.0 | 37.4 | 8.8 | 083 | 41.9 | 34.4 | 17.9 | 107 | 55.2 | 48.7 | 11.8 | 131 | 29.6 | 26.9 | 9.1 |
| 012 | 94.6 | 98.0 | 3.6 | 036 | 76.5 | 77.2 | 0.9 | 060 | 36.4 | 35.6 | 2.2 | 084 | 45.0 | 37.4 | 16.9 | 108 | 56.2 | 49.4 | 12.1 | 132 | 32.3 | 31.4 | 2.8 |
| 013 | 49.3 | 51.5 | 4.5 | 037 | 25.9 | 22.0 | 15.1 | 061 | 18.8 | 22.1 | 17.6 | 085 | 27.1 | 26.3 | 3.0 | 109 | 22.5 | 20.3 | 9.8 | 133 | 21.1 | 24.4 | 15.6 |
| 014 | 53.5 | 65.9 | 23.2 | 038 | 36.8 | 35.3 | 4.1 | 062 | 30.3 | 31.6 | 4.3 | 086 | 24.4 | 26.0 | 6.6 | 110 | 31.4 | 29.5 | 6.1 | 134 | 27.3 | 29.9 | 9.5 |
| 015 | 45.6 | 51.5 | 12.9 | 039 | 25.0 | 22.0 | 12.0 | 063 | 25.2 | 22.1 | 12.3 | 087 | 28.0 | 26.3 | 6.1 | 111 | 21.2 | 20.3 | 4.2 | 135 | 30.2 | 24.4 | 19.2 |
| 012 | 56.0 | 65.9 | 17.7 | 040 | 40.9 | 35.3 | 13.7 | 064 | 30.9 | 31.6 | 2.3 | 088 | 28.9 | 26.0 | 10.0 | 112 | 27.3 | 29.5 | 8.1 | 136 | 32.5 | 29.9 | 8.0 |
| 017 | 57.8 | 77.7 | 34.4 | 041 | 44.1 | 45.6 | 3.4 | 065 | 31.0 | 28.8 | 7.1 | 089 | 38.9 | 31.9 | 18.0 | 113 | 27.8 | 23.4 | 15.8 | 137 | 22.5 | 23.5 | 4.4 |
| 018 | 62.7 | 66.9 | 6.7 | 042 | 43.9 | 46.7 | 6.4 | 066 | 34.1 | 37.1 | 8.8 | 090 | 41.9 | 37.5 | 10.5 | 114 | 32.7 | 30.5 | 6.7 | 138 | 28.7 | 31.0 | 8.0 |
| 019 | 52.2 | 51.5 | 1.3 | 043 | 47.8 | 45.6 | 4.6 | 067 | 31.5 | 28.8 | 8.6 | 091 | 28.5 | 26.3 | 7.7 | 115 | 23.8 | 23.4 | 1.7 | 139 | 32.9 | 23.5 | 28.6 |
| 020 | 57.6 | 66.9 | 16.1 | 044 | 45.1 | 46.7 | 3.5 | 068 | 35.1 | 37.1 | 5.7 | 092 | 31.2 | 37.5 | 20.2 | 112 | 28.5 | 30.5 | 7.0 | 140 | 34.8 | 31.0 | 10.9 |
| 021 | 63.2 | 51.5 | 18.5 | 045 | 36.5 | 45.3 | 24.1 | 069 | 51.2 | 47.4 | 7.4 | 093 | 45.0 | 41.6 | 7.6 | 117 | 28.2 | 27.8 | 1.4 | 141 | 30.1 | 28.9 | 4.0 |
| 022 | 65.1 | 66.7 | 2.5 | 046 | 55.6 | 57.2 | 2.9 | 070 | 44.0 | 47.6 | 8.2 | 094 | 43.6 | 38.1 | 12.6 | 118 | 29.2 | 30.9 | 5.8 | 142 | 33.6 | 31.4 | 6.5 |
| 023 | 61.8 | 51.5 | 16.7 | 047 | 54.3 | 45.3 | 16.6 | 071 | 46.2 | 47.4 | 2.6 | 095 | 29.8 | 31.9 | 7.0 | 119 | 29.8 | 27.8 | 6.7 | 143 | 31.3 | 28.9 | 7.7 |
| 024 | 65.9 | 66.7 | 1.2 | 048 | 57.0 | 57.2 | 0.4 | 072 | 47.1 | 47.6 | 1.1 | 096 | 33.9 | 38.1 | 12.4 | 120 | 33.6 | 30.9 | 8.0 | 144 | 32.9 | 31.4 | 4.6 |
Publisher’s Note: MDPI stays neutral with regard to jurisdictional claims in published maps and institutional affiliations. |
© 2020 by the authors. Licensee MDPI, Basel, Switzerland. This article is an open access article distributed under the terms and conditions of the Creative Commons Attribution (CC BY) license (http://creativecommons.org/licenses/by/4.0/).
Share and Cite
Luo, L.; Du, M.; Yuan, J.; Shi, J.; Yu, S.; Zhang, Y. Parametric Analysis and Stiffness Investigation of Extended End-Plate Connection. Materials 2020, 13, 5133. https://doi.org/10.3390/ma13225133
Luo L, Du M, Yuan J, Shi J, Yu S, Zhang Y. Parametric Analysis and Stiffness Investigation of Extended End-Plate Connection. Materials. 2020; 13(22):5133. https://doi.org/10.3390/ma13225133
Chicago/Turabian StyleLuo, Liang, Maohua Du, Jian Yuan, Jun Shi, Suhui Yu, and Yi Zhang. 2020. "Parametric Analysis and Stiffness Investigation of Extended End-Plate Connection" Materials 13, no. 22: 5133. https://doi.org/10.3390/ma13225133
APA StyleLuo, L., Du, M., Yuan, J., Shi, J., Yu, S., & Zhang, Y. (2020). Parametric Analysis and Stiffness Investigation of Extended End-Plate Connection. Materials, 13(22), 5133. https://doi.org/10.3390/ma13225133