Selected Physicochemical Properties of Diamond Like Carbon (DLC) Coating on Ti-13Nb-13Zr Alloy Used for Blood Contacting Implants

 ,
,  , , ,
, , ,
Abstract
1. Introduction
2. Materials and Methods
- Mechanical treatment by abrasive blasting (sand-blasting with SiO2 beads with a grit of 50 µm, t = 5 min, p = 4 atm),
- Mechanical treatment (polishing using a SiO2 solution on abrasive paper with a grit of 1200 grains/mm2)
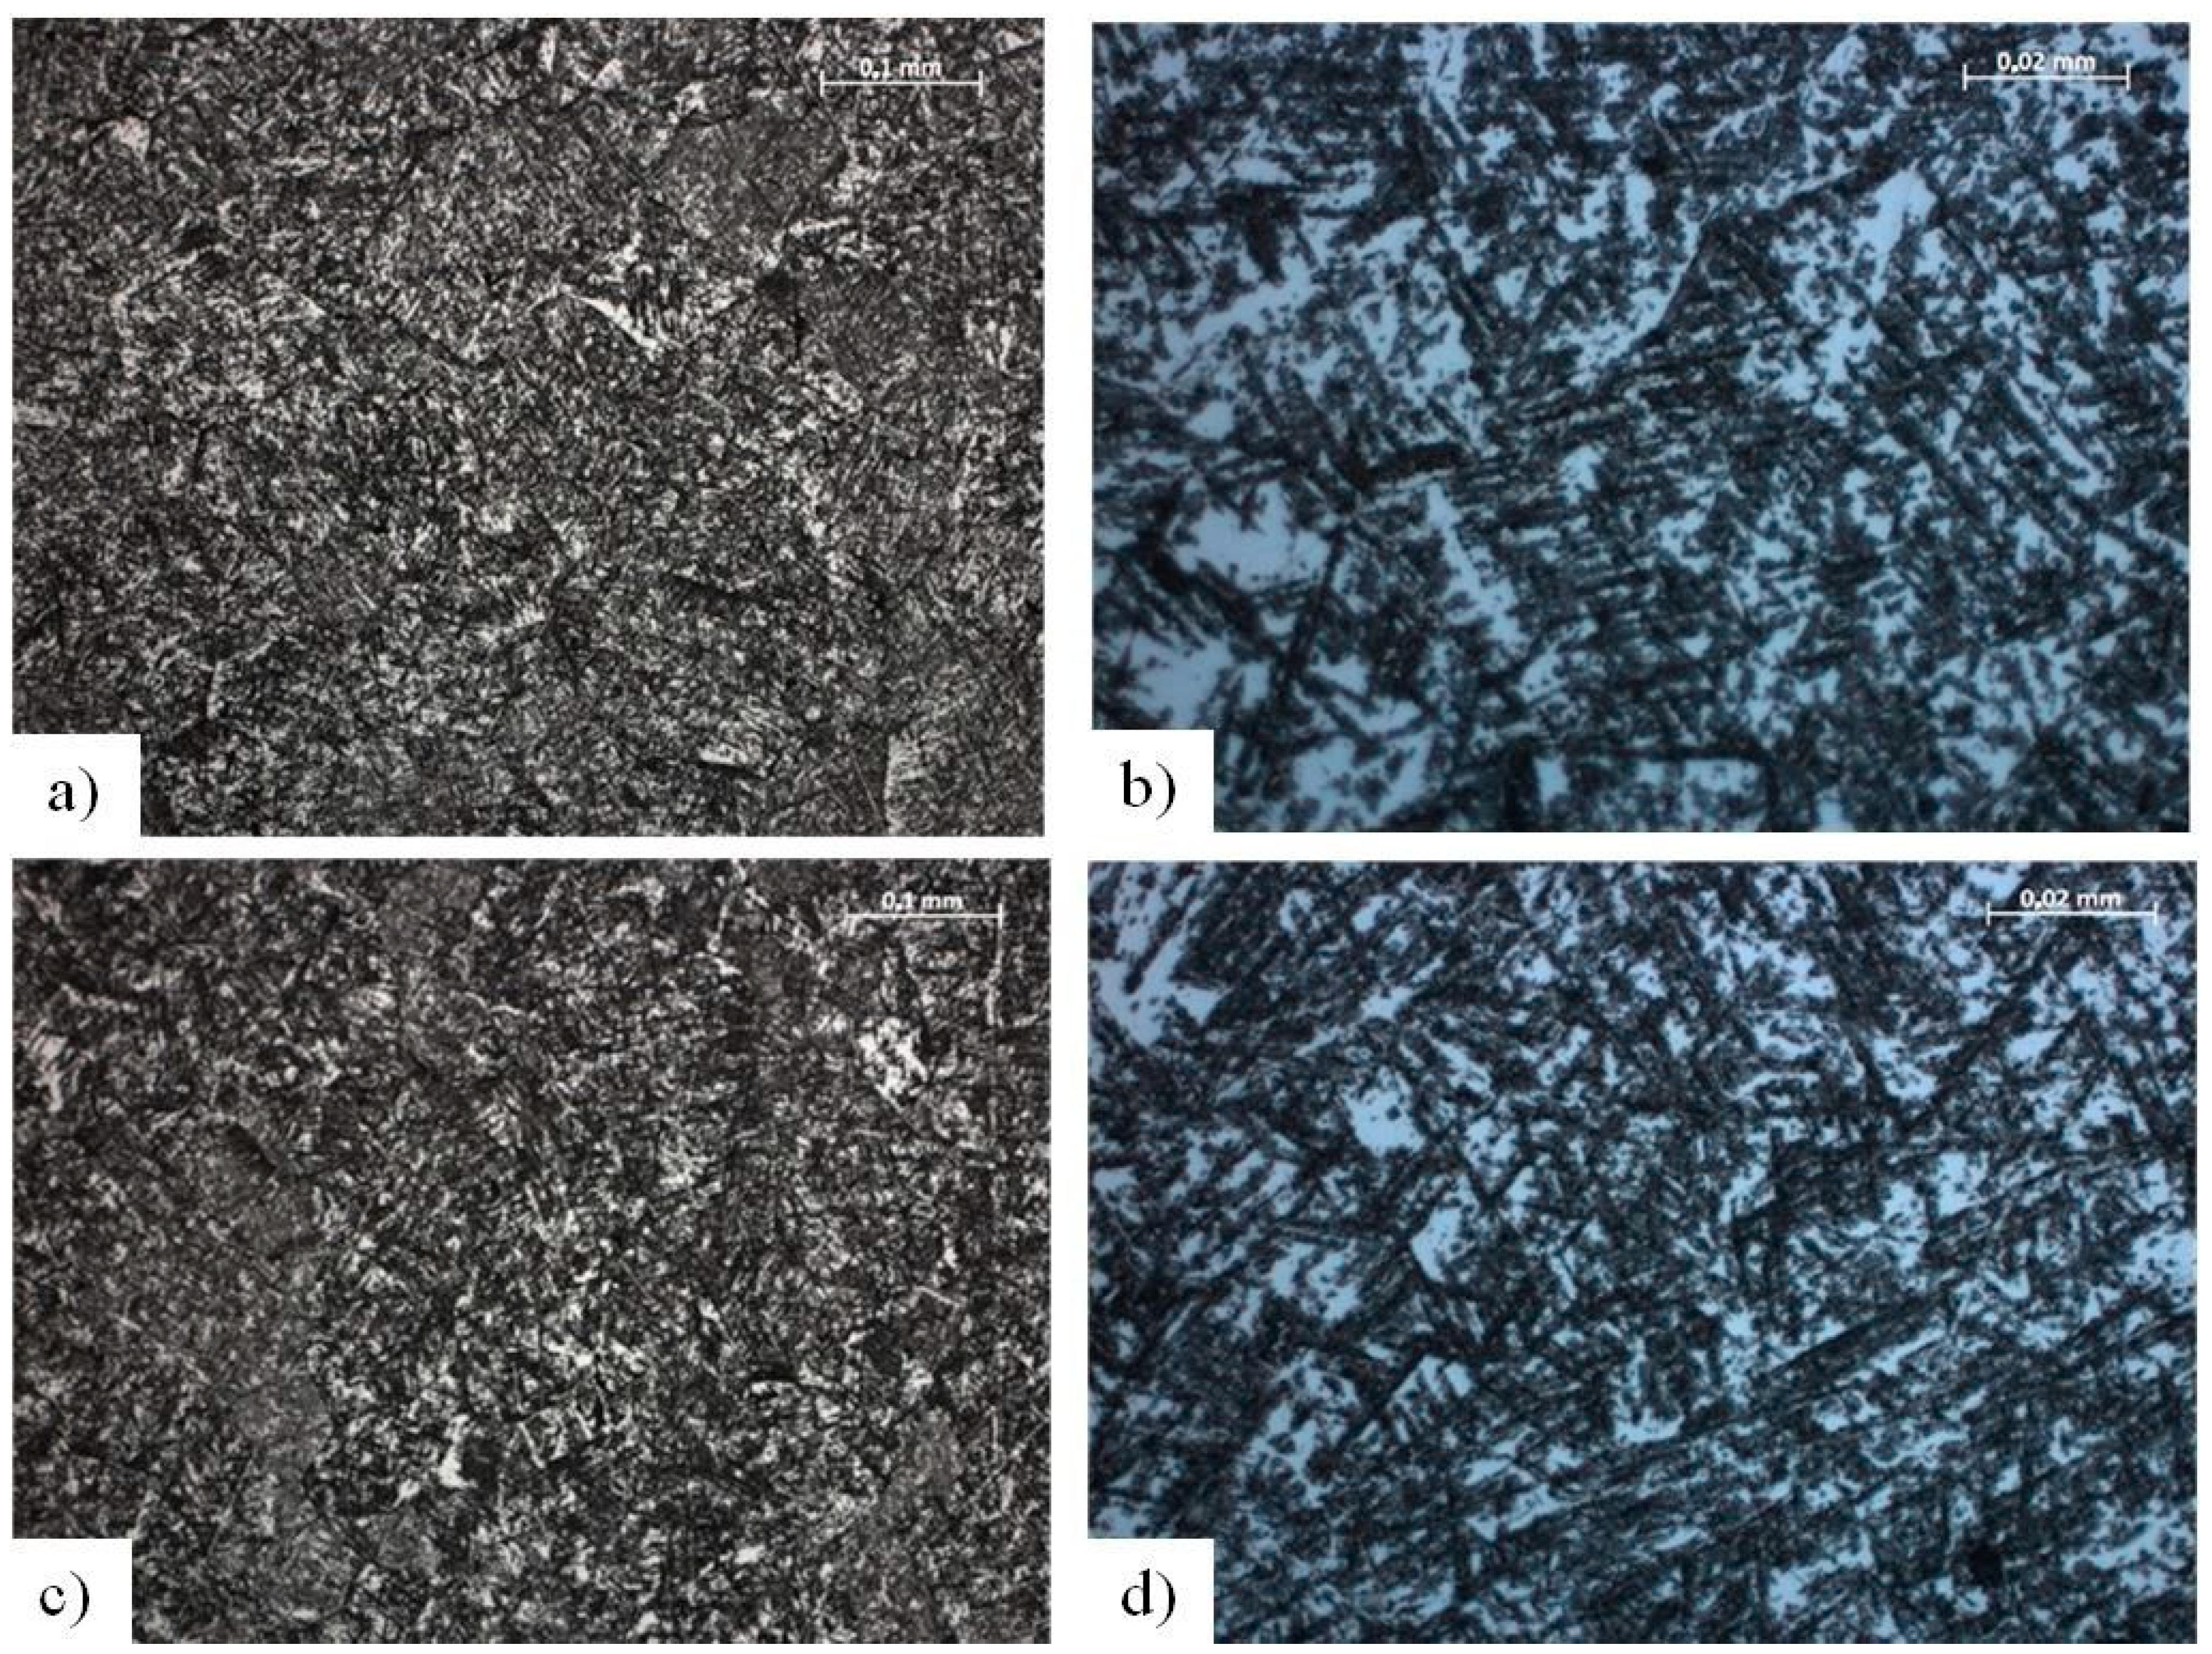
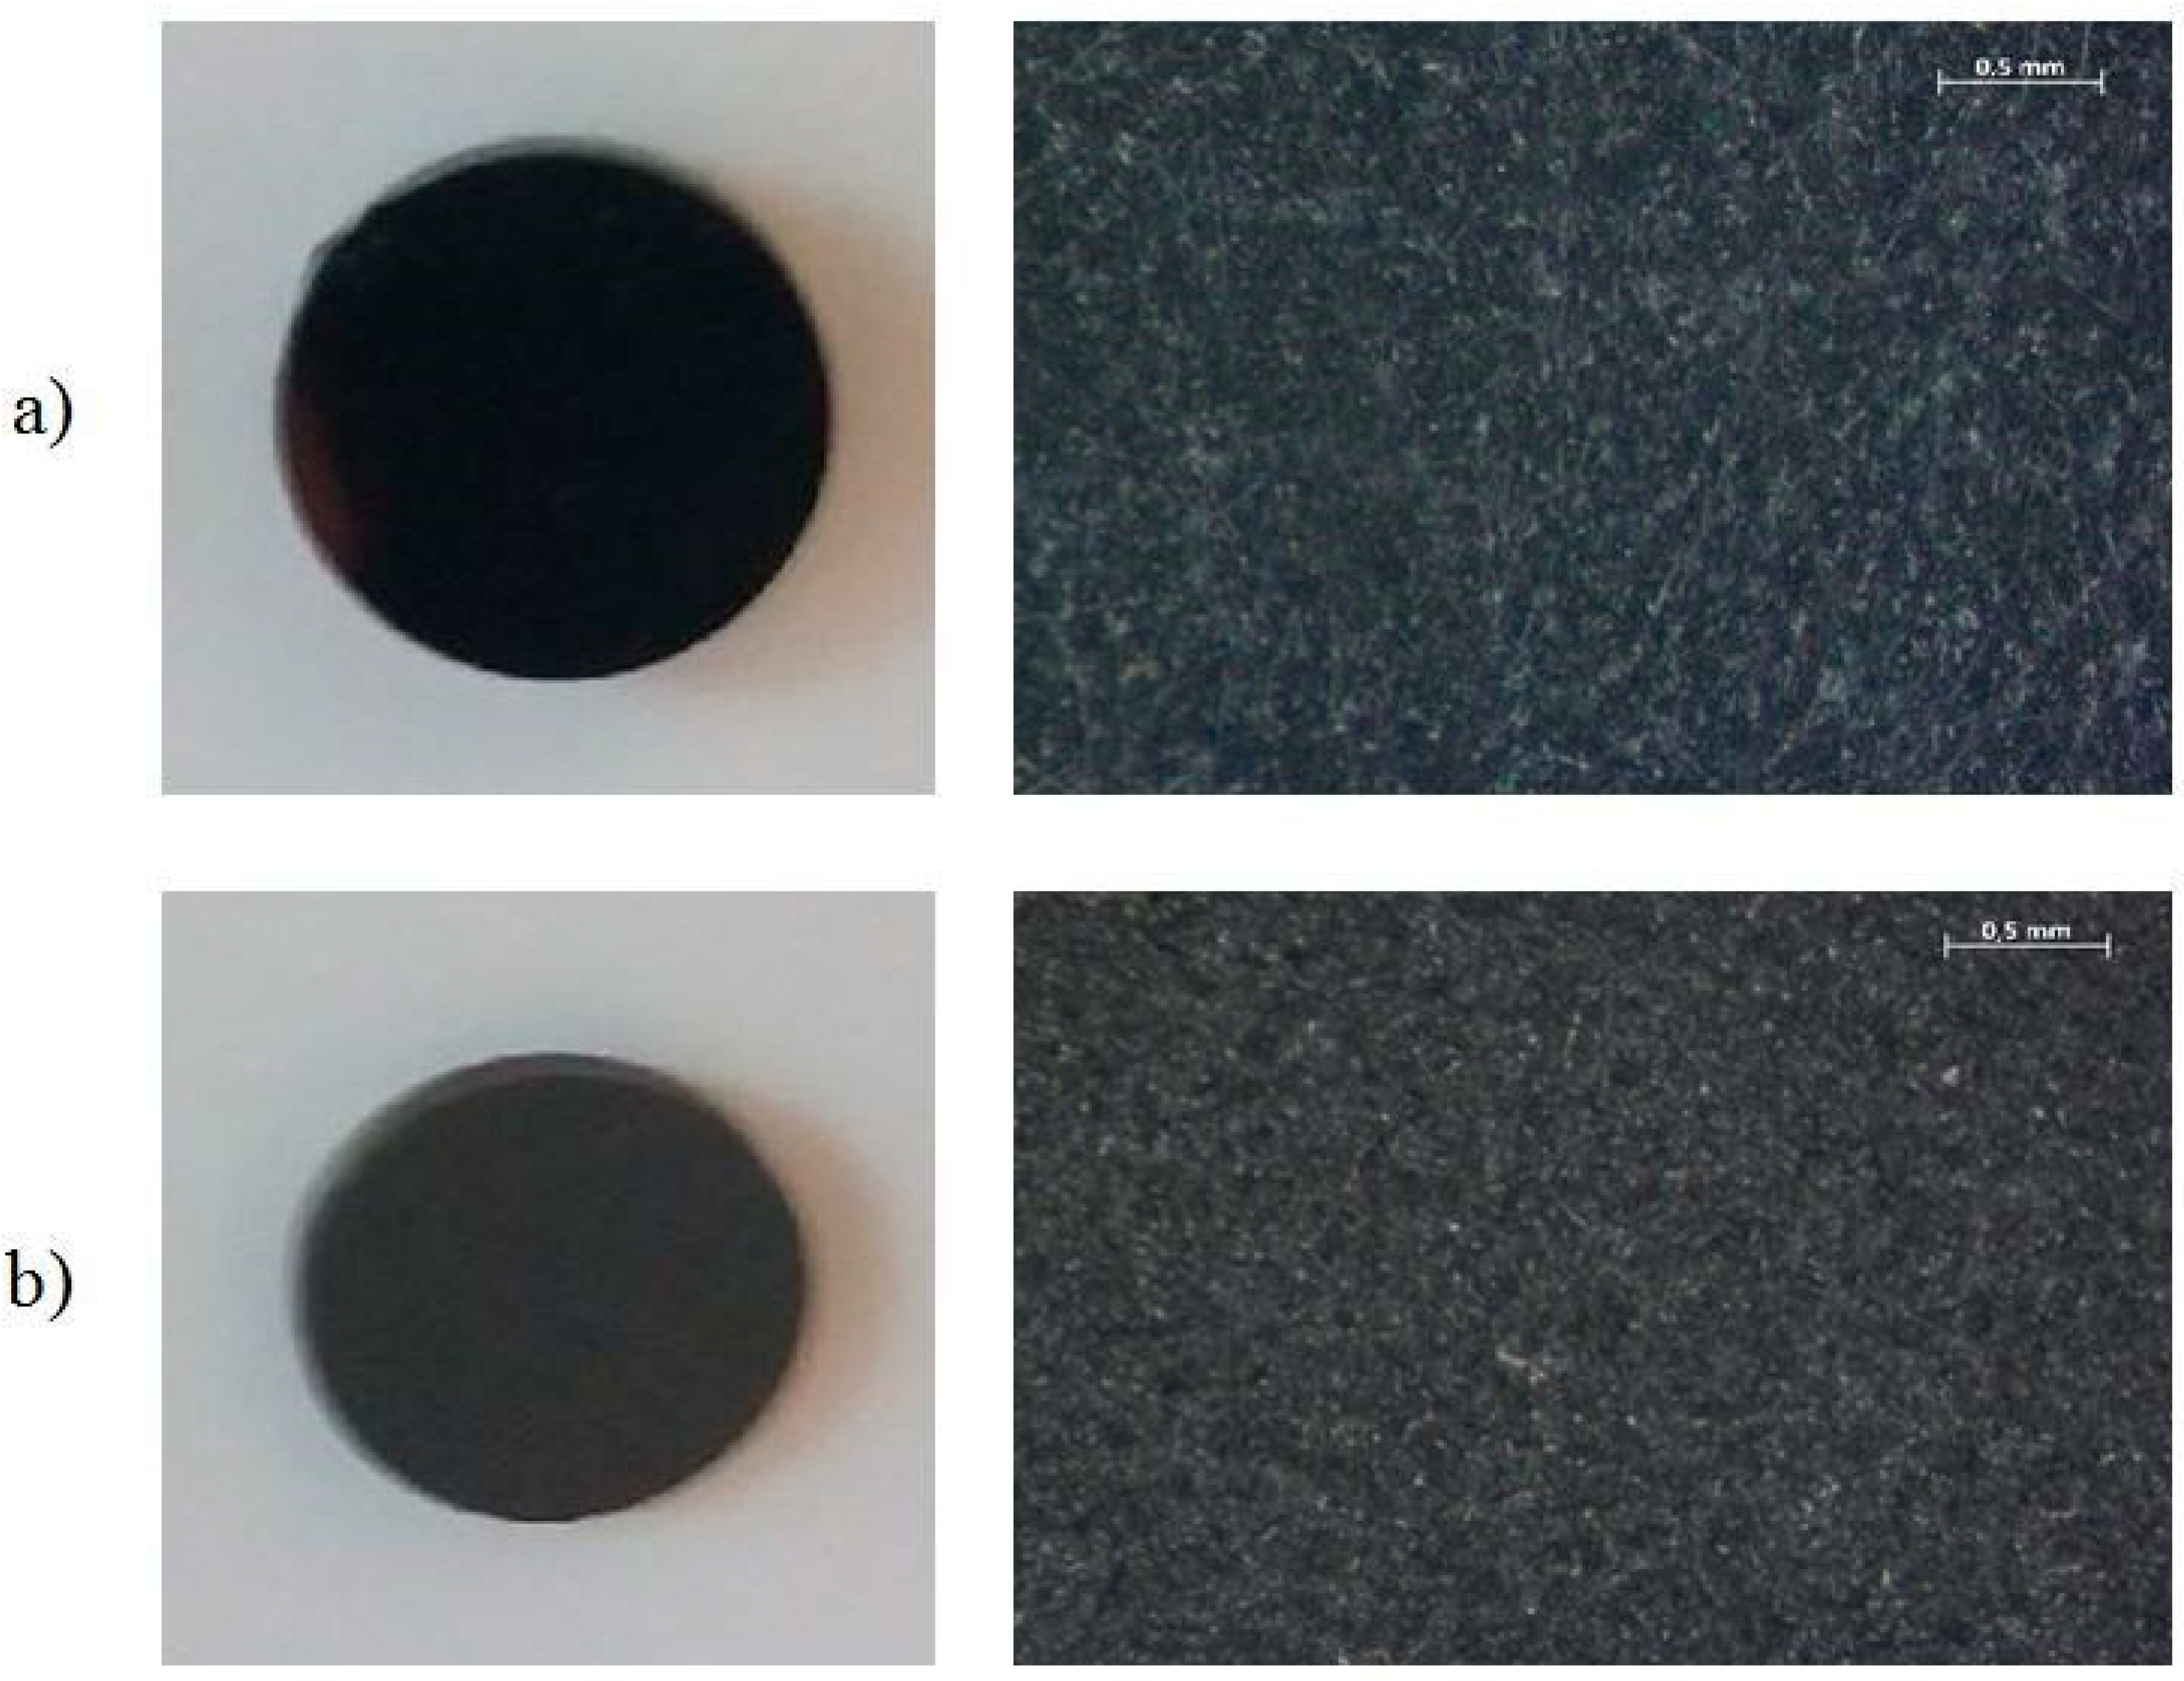
2.1. Surface Morphology
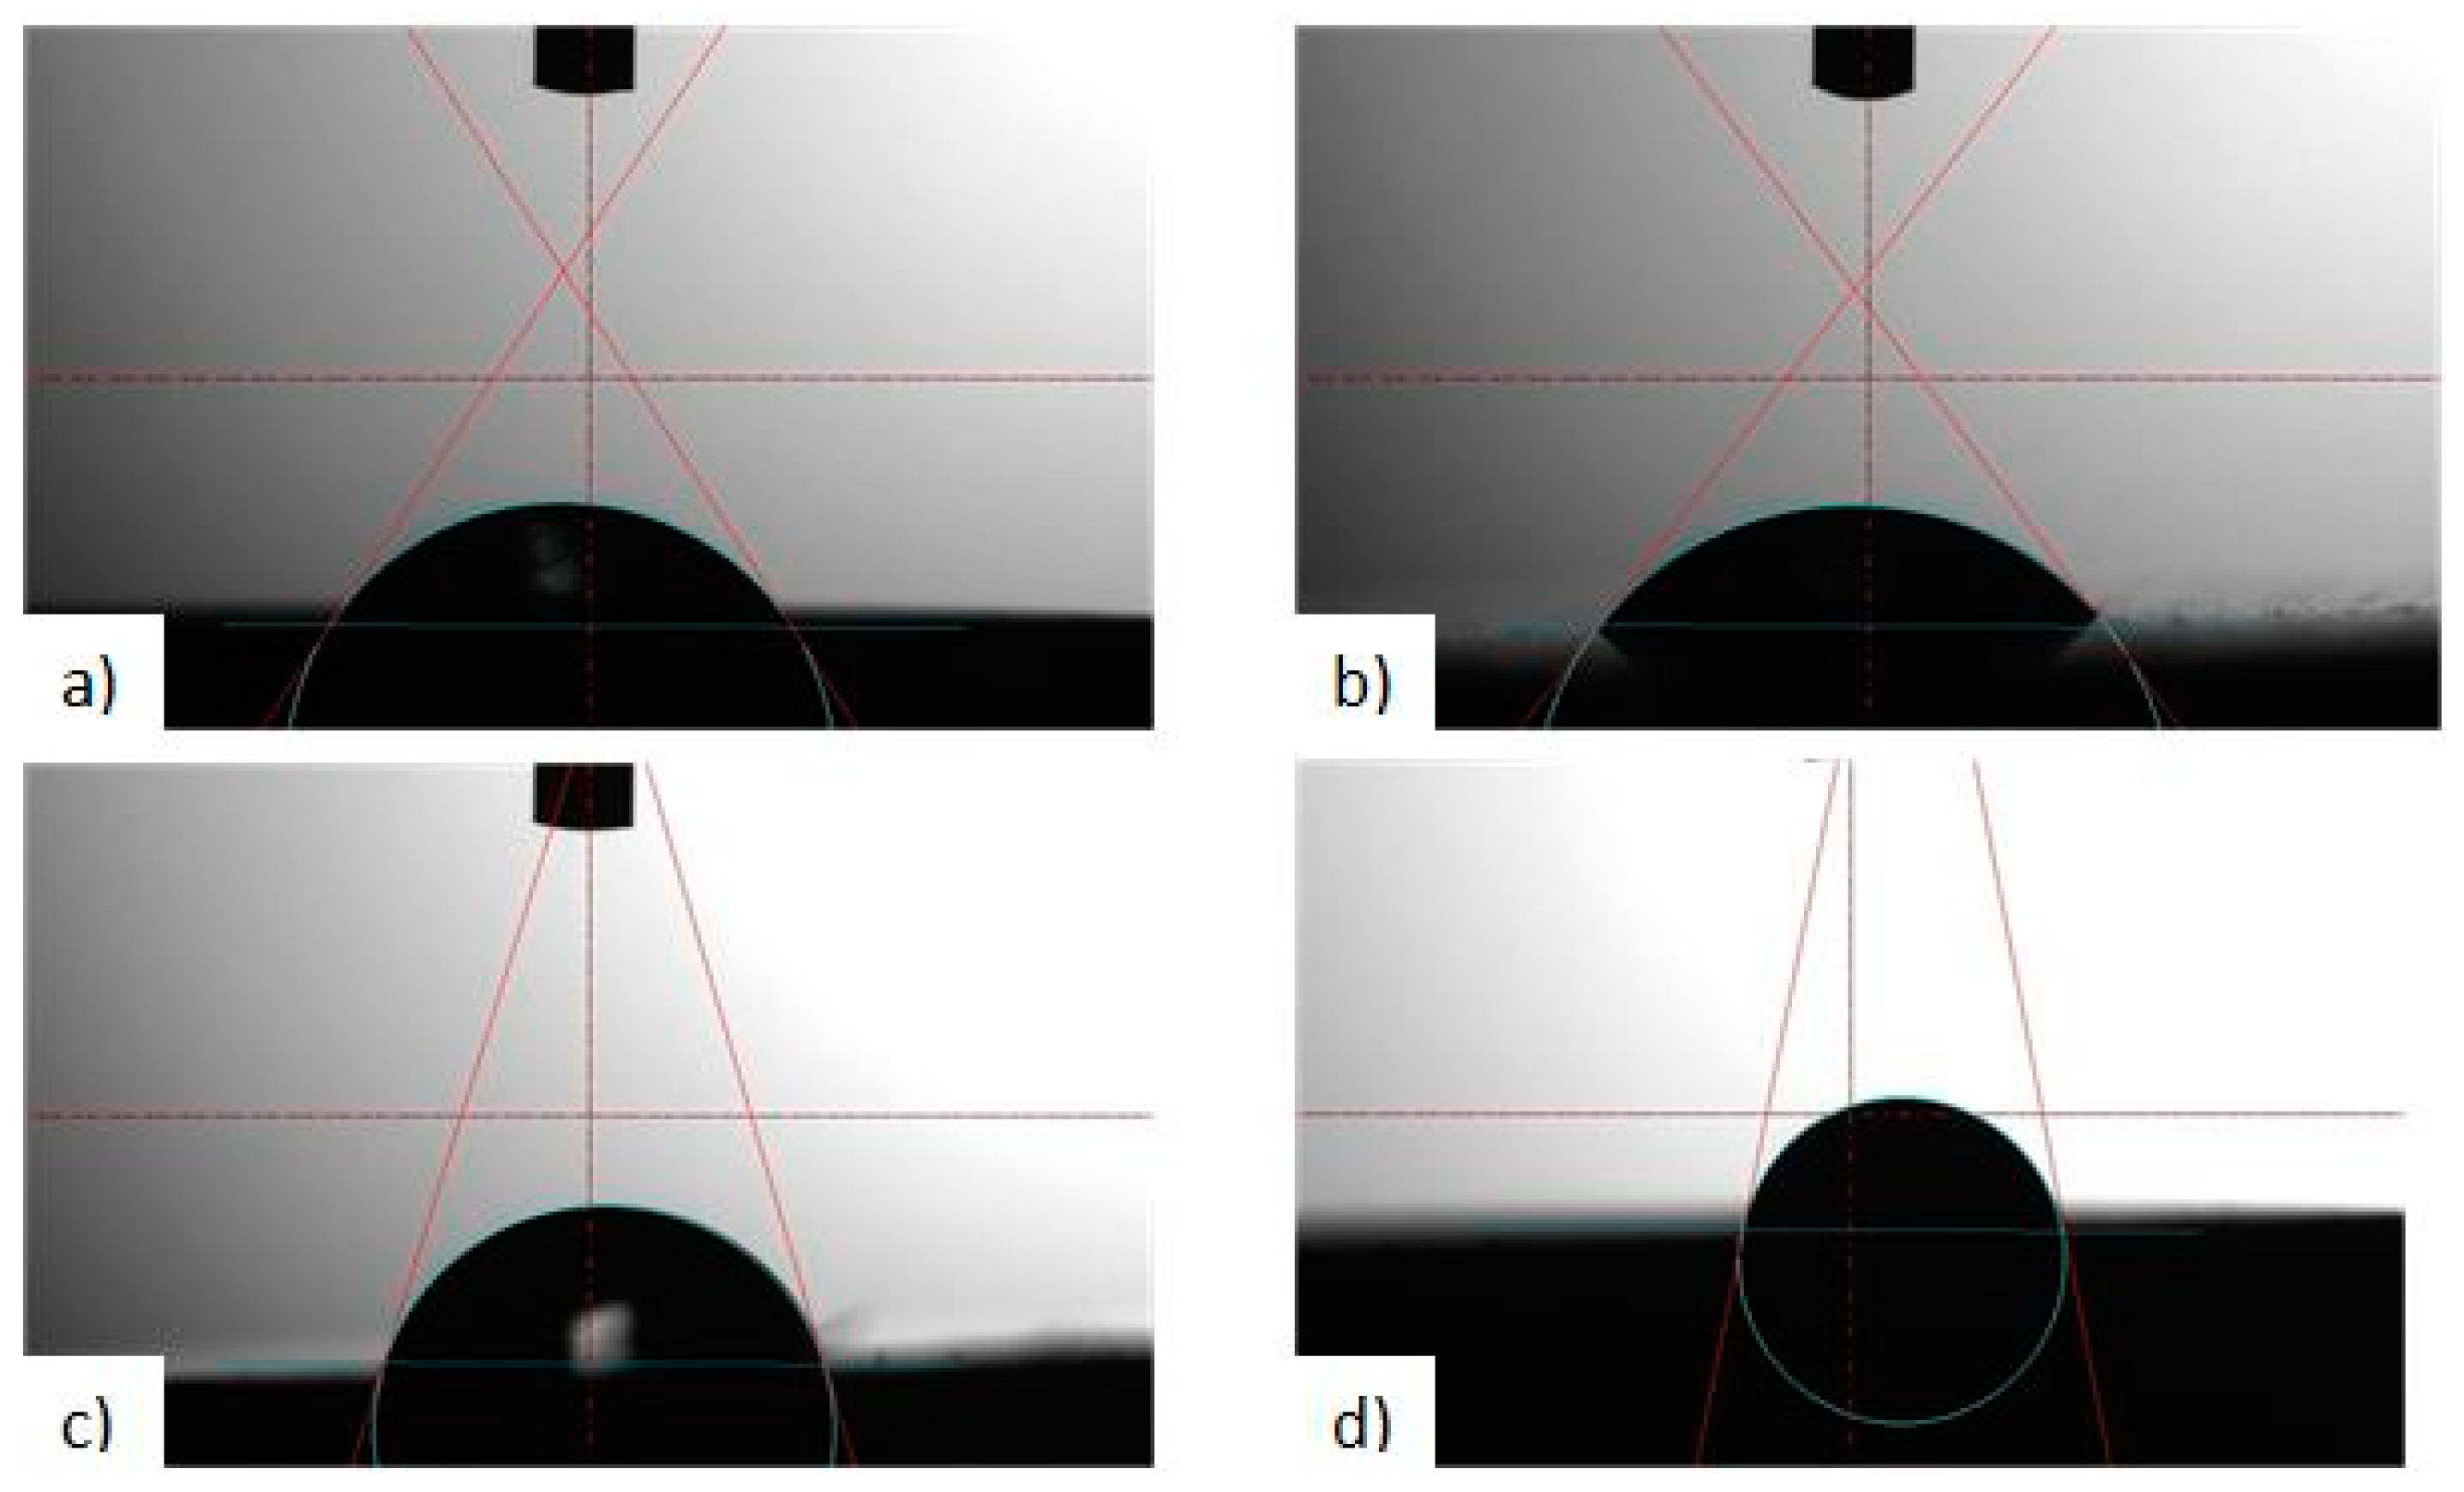
2.2. Surface Wettability
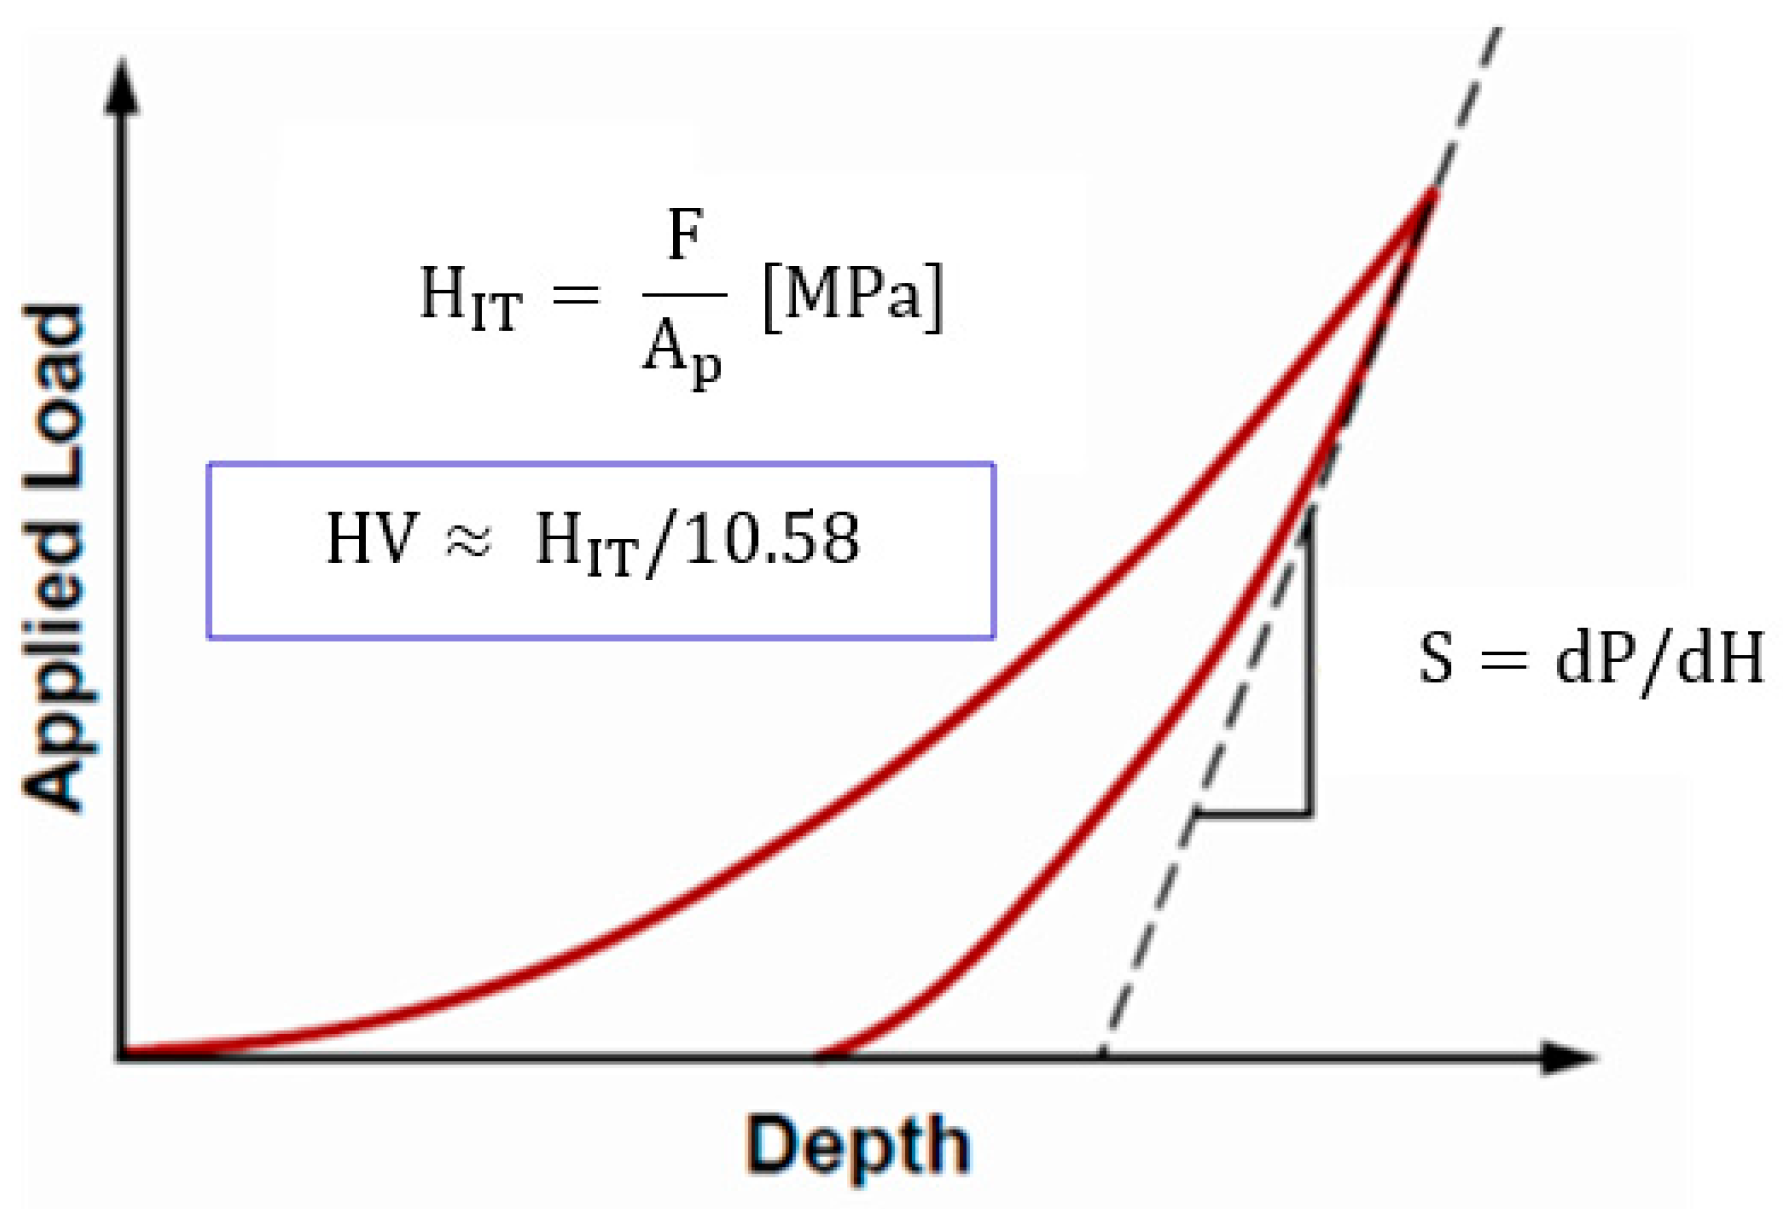
2.3. Mechanical Properties
2.3.1. Hardness
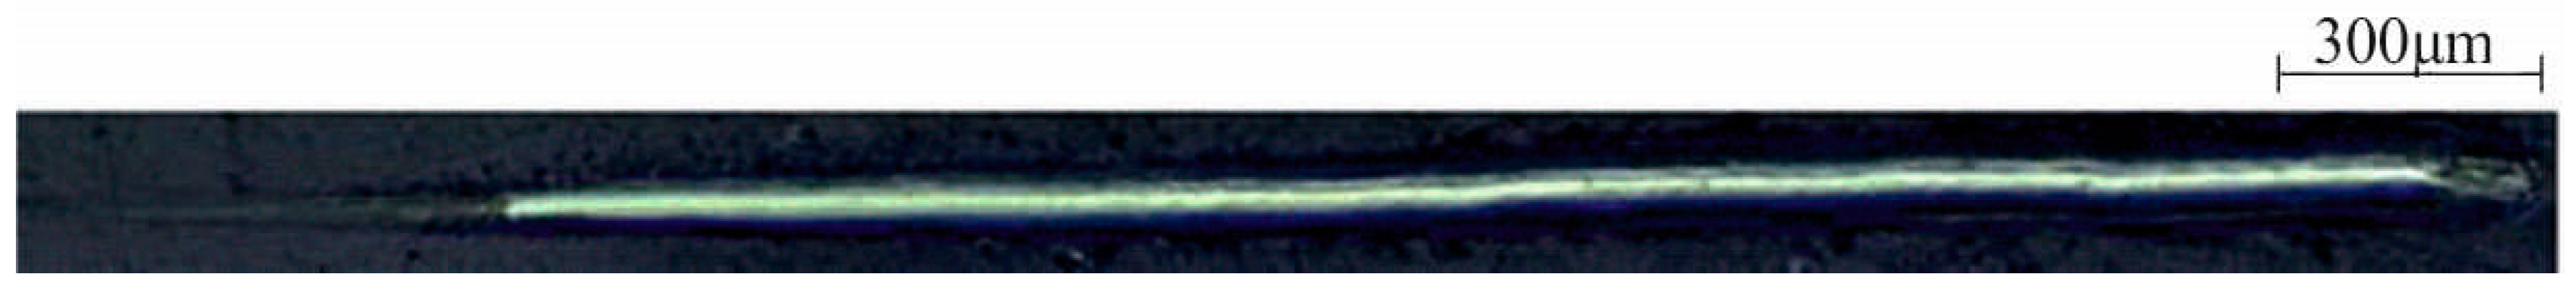
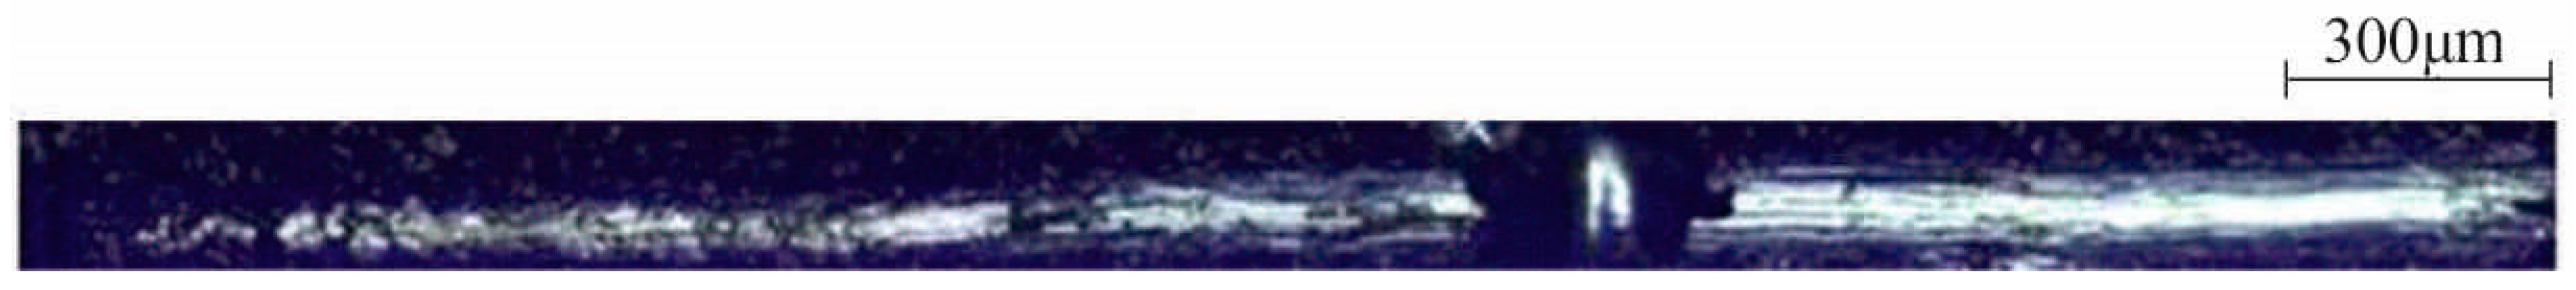
2.3.2. Scratch Test
2.4. Electrochemical Properties
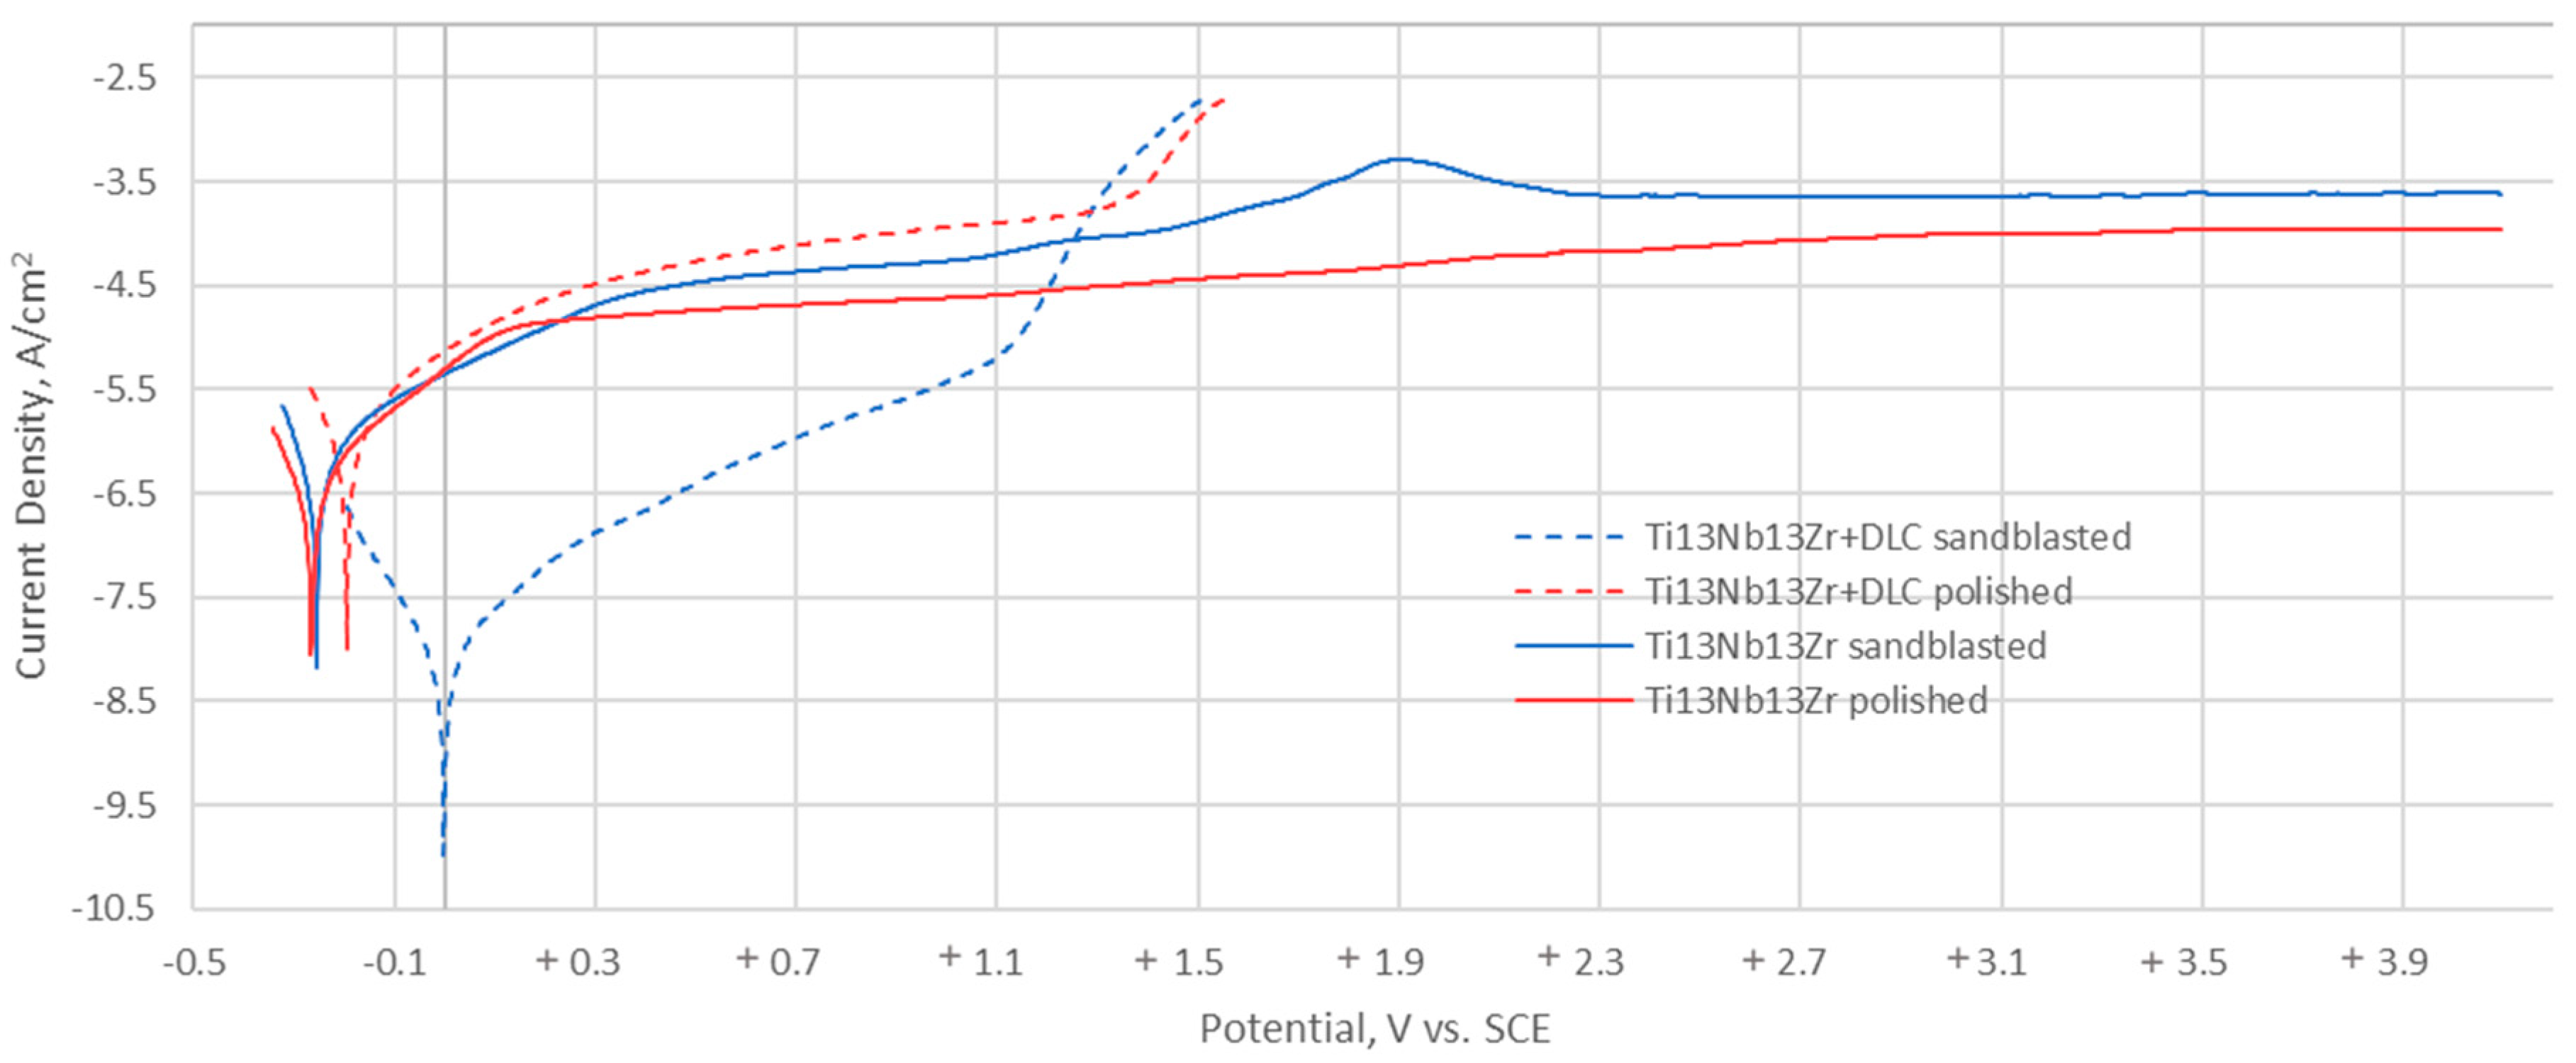
2.4.1. Potentiodynamic Test
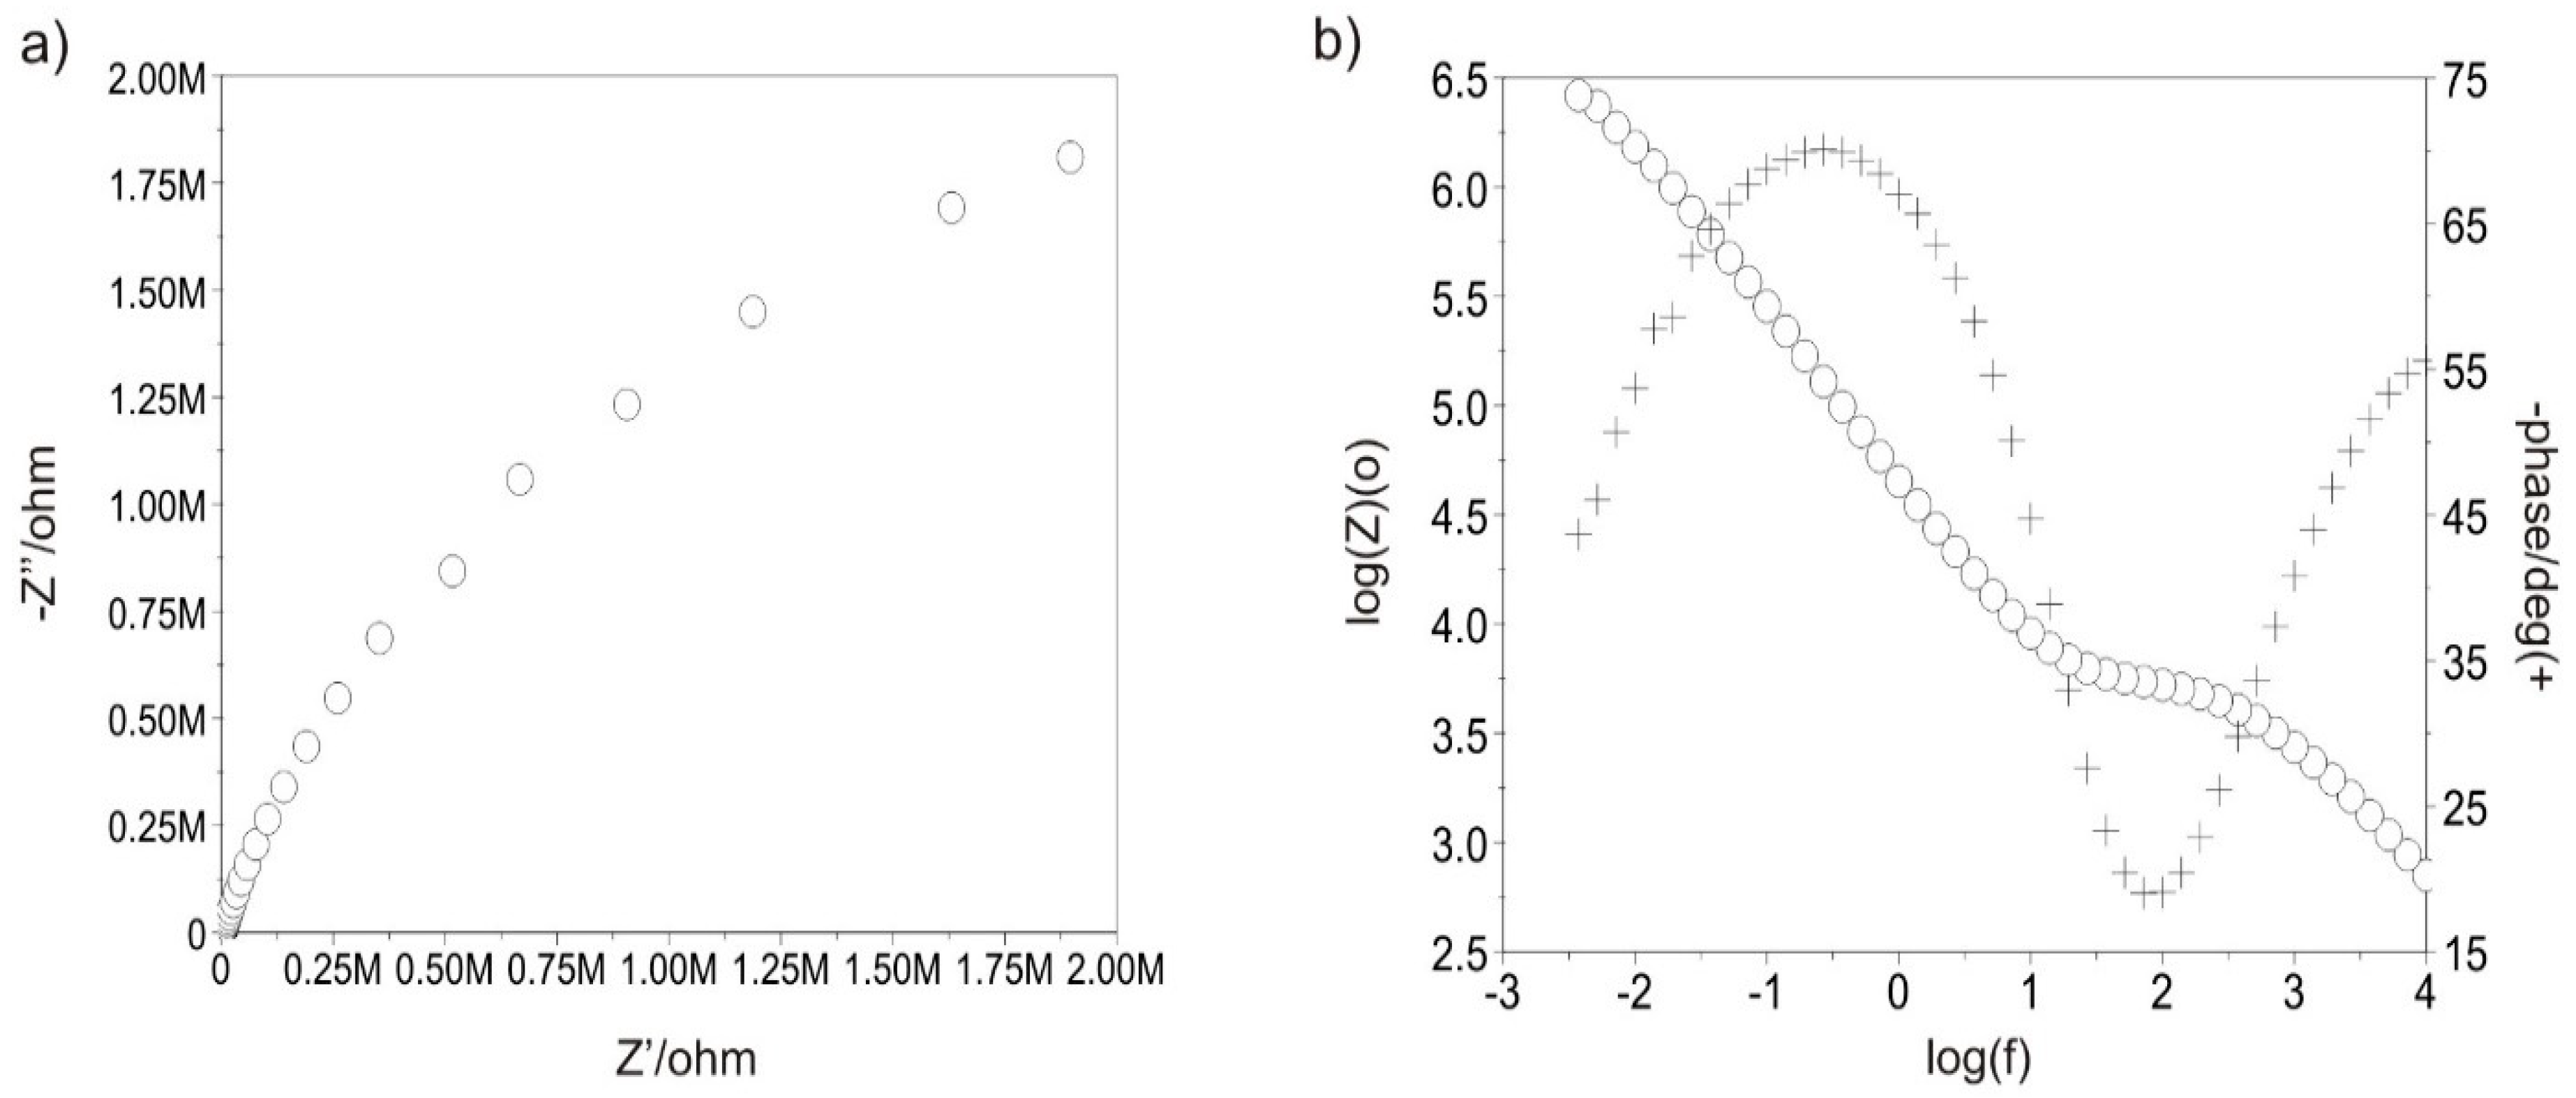
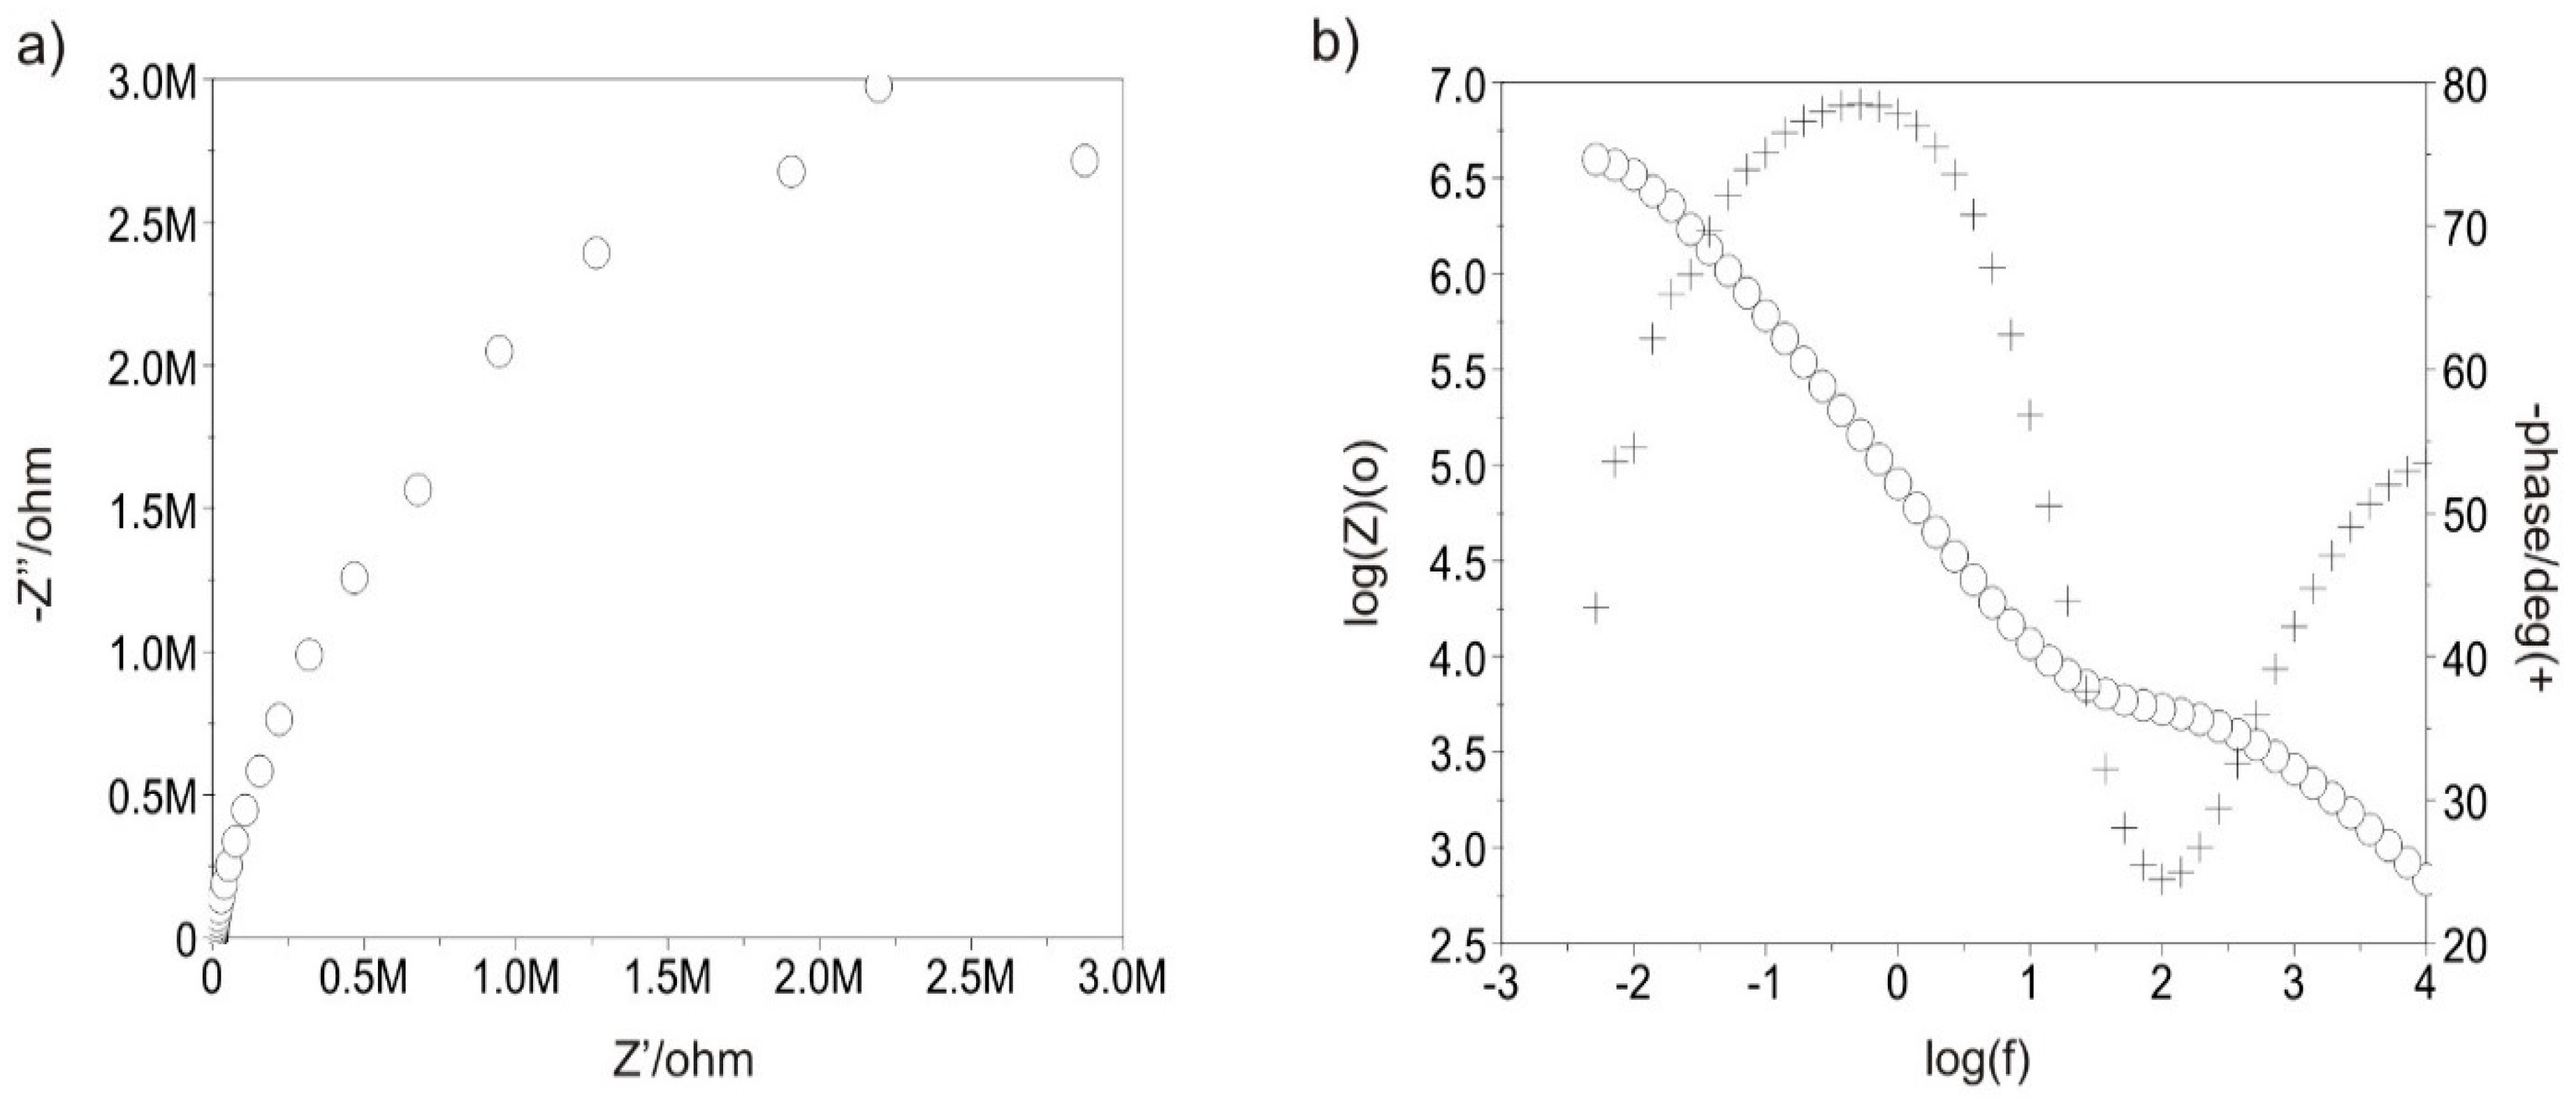
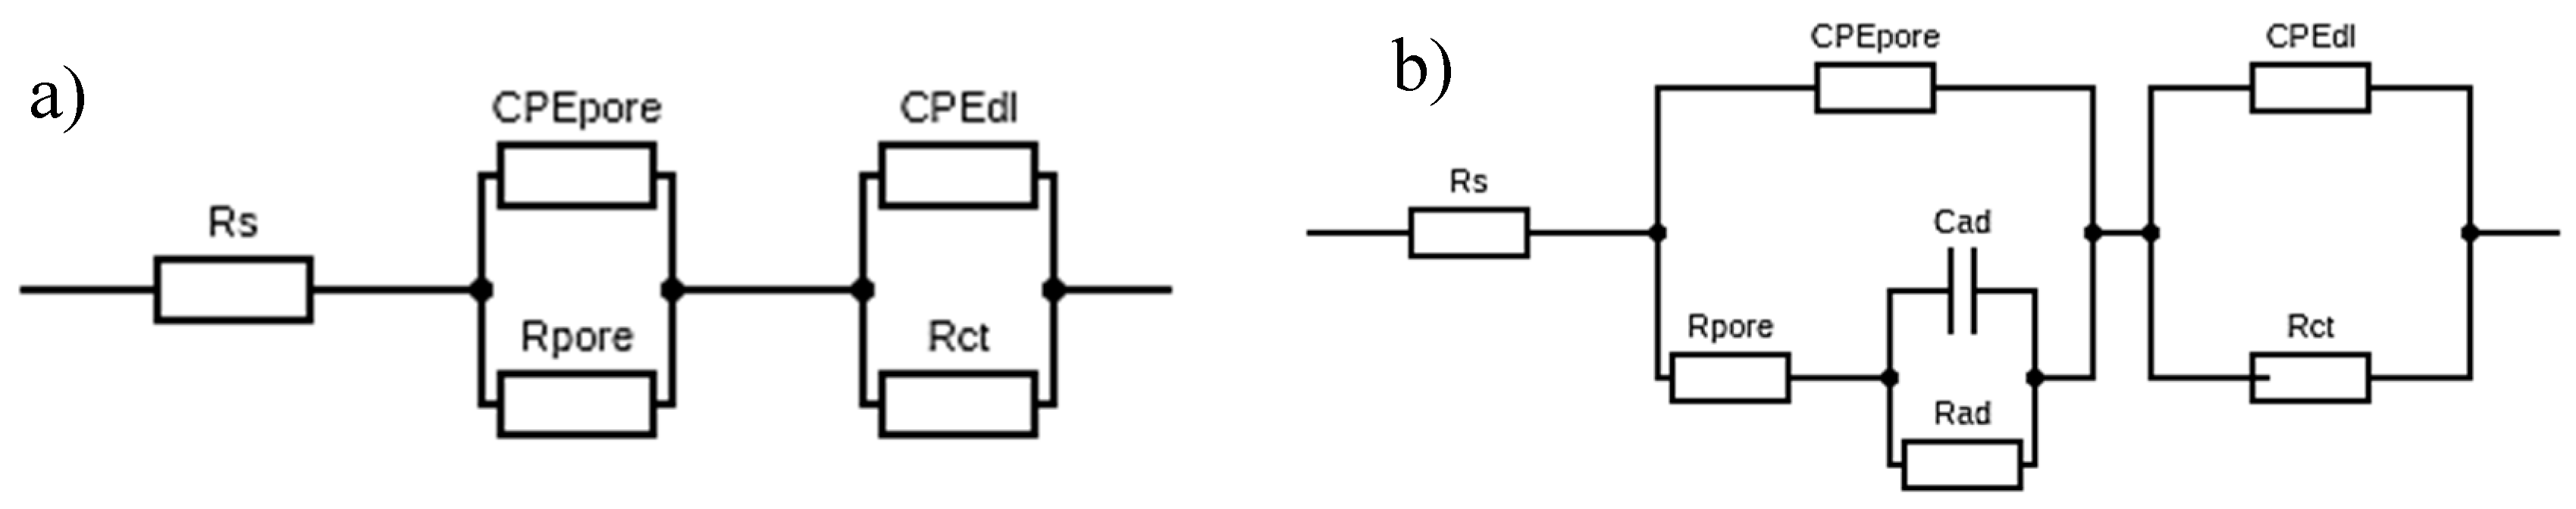
2.4.2. Electrochemical Impedance Spectroscopy Test
3. Results
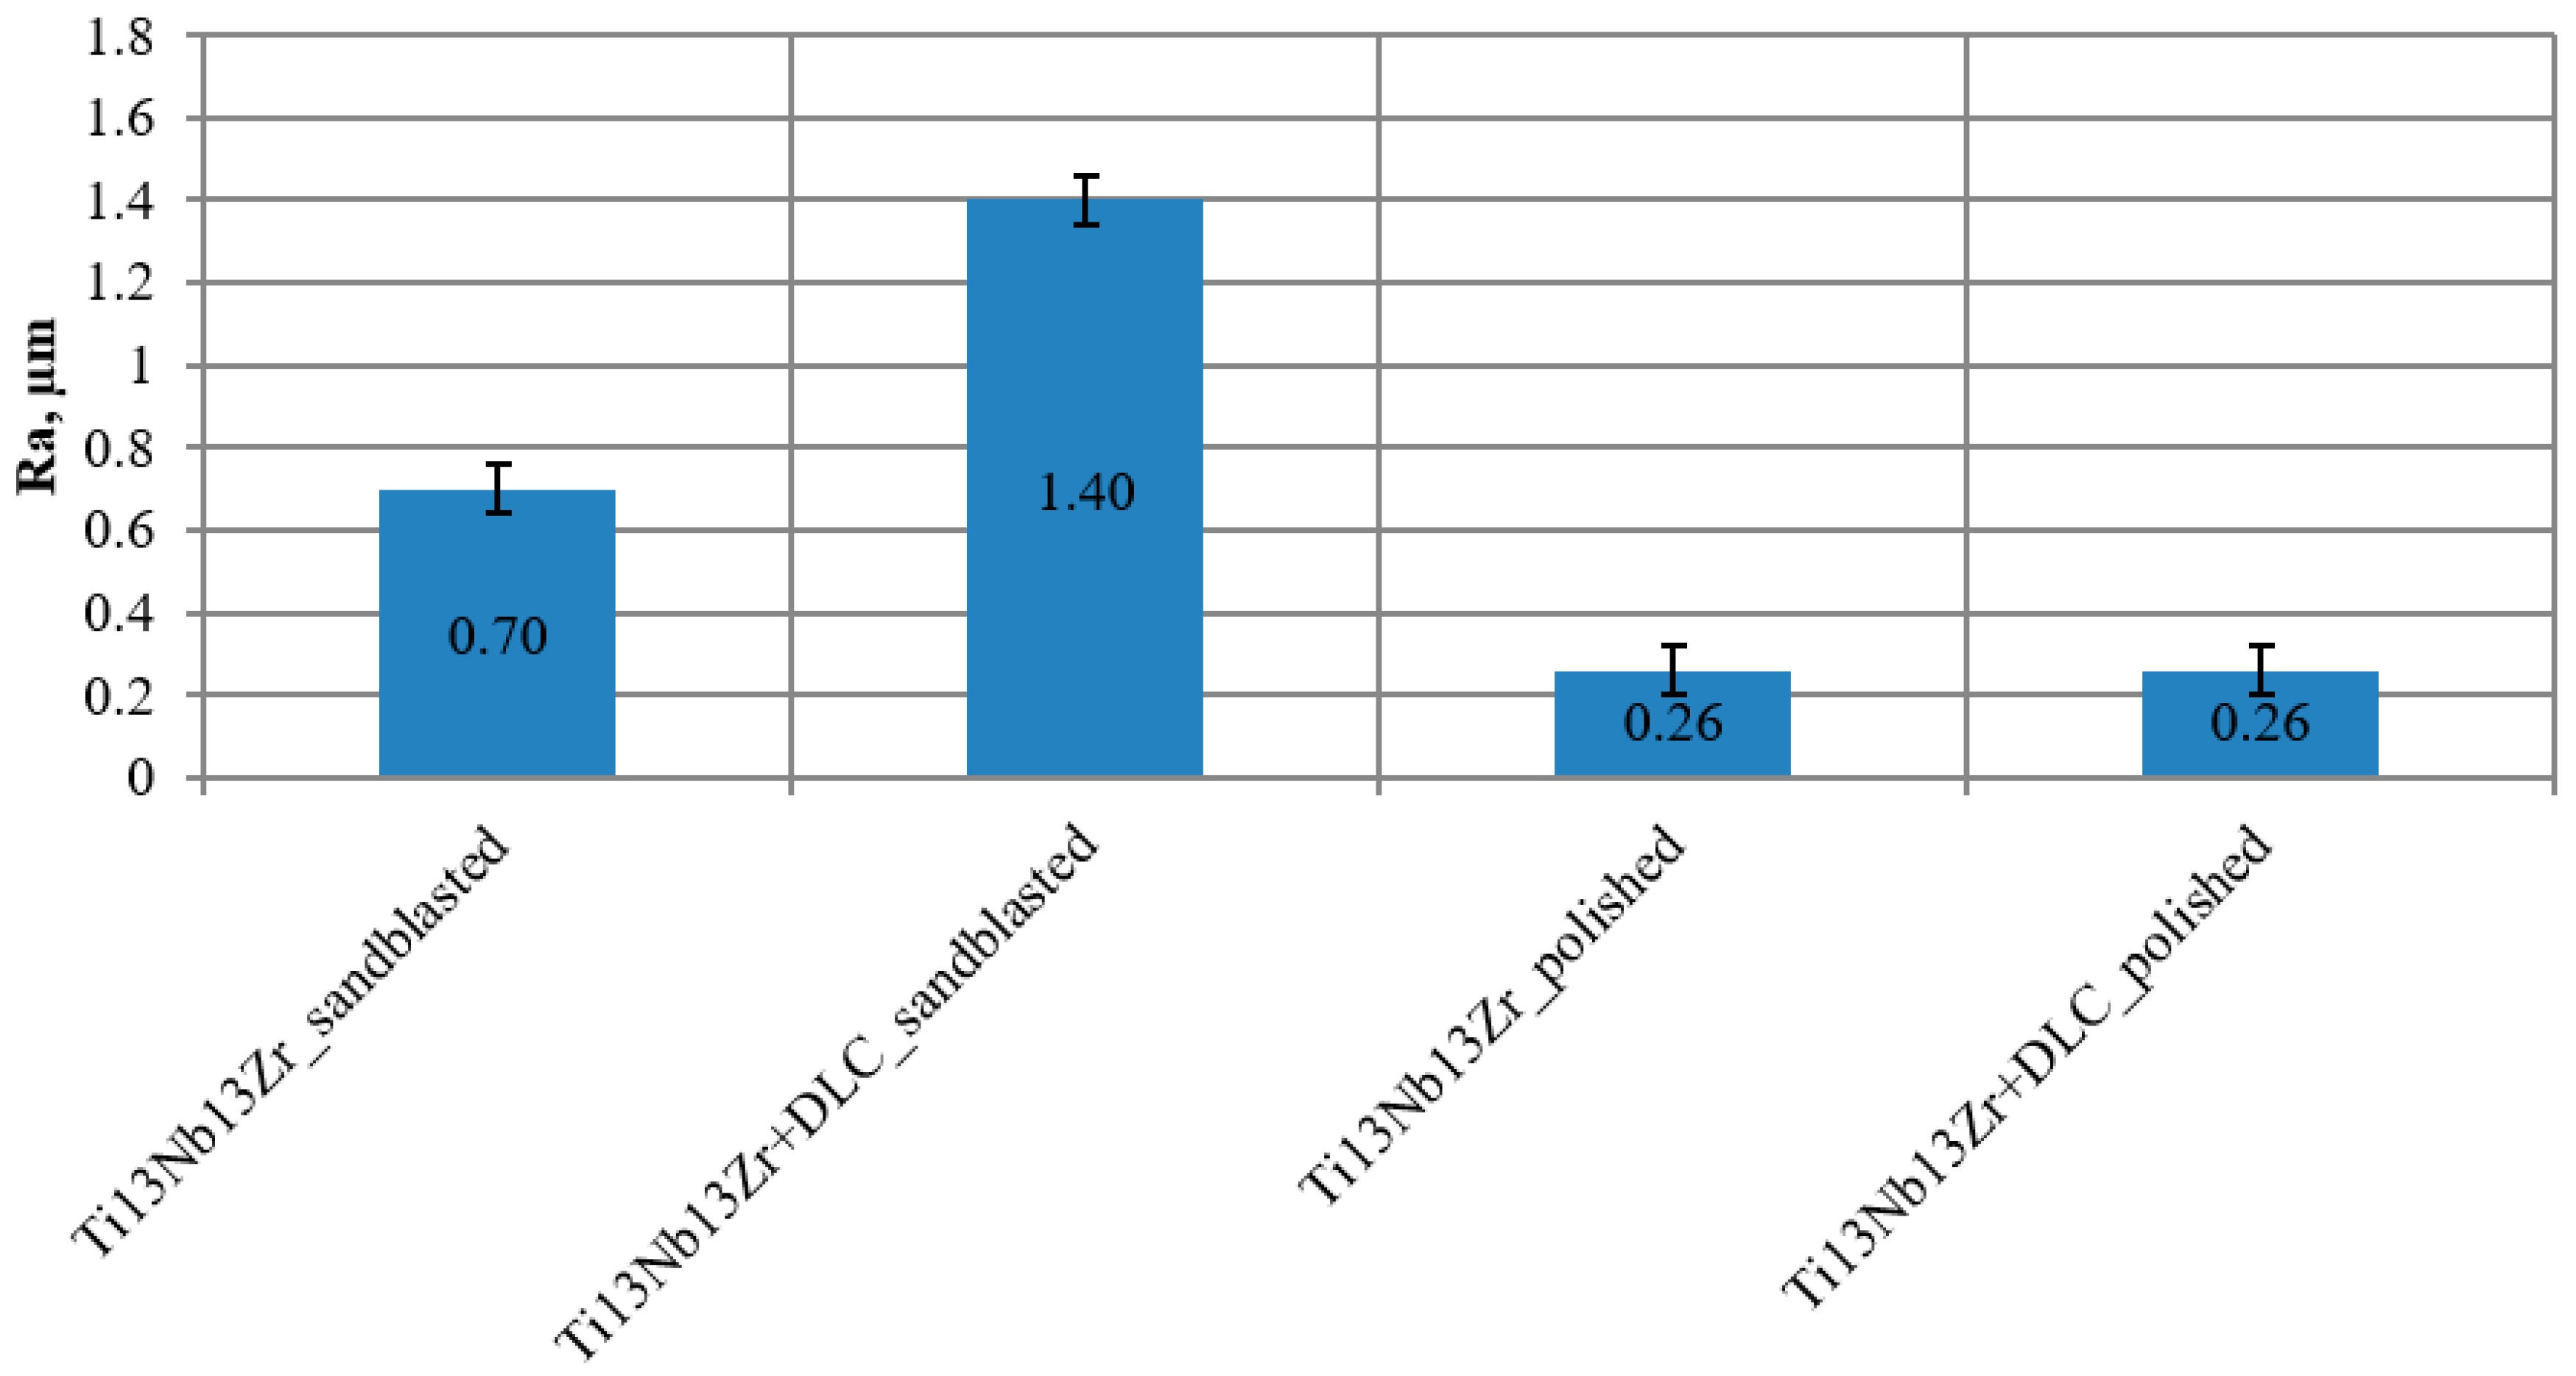
3.1. Surface Roughness Test
3.2. Tests of Contact Angle and Free Surface Energy
3.3. Hardness Test
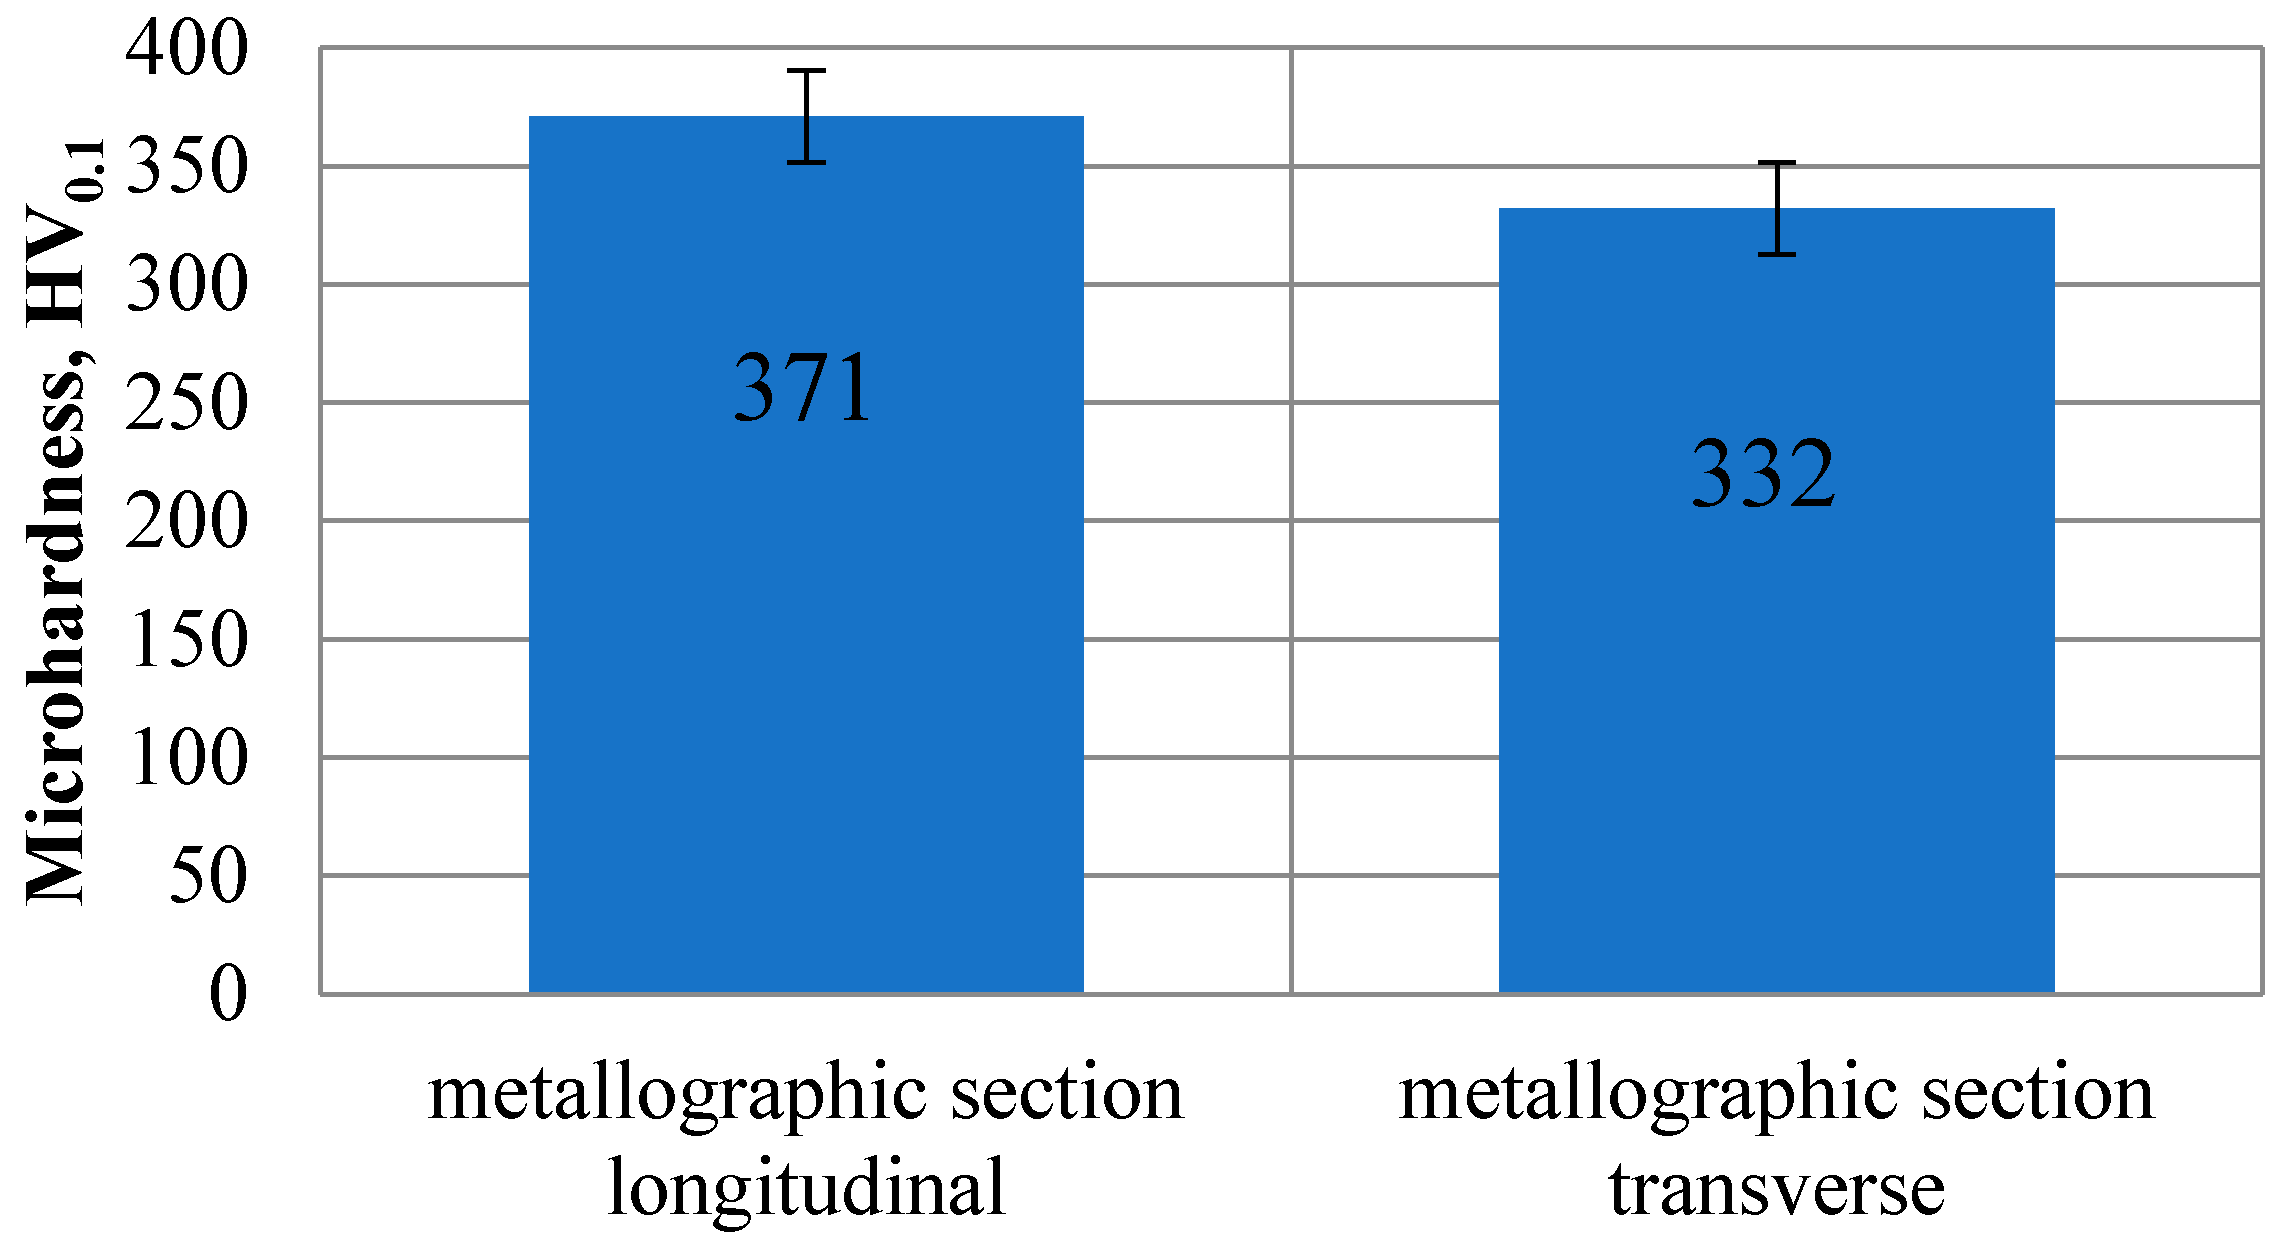
3.3.1. Microhardness Test
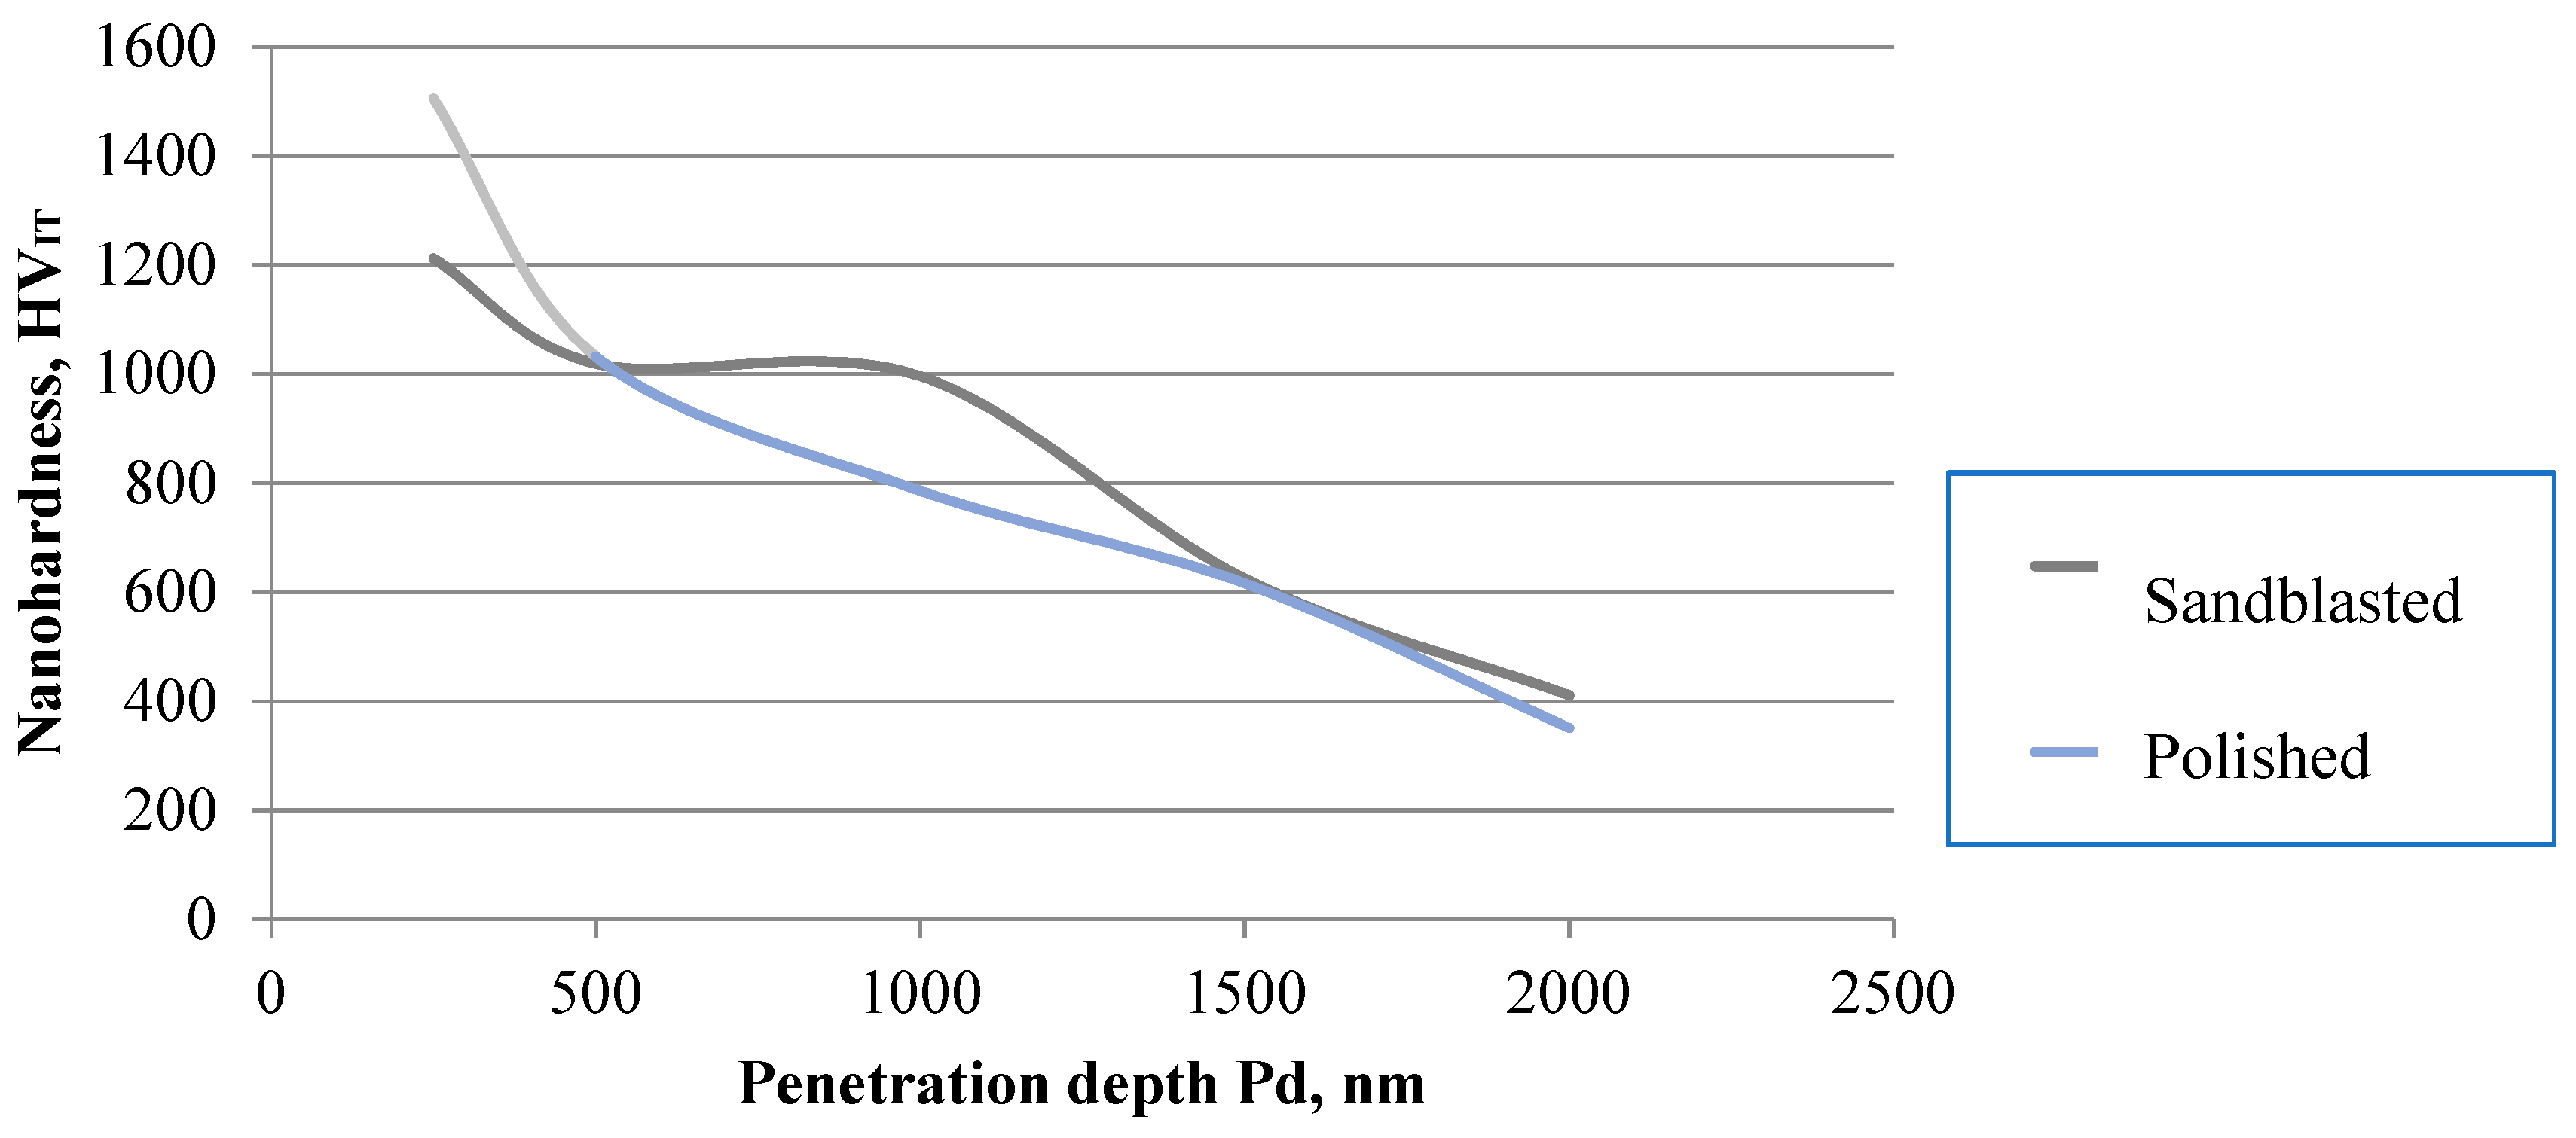
3.3.2. Nanohardness Test
3.3.3. Test of Adhesion of the Coating to the Substrate
3.3.4. Potentiodynamic Tests
3.3.5. Tests with Electrochemical Impedance Spectroscopy
4. Discussion
5. Conclusions
- The passive layer formed spontaneously on the Ti-13Nb-13Zr alloy during initial surface treatment (mechanical polishing and sandblasting) improves corrosion resistance. Additionally, the resulting low contact angle indicates its hydrophilic character, which is not desirable.
- DLC coating roughness tests showed a tendency to inherit the stereometric parameters of the surface of the tested titanium substrate only in the case of mechanical polishing (treatment preceding the application process (Ra < 0.30 μm)).
- The application of a compact DLC coating with the CrN interlayer by the PECVD method in the conditions proposed by the authors of the study effectively reduces the migration of Ti, Nb, Zr ions, which was confirmed in potentiodynamic and impedance tests. It also improves the Ti-13Nb-13Zr alloy surface’s wettability, changing its character from hydrophilic to hydrophobic.
- The deep nanohardness profile that was determined, clearly showed that the application of the CrN interlayer for the substrate after mechanical polishing causes a linear course of changes in the value, thus ensuring very good adhesion of the DLC coating, which was also confirmed in the studies scratch-test.
- Through the adhesion study, the influence of the Ti-13Nb-13Zr alloy surface preparation was shown. It was found that the DLC layer deposited on the polished surface of the Ti-13Nb-13Zr alloy showed the best adhesion, as evidenced by the values of the Lc parameter.
Author Contributions
Funding
Acknowledgments
Conflicts of Interest
References
- Nalezinkova, M. In vitro hemocompatibility testing of medical devices. Thromb. Res. 2020, 195, 146–150. [Google Scholar] [CrossRef] [PubMed]
- Siedlecki, A. Hemocompatibility of Biomaterials for Clinical Applications—Blood-Biomaterials Interactions; Woodhead Publishing: Sawston, UK, 2018. [Google Scholar]
- Dee, K.C.; Puelo, D.A.; Bizios, R. Tissue- Biomaterial Interactions; John Wiley & Sons: Hoboken, NJ, USA, 2003. [Google Scholar]
- Galeano-Osorio, D.S.; Vargas, S.; Velez, J.M.; Mello, A.; Tanaka, M.N.; Castano, C.E. Hemocompatibility of plasma nitride 316L stainless steel: Effect of processing temperature. Appl. Surf. Sci. 2020, 509, 144704. [Google Scholar] [CrossRef]
- Mustafa, K.; Odén, A.; Wennerberg, A.; Hultenby, K.; Arvidson, K. The influence of surface topography of ceramics abutments on the attachment and proliferation of human oral fibroblasts. Biomaterials 2005, 26, 373–381. [Google Scholar] [CrossRef] [PubMed]
- Oliveira, S.M.; Alves, N.M.; Mano, J.F. Cell interactions with superhydrophilic and superhydrophobic surfaces. J. Adhes. Sci. Technol. 2014, 28, 843–863. [Google Scholar] [CrossRef]
- Liu, X.; Chu, P.K.; Ding, C. Surface modification of titanium, titanium alloys and related materials for biomedical applications. Mater. Sci. Eng. R Rep. 2004, 47, 49–121. [Google Scholar] [CrossRef]
- Basiaga, M.; Walke, W.; Paszenda, Z.; Kajzer, A. The effect of EO and steam sterilization on the mechanical and electrochemical properties of titanium grade 4. Mater. Tehnol. 2016, 50, 153–158. [Google Scholar] [CrossRef]
- Zhu, X.; Chen, J.; Scheideler, L.; Reichl, R.; Geis-Gerstorfer, J. Effects of topography and composition of titanium surface oxides on osteoblast responses. Biomaterials 2004, 25, 4087–4103. [Google Scholar] [CrossRef]
- Chiang, H.-J.; Chou, H.-H.; Ou, K.-L.; Sugiatno, E.; Ruslin, M.; Waris, R.A.; Huang, C.-F.; Liu, C.-M.; Peng, P.-W. Evaluation of surface characteristics and hemocompatibility on the oxygen plasma-modified biomedical titanium. Metals 2018, 8, 513. [Google Scholar] [CrossRef]
- Rimondini, L.; Fini, M.; Giardino, R. The microbial infection of biomaterials: A challenge for clinicians and researchers. A short review. J. Appl. Biomater. Biomech. 2005, 3, 1–10. [Google Scholar] [CrossRef]
- Lee, F.-P.; Wang, D.-J.; Chen, L.-K.; Kung, C.-M.; Wu, Y.-C.; Ou, K.-L.; Yu, C.-H. Antibacterial nanostructured composite films for biomedical applications: Microstructural characteristics, biocompatibility, and antibacterial mechanisms. Biofouling 2013, 29, 295–305. [Google Scholar] [CrossRef]
- Subramani, K.; Jung, R.E.; Molenberg, A.; Hammerle, C.H.F. Biofilm on dental implants: A review of the literature. Int. J. Oral Maxillofac. Implants 2009, 24, 616–626. [Google Scholar] [CrossRef] [PubMed]
- Xu, L.C.; Bauer, J.; Siedlecki, C.A. Proteins, platelets, and blood coagulation at biomaterial interfaces. Colloids Surf. B Biointerfaces 2014, 124, 49–68. [Google Scholar] [CrossRef] [PubMed]
- Hou, P.-J.; Ou, K.-L.; Wang, C.-C.; Huang, C.-F.; Ruslin, M.; Sugiatno, E.; Yang, T.-S.; Chou, H.-H. Hybrid micro/nanostructural surface offering improved stress distribution and enhanced osseointegration properties of the biomedical titanium implant. J. Mech. Behav. Biomed. Mater. 2018, 79, 173–180. [Google Scholar] [CrossRef] [PubMed]
- Fedel, M. Blood compatibility of diamond-like carbon (DLC) coatings. In Diamond-Based Materials for Biomedical Applications; Narayan, R., Ed.; Woodhead Publishing: Sawston, UK, 2013; pp. 71–102. [Google Scholar]
- Roy, M. Protective hard coatings for tribological applications. In Materials Under Extreme Conditions; Elsevier: Amsterdam, The Netherlands, 2017. [Google Scholar]
- Zeng, H.; Jarvik, R.; Catausan, G.; Moldovan, N.; Carlisle, J. Diamond coated artificial cardiovascular devices. Surf. Coat. Technol. 2016, 302, 420–425. [Google Scholar] [CrossRef]
- Fedel, M.; Motta, A.; Maniglio, D.; Migliaresi, C. Surface properties and blood compatibility of commercially available diamond-like carbon coatings for cardiovascular devices. J. Biomed. Mater. Res. Part B Appl. Biomater. 2008, 90, 338–349. [Google Scholar] [CrossRef]
- Bayón, R.; Igartua, A.; González, J.; De Gopegui, U.R. Influence of the carbon content on the corrosion and tribocorrosion performance of Ti-DLC coatings for biomedical alloys. Tribol. Int. 2015, 88, 115–125. [Google Scholar] [CrossRef]
- Zhang, T.F.; Deng, Q.Y.; Liu, B.; Wu, B.J.; Jing, F.J.; Leng, Y.X.; Huang, N. Wear and corrosion properties of diamond like carbon (DLC) coating on stainless steel, CoCrMo and Ti6Al4V substrates. Surf. Coat. Technol. 2015, 273, 12–19. [Google Scholar] [CrossRef]
- Zhao, G.-H.; Aune, R.E.; Espallargas, N. Tribocorrosion studies of metallic biomaterials: The effect of plasma nitriding and DLC surface modifications. J. Mech. Behav. Biomed. 2016, 63, 100–114. [Google Scholar] [CrossRef]
- Hauert, R.; Falub, C.V.; Thorwarth, G.; Thorwarth, K.; Affolter, C.; Stiefel, M.; Podleska, L.E.; Taeger, G. Retrospective life time estimation of failed and explanted diamond-like carbon coated hip joint balls. Acta Biomater. 2012, 8, 3170–3176. [Google Scholar] [CrossRef]
- Cui, L.; Lu, Z.; Wang, L. Environmental effect on the load-dependent friction behavior of a diamond-like carbon film. Tribol. Int. 2015, 82, 195–199. [Google Scholar] [CrossRef]
- Manhabosco, T.M.; Müller, I.L. Tribo corrosion of diamond-like carbon deposited on Ti6Al4V. Tribol. Lett. 2009, 33, 193–197. [Google Scholar] [CrossRef]
- Erdemir, A.; Donnet, C. Tribology of diamond-like carbon films: Recent progress and future prospects. J. Phys. D Appl. Phys. 2006, 39, R311–R327. [Google Scholar] [CrossRef]
- Ge, F.; Shao, T.; Jia, C.; Li, P.; Huang, F. Tribological behaviors of a magnetron sputtered CrSiN coating under ambient air and wet environments. Surf. Coat. Technol. 2017, 332, 304–311. [Google Scholar] [CrossRef]
- Basiaga, M.; Staszuk, M.; Walke, W. Mechanical properties of atomic layer deposition (ALD) TiO2 layers on stainless steel substrates. Mater. Werkst. 2016, 47, 512–520. [Google Scholar] [CrossRef]
- Tyagi, A.; Walia, R.; Murtaza, Q.; Pandey, S.M.; Tyagi, P.K.; Bajaj, B. A critical review of diamond like carbon coating for wear resistance applications. Int. J. Refract. Met. Hard Mater. 2019, 78, 107–122. [Google Scholar] [CrossRef]
- ASTM. ASTM F-1713: Standard Specification for Wrought Titanium-13Niobium-13Zirconium Alloy for Surgical Implant Applications; ASTM: West Conshohocken, PA, USA, 2003. [Google Scholar]
- ASTM. ASTM E112: Standard Test Methods for Determining Average Grain Size; ASTM: West Conshohocken, PA, USA, 2010. [Google Scholar]
- PKN. PN–ISO 4288:1997: Wymagania Geometryczne Wyrobów. Struktura Geometryczna Powierzchni. Zasady i Procedury Oceny Struktury Geometrycznej Powierzchni, Metoda Profilowa; PKN: Warsaw, Poland, 1997. [Google Scholar]
- PKN. PN-EN ISO 20502:2016-05: Ceramika Wysokiej Jakości (Ceramika Zaawansowana, Techniczna Ceramika Zaawansowana) -Oznaczanie Adhezji Powłok Ceramicznych w Próbie Zarysowania; PKN: Warsaw, Poland, 2016. [Google Scholar]
- PKN. PN-EN ISO 10993-15: Biologiczna Ocena Wyrobów Medycznych—Część 15: Identyfikacja i Oznaczanie Ilościowe Produktów Degradacji Metali i Stopów; PKN: Warsaw, Poland, 2019. [Google Scholar]
- Xu, L.C.; Siedlecki, C. Effects of surface wettability and contact time on protein adhesion to biomaterial surfaces. Biomaterials 2007, 28, 3273–3283. [Google Scholar] [CrossRef]
- Liber-Kneć, A.; Łagan, S. Zastosowanie pomiarów kąta zwilżania i swobodnej energii powierzchniowej do charakterystyki powierzchni polimerów wykorzystywanych w medycynie. Polim. Med. 2014, 44, 29–37. [Google Scholar]
- Kaczmarek, H.; Bajer, K. Metody badania biodegradacji materiałów polimerowych. Polimery 2006, 51, 716–721. [Google Scholar] [CrossRef]
- Kim, M.S.; Khang, G.; Lee, H.B. Gradient polymer surfaces for biomedical applications. Prog. Polym. Sci. 2008, 33, 138–164. [Google Scholar] [CrossRef]
- Nair, K.; Muraleedharan, C.V.; Bhuvaneshwar, G.S. Developments in mechanical heart valve prosthesis. Sadhana 2003, 28, 575–587. [Google Scholar] [CrossRef]


| Type of Analysis | Chemical Composition (wt. %) | |||||||
|---|---|---|---|---|---|---|---|---|
| Nb | Zr | Fe | C | N | O | H | Ti | |
| ASTM F-1713 [30] | 12.5–14.0 | 12.5–14.0 | <0.25 | <0.08 | <0.05 | <0.15 | <0.015 | rest |
| Certificate | 13.5 | 13.5 | 0.05 | 0.04 | 0.013 | 0.11 | 0.04 | rest |
| Sample | Contact Angle θavr. ° | Polar Component γsp.mJ/m2 | Dispersion Component γsd.mJ/m2 | Surface Energy (SEP) γs. mJ/m2 | |
|---|---|---|---|---|---|
| Distilled Water | Diiodomethane | ||||
| Polished_Ti-13Nb-13Zr initial state | 60.79 ± 4.64 | 58.13 ± 0.27 | 25.51 ± 0.13 | 15.02 ± 0.16 | 40.52 ± 0.02 |
| Polished_Ti-13Nb-13Zr_DLC | 73.75 ± 1.74 | 56.58 ± 0.75 | 12.60 ± 0.26 | 20.68 ± 0.51 | 33.28 ± 0.25 |
| Sandblasted _Ti-13Nb-13Zr_initial state | 55.03 ± 1.22 | 51.15 ± 0.37 | 28.08 ± 0.18 | 17.29 ± 0.21 | 45.38 ± 0.03 |
| Sandblasted _Ti-13Nb-13Zr_DLC | 91.53 ± 3.94 | 67.31 ± 2.27 | 4.04 ± 0.50 | 20.42 ± 1.68 | 24.47 ± 1.18 |
| Sample | Failure of the Layer | Average Critical Value of Registered Indenter Load, F, N |
|---|---|---|
| Polished_Ti-13Nb-13Zr_DLC | First cracking Lc1 | − |
| First delamination Lc2 | 4.56 | |
| Full delamination Lc3 | 5.53 | |
| Sandblasted _Ti-13Nb-13Zr_DLC | First cracking Lc1 | − |
| First delamination Lc2 | 1.28 | |
| Full delamination Lc3 | 2.81 |
| Sample | Eocp (mV) | Eb (mV) | Ecp (mV) | Ecorr (mV) | Rp (MΩ *cm2) | icorr (µA/cm2) | |
|---|---|---|---|---|---|---|---|
| Ti-13Nb-13Zr | Sandblasted | −224 | − | − | −255 | 0.054 | 0.479 |
| Polished | −243 | − | − | −266 | 0.088 | 0.297 | |
| Ti-13Nb-13Zr+DLC | Sandblasted | +97 | +1358 | +1028 | −1 | 0.038 | 0.765 |
| Polished | −169 | +1397 | +1103 | −195 | 0.031 | 0.832 | |
| Sample | Ti-13Nb-13Zr Polished | Ti-13Nb-13Zr Sandblasted | Ti-13Nb-13Zr + DLC Polished | Ti-13Nb-13Zr + DLC Sandblasted | |
|---|---|---|---|---|---|
| Rs (Ω) | 17 | 17 | 17 | 17 | |
| CPEpore | y0 (Ω−1∙cm−2∙s−n) | 0.2954×10⁻⁴ | 0.1325×10⁻³ | 0.3277×10⁻⁶ | 0.4046×10⁻⁶ |
| n | 0.85 | 0.86 | 0.77 | 0.75 | |
| Rpore (kΩ cm2) | 2.35 | 1.33 | 4.97 | 4.89 | |
| CPEdl | y0 (Ω−1∙cm−2∙s−n) | 0.1952×10⁻³ | 0.1337×10⁻³ | 0.5596×10⁻⁵ | 0.2614×10⁻⁵ |
| n | 0.83 | 0.76 | 0.82 | 0.88 | |
| Rct (MΩ cm2) | 0.046 | 0.058 | 4.880 | 7.080 | |
| Cad (µF) | 30 | 662 | 48 | - | |
| Rad (kΩ cm2) | 28.00 | 2.99 | 60.20 | - | |
| EOCP (mV) | −330 | −273 | 58 | 41 | |
Publisher’s Note: MDPI stays neutral with regard to jurisdictional claims in published maps and institutional affiliations. |
© 2020 by the authors. Licensee MDPI, Basel, Switzerland. This article is an open access article distributed under the terms and conditions of the Creative Commons Attribution (CC BY) license (http://creativecommons.org/licenses/by/4.0/).
Share and Cite
Antonowicz, M.; Kurpanik, R.; Walke, W.; Basiaga, M.; Sondor, J.; Paszenda, Z. Selected Physicochemical Properties of Diamond Like Carbon (DLC) Coating on Ti-13Nb-13Zr Alloy Used for Blood Contacting Implants. Materials 2020, 13, 5077. https://doi.org/10.3390/ma13225077
Antonowicz M, Kurpanik R, Walke W, Basiaga M, Sondor J, Paszenda Z. Selected Physicochemical Properties of Diamond Like Carbon (DLC) Coating on Ti-13Nb-13Zr Alloy Used for Blood Contacting Implants. Materials. 2020; 13(22):5077. https://doi.org/10.3390/ma13225077
Chicago/Turabian StyleAntonowicz, Magdalena, Roksana Kurpanik, Witold Walke, Marcin Basiaga, Jozef Sondor, and Zbigniew Paszenda. 2020. "Selected Physicochemical Properties of Diamond Like Carbon (DLC) Coating on Ti-13Nb-13Zr Alloy Used for Blood Contacting Implants" Materials 13, no. 22: 5077. https://doi.org/10.3390/ma13225077
APA StyleAntonowicz, M., Kurpanik, R., Walke, W., Basiaga, M., Sondor, J., & Paszenda, Z. (2020). Selected Physicochemical Properties of Diamond Like Carbon (DLC) Coating on Ti-13Nb-13Zr Alloy Used for Blood Contacting Implants. Materials, 13(22), 5077. https://doi.org/10.3390/ma13225077