A New Method for Modeling the Cyclic Structure of the Surface Microrelief of Titanium Alloy Ti6Al4V After Processing with Femtosecond Pulses

 ,
,  ,
,  , and
, and 
Abstract
1. Introduction
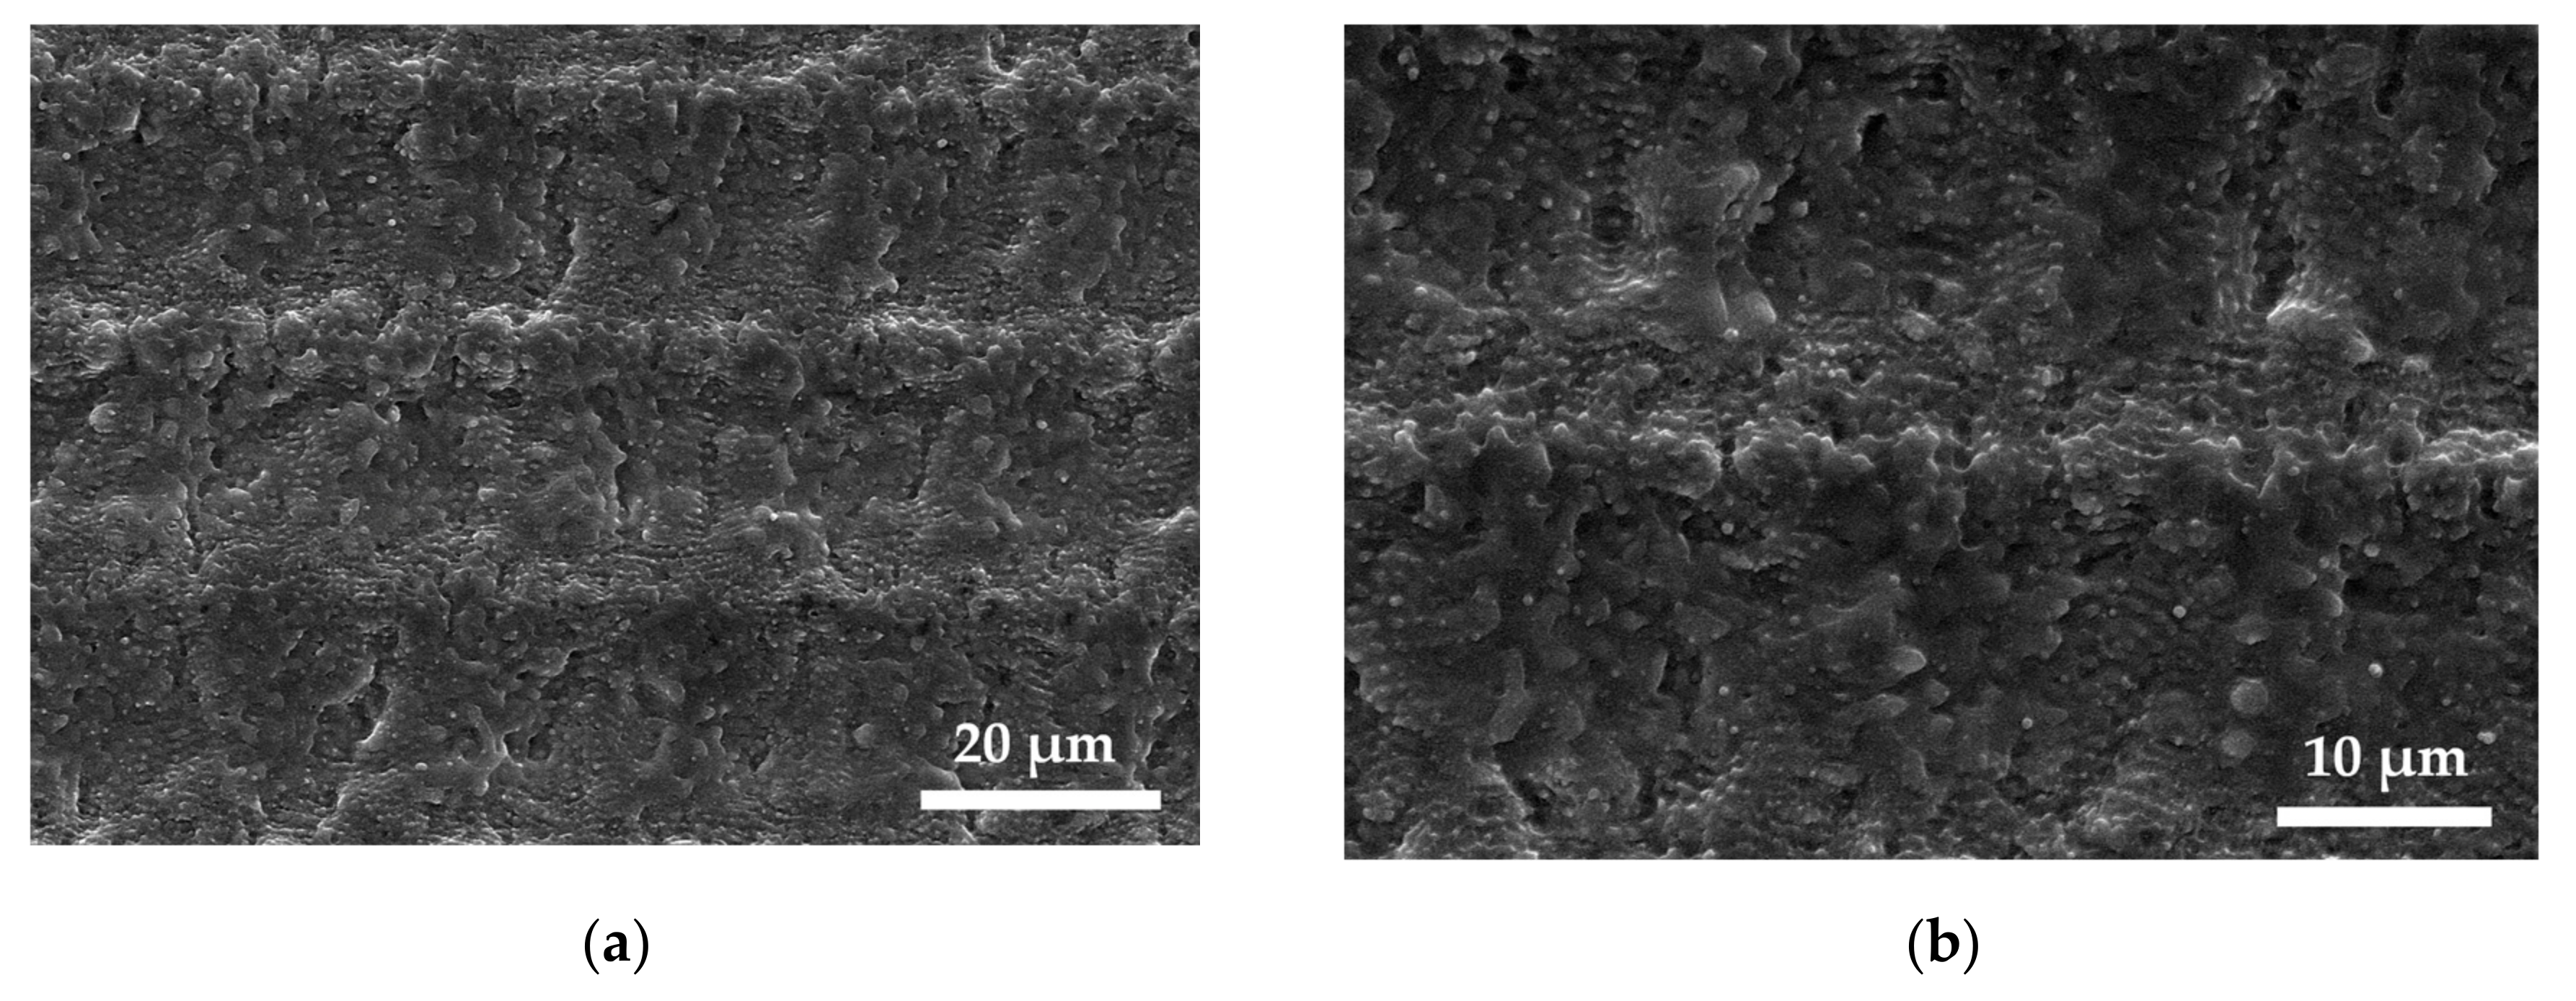
2. Materials and Methods
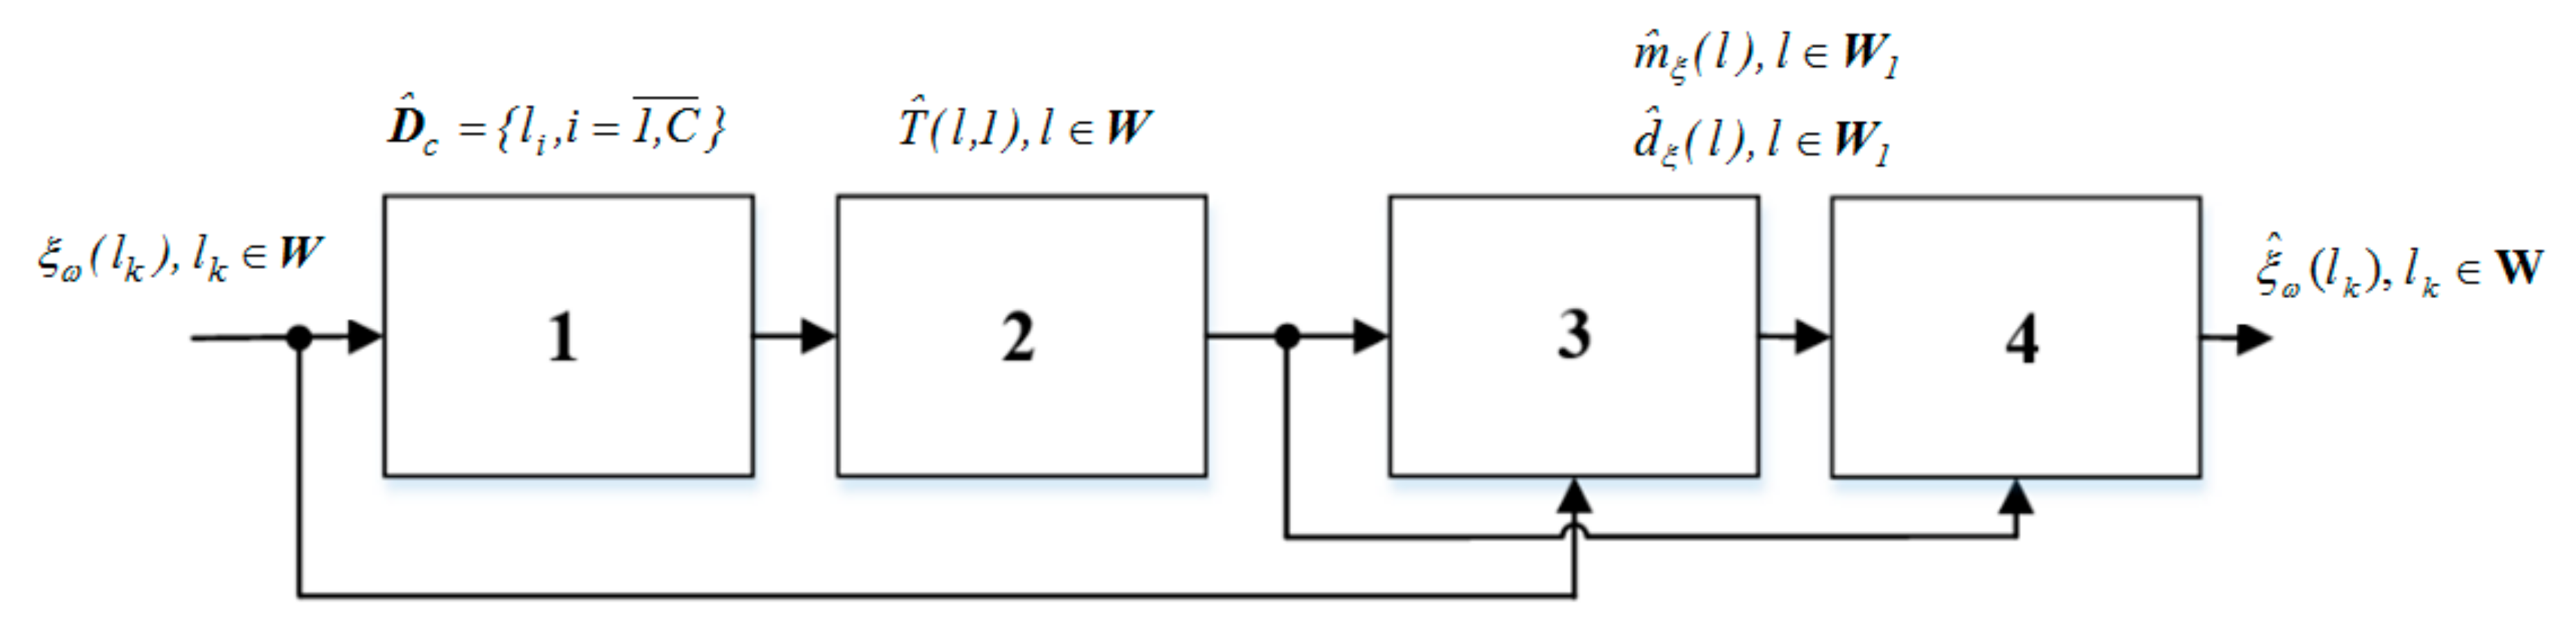
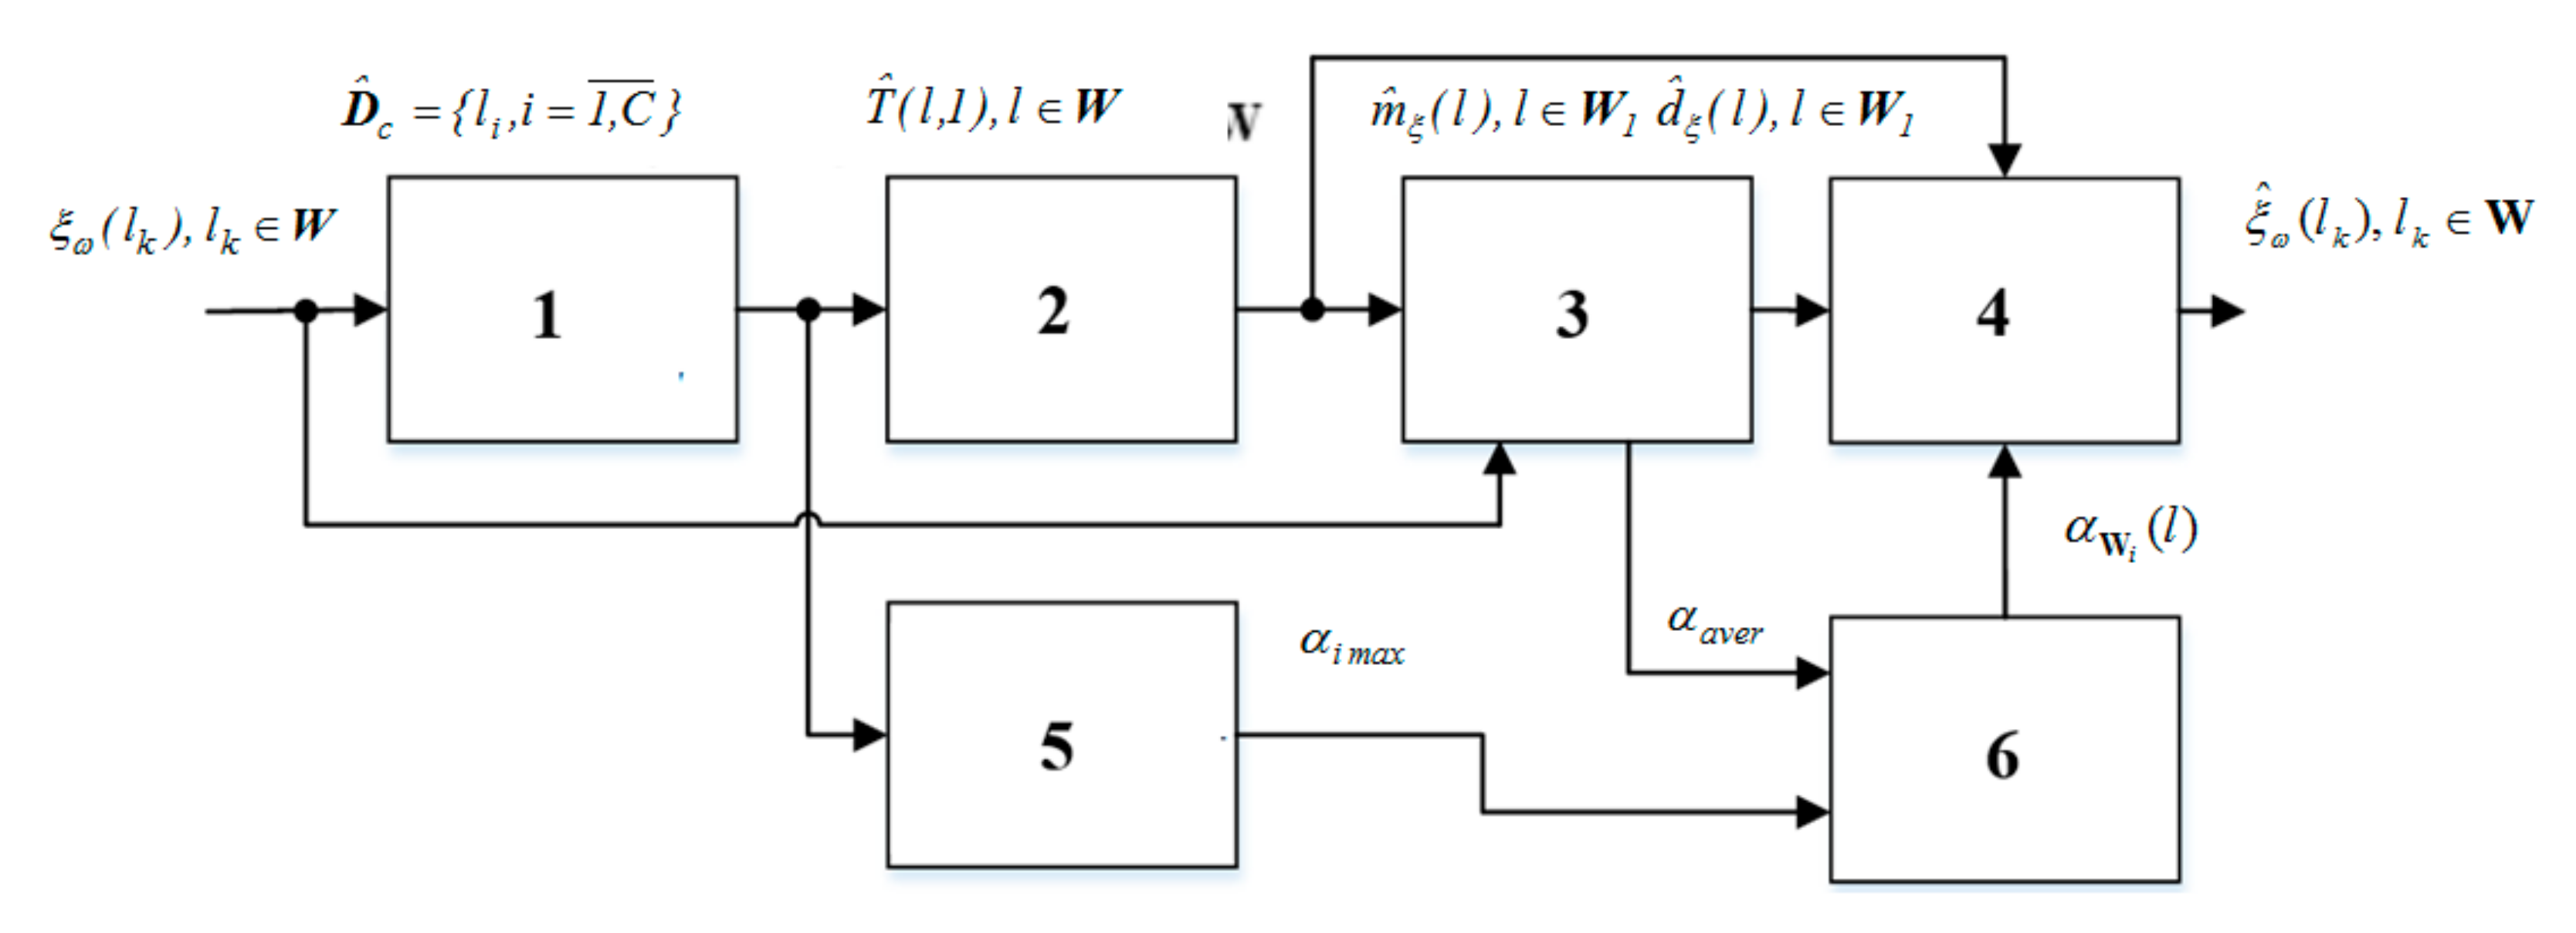
3. A New Mathematical Model of Cyclic Microrelief
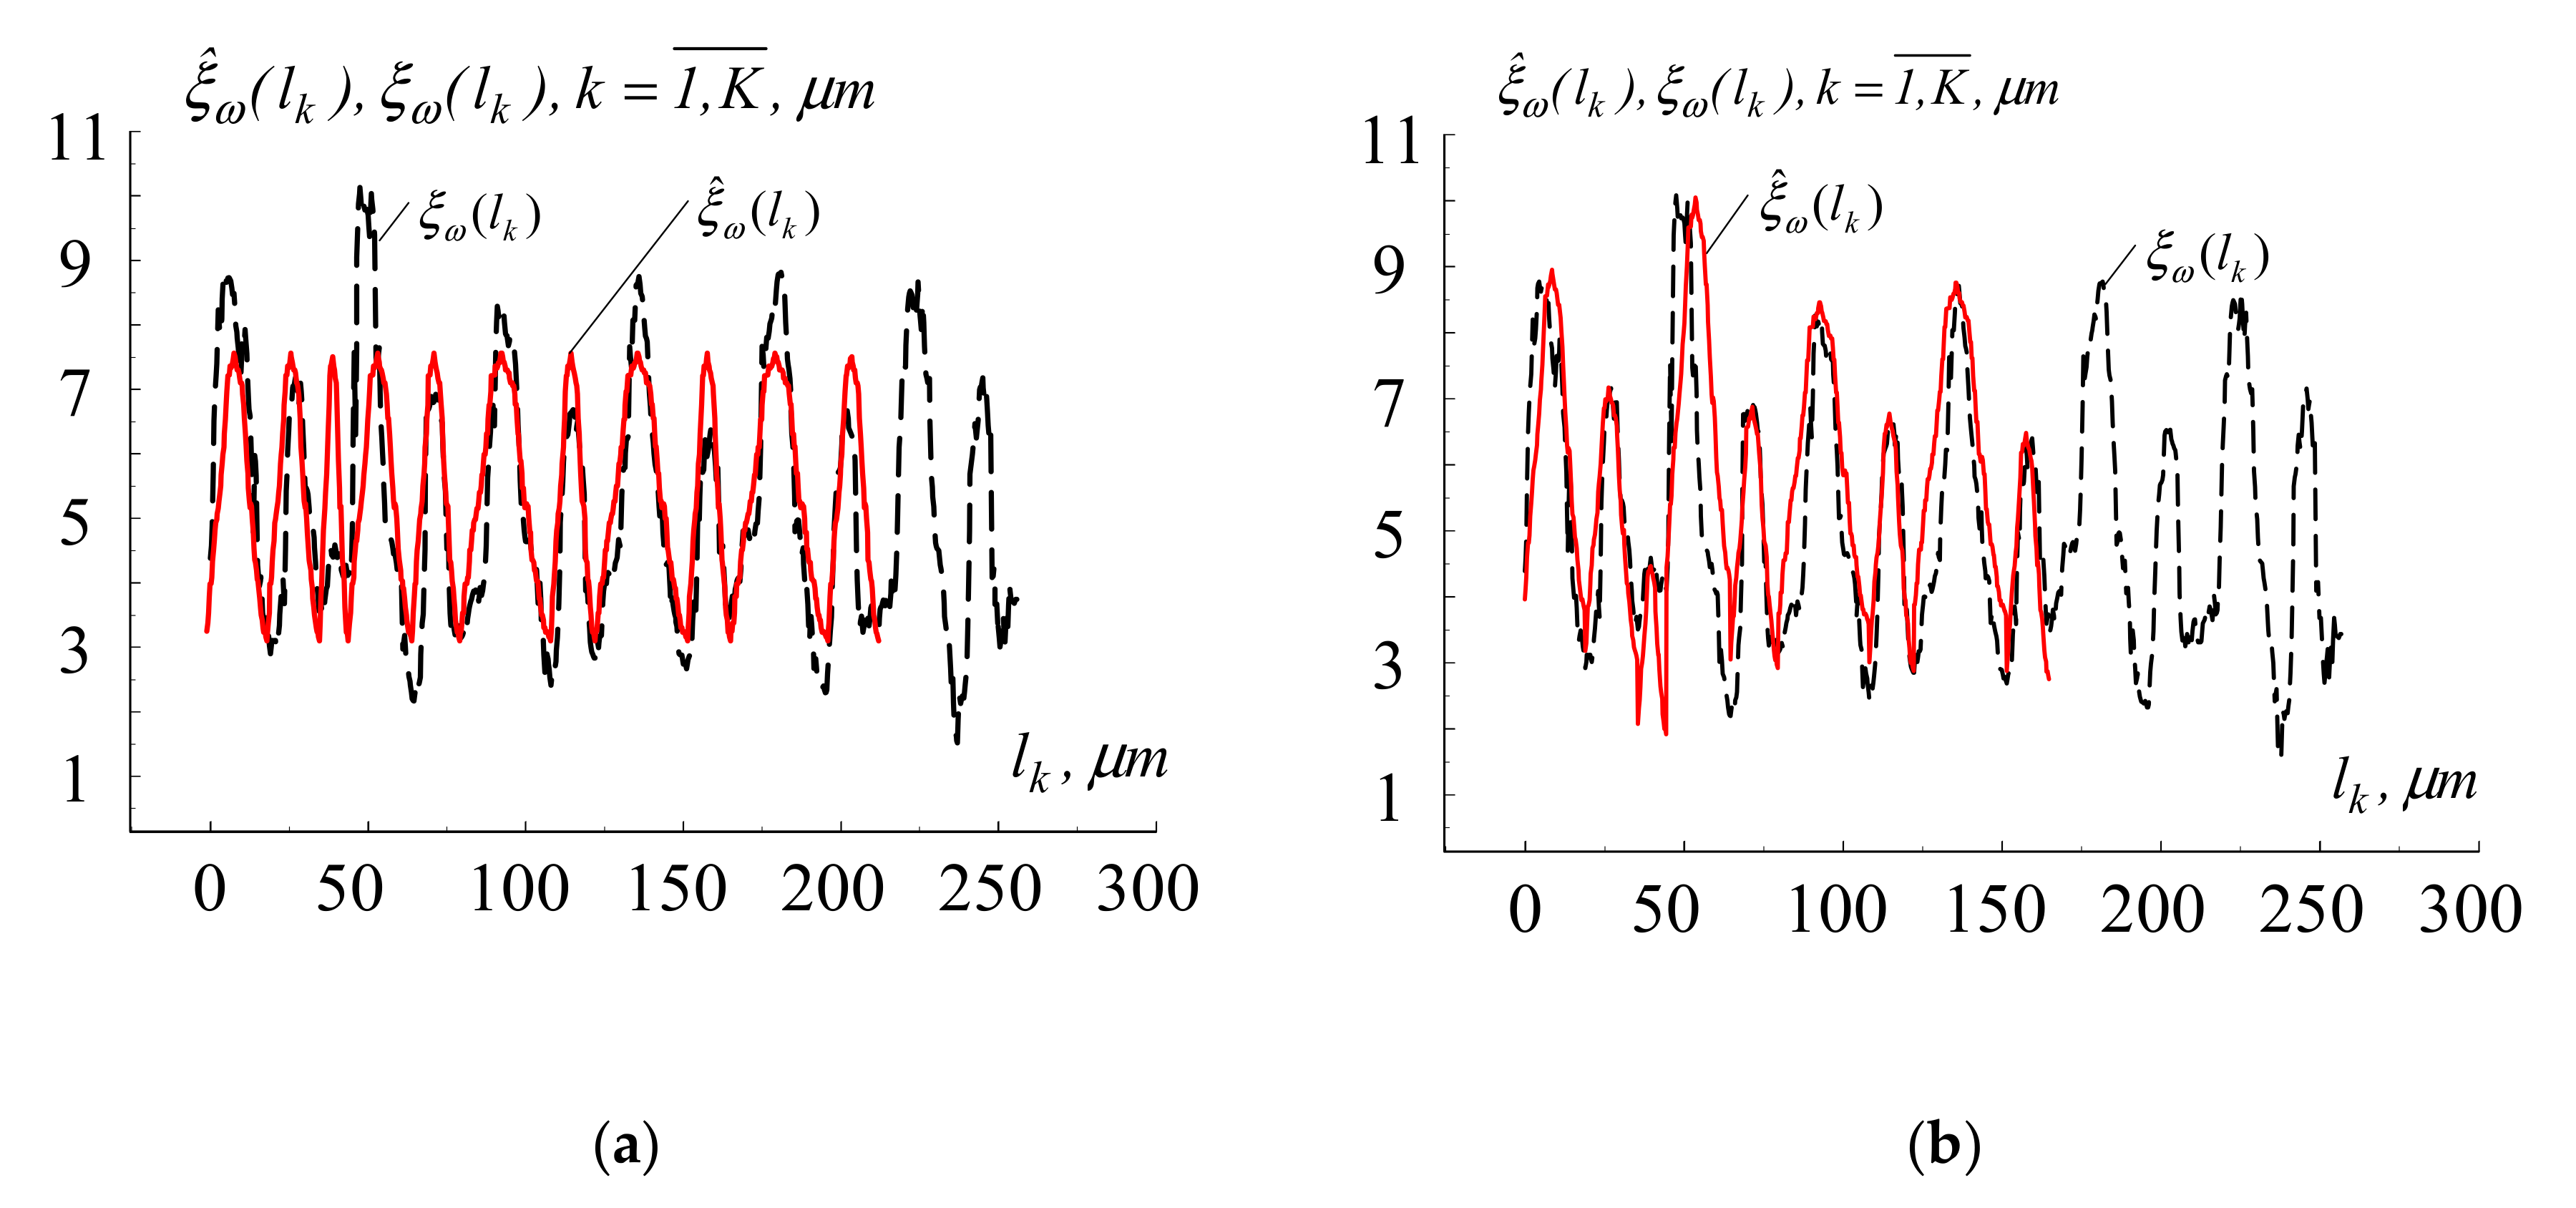
4. Modeling Results
5. Conclusions
Author Contributions
Funding
Conflicts of Interest
References
- Van Driel, H.M.; Sipe, J.E.; Young, J.F. Laser-induced periodic surface structure on solids: A universal phenomenon. Phys. Rev. Lett. 1982, 49, 1955–1958. [Google Scholar] [CrossRef]
- Vorobyev, A.; Guo, C. Femtosecond laser structuring of titanium implants. Appl. Surf. Sci. 2007, 253, 7272–7280. [Google Scholar] [CrossRef]
- Kuczyńska-Zemła, D.; Kijeńska-Gawrońska, E.; Pisarek, M.; Borowicz, P.; Swieszkowski, W.; Garbacz, H. Effect of laser functionalization of titanium on bioactivity and biological response. Appl. Surf. Sci. 2020, 525, 146492. [Google Scholar] [CrossRef]
- Schnell, G.; Duenow, U.; Seitz, H. Effect of laser pulse overlap and scanning line overlap on femtosecond laser-structured Ti6Al4V surfaces. Materials 2020, 13, 969. [Google Scholar] [CrossRef] [PubMed]
- Filimonova, E.A. Development of the Methodology and Program of the Automated Control of Microgeometry of Surfaces of Details of Instruments Using Graphic Criteria and Their Use in Technological Research, C. Ph.D. Dissertation, ITMO University, Saint Petersburg, Russia, 2014; p. 237. (In Russian). [Google Scholar]
- Gibadullin, I.N.; Valetov, V.A. Image of the surface profile as a graphic criterion of its roughness. J. Instrum. Eng. 2019, 62, 86–92. (In Russian) [Google Scholar] [CrossRef]
- Zhou, W.; Tang, J.Y.; He, Y.F.; Zhu, C.C. Modeling of rough surfaces with given roughness parameters. J. Cent. South Univ. 2017, 24, 127–136. [Google Scholar] [CrossRef]
- Vorobyev, A.Y.; Guo, C. Direct femtosecond laser surface nano/microstructuring and its applications. Laser Photon. Rev. 2012, 7, 1–23. [Google Scholar] [CrossRef]
- Kuznetsov, G.V.; Feoktistov, D.V.; Orlova, E.G.; Batishcheva, K.; Ilenok, S.S. Unification of the textures formed on aluminum after laser treatment. Appl. Surf. Sci. 2019, 469, 974–982. [Google Scholar] [CrossRef]
- Schnell, G.; Polley, C.; Bartling, S.; Seitz, H. Effect of chemical solvents on the wetting behavior over time of femtosecond laser structured Ti6Al4V surfaces. Nanomaterials 2020, 10, 1241. [Google Scholar] [CrossRef] [PubMed]
- Varlamova, O.; Reif, J.; Varlamov, S.; Bestehorn, M. Self-organized Surface Patterns Originating from Laser-Induced Instability. In Progress in Nonlinear Nano-Optics. Nano-Optics and Nanophotonics; Sakabe, S., Lienau, C., Grunwald, R., Eds.; Springer: Cham, Switzerland, 2015. [Google Scholar] [CrossRef]
- Romano, J.-M.; Garcia-Giron, A.; Penchev, P.; Dimov, S. Triangular laser-induced submicron textures for functionalising stainless steel surfaces. Appl. Surf. Sci. 2018, 440, 162–169. [Google Scholar] [CrossRef]
- Aguilar-Morales, A.I.; Alamri, S.; Kunze, T.; Lasagni, A.F. Influence of processing parameters on surface texture homogeneity using direct laser interference patterning. Opt. Laser Technol. 2018, 107, 216–227. [Google Scholar] [CrossRef]
- Lytvynenko, I.V.; Maruschak, P.O. Analysis of the state of the modified nanotitanium surface with the use of the mathematical model of a cyclic random process. Optoelectron. Instrument. Proc. 2015, 51, 254–263. [Google Scholar] [CrossRef]
- Lytvynenko, I.V.; Maruschak, P.O.; Lupenko, S.A.; Popovych, P.V. Modeling of the ordered surface topography of statically deformed aluminum alloy. Mater. Sci. 2016, 52, 113–122. [Google Scholar] [CrossRef]
- Frischer, R.; Krejcar, O.; Selamat, A.; Kuca, K. 3D surface profile diagnosis using digital image processing for laboratory use. J. Cent. South Univ. 2020, 27, 811–823. [Google Scholar] [CrossRef]
- Wang, X.; Feng, C. Development of empirical models for surface roughness prediction in finish turning. Int. J. Adv. Manuf. Technol. 2002, 20, 348–356. [Google Scholar] [CrossRef]
- Ozcelik, B.; Bayramoglu, M. The statistical modeling of surface roughness in high-speed flat end milling. Int. J. Mach. Tools Manuf. 2006, 46, 1395–1402. [Google Scholar] [CrossRef]
- Lytvynenko, I.V.; Maruschak, P.O.; Lupenko, S.A.; Hats, Y.I.; Menou, A.; Panin, S.V. Software for segmentation, statistical analysis and modeling of surface ordered structures. In AIP Conference Proceedings; AIP Publishing LLC: Melville, NY, USA, 2016; Volume 1785, p. 030012. [Google Scholar] [CrossRef]
- Muller, F.; Kunz, C.; Graf, S. Bio-inspired functional surfaces based on laser-induced periodic surface structures. Materials 2016, 9, 476. [Google Scholar] [CrossRef] [PubMed]
- Schnell, G.; Staehlke, S.; Duenow, U.; Nebe, J.B.; Seitz, H. Femtosecond laser nano/micro textured Ti6Al4V surfaces—Effect on wetting and MG-63 cell adhesion. Materials 2019, 12, 2210. [Google Scholar] [CrossRef] [PubMed]


| Models | Taking into Account the Cyclical Nature of the Relief | Taking into Account the Random Nature of the Relief | Taking into Account the Morphological Features of Segments-Cycles of the Relief | Taking into Account the Rhythmic Features of the Deployment of Segments-Cycles of the Relief | Taking into Account the Amplitude Features of Segments-Cycles of the Relief |
|---|---|---|---|---|---|
| Well-known [5,6,7,16,17,18,19] | + | + | +/− | + | − |
| New | + | + | + | + | + |
Publisher’s Note: MDPI stays neutral with regard to jurisdictional claims in published maps and institutional affiliations. |
© 2020 by the authors. Licensee MDPI, Basel, Switzerland. This article is an open access article distributed under the terms and conditions of the Creative Commons Attribution (CC BY) license (http://creativecommons.org/licenses/by/4.0/).
Share and Cite
Hutsaylyuk, V.; Lytvynenko, I.; Maruschak, P.; Dzyura, V.; Schnell, G.; Seitz, H. A New Method for Modeling the Cyclic Structure of the Surface Microrelief of Titanium Alloy Ti6Al4V After Processing with Femtosecond Pulses. Materials 2020, 13, 4983. https://doi.org/10.3390/ma13214983
Hutsaylyuk V, Lytvynenko I, Maruschak P, Dzyura V, Schnell G, Seitz H. A New Method for Modeling the Cyclic Structure of the Surface Microrelief of Titanium Alloy Ti6Al4V After Processing with Femtosecond Pulses. Materials. 2020; 13(21):4983. https://doi.org/10.3390/ma13214983
Chicago/Turabian StyleHutsaylyuk, Volodymyr, Iaroslav Lytvynenko, Pavlo Maruschak, Volodymyr Dzyura, Georg Schnell, and Hermann Seitz. 2020. "A New Method for Modeling the Cyclic Structure of the Surface Microrelief of Titanium Alloy Ti6Al4V After Processing with Femtosecond Pulses" Materials 13, no. 21: 4983. https://doi.org/10.3390/ma13214983
APA StyleHutsaylyuk, V., Lytvynenko, I., Maruschak, P., Dzyura, V., Schnell, G., & Seitz, H. (2020). A New Method for Modeling the Cyclic Structure of the Surface Microrelief of Titanium Alloy Ti6Al4V After Processing with Femtosecond Pulses. Materials, 13(21), 4983. https://doi.org/10.3390/ma13214983