Predicting the Tool Wear of a Drilling Process Using Novel Machine Learning XGBoost-SDA


Abstract
1. Introduction
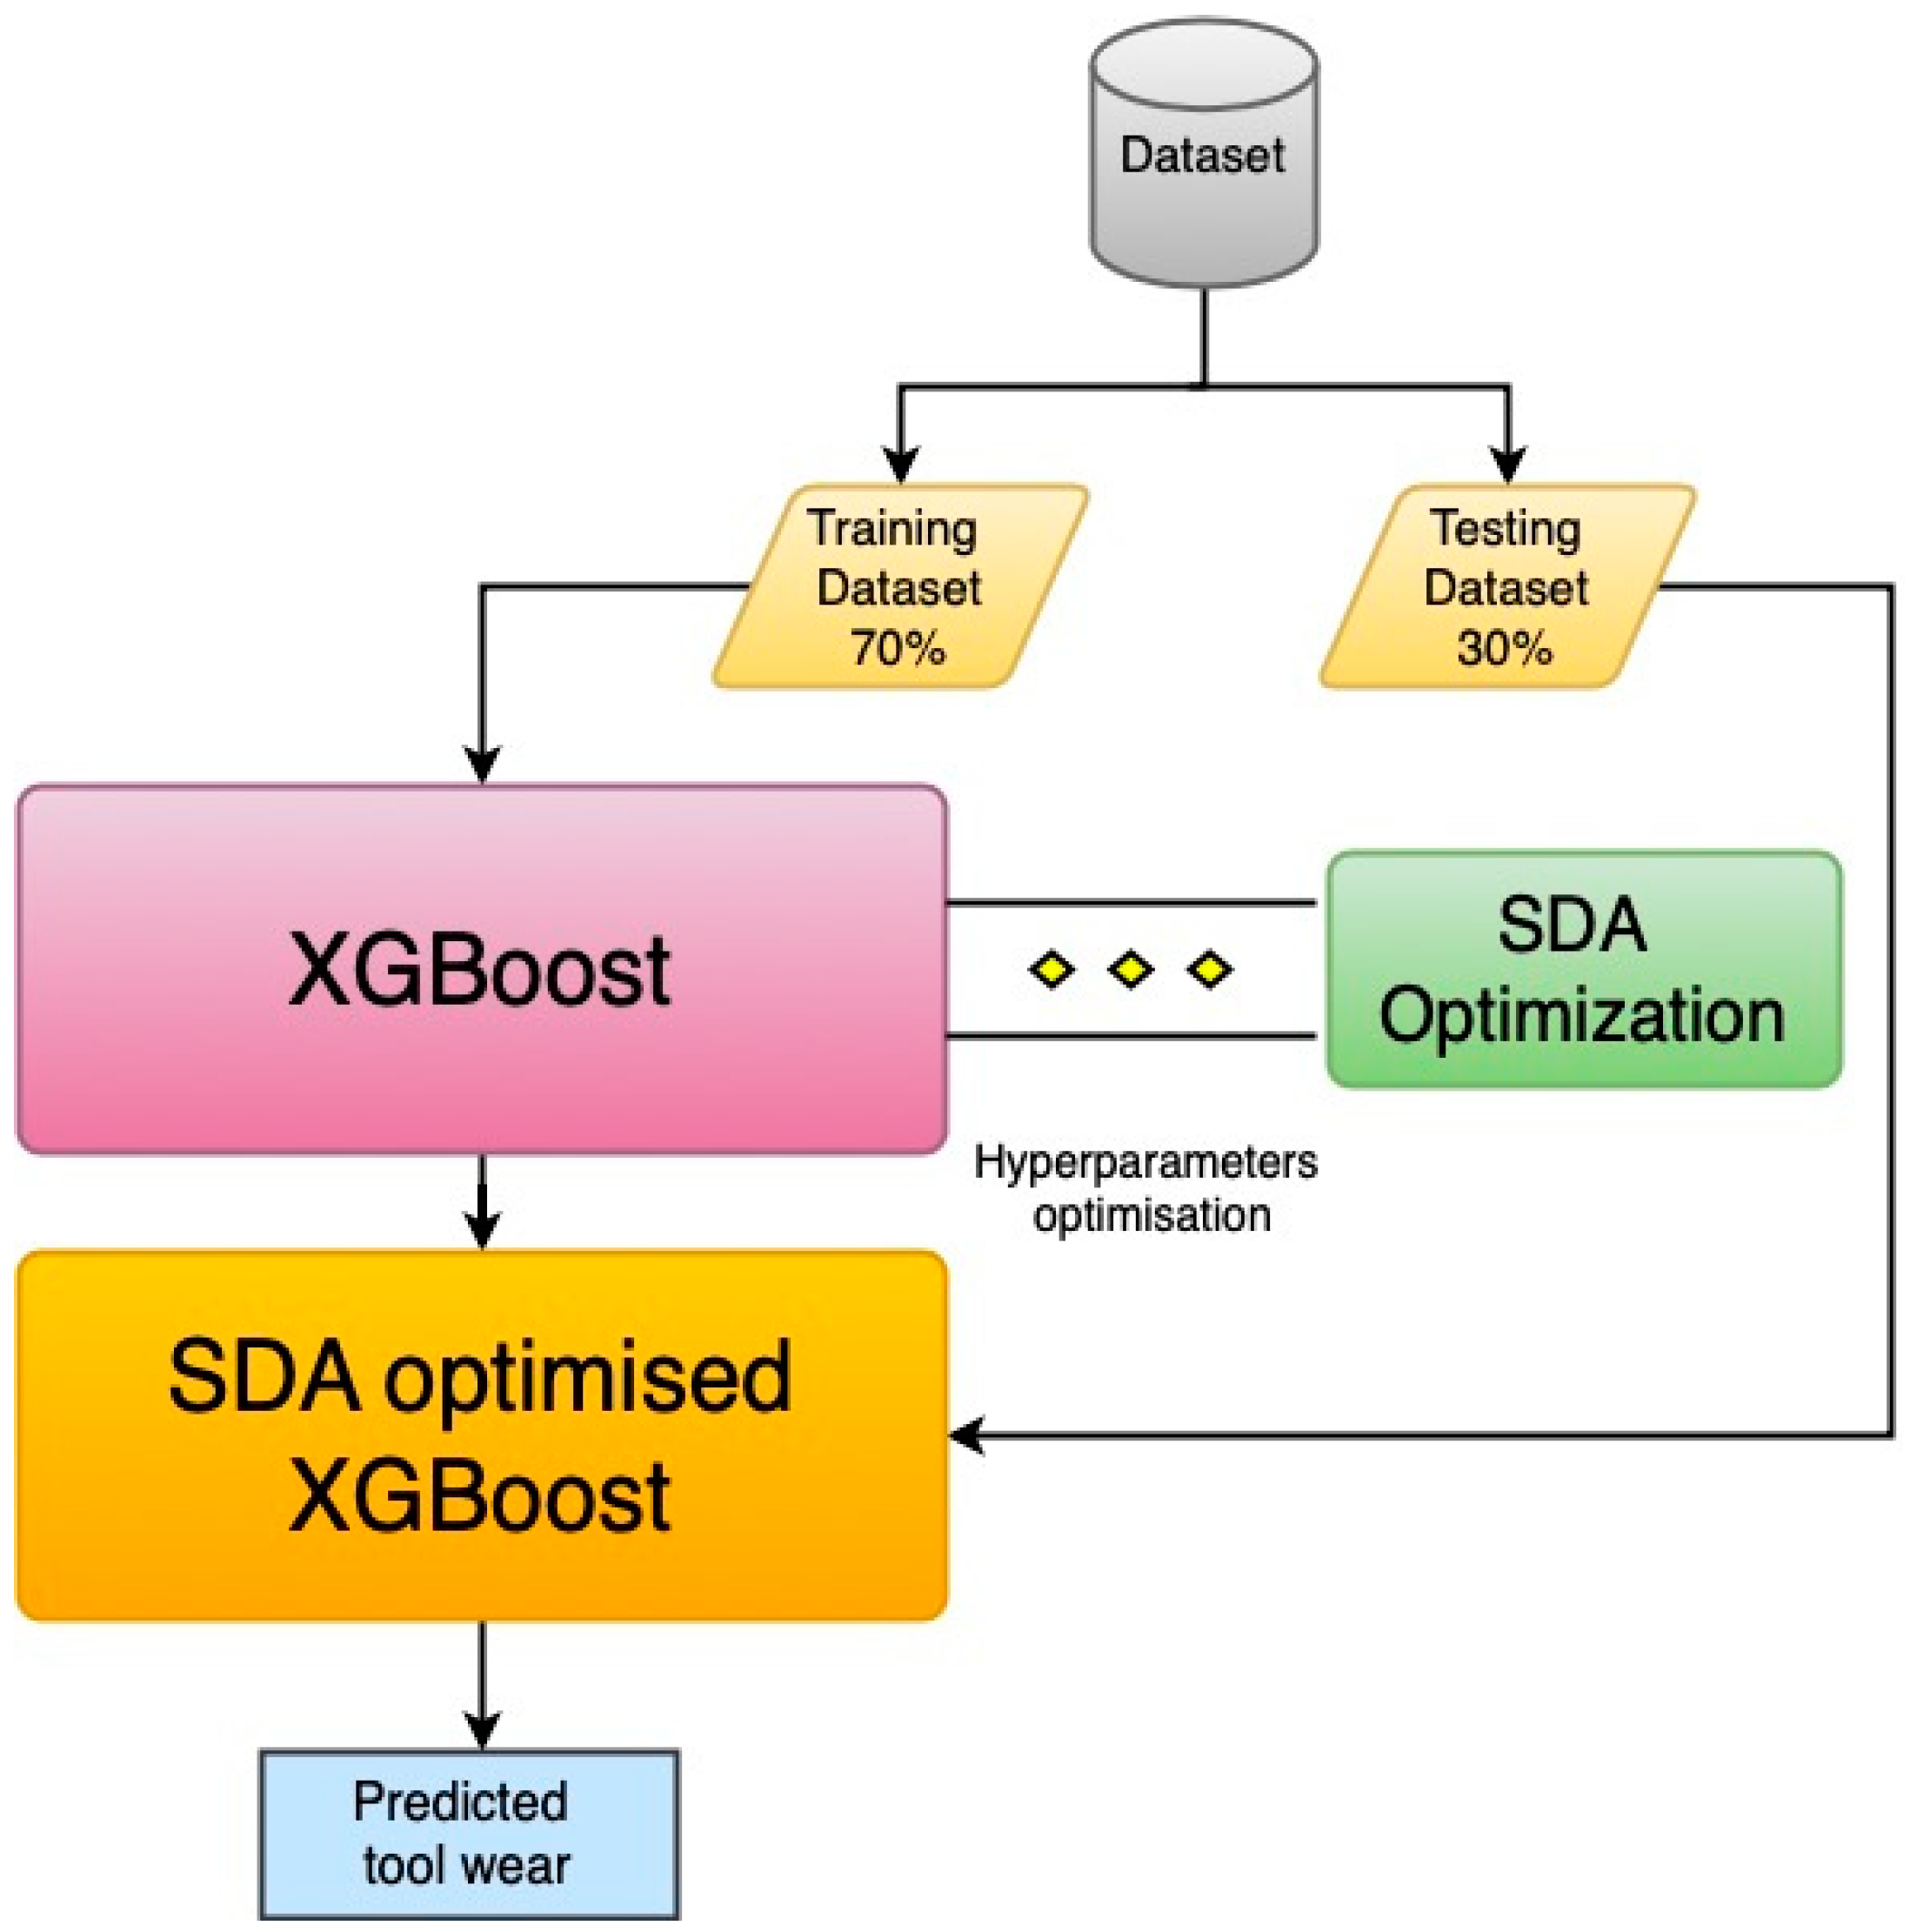
2. Methodology
2.1. Extreme Gradient Boosting (XGBoost) Algorithm
2.2. Spiral Dynamics Optimisation Algorithm (SDA)
| Algorithm 1: Spiral dynamics optimization algorithm |
| Step 0: Preparation |
| Select the number of search points |
| of and maximum number of iterations |
| Step 1: Initialization |
| Set initial points in the feasible region randomly and centered |
| with |
| Step 2: Update |
| for |
| Step 3: Update |
| with |
| Step 4: Check for the termination criteria |
| If then terminate; otherwise set and return to Step 2. |
3. Results and Discussion
4. Conclusions
Author Contributions
Funding
Conflicts of Interest
References
- Gordon, S.; Phelan, P.; Lahiff, C. The effect of high speed machining on the crater wear behavior of PCBN tools in hard turning. Procedia Manuf. 2019, 38, 1833–1848. [Google Scholar] [CrossRef]
- Li, C.; Xu, J.; Chen, M.; An, Q.; El Mansori, M.; Ren, F. Tool wear processes in low frequency vibration assisted drilling of CFRP/Ti6Al4V stacks with forced air-cooling. Wear 2019, 426–427, 1616–1623. [Google Scholar] [CrossRef]
- Shokrani, A.; Al-Samarrai, I.; Newman, S.T. Hybrid cryogenic MQL for improving tool life in machining of Ti-6Al-4V titanium alloy. J. Manuf. Process. 2019, 43, 229–243. [Google Scholar] [CrossRef]
- Khanna, N.; Agrawal, C.; Dogra, M.; Pruncu, C.I. Evaluation of tool wear, energy consumption, and surface roughness during turning of inconel 718 using sustainable machining technique. J. Mater. Res. Technol. 2020, 9, 5794–5804. [Google Scholar] [CrossRef]
- Fernández-Pérez, J.; Cantero, J.; Díaz-Álvarez, J.; Miguélez, M. Influence of cutting parameters on tool wear and hole quality in composite aerospace components drilling. Compos. Struct. 2017, 178, 157–161. [Google Scholar] [CrossRef]
- Sun, Z.; To, S. Effect of machining parameters and tool wear on surface uniformity in micro-milling. Micromachines 2018, 9, 268. [Google Scholar] [CrossRef] [PubMed]
- Sultan, A.; Sharif, S.; Kurniawan, D. Effect of machining parameters on tool wear and hole quality of AISI 316L stainless steel in conventional drilling. Procedia Manuf. 2015, 2, 202–207. [Google Scholar] [CrossRef]
- Wang, X.; Kwon, P.Y.; Sturtevant, C.; Kim, D.; Dae, W.; Lantrip, J. Tool wear of coated drills in drilling CFRP. J. Manuf. Process. 2013, 15, 127–135. [Google Scholar] [CrossRef]
- Imran, M.; Mativenga, P.; Gholinia, A.; Withers, P.J. Comparison of tool wear mechanisms and surface integrity for dry and wet micro-drilling of nickel-base superalloys. Int. J. Mach. Tools Manuf. 2014, 76, 49–60. [Google Scholar] [CrossRef]
- Xiang, J.; Pang, S.; Xie, L.; Gao, F.; Hu, X.; Yi, J.; Hu, F. Mechanism-based FE simulation of tool wear in diamond drilling of SiCp/Al composites. Materials 2018, 11, 252. [Google Scholar] [CrossRef]
- Wang, Q.; Zhang, D.; Tang, K.; Zhang, Y. A mechanics based prediction model for tool wear and power consumption in drilling operations and its applications. J. Clean. Prod. 2019, 234, 171–184. [Google Scholar] [CrossRef]
- Zhao, Y.; Noorbakhsh, A.; Koopialipoor, M.; Azizi, A.; Tahir, M.M. A new methodology for optimization and prediction of rate of penetration during drilling operations. Eng. Comput. 2019, 36, 587–595. [Google Scholar] [CrossRef]
- Kong, D.; Chen, Y.; Li, N. Gaussian process regression for tool wear prediction. Mech. Syst. Signal. Process. 2018, 104, 556–574. [Google Scholar] [CrossRef]
- Chen, Y.; Jin, Y.; Jiri, G. Predicting tool wear with multi-sensor data using deep belief networks. Int. J. Adv. Manuf. Technol. 2018, 99, 1917–1926. [Google Scholar] [CrossRef]
- Wei, J.; Chu, X.; Sun, X.; Xu, K.; Deng, H.; Chen, J.; Wei, Z.; Lei, M. Machine learning in materials science. InfoMat 2019, 1, 338–358. [Google Scholar] [CrossRef]
- Butler, K.T.; Davies, D.W.; Cartwright, H.; Isayev, O.; Walsh, A. Machine learning for molecular and materials science. Nat. Cell Biol. 2018, 559, 547–555. [Google Scholar] [CrossRef]
- Yang, W.-A.; Zhou, W.; Liao, W.; Guo, Y. Prediction of drill flank wear using ensemble of co-evolutionary particle swarm optimization based-selective neural network ensembles. J. Intell. Manuf. 2014, 27, 343–361. [Google Scholar] [CrossRef]
- Chen, N.; Hao, B.; Guo, Y.; Li, L.; Khan, M.A.; He, N. Research on tool wear monitoring in drilling process based on APSO-LS-SVM approach. Int. J. Adv. Manuf. Technol. 2020, 108, 2091–2101. [Google Scholar] [CrossRef]
- Saw, L.H.; Ho, L.W.; Yew, M.C.; Yusof, F.; Pambudi, N.A.; Ng, T.C.; Yew, M.K. Sensitivity analysis of drill wear and optimization using Adaptive Neuro fuzzy –genetic algorithm technique toward sustainable machining. J. Clean. Prod. 2018, 172, 3289–3298. [Google Scholar] [CrossRef]
- D’Addona, D.M.; Ullah, A.M.M.S.; Matarazzo, D. Tool-wear prediction and pattern-recognition using artificial neural network and DNA-based computing. J. Intell. Manuf. 2015, 28, 1285–1301. [Google Scholar] [CrossRef]
- Patra, K.; Jha, A.; Szalay, T.; Ranjan, J.; Monostori, L. Artificial neural network based tool condition monitoring in micro mechanical peck drilling using thrust force signals. Precis. Eng. 2017, 48, 279–291. [Google Scholar] [CrossRef]
- Alajmi, M.S.; Almeshal, A.M. Prediction and optimization of surface roughness in a turning process using the ANFIS-QPSO method. Materials 2020, 13, 2986. [Google Scholar] [CrossRef]
- Sarir, P.; Chen, J.; Asteris, P.G.; Armaghani, D.J.; Tahir, M.M. Developing GEP tree-based, neuro-swarm, and whale optimization models for evaluation of bearing capacity of concrete-filled steel tube columns. Eng. Comput. 2019, 1, 1–19. [Google Scholar] [CrossRef]
- Koopialipoor, M.; Ghaleini, E.N.; Haghighi, M.; Kanagarajan, S.; Maarefvand, P.; Mohamad, E.T. Overbreak prediction and optimization in tunnel using neural network and bee colony techniques. Eng. Comput. 2018, 35, 1191–1202. [Google Scholar] [CrossRef]
- Ghritlahre, H.K.; Prasad, R.K. Application of ANN technique to predict the performance of solar collector systems—A review. Renew. Sustain. Energy Rev. 2018, 84, 75–88. [Google Scholar] [CrossRef]
- Keybondorian, E.; Taherpour, A.; Bemani, A.; Hamule, T. Application of novel ANFIS-PSO approach to predict asphaltene precipitation. Pet. Sci. Technol. 2017, 36, 154–159. [Google Scholar] [CrossRef]
- Datta, S.P.; Das, P.K.; Mukhopadhyay, S. An optimized ANN for the performance prediction of an automotive air conditioning system. Sci. Technol. Built Environ. 2019, 25, 282–296. [Google Scholar] [CrossRef]
- Elsaid, A.; El Jamiy, F.; Higgins, J.; Wild, B.; Desell, T. Optimizing long short-term memory recurrent neural networks using ant colony optimization to predict turbine engine vibration. Appl. Soft Comput. 2018, 73, 969–991. [Google Scholar] [CrossRef]
- Chen, T.; Guestrin, C. Xgboost: A scalable tree boosting system. In Proceedings of the 22nd ACM SIGKDD International Conference on Knowledge Discovery and Data Mining, San Francisco, CA, USA, 13–17 August 2016; pp. 785–794. [Google Scholar]
- Cerna, S.; Guyeux, C.; Royer, G.; Chevallier, C.; Plumerel, G. Predicting fire brigades operational breakdowns: A real case study. Mathematics 2020, 8, 1383. [Google Scholar] [CrossRef]
- Cheng, F.; Yang, C.; Zhou, C.; Lan, L.; Zhu, H.; Li, Y. Simultaneous determination of metal ions in zinc sulfate solution using UV–Vis spectrometry and SPSE-XGBoost method. Sensors 2020, 20, 4936. [Google Scholar] [CrossRef]
- Afonso, R.; Neves, A.; Damásio, C.V.; Pires, J.M.; Birra, F.; Santos, M.Y. Assessment of interventions in fuel management zones using remote sensing. ISPRS Int. J. Geo-Inf. 2020, 9, 533. [Google Scholar] [CrossRef]
- Tamura, K.; Yasuda, K. Spiral Dynamics Inspired Optimization. J. Adv. Comput. Intell. Intell. Inform. 2011, 15, 1116–1122. [Google Scholar] [CrossRef]
- Alonso, U.; Fernandez-Vidal, S.R.; Calamaz, M.; Mata, F.A.G. Wear mechanisms and wear model of carbide tools during dry drilling of CFRP/TiAl6V4 stacks. Materials 2019, 12, 2843. [Google Scholar] [CrossRef]


| Arithmetic Surface Roughness (µm) | |
| Maximum peak to valley height (µm) | |
| Cutting Speed (m/min) | |
| Feed Rate (mm/rev) | |
| Depth of Cut (mm) | |
| F | Thrust Force, N |
| M | Torque, Nm |
| Tool Nose Radius | |
| major cutting edge angles | |
| end cutting edge angle | |
| MAE | Mean Root Square Error |
| RMSE | Root Mean Square Error |
| R2 | Coefficient of Determination |
| Parameter | Description |
|---|---|
| D | maximum tree depth |
| Regularization parameter to define the number of nodes in each tree | |
| K | Number of trees |
| Learning rate | |
| Regularization parameter | |
| N | Number of samples |
| Parameter | Description |
|---|---|
| Rotation angle, | |
| Maximum iteration number. | |
| R | Convergence rate of distance between a point and the origin, |
| Rotation matrix between xi and xj planes | |
| M | Dimension of the search space |
| Trial | Spindle Speed (rpm) | Drill Diameter (mm) | Feed Rate (mm/rev) | Thrust Force (N) | Torque (Nm) | Measured Flank Wear (mm) |
|---|---|---|---|---|---|---|
| 1 | 315 | 5 | 0.36 | 592 | 7.72 | 0.10 |
| 2 | 315 | 5 | 0.5 | 1210 | 13.39 | 0.08 |
| 3 | 315 | 5 | 0.71 | 1282 | 16.66 | 0.10 |
| 4 | 315 | 7.5 | 0.36 | 1866 | 12.74 | 0.16 |
| 5 | 315 | 7.5 | 0.5 | 1688 | 15.19 | 0.14 |
| 6 | 315 | 7.5 | 0.71 | 1828 | 17.15 | 0.12 |
| 7 | 315 | 10 | 0.36 | 3303 | 25.33 | 0.20 |
| 8 | 315 | 10 | 0.5 | 3413 | 29.54 | 0.21 |
| 9 | 315 | 10 | 0.71 | 3920 | 36.22 | 0.24 |
| 10 | 400 | 5 | 0.13 | 267 | 3.1 | 0.05 |
| 11 | 400 | 5 | 0.18 | 451 | 3.96 | 0.09 |
| 12 | 400 | 5 | 0.25 | 505 | 1.96 | 0.07 |
| 13 | 400 | 7.5 | 0.13 | 853 | 11.27 | 0.09 |
| 14 | 400 | 7.5 | 0.18 | 646 | 12.64 | 0.10 |
| 15 | 400 | 7.5 | 0.25 | 1051 | 16.54 | 0.10 |
| 16 | 400 | 10 | 0.13 | 2518 | 23.52 | 0.19 |
| 17 | 400 | 10 | 0.18 | 3921 | 26.78 | 0.20 |
| 18 | 400 | 10 | 0.25 | 4010 | 29.25 | 0.26 |
| 19 | 500 | 5 | 0.13 | 245 | 2.5 | 0.03 |
| 20 | 500 | 5 | 0.18 | 275 | 2.75 | 0.06 |
| 21 | 500 | 5 | 0.25 | 386 | 2.9 | 0.10 |
| 22 | 500 | 7.5 | 0.13 | 510 | 7.1 | 0.06 |
| 23 | 500 | 7.5 | 0.18 | 595 | 4.41 | 0.08 |
| 24 | 500 | 7.5 | 0.25 | 539 | 5.39 | 0.11 |
| 25 | 500 | 10 | 0.13 | 1925 | 19.253 | 0.11 |
| 26 | 500 | 10 | 0.18 | 3860 | 25.1 | 0.20 |
| 27 | 500 | 10 | 0.25 | 740 | 27.44 | 0.21 |
| 28 | 630 | 5 | 0.13 | 186 | 2.94 | 0.08 |
| 29 | 630 | 5 | 0.18 | 187 | 2.64 | 0.07 |
| 30 | 630 | 5 | 0.25 | 285 | 2.15 | 0.03 |
| 31 | 630 | 7.5 | 0.13 | 488 | 5.86 | 0.09 |
| 32 | 630 | 7.5 | 0.18 | 524 | 3.95 | 0.10 |
| 33 | 630 | 7.5 | 0.25 | 441 | 4.41 | 0.10 |
| 34 | 630 | 10 | 0.13 | 1258 | 10.11 | 0.12 |
| 35 | 630 | 10 | 0.18 | 1470 | 13.23 | 0.13 |
| 36 | 630 | 10 | 0.25 | 3077 | 5.68 | 0.18 |
| 37 | 800 | 5 | 0.5 | 1087 | 11.27 | 0.09 |
| 38 | 800 | 7.5 | 0.36 | 1666 | 8.66 | 0.13 |
| 39 | 800 | 7.5 | 0.5 | 1440 | 19.3 | 0.13 |
| 40 | 800 | 10 | 0.36 | 2234 | 22.34 | 0.16 |
| 41 | 800 | 10 | 0.5 | 2548 | 24.1 | 0.19 |
| 42 | 1000 | 5 | 0.36 | 421 | 4.21 | 0.06 |
| 43 | 1000 | 5 | 0.5 | 651 | 6.17 | 0.07 |
| 44 | 1000 | 7.5 | 0.36 | 554 | 5.39 | 0.10 |
| 45 | 1000 | 7.5 | 0.5 | 784 | 7.35 | 0.10 |
| 46 | 1000 | 7.5 | 0.71 | 970 | 8.05 | 0.12 |
| 47 | 1000 | 10 | 0.36 | 1460 | 12.25 | 0.14 |
| 48 | 1000 | 10 | 0.5 | 1960 | 18.13 | 0.13 |
| 49 | 1000 | 10 | 0.71 | 2009 | 20.58 | 0.17 |
| Metric | XGBoost-SDA | SVM | MLP-ANN |
|---|---|---|---|
| MAE | 4.67% | 5.31% | 8.87% |
| RMSE | 5.32% | 6.07% | 10.86% |
| R2 | 0.9973 | 0.9952 | 0.9849 |
| Trial | Measured Flank Wear | XGBoost-SDA | MLP-ANN | SVM |
|---|---|---|---|---|
| 1 | 0.10 | 0.10 | 0.10 | 0.11 |
| 2 | 0.08 | 0.09 | 0.08 | 0.09 |
| 3 | 0.10 | 0.10 | 0.11 | 0.11 |
| 4 | 0.16 | 0.16 | 0.16 | 0.16 |
| 5 | 0.14 | 0.15 | 0.15 | 0.15 |
| 6 | 0.12 | 0.13 | 0.13 | 0.13 |
| 7 | 0.20 | 0.22 | 0.22 | 0.22 |
| 8 | 0.21 | 0.22 | 0.23 | 0.21 |
| 9 | 0.24 | 0.25 | 0.26 | 0.24 |
| 10 | 0.05 | 0.05 | 0.05 | 0.06 |
| 11 | 0.09 | 0.09 | 0.10 | 0.09 |
| 12 | 0.07 | 0.07 | 0.07 | 0.07 |
| 13 | 0.09 | 0.09 | 0.09 | 0.09 |
| 14 | 0.10 | 0.10 | 0.10 | 0.10 |
| 15 | 0.10 | 0.10 | 0.11 | 0.11 |
| 16 | 0.19 | 0.20 | 0.20 | 0.19 |
| 17 | 0.20 | 0.21 | 0.22 | 0.21 |
| 18 | 0.26 | 0.28 | 0.26 | 0.28 |
| 19 | 0.03 | 0.03 | 0.04 | 0.03 |
| 20 | 0.06 | 0.06 | 0.06 | 0.06 |
| 21 | 0.10 | 0.10 | 0.11 | 0.10 |
| 22 | 0.06 | 0.06 | 0.07 | 0.07 |
| 23 | 0.08 | 0.08 | 0.09 | 0.08 |
| 24 | 0.11 | 0.11 | 0.11 | 0.11 |
| 25 | 0.11 | 0.11 | 0.11 | 0.12 |
| 26 | 0.20 | 0.21 | 0.22 | 0.21 |
| 27 | 0.21 | 0.23 | 0.23 | 0.22 |
| 28 | 0.08 | 0.08 | 0.09 | 0.09 |
| 29 | 0.07 | 0.08 | 0.08 | 0.07 |
| 30 | 0.03 | 0.03 | 0.03 | 0.03 |
| 31 | 0.09 | 0.10 | 0.11 | 0.09 |
| 32 | 0.10 | 0.11 | 0.11 | 0.11 |
| 33 | 0.10 | 0.10 | 0.11 | 0.10 |
| 34 | 0.12 | 0.13 | 0.13 | 0.13 |
| 35 | 0.13 | 0.13 | 0.14 | 0.13 |
| 36 | 0.18 | 0.19 | 0.22 | 0.20 |
| 37 | 0.09 | 0.09 | 0.10 | 0.09 |
| 38 | 0.13 | 0.13 | 0.14 | 0.13 |
| 39 | 0.13 | 0.13 | 0.13 | 0.13 |
| 40 | 0.16 | 0.17 | 0.18 | 0.16 |
| 41 | 0.19 | 0.19 | 0.21 | 0.20 |
| 42 | 0.06 | 0.07 | 0.08 | 0.06 |
| 43 | 0.07 | 0.07 | 0.08 | 0.07 |
| 44 | 0.10 | 0.11 | 0.10 | 0.11 |
| 45 | 0.10 | 0.10 | 0.12 | 0.10 |
| 46 | 0.12 | 0.13 | 0.12 | 0.12 |
| 47 | 0.14 | 0.14 | 0.16 | 0.15 |
| 48 | 0.13 | 0.14 | 0.14 | 0.13 |
| 49 | 0.17 | 0.18 | 0.18 | 0.18 |
| Trial | Spindle Speed (rpm) | Drill Diameter (mm) | Feed Rate (mm/rev) | Thrust Force (N) | Torque (Nm) | Measured Flank Wear (mm) |
|---|---|---|---|---|---|---|
| 1 | 250 | 9 | 0.13 | 1212.4 | 11.47 | 0.16 |
| 2 | 250 | 10 | 0.13 | 1677.3 | 16.01 | 0.12 |
| 3 | 250 | 11 | 0.13 | 1394.6 | 13.88 | 0.17 |
| 4 | 250 | 12 | 0.13 | 1578.2 | 15.62 | 0.2 |
| 5 | 250 | 9 | 0.18 | 1752.6 | 17.23 | 0.18 |
| 6 | 250 | 10 | 0.18 | 1869.7 | 18.64 | 0.18 |
| 7 | 250 | 11 | 0.18 | 2156.8 | 21.72 | 0.17 |
| 8 | 250 | 12 | 0.18 | 2163.4 | 21.41 | 0.17 |
| 9 | 250 | 9 | 0.25 | 2077.1 | 20.35 | 0.13 |
| 10 | 250 | 10 | 0.25 | 2824.2 | 28.11 | 0.17 |
| 11 | 250 | 11 | 0.25 | 2885.6 | 28.04 | 0.18 |
| 12 | 250 | 9 | 0.36 | 2816.7 | 28.22 | 0.14 |
| 13 | 250 | 10 | 0.36 | 3323.1 | 33.08 | 0.14 |
| 14 | 250 | 11 | 0.36 | 3001.4 | 29.14 | 0.17 |
| 15 | 250 | 12 | 0.36 | 3311.2 | 33.11 | 0.19 |
| 16 | 315 | 9 | 0.13 | 1185.2 | 11.43 | 0.15 |
| 17 | 315 | 10 | 0.13 | 1627.3 | 15.8 | 0.11 |
| 18 | 315 | 11 | 0.13 | 1342.9 | 13.61 | 0.13 |
| 19 | 315 | 12 | 0.13 | 1524.6 | 15.28 | 0.17 |
| 20 | 315 | 9 | 0.18 | 1707.8 | 16.97 | 0.16 |
| 21 | 315 | 10 | 0.18 | 1827.6 | 18.27 | 0.16 |
| 22 | 315 | 11 | 0.18 | 2097 | 21.03 | 0.16 |
| 23 | 315 | 12 | 0.18 | 2121.8 | 21.17 | 0.14 |
| 24 | 315 | 9 | 0.25 | 2025.8 | 20.06 | 0.11 |
| 25 | 315 | 10 | 0.25 | 2786.7 | 27.84 | 0.16 |
| 26 | 315 | 11 | 0.25 | 2753.8 | 27.68 | 0.16 |
| 27 | 315 | 12 | 0.25 | 2612.6 | 26.21 | 0.21 |
| 28 | 315 | 9 | 0.36 | 2778 | 27.82 | 0.12 |
| 29 | 315 | 10 | 0.36 | 3284.2 | 32.95 | 0.15 |
| 30 | 315 | 11 | 0.36 | 2860.1 | 28.55 | 0.15 |
| 31 | 315 | 12 | 0.36 | 3270 | 32.99 | 0.17 |
| 32 | 400 | 9 | 0.13 | 1150.9 | 11.22 | 0.12 |
| 33 | 400 | 10 | 0.13 | 1215.6 | 11.18 | 0.08 |
| 34 | 400 | 11 | 0.13 | 1318.6 | 13.04 | 0.11 |
| 35 | 400 | 12 | 0.13 | 1464.3 | 14.39 | 0.16 |
| 36 | 400 | 9 | 0.18 | 1486.4 | 15.01 | 0.15 |
| 37 | 400 | 10 | 0.18 | 1547.7 | 15.71 | 0.15 |
| 38 | 400 | 11 | 0.18 | 2067 | 20.71 | 0.14 |
| 39 | 400 | 12 | 0.18 | 2114.6 | 18.64 | 0.13 |
| 40 | 400 | 9 | 0.25 | 1642.8 | 16.36 | 0.1 |
| 41 | 400 | 10 | 0.25 | 1715.2 | 17.08 | 0.14 |
| 42 | 400 | 11 | 0.25 | 2538.9 | 25.42 | 0.15 |
| 43 | 400 | 12 | 0.25 | 2558.6 | 23.58 | 0.17 |
| 44 | 400 | 9 | 0.36 | 1721.3 | 17.64 | 0.11 |
| 45 | 400 | 10 | 0.36 | 1782.6 | 17.95 | 0.12 |
| 46 | 400 | 11 | 0.36 | 2752.7 | 27.66 | 0.12 |
| 47 | 400 | 12 | 0.36 | 2924.3 | 24.92 | 0.15 |
| 48 | 500 | 9 | 0.13 | 1088.1 | 10.67 | 0.1 |
| 49 | 500 | 10 | 0.13 | 1188.3 | 11.06 | 0.07 |
| 50 | 500 | 11 | 0.13 | 1254.9 | 12.54 | 0.1 |
| 51 | 500 | 12 | 0.13 | 1277.8 | 13.28 | 0.14 |
| 52 | 500 | 9 | 0.18 | 1435.1 | 14.66 | 0.13 |
| 53 | 500 | 10 | 0.18 | 1504.8 | 15.11 | 0.12 |
| 54 | 500 | 11 | 0.18 | 1556.8 | 18.32 | 0.13 |
| 55 | 500 | 12 | 0.18 | 1624.3 | 18.51 | 0.11 |
| 56 | 500 | 9 | 0.25 | 1588.3 | 16.04 | 0.06 |
| 57 | 500 | 10 | 0.25 | 1668.9 | 16.85 | 0.11 |
| 58 | 500 | 11 | 0.25 | 1724.3 | 23.41 | 0.14 |
| 59 | 500 | 12 | 0.25 | 1856.3 | 23.51 | 0.1 |
| 60 | 500 | 9 | 0.36 | 1669.8 | 17.12 | 0.09 |
| 61 | 500 | 10 | 0.36 | 1754.8 | 17.69 | 0.08 |
| 62 | 500 | 11 | 0.36 | 1869.4 | 24.65 | 0.09 |
| 63 | 500 | 12 | 0.36 | 2005.4 | 24.78 | 0.1 |
| Metric | XGBoost-SDA | SVM | MLP-ANN |
|---|---|---|---|
| MAE | 5.25% | 6.51% | 7.13% |
| RMSE | 6.49% | 8.07% | 8.83% |
| R2 | 0.9756 | 0.9633 | 0.9553 |
| Trial | Measured Flank Wear | XGBoost-SDA | MLP-ANN | SVM |
|---|---|---|---|---|
| 1 | 0.16 | 0.17 | 0.17 | 0.17 |
| 2 | 0.12 | 0.13 | 0.13 | 0.13 |
| 3 | 0.17 | 0.17 | 0.20 | 0.17 |
| 4 | 0.2 | 0.21 | 0.20 | 0.21 |
| 5 | 0.18 | 0.19 | 0.20 | 0.20 |
| 6 | 0.18 | 0.19 | 0.19 | 0.18 |
| 7 | 0.17 | 0.17 | 0.17 | 0.19 |
| 8 | 0.17 | 0.17 | 0.18 | 0.18 |
| 9 | 0.13 | 0.14 | 0.14 | 0.13 |
| 10 | 0.17 | 0.19 | 0.19 | 0.18 |
| 11 | 0.18 | 0.18 | 0.18 | 0.19 |
| 12 | 0.14 | 0.15 | 0.14 | 0.15 |
| 13 | 0.14 | 0.15 | 0.14 | 0.15 |
| 14 | 0.17 | 0.18 | 0.19 | 0.18 |
| 15 | 0.19 | 0.19 | 0.20 | 0.21 |
| 16 | 0.15 | 0.15 | 0.16 | 0.16 |
| 17 | 0.11 | 0.12 | 0.11 | 0.11 |
| 18 | 0.13 | 0.14 | 0.14 | 0.13 |
| 19 | 0.17 | 0.20 | 0.20 | 0.18 |
| 20 | 0.16 | 0.17 | 0.17 | 0.16 |
| 21 | 0.16 | 0.16 | 0.19 | 0.18 |
| 22 | 0.16 | 0.17 | 0.17 | 0.18 |
| 23 | 0.14 | 0.14 | 0.16 | 0.15 |
| 24 | 0.11 | 0.11 | 0.12 | 0.12 |
| 25 | 0.16 | 0.18 | 0.16 | 0.18 |
| 26 | 0.16 | 0.17 | 0.18 | 0.17 |
| 27 | 0.21 | 0.22 | 0.23 | 0.25 |
| 28 | 0.12 | 0.12 | 0.12 | 0.14 |
| 29 | 0.15 | 0.16 | 0.16 | 0.15 |
| 30 | 0.15 | 0.16 | 0.17 | 0.18 |
| 31 | 0.17 | 0.18 | 0.17 | 0.18 |
| 32 | 0.12 | 0.12 | 0.13 | 0.12 |
| 33 | 0.08 | 0.08 | 0.08 | 0.09 |
| 34 | 0.11 | 0.11 | 0.12 | 0.12 |
| 35 | 0.16 | 0.17 | 0.17 | 0.16 |
| 36 | 0.15 | 0.16 | 0.16 | 0.16 |
| 37 | 0.15 | 0.17 | 0.16 | 0.16 |
| 38 | 0.14 | 0.14 | 0.14 | 0.16 |
| 39 | 0.13 | 0.13 | 0.13 | 0.13 |
| 40 | 0.1 | 0.10 | 0.11 | 0.10 |
| 41 | 0.14 | 0.15 | 0.14 | 0.16 |
| 42 | 0.15 | 0.16 | 0.16 | 0.16 |
| 43 | 0.17 | 0.18 | 0.19 | 0.17 |
| 44 | 0.11 | 0.12 | 0.11 | 0.11 |
| 45 | 0.12 | 0.13 | 0.14 | 0.12 |
| 46 | 0.12 | 0.14 | 0.12 | 0.12 |
| 47 | 0.15 | 0.16 | 0.17 | 0.15 |
| 48 | 0.1 | 0.10 | 0.11 | 0.11 |
| 49 | 0.07 | 0.07 | 0.08 | 0.07 |
| 50 | 0.1 | 0.11 | 0.12 | 0.11 |
| 51 | 0.14 | 0.15 | 0.14 | 0.15 |
| 52 | 0.13 | 0.13 | 0.15 | 0.13 |
| 53 | 0.12 | 0.12 | 0.13 | 0.14 |
| 54 | 0.13 | 0.14 | 0.14 | 0.15 |
| 55 | 0.11 | 0.11 | 0.12 | 0.12 |
| 56 | 0.06 | 0.06 | 0.06 | 0.06 |
| 57 | 0.11 | 0.12 | 0.11 | 0.12 |
| 58 | 0.14 | 0.14 | 0.14 | 0.14 |
| 59 | 0.1 | 0.10 | 0.11 | 0.11 |
| 60 | 0.09 | 0.10 | 0.09 | 0.10 |
| 61 | 0.08 | 0.09 | 0.08 | 0.08 |
| 62 | 0.09 | 0.10 | 0.09 | 0.09 |
| 63 | 0.1 | 0.11 | 0.11 | 0.10 |
Publisher’s Note: MDPI stays neutral with regard to jurisdictional claims in published maps and institutional affiliations. |
© 2020 by the authors. Licensee MDPI, Basel, Switzerland. This article is an open access article distributed under the terms and conditions of the Creative Commons Attribution (CC BY) license (http://creativecommons.org/licenses/by/4.0/).
Share and Cite
Alajmi, M.S.; Almeshal, A.M. Predicting the Tool Wear of a Drilling Process Using Novel Machine Learning XGBoost-SDA. Materials 2020, 13, 4952. https://doi.org/10.3390/ma13214952
Alajmi MS, Almeshal AM. Predicting the Tool Wear of a Drilling Process Using Novel Machine Learning XGBoost-SDA. Materials. 2020; 13(21):4952. https://doi.org/10.3390/ma13214952
Chicago/Turabian StyleAlajmi, Mahdi S., and Abdullah M. Almeshal. 2020. "Predicting the Tool Wear of a Drilling Process Using Novel Machine Learning XGBoost-SDA" Materials 13, no. 21: 4952. https://doi.org/10.3390/ma13214952
APA StyleAlajmi, M. S., & Almeshal, A. M. (2020). Predicting the Tool Wear of a Drilling Process Using Novel Machine Learning XGBoost-SDA. Materials, 13(21), 4952. https://doi.org/10.3390/ma13214952