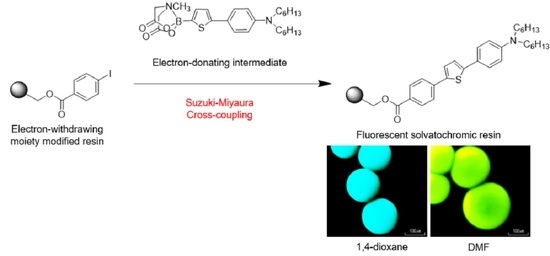
Synthesis of a Fluorescent Solvatochromic Resin Using Suzuki–Miyaura Cross-Coupling and Its Optical Waveguide Spectra to Measure the Solvent Polarity on the Surface


Abstract
1. Introduction
2. Materials and Methods
2.1. General
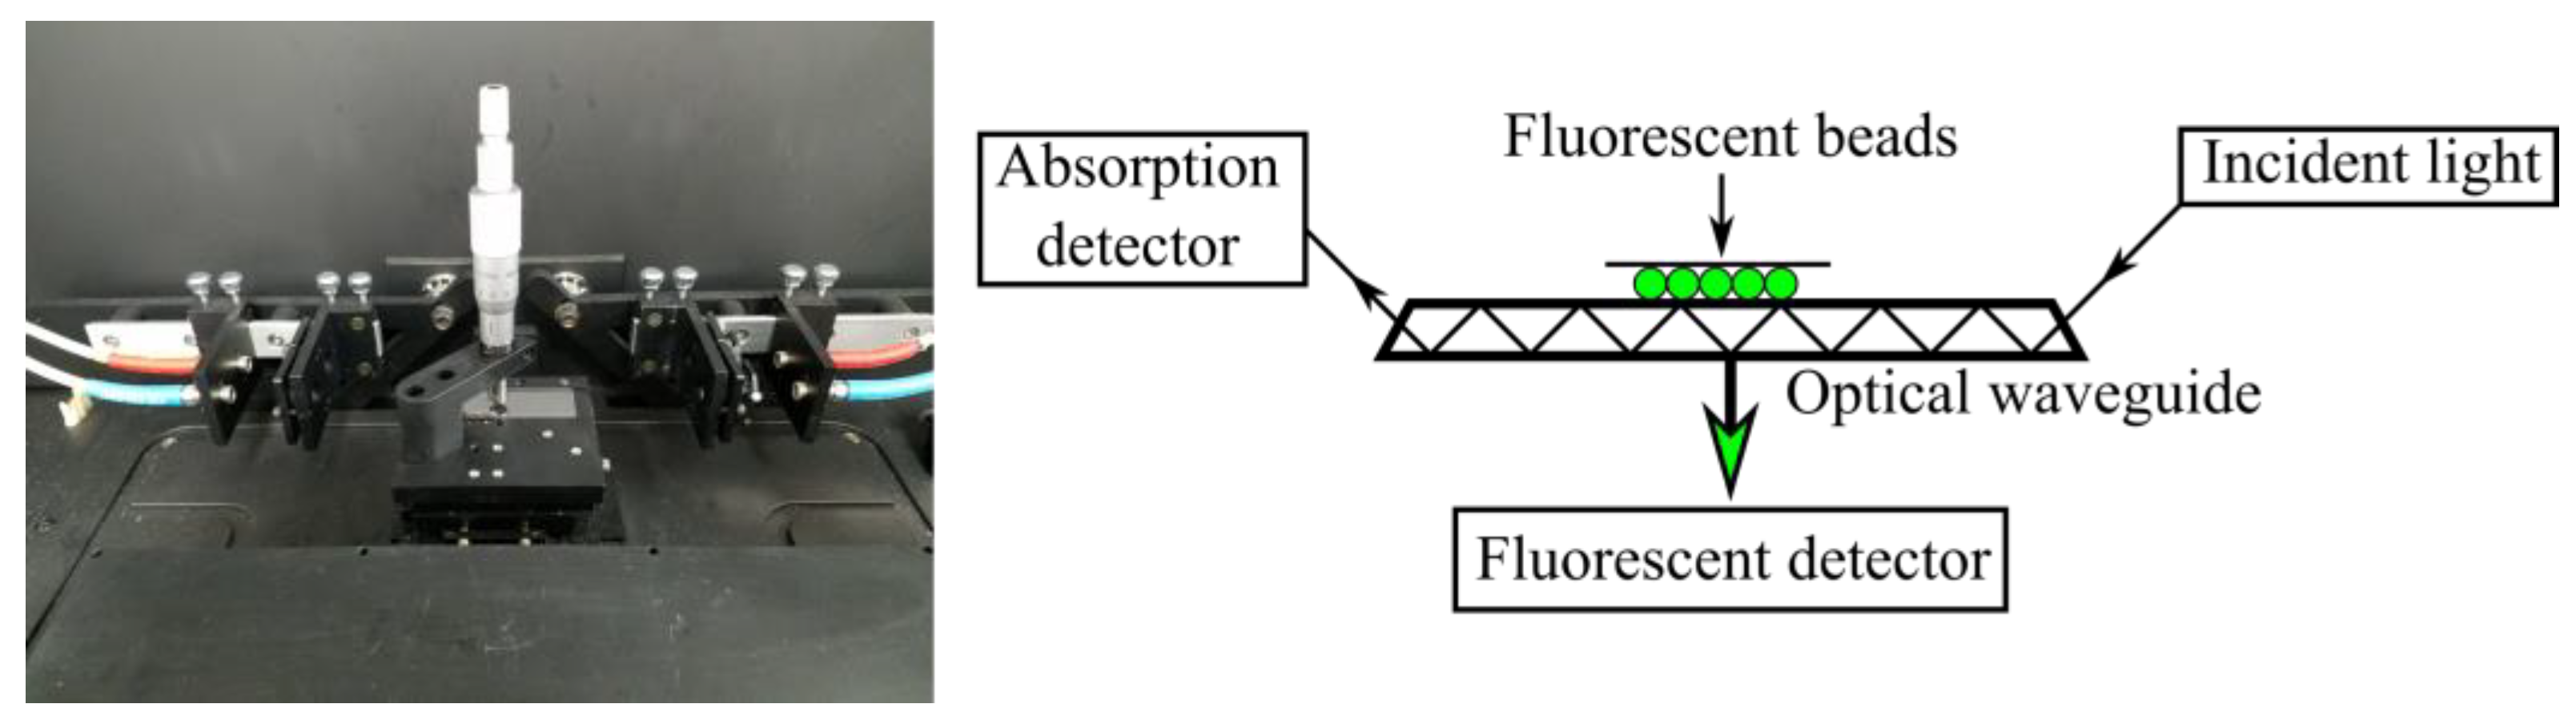
2.2. Measurements
2.3. Synthetic Procedure
2.3.1. Loading of 4-iodobenzoic Acid to Wang Resin (1)
2.3.2. Synthesis of N,N-dihexyl-4-iodoaniline (2)
2.3.3. Synthesis of N,N-dihexyl-4-(4,4,5,5-tetramethyl-1,3,2-dioxaborolan-2-yl)aniline (3)
2.3.4. Synthesis of 5-bromo-2-thienylboronic Acid N-methyliminodiacetic Acid Ester (4)
2.3.5. Synthesis of 5-[4-(N,N-dihexylamino)phenyl]-2-thienylboronic Acid MIDA Ester (5)
2.3.6. Synthesis of Fluorescent Solvatochromic Dye Substituted Resin (6)
2.3.7. Synthesis of Methyl 1-[4-[5-[4-(N,N-dihexhylamino)phenyl]-2-thienyl]-phenyl]-carboxylate (7)
3. Results
3.1. Synthesis of Resin 6 and Dye 7
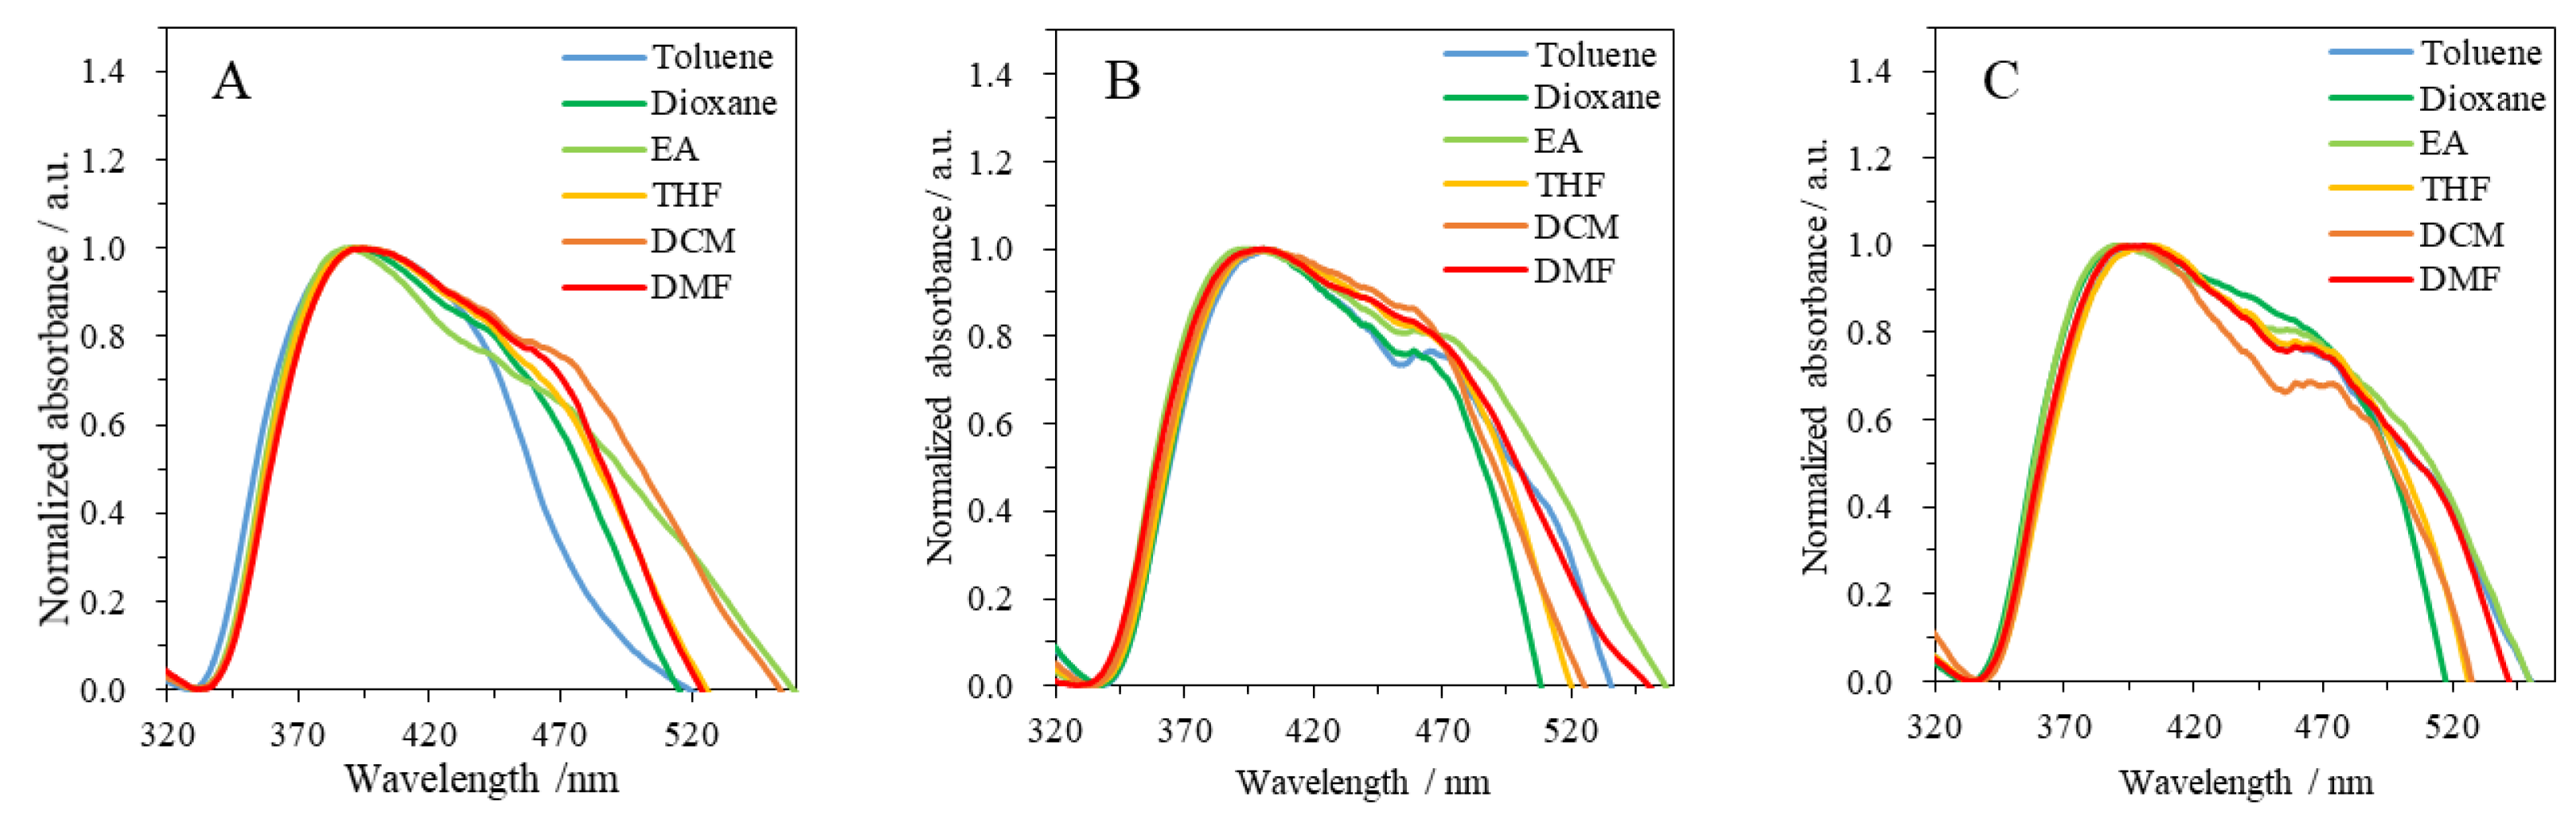
3.2. Photophysical Properties of Resin 6 and Dye 7
3.3. Influence of the Concentration of Immobilized Dye Molecules on the Photophysical Properties
3.4. Emission Spectral Shift for the Co-Solvent
4. Conclusions
Supplementary Materials
Author Contributions
Funding
Acknowledgments
Conflicts of Interest
References
- Merrifield, R.B. Solid Phase Peptide Synthesis. I. The Synthesis of a Tetrapeptide. J. Am. Chem. Soc. 1963, 85, 2149–2154. [Google Scholar] [CrossRef]
- Palomo, J.M. Solid-phase peptide synthesis: An overview focused on the preparation of biologically relevant peptides. RSC Adv. 2014, 4, 32658–32672. [Google Scholar] [CrossRef]
- Virta, P.; Katajisto, J.; Niittymäki, T.; Lönnberg, H. Solid-supported synthesis of oligomeric bioconjugates. Tetrahedron 2003, 59, 5137–5174. [Google Scholar] [CrossRef]
- Lönnberg, H. Synthesis of oligonucleotides on a soluble support. Beilstein J. Org. Chem. 2017, 13, 1368–1387. [Google Scholar] [CrossRef] [PubMed]
- Da’san Jaradat, M.M. Thirteen decades of peptide synthesis: Key developments in solid phase peptide synthesis and amide bond formation utilized in peptide ligation. Amino Acids 2018, 50, 39–68. [Google Scholar] [CrossRef] [PubMed]
- Miyaura, N.; Suzuki, A. Palladium-Catalyzed Cross-Coupling Reactions of Organoboron Compounds. Chem. Rev. 1995, 95, 2457–2483. [Google Scholar] [CrossRef]
- Kotha, S.; Lahiri, K.; Kashinath, D. Recent applications of the Suzuki–Miyaura cross-coupling reaction in organic synthesis. Tetrahedron 2002, 58, 9633–9695. [Google Scholar] [CrossRef]
- Maluenda, I.; Navarro, O. Recent developments in the Suzuki-Miyaura reaction: 2010–2014. Molecules 2015, 20, 7528–7557. [Google Scholar] [CrossRef]
- Frenette, R.; Friesen, R.W. Biaryl Synthesis via Suzuki Coupling on a Solid Support. Tetrahedron Lett. 1994, 35, 9177–9180. [Google Scholar] [CrossRef]
- Fernàndez, J.C.; Solé-Feu, L.; Fernández-Forner, D.; de la Figuera, N.; Forns, P.; Albericio, F. Suzuki coupling reaction for the solid-phase preparation of 5-substituted nicotinic acid derivatives. Tetrahedron Lett. 2005, 46, 581–585. [Google Scholar] [CrossRef]
- Gravel, M.; Bérubé, C.D.; Hall, D.G. Resin-to-resin Suzuki coupling of solid supported arylboronic acids. J. Comb. Chem. 2000, 2, 228–231. [Google Scholar] [CrossRef] [PubMed]
- Solé, N.A.; Barany, G. Optimization of Solid-Phase Synthesis of [Ala8]-dynorphin A. J. Org. Chem. 1992, 57, 5399–5403. [Google Scholar] [CrossRef]
- Wagner, S.; Bell, J.; Biyikal, M.; Gawlitza, K.; Rurack, K. Integrating fluorescent molecularly imprinted polymer (MIP) sensor particles with a modular microfluidic platform for nanomolar small-molecule detection directly in aqueous samples. Biosens. Bioelectron. 2018, 99, 244–250. [Google Scholar] [CrossRef] [PubMed]
- Imhof, A.; Megens, M.; Engelberts, J.J.; de Lang, D.T.N.; Sprik, R.; Vos, W.L. Spectroscopy of fluorescein (FITC) dyed colloidal silica spheres. J. Phys. Chem. B 1999, 103, 1408–1415. [Google Scholar] [CrossRef]
- Son, S.H.; Abe, Y.; Yuasa, M.; Yamagishi, Y.; Sakai, N.; Ayabe, T.; Yamada, K. A Systematic Analysis of Aromatic Heterocyclic Rings in Solvatochromic Fluorophores. Chem. Lett. 2011, 40, 378–380. [Google Scholar] [CrossRef]
- Loving, G.S.; Sainlos, M.; Imperiali, B. Monitoring protein interactions and dynamics with solvatochromic fluorophores. Trends Biotechnol. 2010, 28, 73–83. [Google Scholar] [CrossRef] [PubMed]
- Klymchenko, A.S. Solvatochromic and Fluorogenic Dyes as Environment-Sensitive Probes: Design and Biological Applications. Acc. Chem. Res. 2017, 50, 366–375. [Google Scholar] [CrossRef]
- Guiles, J.W.; Johnson, S.G.; Murray, W.V. Solid-Phase Suzuki Coupling for C-C Bond Formation. J. Org. Chem. 1996, 61, 5169–5171. [Google Scholar] [CrossRef]
- Salives, R.; Dupas, G.; Plé, N.; Quéguiner, G.; Turck, A.; George, P.; Sevrin, M.; Frost, J.; Almario, A.; Li, A. Solid-phase syntheses of 6-arylpyridazin-3(2H)-ones. ACS Comb. Sci. 2005, 7, 414–420. [Google Scholar] [CrossRef]
- Martinez-Amezaga, M.; Delpiccolo, C.M.L.; Mata, E.G. Immobilized boronic acid for Suzuki-Miyaura coupling: Application to the generation of pharmacologically relevant molecules. RSC Adv. 2017, 7, 34994–35003. [Google Scholar] [CrossRef]
- Santini, R.; Griffith, M.C.; Qi, M. A measure of solvent effects on swelling of resins for solid phase organic synthesis. Tetrahedron Lett. 1998, 39, 8951–8954. [Google Scholar] [CrossRef]
- Ohno, H.; Yoneyama, S.; Nakamura, F.; Fukuda, K.; Hara, M.; Shimomura, M. Optical Waveguide Spectrometry of Acridine Orange in Monolayer and Langmuir-Blodgett Film. Langmuir 2002, 18, 1661–1665. [Google Scholar] [CrossRef]
- Akune, Y.; Hirosawa, R.; Endo, N.; Hatano, S.; Hosokai, T.; Sato, H.; Matsumoto, S. Tuning of fluorescence efficiency via local modification of the crystal structure by benzyl groups in polymorphs of a pyrazine dye. CrystEngComm 2017, 19, 1947–1952. [Google Scholar] [CrossRef]
- Lee, J.Y.; Aoyama, T.; Uchiyama, M.; Matsumoto, S. Synthesis and properties of liquid pyrazine dyes. Dyes Pigm. 2020, 174, 108030. [Google Scholar] [CrossRef]
- Chen, P.Z.; Zhang, H.; Niu, L.Y.; Zhang, Y.; Chen, Y.Z.; Fu, H.B.; Yang, Q.Z. A Solid-State Fluorescent Material Based on Carbazole-Containing Difluoroboron β-Diketonate: Multiple Chromisms, the Self-Assembly Behavior, and Optical Waveguides. Adv. Funct. Mater. 2017, 27, 1–10. [Google Scholar] [CrossRef]
- Liu, L.; Zhou, X.; Wilkinson, J.S.; Hua, P.; Song, B.; Shi, H. Integrated optical waveguide-based fluorescent immunosensor for fast and sensitive detection of microcystin-LR in lakes: Optimization and Analysis. Sci. Rep. 2017, 7, 1–9. [Google Scholar] [CrossRef]
- Abudukeremu, H.; Kari, N.; Zhang, Y.; Wang, J.; Nizamidin, P.; Abliz, S.; Yimit, A. Highly sensitive free-base-porphyrin-based thin-film optical waveguide sensor for detection of low concentration NO2 gas at ambient temperature. J. Mater. Sci. 2018, 53, 10822–10834. [Google Scholar] [CrossRef]
- Reichardt, C. Solvatochromic dyes as solvent polarity indicators. Chem. Rev. 1994, 94, 2319–2358. [Google Scholar] [CrossRef]
- Benito-Peña, E.; Valdés, M.G.; Glahn-Martínez, B.; Moreno-Bondi, M.C. Fluorescence based fiber optic and planar waveguide biosensors. A review. Anal. Chim. Acta 2016, 943, 17–40. [Google Scholar] [CrossRef]
- Liu, Z.; He, W.; Guo, Z. Metal coordination in photoluminescent sensing. Chem. Soc. Rev. 2013, 42, 1568–1600. [Google Scholar] [CrossRef]


| Solvent | ET(30) 1/kcal mol−1 | 6 | 7 | |||||||
|---|---|---|---|---|---|---|---|---|---|---|
| λabs 2/nm | λem 3/nm | Stokes shift/103 cm−1 | Φfl4 | λabs 2/nm | λem 3/nm | Stokes shift/103 cm−1 | Φfl4 | ε5/104 M−1 cm−1 | ||
| Toluene | 33.9 | 401 | 525 | 5.88 | 0.22 | 401 | 473 | 3.80 | 0.97 | 4.19 |
| 1,4-Dioxane | 36.0 | 398 | 529 | 6.21 | 0.30 | 400 | 489 | 4.53 | 0.83 | 4.47 |
| THF | 37.4 | 401 | 533 | 6.20 | 0.38 | 403 | 516 | 5.42 | 0.97 | 4.19 |
| EA 6 | 38.1 | 394 | 532 | 6.61 | 0.28 | 399 | 511 | 5.47 | 0.88 | 4.48 |
| DCM 7 | 40.7 | 404 | 548 | 6.52 | 0.37 | 405 | 521 | 5.50 | 1.00 | 4.14 |
| DMF 8 | 43.2 | 403 | 565 | 7.12 | 0.36 | 408 | 551 | 6.36 | 0.91 | 4.20 |
© 2020 by the authors. Licensee MDPI, Basel, Switzerland. This article is an open access article distributed under the terms and conditions of the Creative Commons Attribution (CC BY) license (http://creativecommons.org/licenses/by/4.0/).
Share and Cite
Otsuka, Y.; Li, G.; Takahashi, H.; Satoh, H.; Yamada, K. Synthesis of a Fluorescent Solvatochromic Resin Using Suzuki–Miyaura Cross-Coupling and Its Optical Waveguide Spectra to Measure the Solvent Polarity on the Surface. Materials 2020, 13, 4483. https://doi.org/10.3390/ma13204483
Otsuka Y, Li G, Takahashi H, Satoh H, Yamada K. Synthesis of a Fluorescent Solvatochromic Resin Using Suzuki–Miyaura Cross-Coupling and Its Optical Waveguide Spectra to Measure the Solvent Polarity on the Surface. Materials. 2020; 13(20):4483. https://doi.org/10.3390/ma13204483
Chicago/Turabian StyleOtsuka, Yu, Guanglei Li, Hiromi Takahashi, Hisashi Satoh, and Koji Yamada. 2020. "Synthesis of a Fluorescent Solvatochromic Resin Using Suzuki–Miyaura Cross-Coupling and Its Optical Waveguide Spectra to Measure the Solvent Polarity on the Surface" Materials 13, no. 20: 4483. https://doi.org/10.3390/ma13204483
APA StyleOtsuka, Y., Li, G., Takahashi, H., Satoh, H., & Yamada, K. (2020). Synthesis of a Fluorescent Solvatochromic Resin Using Suzuki–Miyaura Cross-Coupling and Its Optical Waveguide Spectra to Measure the Solvent Polarity on the Surface. Materials, 13(20), 4483. https://doi.org/10.3390/ma13204483