Abstract
In order to boost the electromechanical coupling factor and decrease the characteristic impedance, a 1-3 piezoelectric composite with a 3-tier polymer structure was designed and fabricated, in which epoxy resin constitutes the middle layer and silicone rubber is used to clamp the epoxy. The effective parameters of the composite, such as resonant frequency, electromechanical coupling factor, and characteristic impedance, were studied by the finite element method and experiment. The experimental results indicate that the electromechanical coupling factor of the composite is enhanced by 8.4% and the characteristic impedance is decreased by 52.8%, compared with the traditional 1-3 ceramic/epoxy composite.
1. Introduction
In 1880, Pierre and Jacques Curie (the Curie brothers) discovered the piezoelectric effect (or the direct piezoelectric effect) in single crystal quartz. The piezoelectric effect is the phenomenon that certain materials produce electric charges on their surfaces as a result of applying external force, and the induced charges are proportional to the external force. Materials showing the piezoelectric effect also conversely have a geometric strain proportional to an applied electric field, which is called the converse piezoelectric effect, discovered by Gabriel Lippmann in 1881 [1]. Since the Curie brothers uncovered the piezoelectric effect, the development of piezoelectric materials can be summarized into four stages, namely single-crystal quartz, single-crystal Rochelle salt, barium titanate (BT) ceramics and lead zirconate titanate (PZT) ceramics [2].
In 1916, Dr Paul Langevin succeeded in inventing the piezoelectric transducer with single-crystal quartz [2]. His transducer received the echo from the sea floor and detected an armor plate 200 m away. It was the first time that human beings had used an echo to detect underwater targets, which was of great significance in the history of modern sonar development [3]. However, due to the low electromechanical coupling factor of single crystal quartz, Langevin’s transducer had serious defects, low mechanical underwater transmitting power, low receiving capability, and narrow bandwidth [1]. In order to overcome these drawbacks, researchers began using single-crystal Rochelle salt to make transducers. In 1919, the first Rochelle salt electroacoustic device was introduced, but single- crystal Rochelle salt tends to be degraded by humidity since it is water-soluble. After World War I, many researchers aimed to discover alternative piezoelectrics to Rochelle salt with better stability and reliability. In the following 20 years, pyroelectric and ferroelectric crystals were studied. In 1943, the discovery of barium titanate (BT) ceramics marked the development of piezoelectric ceramics from single crystals to the new fields of polycrystals [4]. Although barium titanate (BT) ceramic has a reasonably high electromechanical coupling factor and non-water solubility, it still has bottlenecks. First, under room temperature or operating temperature the barium titanate (BT) ceramics has a large temperature factor of the electromechanical parameters because of the second phase transition (from tetragonal to rhombohedral). In addition, it has an aging effect due to the low Curie temperature (phase transition from cubic to tetragonal) around only 120 °C [1]. In order to decrease the second transition temperature and to increase the Curie temperature of the barium titanate (BT) ceramics, various ion replacements, such as Pb and Ca, were studied. In 1954, Bernard Jaffe discovered the superior piezoelectricity of the lead zirconate titanate (PZT) ceramics, which triggered a new era of piezoelectric material [5]. In the 1970s, researchers began to study the relaxor ferroelectric single crystal materials. In 1997, research made a breakthrough and a new type of relaxor ferroelectric single crystal was successfully prepared, lead magnesium niobate–lead titanate (PMNT) and lead bismuth zincate–lead titanate (PZNT), which had a piezoelectric factor 3–6 times that of conventional lead zirconate titanate (PZT) ceramics [2]. At present, PZT series piezoelectric ceramics are widely used. The main characteristics are excellent mechanical and electrical properties, easy forming, controllable polarization direction, etc., and the disadvantages are high density, high characteristic impedance, and poor matching effect with water sound [2].
In 1978, Newnham et al. put forward the idea of the PZT-polymer composite, and it has achieved remarkable achievements since then. The piezoelectric composite is composed of a piezoelectric phase and a polymer phase, with a certain connection mode, a certain volume or mass ratio, and a certain spatial geometric distribution. In the piezoelectric composite, a piezoelectric ceramic with high piezoelectric properties is generally selected as the piezoelectric phase, which is usually lead zirconate titanate (PZT), lead titanate (PT) or doped lead titanate, and the polymer phase is generally epoxy resin. The components of the piezoelectric composite are self-connected in dimensions 0, 1, 2, 3. If the composite is composed of two phases, there are 10 combinations, namely 0-0, 0-1, 0-2, 0-3, 1-1,1-2,1-3, 2-2, 2-3, 3-3 [6]. The first number represents the connected dimension of the piezoelectric phase and the second represents the connected dimension of the polymer phase, which is internationally recognized [7].
There are many manufacturing techniques to produce piezoelectric composite, including the rod placement technique, the dice-fill technique, ultrasonic cutting, injection molding, lost mold, laser machining, co-extrusion, tape lamination, and fiber insertion methods [8]. Due to the simple process and design flexibility, currently the most widely accepted method for the fabrication of piezocomposite is the dice-fill technique, which was first reported by Savakus et al. [9]. The dice-fill method involves making a series of parallel cuts on a piece of bulk piezoelectric material with a mechanical dicing saw. Then, the material is diced in the perpendicular direction to produce posts with a rectangular cross section. The diced material is backfilled with a polymer, and the base ceramic support is removed [8].
1-3 piezoelectric composite can be widely used in underwater transducers [10,11,12,13], medical imaging applications [14,15], and nondestructive testing (NDT) or nondestructive evaluation (NDE) [16,17,18], mainly because it has the following characteristics [19]: (1) 1-3 piezoelectric composite has a relatively low acoustic impedance, which means it is easy to find sound absorbing material as a backing. (2) The mechanical quality factor Q of 1-3 piezoelectric composite is relatively low, which is suitable for making a broadband narrow pulse transducer. (3) The dielectric constant of 1-3 piezoelectric composite is relatively low, which gives it a relatively small static capacitance. The transducer made of 1-3 piezocomposite has high input impedance, so it has a high receiving voltage sensitivity. (4) 1-3 piezoelectric composite has a high hydrostatic piezoelectric constant, which is suitable for preparing hydrophones. (5) Due to the excellent flexibility of the polymer, 1-3 piezoelectric composite can be made into the special shapes to meet the special requirements. (6) The distribution of piezoelectric phase is controllable, so that the radiation sound field also can be controlled.
Due to the limitation of Young’s modulus of epoxy resin, the electromechanical coupling factor of conventional 1-3 ceramic/epoxy composite can only reach 0.6 approximately [20]. Many experts are working to improve the electromechanical coupling factor of piezoelectric composite. Qin et al. fabricated a 1-1-3 piezoelectric composite based on relaxor ferroelectric single crystal, which showed an electromechanical coupling factor of 0.89 [21]. However, as the price of ferroelectric single crystals are so expensive its application is limited. Therefore, several researchers prepared a 1-3 piezoelectric composite with other flexible polymers and increased its electromechanical coupling factor to about 0.68 [22]. Lee et al. find that the lower the Young’s modulus of the polymer, the higher the electromechanical coupling factor of the composite [23], whereas, too low a Young’s modulus makes the composite susceptible to deform. Besides, the characteristic impedance of the composite affects the efficiency of acoustic wave transmission. At the nonconventional approach there are also reactance-piezoelectrical effects which can change the characteristic impedance and basic properties near the serial resonance of the piezoelectric materials such as reported [24,25,26,27]. Since the characteristic impedance of the usual acoustic propagation medium, such as water, human tissue, air, etc., is relatively small (1.5 MRayls), the closer the characteristic impedance of the composite material is to them, the more efficiently the acoustic energy can be radiated [1].
In order to improve the electromechanical coupling factor of the composite as well as to give it less tendency to deform, and decrease the characteristic impedance, a composite with a 3-tier polymer structure was designed and prepared. The epoxy resin is located in the center layer of the polymer phase, providing support for the composite to resist deformation, while silicone rubber is put on the upper and lower layers, which reduces the loading effects on the piezoelectric phase [21]. In addition, the influence of the silicone rubber and piezoelectric ceramic on the characteristic impedance of the composite was also analyzed. A larger electromechanical coupling coefficient means a higher electromechanical conversion efficiency, and a lower characteristic impedance can reduce the energy loss of sound waves during radiation and reception. It is expected that from our work, a piezoelectric composite with a larger electromechanical coupling factor and a lower characteristic impedance can be found with a certain volume fraction of silicone rubber and piezoelectric ceramic.
2. Structure of the 1-3 Piezoelectric Composite with 3-Tier Polymer Structure
As shown in Figure 1, the 1-3 composite with the 3-tier polymer structure is composed of 1-D (one-dimensional) connected piezoceramic pillars, 3-D (three-dimensional) connected polymers (epoxy resin and silicone rubber), and electrodes. The piezoceramic pillars are arranged periodically and the polymer phases have a 3-tier structure, in which the middle layer is epoxy resin while the upper and lower layers are filled with silicone rubber. In Figure 1, l and t represents the width and thickness of the composite, respectively. Moreover, a and b, refer to the width of the piezoceramic pillar and polymer. For silicone rubber, the thickness of each layer of is equal, expressed in ts. So the thickness of epoxy resin is t-2ts. The volume fraction of piezoelectric ceramic in composite vc can be expressed as a2/(a + b)2, and the volume fraction of the silicone rubber in the polymer phase vs is defined as 2ts/t.
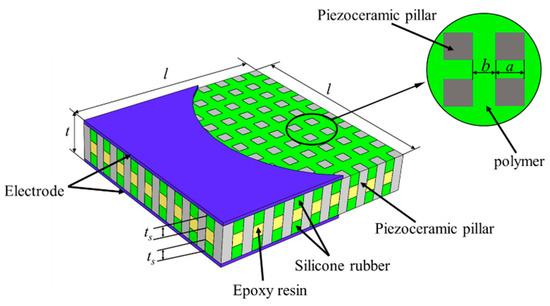
Figure 1.
Structure of the 1-3 piezoelectric composite with 3-tier polymer structure.
3. Finite Element Analysis of the Novel Composite
In order to predict the effective properties of the 1-3 piezoelectric composite with a 3-tier polymer structure, the finite element simulation method was chosen to study the resonant frequency and anti-resonant frequency, the electromechanical coupling factor, and the characteristic impedance etc. of the composite. Figure 2 depicts the finite element model of the novel composite. For the purpose of simplifying the calculation, only a 1/4 unit of the composite was established by the finite element simulation software ANSYS (15.0, ANSYS, Inc., Pittsburgh, PA, USA), and the electrode was neglected in this model for its thickness is extremely narrow. PZT-5H ceramic was selected as the piezoelectric phase while 618 epoxy resin and 704 silicone rubber were chosen as the polymer phase. Material parameters are shown in Table 1 and Table 2, respectively. The thickness of the composite t is 5 mm, while the width of the piezoelectric pillar a is 1.2 mm and the width of polymer phase b is 0.7 mm. The voltage at the top surface of the composite is 1 V and at the bottom surface is 0 V.
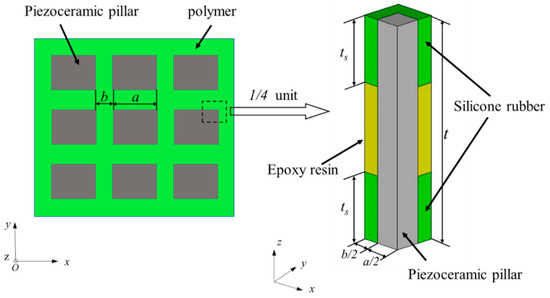
Figure 2.
Finite element model of a 1/4 unit of the novel composite.

Table 1.
Parameters of PZT-5H.
Table 2.
Parameters of polymer.
In order to study the effect of the volume fraction of silicone rubber vs on the properties of the composite, harmonic response analysis was used to obtain the admittance curve of the composite, while the volume fraction of the piezoelectric ceramics vc was set to 0.4. As shown in Figure 3, the resonant frequency fs is the frequency at the maximum modulus point of the admittance curve and the anti-resonant frequency fp appears at the minimum point.
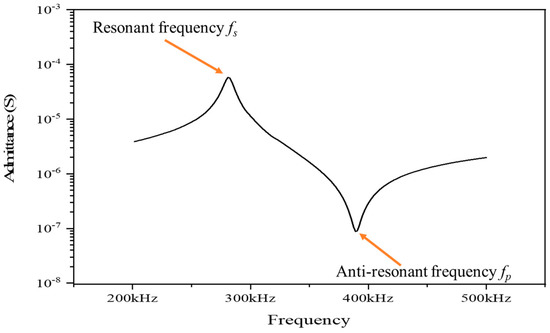
Figure 3.
Admittance curve of the novel composite (vs = 0.6, vc = 0.4).
The electromechanical coupling factor keff and sound velocity c can be calculated using (1) and (2), respectively. In addition, the equivalent density ρ and characteristic impedance z of the composite is given by (3) and (4).
where, ρc is the density of the piezoelectric phase material, ρe is the density of epoxy resin, and ρs is the density of silicone rubber.
keff = ((fp2 − fs2)/fp2)1/2
c = 2fpt
ρ = vcρc + (1 − vc)(vsρs + (1 − vs)ρe)
z = ρc
The performances of the composites with different vs are shown in Table 3. Accordingly, the fs and fp ~ vs, keff ~ vs, c ~ vs and z ~ vs curves are displayed in Figure 4a–d.
Table 3.
Simulation data with different vs (vc = 0.4).
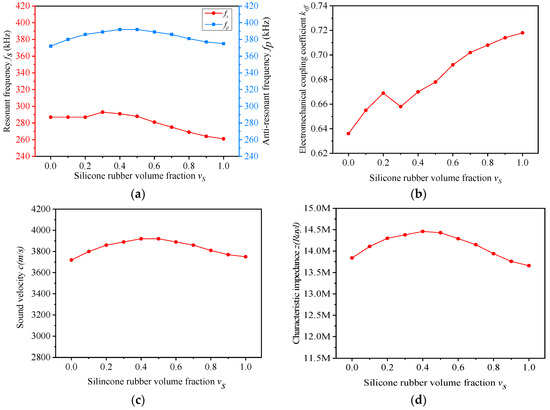
Figure 4.
(a–d) Simulation performances of the composites with different vs (vc = 0.4).
As shown in Figure 4a, the resonant frequency fs and the anti-resonant frequency fp change slightly with the increase of vs. The resonant frequency fs is mainly determined by the thickness of the composite, which does not change in the simulation, so this is the reason for that phenomenon [28]. Furthermore, the changing trend of fs and fp is almost the same. When the equivalent performance parameters of the composite material are fixed, the ratio between fs and fp is a constant [28]. The equivalent performance parameters of the composite material do not change much in the simulation. Hence, the resonant frequency fs and the anti-resonant frequency fp share a similar variation tendency.
In Figure 4b, the electromechanical coupling factor keff of the composite increases with the variation of vs, generally. Yet, when vs increases from 0.2 to 0.3, the electromechanical coupling factor keff decreases correspondingly. In this section, the increase rate of anti-resonant frequency is lower compared to that of resonant frequency, which is the reason for the decrease in keff.
The curve of the sound velocity c with the increasement of vs is shown in Figure 4c. As can be seen from equation (2), the sound velocity c is determined by the anti-resonant frequency and the thickness of the composite. In the simulation, the changing curve of the sound velocity c is basically consistent with the anti-resonant frequency.
Figure 4d illustrates the variation of the characteristic impedance z with the increase of vs. The characteristic impedance z is the product of equivalent density ρ and sound velocity c. The changing trend of sound velocity c is in accordance with the anti-resonant frequency fp and the equivalent density ρ of the composite varies slightly with the increase of vs. Therefore, the curves of the characteristic impedance z and anti-resonant frequency fp are alike.
According to the simulation data, the change of vs has a great influence on the electromechanical coupling factor keff of the composite. When vs is 0.6, the electromechanical coupling factor keff is 0.692, and the composite is not easily deformed under this condition. Therefore, the influence of the volume fraction of piezoelectric ceramic vc on the properties of the composite was studied, when the volume fraction of silicone rubber vs was 0.6.
The performances of the composites with different vc are shown in Table 4. Accordingly, the fs and fp ~ vc, keff ~ vc, c ~ vc and z ~ vc curves are displayed in Figure 5a–d.
Table 4.
Simulation data with different vc (vs = 0.6).
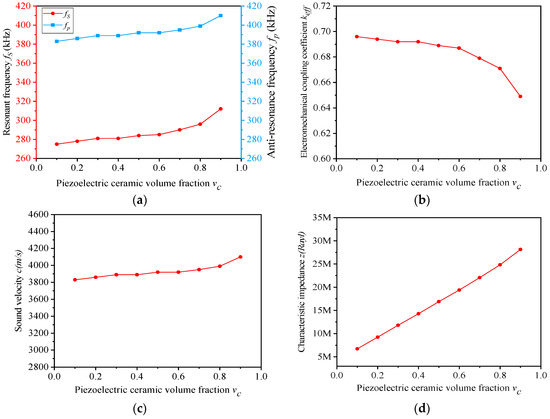
Figure 5.
(a–d) Simulation performances of the novel composites with different vc (vs = 0.4).
Figure 5b depicts that the electromechanical coupling factor keff showed a downward trend in general, which becomes faster and faster as vc varies. When vc increases, the resonant frequency fs and the anti-resonant frequency fp will increase simultaneously, and the growth rate of fs will be slightly larger than that of fp. Thus, the electromechanical coupling factor keff will decrease as a whole. When vc alters from 0.8 to 0.9, the rising pace of fs is much larger than that of fp, so that keff has the largest rate of decline in this section.
Figure 5d depicts the variation of characteristic impedance z with the growth of vc. When vc rises, the equivalent density ρ increases linearly, as can be seen from Table 4, and the fluctuation of sound velocity c is not significant. Therefore, the equivalent density ρ determines the changing trend of characteristic impedance z, which also shows a linear rise state.
4. Fabrication and Test
The samples of 1-3 piezoelectric composite with 3-tier polymer structure were fabricated using the dice-and-fill method. The preparation process is shown in Figure 6. The detailed steps are as follows: First, the piezoelectric ceramic block is cut into columns arranged in arrays and a base kept. Then, the epoxy resin is filled into the cracks of the piezoelectric ceramics. Second, part of the epoxy resin is cut off along the gap between the pillars and the gap is filled with silicone rubber. Furthermore, the sample is inverted, the retained base cut into ceramic column arrays and silicone rubber filled in the gap. In the end, silver electrodes are deposited on the top and bottom by magnetron sputtering.
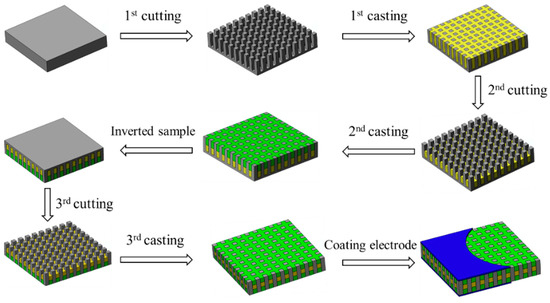
Figure 6.
Preparation process of the novel composite.
As shown in Figure 7, the composite samples are fabricated according to the preparation process. The length and width of all samples are 31 mm and the thickness is 5 mm. In Figure 7a, the volume fraction of piezoelectric ceramic vc is 0.4, and the volume fraction of silicone rubber vs increases from 0 to 1 with an increment of 0.2. In Figure 7b, the volume fraction of silicone rubber vs is 0.6 and the volume fraction of piezoelectric ceramic vc increases from 0.1 to 0.7 by 0.2. Two pieces of each type of sample are made and one of them is selected for display. The samples are measured by Impedance Analyzer (4294A, Agilent Technologies, Inc., Santa Clara, CA, USA), and the experimental data of the samples are summarized in Table 5 and Table 6.
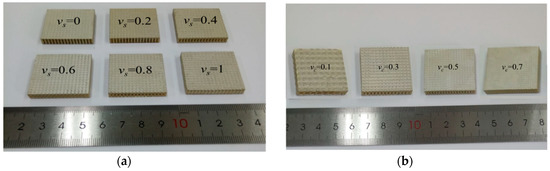
Figure 7.
(a,b) Samples of the novel composite.
Table 5.
Experiment data with different vs (vc = 0.4).
Table 6.
Experiment data with different vc (vs = 0.6).
As can be seen from Table 5 and Table 6, the electromechanical coupling factor keff of the majority of 1-3 piezoelectric composites with 3-tier polymer structure (except the composite of vs = 0 and vs = 1) is greater than 0.64, which indicates that the 3-tier polymer structure is beneficial in improving the electromechanical coupling factor of piezoelectric composites. In the meantime, the composite with lower characteristic impedance can be acquired, when vc is less than 0.3.
When vs varies, the comparison between experiment and simulation are shown in Figure 8, in which the experimental data agree well with the simulation results. There are some errors between the experimental results and the simulation data, because of the difference of material parameters between experiment and simulation.
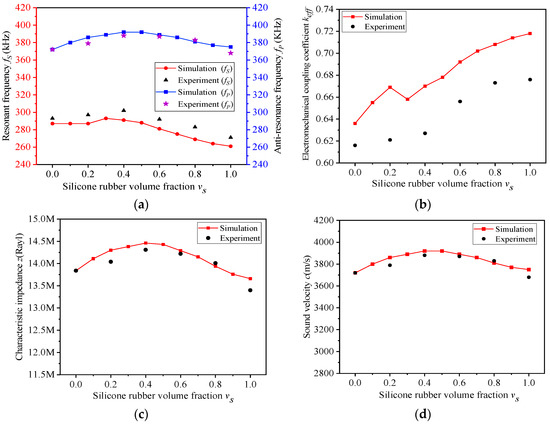
Figure 8.
(a–d) Experiment performance of composite with different vs (vc = 0.4).
As shown in Figure 8b, when the volume fraction of silicone rubber vs increases, the electromechanical coupling factor of the new composite will also increase accordingly. When vs is 0.6, the electromechanical coupling factor of the advanced composite is 0.656, enhanced by 6.4%, compared with traditional 1-3 ceramic/epoxy composite (0.616). When vs > 0.6, the electromechanical coupling factor keff of the composite will more than 0.67, enhancing by 8.7%. These data are calculated from Equation (5).
ξ(%) = 100 × |X1 − X2|/X1
In Equation (5), X1 represents the parameters of traditional 1-3 piezoelectric composite, and X2 represents. The parameters of the 1-3 piezoelectric composite with 3-tier polymer structure.
When vc varies, the comparisons between experiment and simulation are shown in Figure 9, in which the experiment data also fit well with the simulation results. In Figure 9b, although the electromechanical coupling factor keff decreases with the increase of the volume fraction of piezoelectric ceramics vc, the keff of the composites remain at a high level, greater than 0.64, because the volume fraction of silicone rubber vs in the composite remains unchanged. In Figure 9d, when vc increases, both the test values of the characteristic impedance z and the simulation data show a linear upward trend. Moreover, the experiment–simulation error does not exceed 1%. When the volume fraction of ceramic vc is less than 0.5, the characteristic impedance z of the composite can be kept at a comparatively low level. When vc = 0.1 and vs = 0.6, the characteristic impedance of the advanced composite is 6.53 MRayl declining by 52.8%, and the electromechanical coupling factor is 0.668 enhanced by 8.4%, compared with the traditional 1-3 ceramic/epoxy composite (13.84 MRayl, 0.616), which are also calculated by Equation (5).
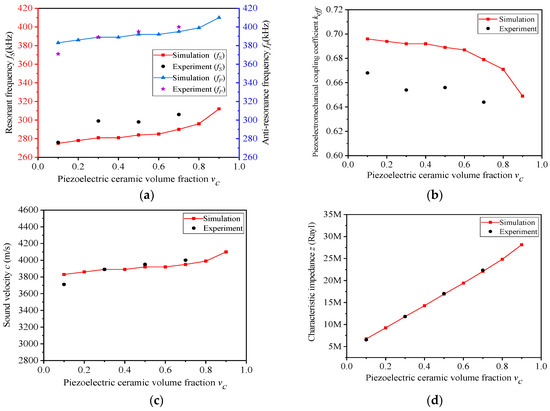
Figure 9.
(a–d) Experimental performance of composite with different vc (vs = 0.6).
5. Discussion
This paper introduces a 1-3 piezoelectric composite with a 3-tier polymer structure. Both the simulation and the experimental results show that the 3-tier polymer structure is advantageous for the composite to obtain a higher electromechanical coupling coefficient while keeping a comparatively low level of characteristic impedance. A larger electromechanical coupling coefficient means a higher electromechanical conversion efficiency and a lower characteristic impedance can reduce the energy loss of sound waves during radiation and reception.
6. Conclusions
In this paper, the finite element method is used to analyze the properties of the 1-3 piezoelectric composite with a 3-tier polymer structure. The simulation and experiment results show that the 1-3 piezoelectric composite with a 3-tier polymer structure is advantageous in obtaining a larger electromechanical coupling factor and a lower characteristic impedance. In order to verify the results of the finite element simulation, certain composite samples were prepared. Then, the samples were tested and the results agreed well with the simulation results. The experiment results indicate that when vc is 0.1 and vs is 0.6, the electromechanical coupling factor of the composite is enhanced by 8.4% and the characteristic impedance is decreased by 52.8%, compared with traditional 1-3 ceramic/epoxy composite.
Author Contributions
Conceptualization, R.S., L.W., C.Z. and Y.Z.; methodology, R.S., L.W., C.Z. and Y.Z.; software, R.S. and Y.Z.; validation, R.S. and Y.Z.; formal analysis, R.S. and Y.Z.; investigation, R.S. and Y.Z.; resources, R.S. and Y.Z.; data curation, R.S.; writing—original draft preparation, R.S.; writing—review and editing, R.S., L.W., C.Z. and Y.Z.; visualization, R.S.; supervision, L.W.; project administration, L.W.; funding acquisition, L.W. and C.Z. All authors read and agree to the published version of the manuscript.
Funding
This work was supported by the National Natural Science Foundation of China (No. 61871043), and the Science & Technology Key Project of Beijing Municipal Institutions (No.KZ201911232023), the Sensor Key Laboratory Open Fund of Beijing (No. 2019CGKF004).
Conflicts of Interest
The authors declare no conflict of interest.
References
- Uchino, K.; Ando, A.; Kimura, M. Advanced Piezoelectric Material: Science and Technology, 2nd ed.; Uchino, K., Ed.; Woodhead Publishing: Duxford, UK, 2017; pp. 2–7, 319–320. [Google Scholar]
- Teng, D.; Yang, H.; Li, D.J. The Foundation of Underwater Acoustic Transducer; Northwestern Polytechnic University Press: Xian, China, 2016; pp. 2–4. [Google Scholar]
- D’Amico, A.; Pittenger, R. A Brief History of Active Sonar. Aquat. Mamm. 2009, 35, 426–434. [Google Scholar] [CrossRef]
- Fujishima, S. The History of Ceramic Filters. IEEE Trans. Ultrason. Ferroelectr. Freq. Control 2000, 47, 1–7. [Google Scholar] [CrossRef] [PubMed]
- Jaffe, B.; Cook, W.R., Jr.; Jaffe, H. Piezoelectric Ceramics; Academic Press: London, UK, 1971; pp. 1–5. [Google Scholar]
- Newnham, R.E.; Skinner, D.P.; Cross, L.E. Connectivity and Piezoelectric-pyroelectric Composites. Mater. Res. Bull. 1978, 13, 525–536. [Google Scholar] [CrossRef]
- Cross, L.E. Ferroelectric Materials for Electromechanical Transducer Applications. Mater. Chem. Phys. 1996, 43, 108–115. [Google Scholar] [CrossRef]
- Lee, H.; Zhang, S.; Bar-Cohen, Y.; Sherrit, S. High Temperature, High Power Piezoelectric Composite Transducers. Sensors 2014, 14, 14526–14552. [Google Scholar] [CrossRef] [PubMed]
- Savakus, H.P.; Klicker, K.A.; Newnham, R.E. PZT-epoxy piezoelectric transducers: A Simplified Fabrication Procedure. Mater. Res. Bull. 1981, 16, 677–680. [Google Scholar] [CrossRef]
- Zhang, Y.; Wang, L.; Qin, L.; Liao, Q.; Zhong, C. A Doubly-Curved Piezoelectric Composite with 1-3 Connectivity for Underwater Transducer Applications. In IOP Conference Series: Materials Science and Engineering; IOP Publishing: Bristol, UK, 2018; Volume 317. [Google Scholar]
- Zhang, H.; Chen, H.J. The Research on 1-3 Type Piezoelectric Composite Material Application in Vector Hydrophone. In IEEE/OES China Ocean Acoustics (COA); IEEE: San Juan, PR, USA, 2016. [Google Scholar]
- Zhou, D.; Lam, K.H.; Chen, Y.; Zhang, Q.; Chiu, Y.C.; Luo, H.; Dai, J.; Chan, H.L.W. Lead-free Piezoelectric Single Crystal Based 1-3 Composites for Ultrasonic Transducer Applications. Sens. Actuators A Phys. 2012, 182, 95–100. [Google Scholar] [CrossRef]
- Benjamin, K.C. Recent Advances in 1-3 Piezoelectric Polymer Composite Transducer Technology for AUV/UUV Acoustic Imaging Applications. J. Electroceram 2002, 8, 145–154. [Google Scholar] [CrossRef]
- Felix, N.; Tran-Huu-Hue, L.P.; Walker, L.; Millar, C.; Lethiecq, M. The Application of High Permittivity Piezoelectric Ceramics to 2D Array Transducers for Medical Imaging. Ultrasonics 2000, 38, 127–130. [Google Scholar] [CrossRef]
- Sun, P.; Wang, G.; Wu, D.; Zhu, B.; Hu, C.; Liu, C.; Shung, K.K. High Frequency PMN-PT 1-3 Composite Transducer for Ultrasonic Imaging Application. Ferroelectrics 2010, 408, 120–128. [Google Scholar] [CrossRef] [PubMed]
- Zhang, Y.; Zhao, X.; Wang, W.; Ren, B.; Liu, D.A.; Luo, H. Fabrication of PIMNT/Epoxy 1-3 Composites and Ultrasonic Transducer for Nondestructive Evaluation. IEEE Trans. Ultrason. Ferroelectr. Freq. Control 2011, 58, 1774–1781. [Google Scholar] [CrossRef] [PubMed]
- Jiang, X.; Snook, K.; Hackenberger, W.S.; Geng, X. Single Crystal Piezoelectric Composites for Advanced NDT Ultrasound. In Nondestructive Characterization for Composite Materials, Aerospace Engineering, Civil Infrastructure, and Homeland Security; International Society for Optics and Photonics: Pittsburgh, PA, USA, 2007; Volume 6531. [Google Scholar]
- Kobayashi, M.; Jen, C.K.; Bussiere, J.F.; Wu, K.T. High-temperature Integrated and Flexible Ultrasonic Transducers for Nondestructive Testing. NDT E Int. 2009, 42, 157–161. [Google Scholar] [CrossRef]
- Li, D.H.; Ju, J.W.; Jia, M.J. Novel Piezoelectric Composite Transducer and Application; The Science Publishing Company: Beijing, China, 2007; pp. 6–7. [Google Scholar]
- Zhong, C.; Wang, L.; Qin, L.; Zhang, Y. Characterization of an Improved 1-3 Piezoelectric Composite by Simulation and Experiment. J. Appl. Biomater. 2017, 15, S38–S44. [Google Scholar] [CrossRef] [PubMed]
- Qin, L.; Wang, L.K.; Long, D.; Zhong, C.; Zhang, B.; Liu, J.J. The Study of 1-1-3 Piezoelectric Composite Based on Relaxor Ferroelectric Single Crystal; IEEE (ISAF/IWATMD/PFM): San Juan, PR, USA, 2014. [Google Scholar]
- Lee, H.J.; Zhang, S. Design of Low-loss 1-3 Piezoelectric Composites for High-power Transducer Applications. IEEE Trans. Ultrason. Ferroelectr. Freq. Control 2012, 59, 1969–1975. [Google Scholar] [PubMed]
- Jae Lee, H.; Zhang, S.; Meyer, R.J., Jr.; Sherlock, N.P.; Shrout, T.R. Characterization of Piezoelectric Ceramics and 1-3 Composites for High Power Transducers. Appl. Phys. Lett. 2012, 101, 32902. [Google Scholar] [CrossRef] [PubMed]
- Ivanov, V. Direct electro-optic effect in langasites and α-quartz. Opt. Mater. 2018, 79, 1–7. [Google Scholar] [CrossRef]
- Matko, V.; Šafarič, R. Major improvements of quartz crystal pulling sensitivity and linearity using series reactance. Sensors 2009, 9, 8263–8270. [Google Scholar] [CrossRef] [PubMed]
- Huang, X.; Yang, M.; Liu, T.; Su, H.; Cui, X. An approach on a new variable amplitude waveform sensor. Optik 2017, 132, 52–66. [Google Scholar] [CrossRef]
- Matko, V.; Milanovic, M. Temperature-compensated capacitance-frequency converter with high resolution. Sens. Actuators A Phys. 2014, 220, 262–269. [Google Scholar] [CrossRef]
- Chao, Z. Research on Three-Phase Piezocomposite and Curved Surface Transducer. Ph.D. Thesis, Beijing University of Posts and Telecommunications, Beijing, China, 2019. [Google Scholar]
© 2020 by the authors. Licensee MDPI, Basel, Switzerland. This article is an open access article distributed under the terms and conditions of the Creative Commons Attribution (CC BY) license (http://creativecommons.org/licenses/by/4.0/).