Effect of Al2O3 with Different Nanostructures on the Insulating Properties of Epoxy-Based Composites

Abstract
1. Introduction
2. Materials and Methods
2.1. Materials
2.2. Preparation of h-BN/EP Composites
2.3. Performance Tests
2.3.1. SEM Imaging
2.3.2. Thermal Conductivity
2.3.3. Volume Resistivity
2.3.4. Dielectric Performance
2.3.5. Breakdown Strength
3. Results and Discussion
3.1. SEM Imaging
3.2. Thermal Conductivity
3.3. Volume Resistivity
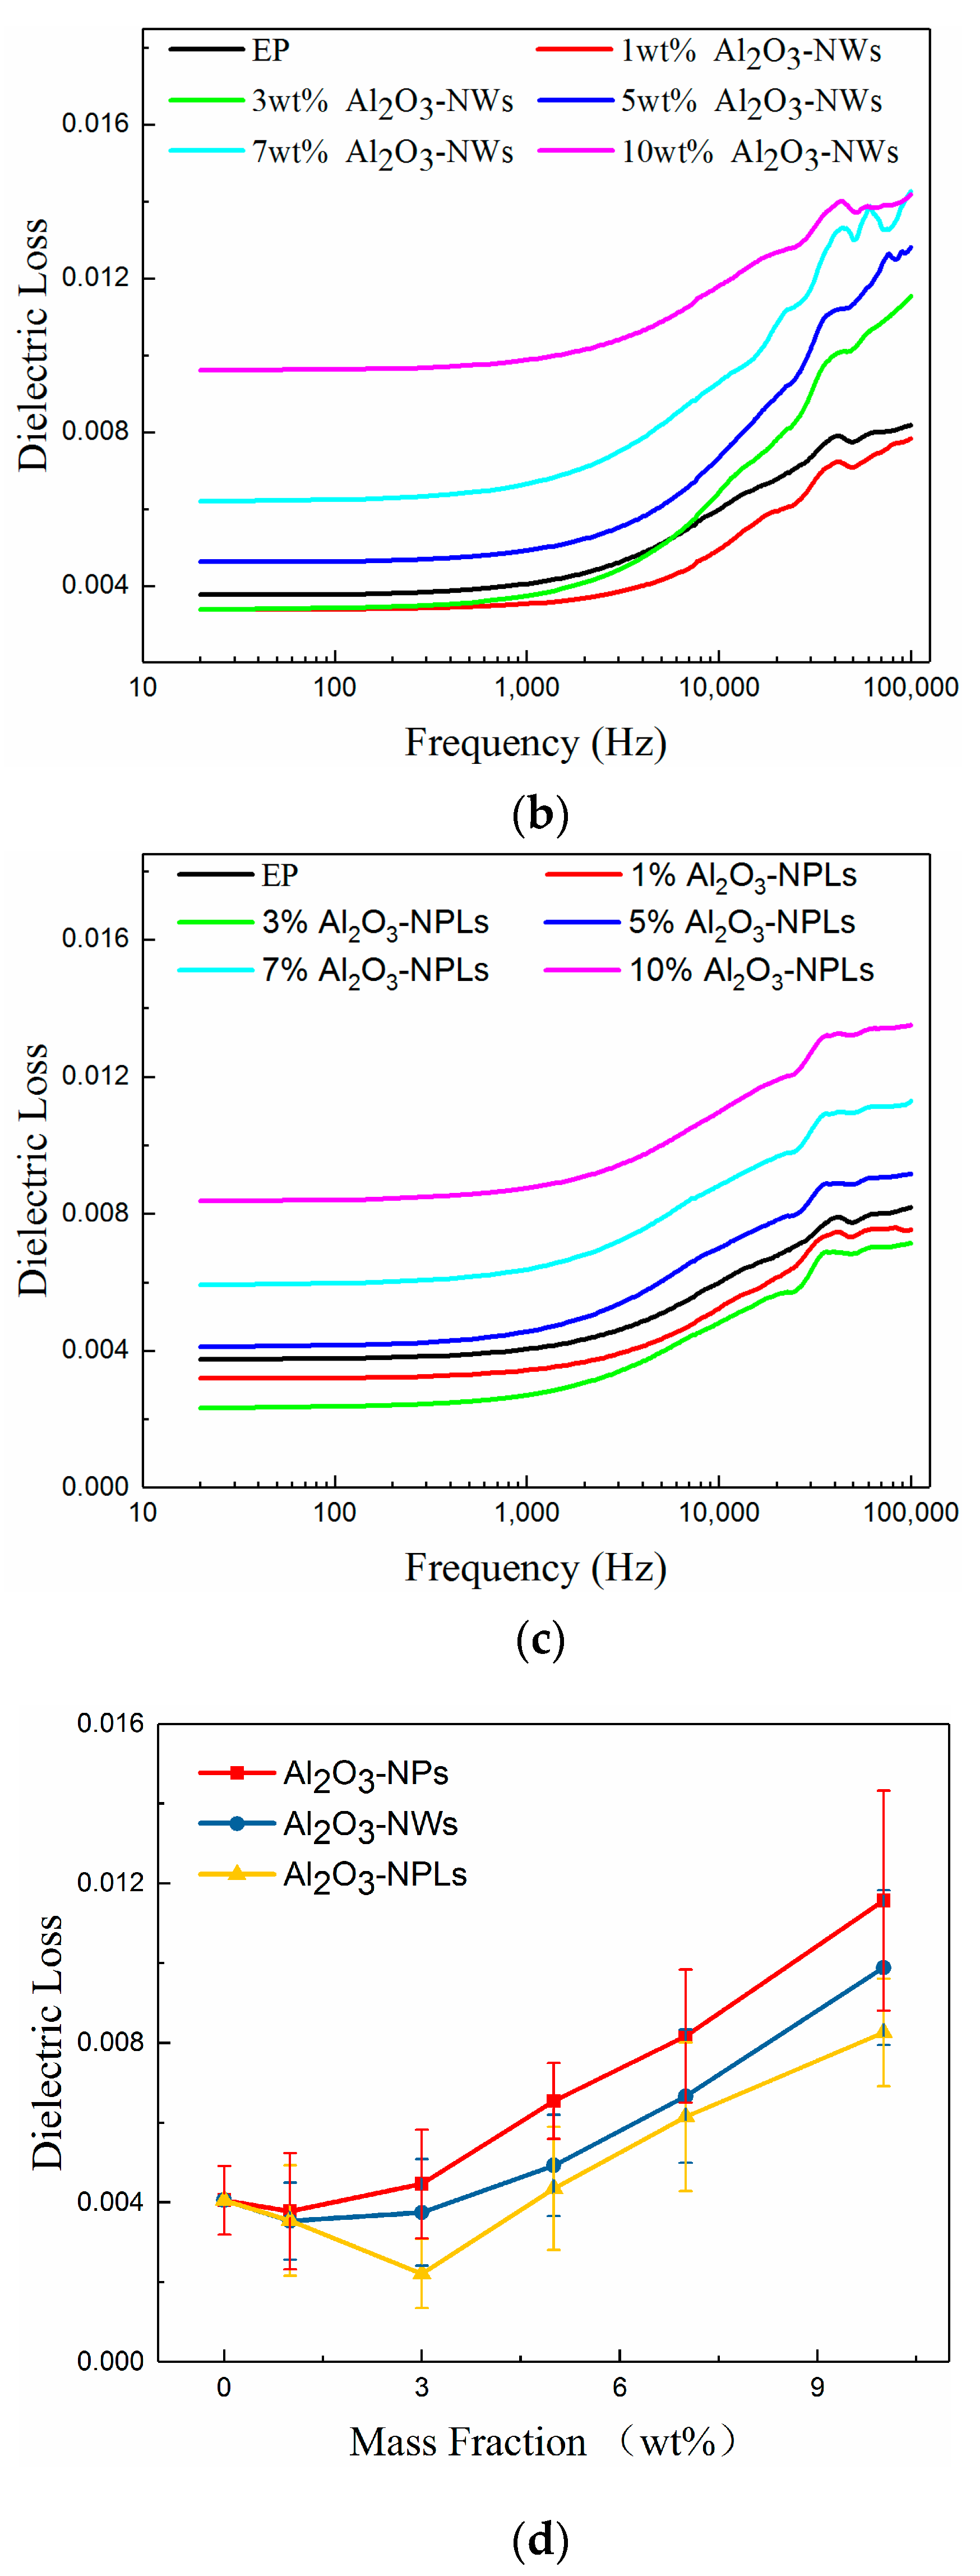
3.4. Dielectric Performance
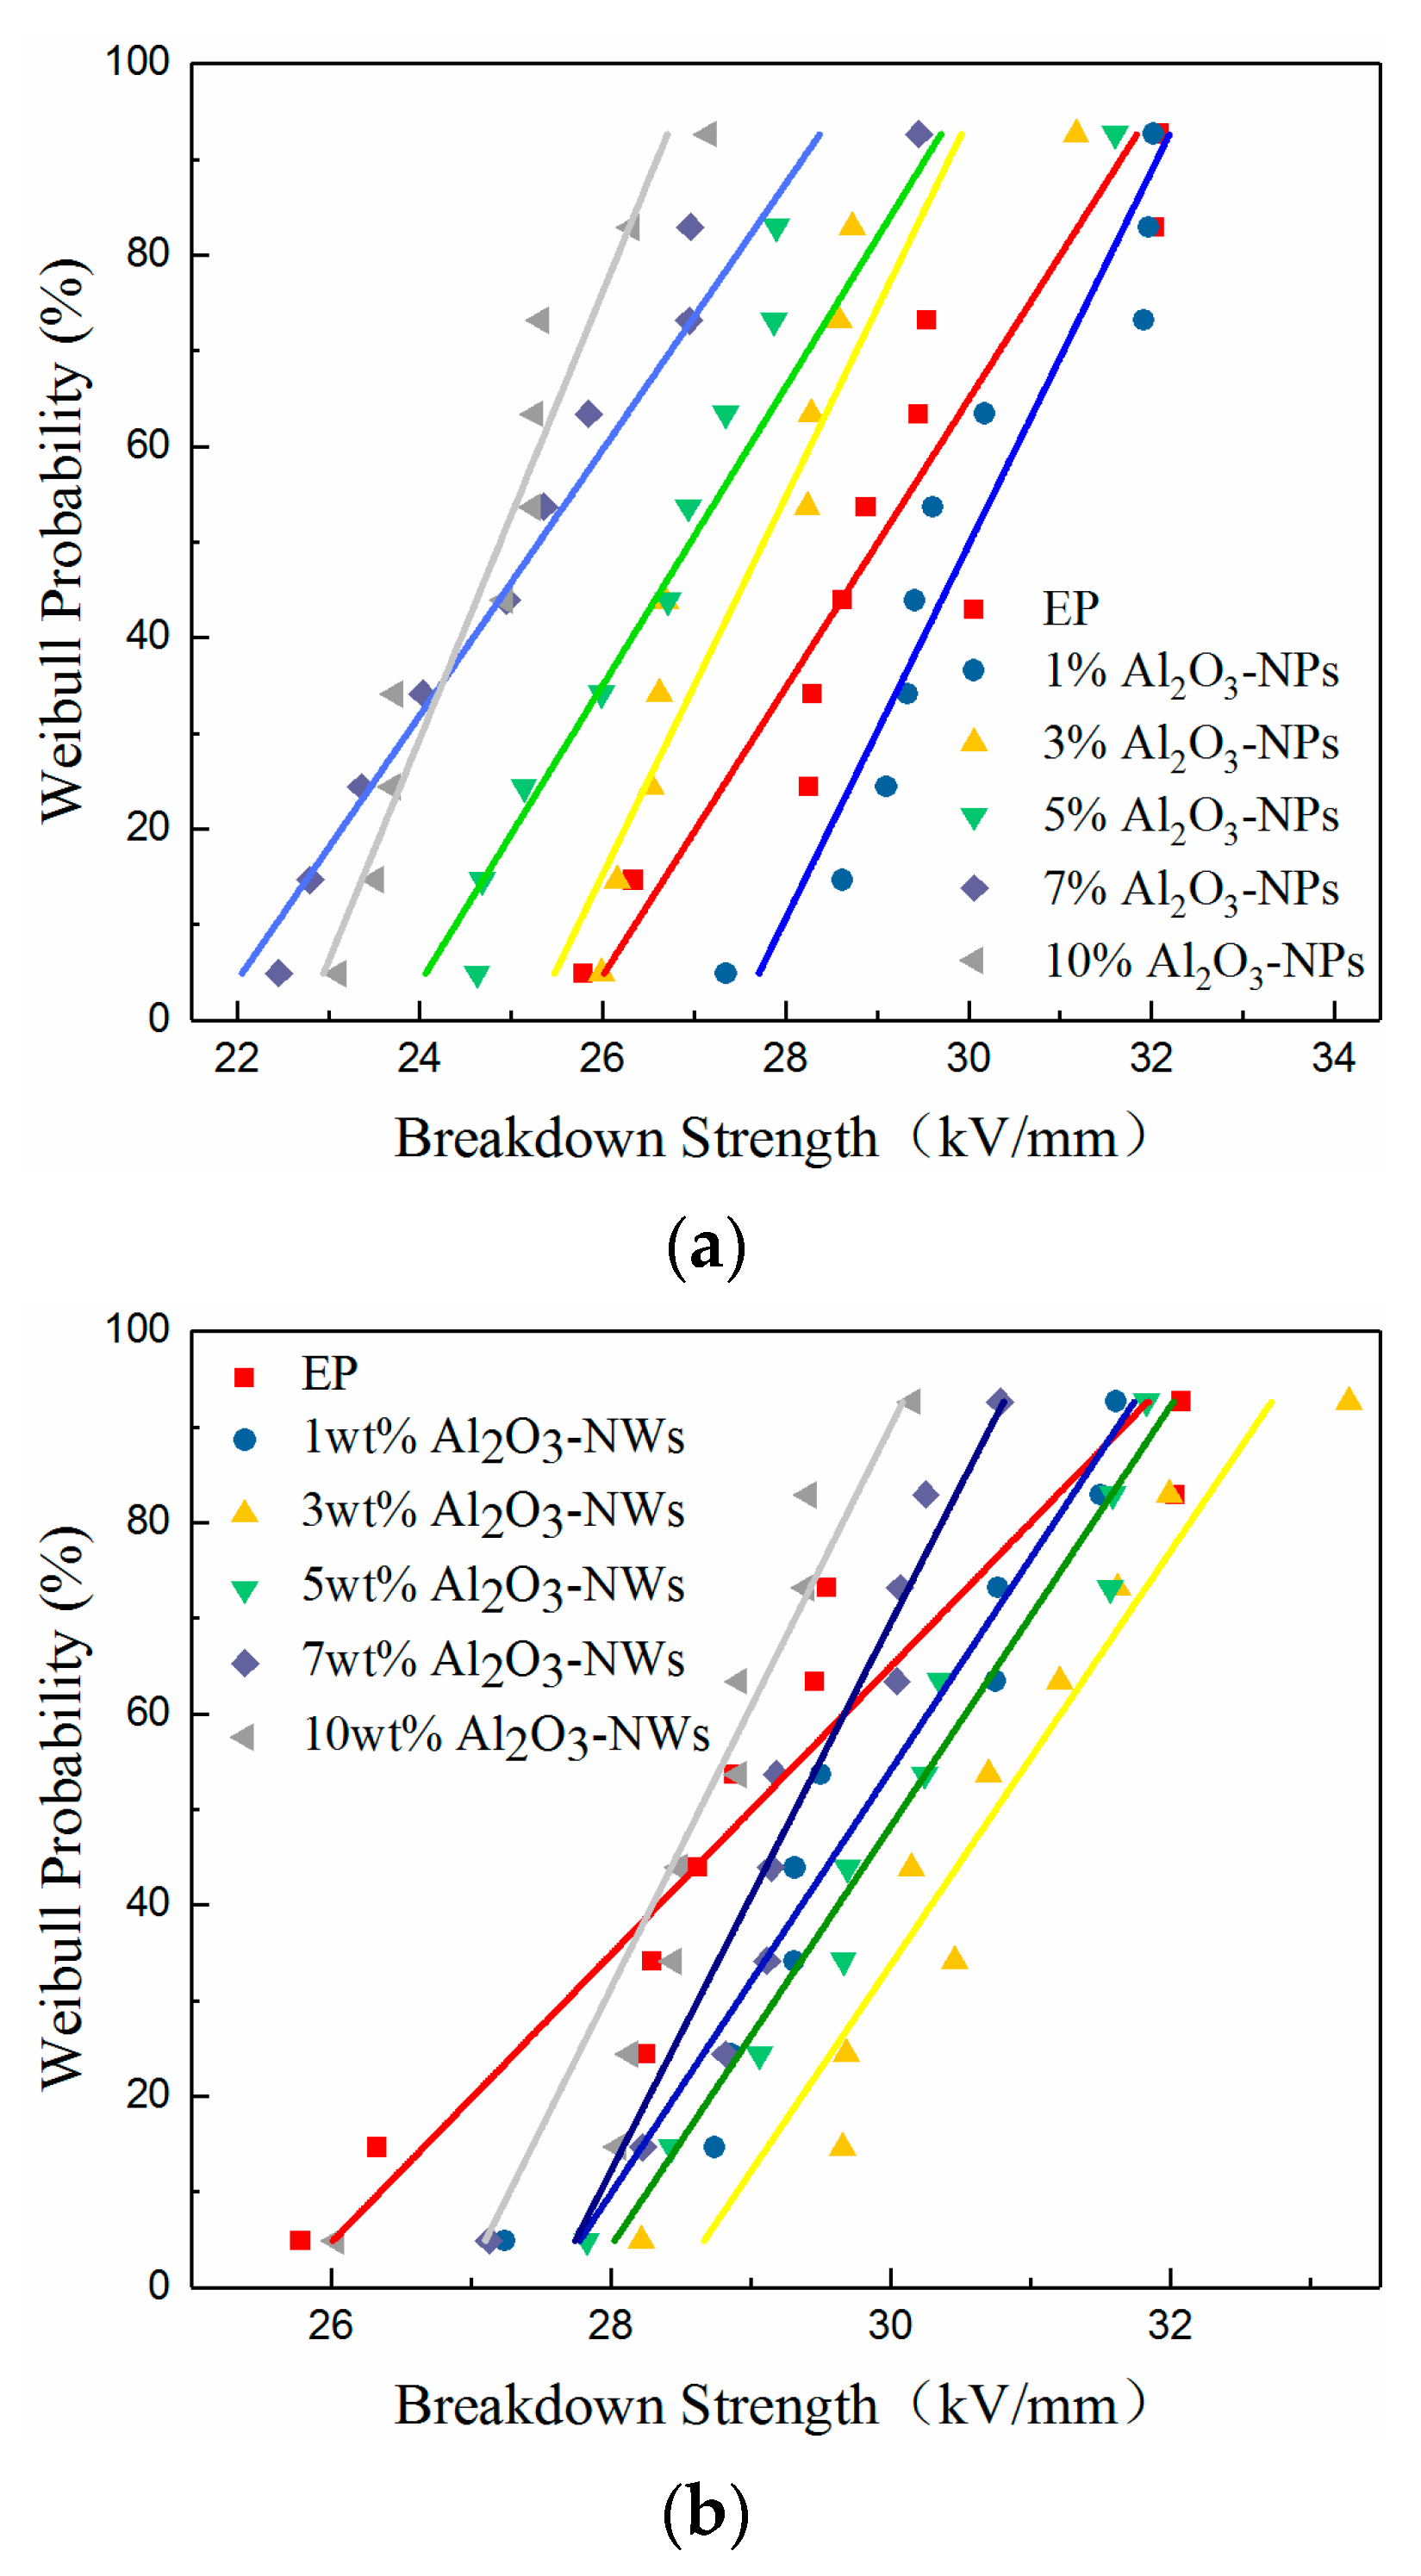
3.5. Breakdown Strength
4. Conclusions
- Nano-Al2O3 can improve the thermal conductivity of composites. The thermal conductivity of the composites increased with increasing mass fraction of filler, which was higher than that of the pure epoxy resin. Additionally, the thermal conductivity of the composites increased with increasing filler particle size. Moreover, Al2O3-NWs more easily form parallel heat-conducting paths due to their structure and disordered orientation, which significantly improved the thermal conductivity to a 34% higher value than pure epoxy.
- A proper amount of nano-Al2O3 filler can increase the volume resistivity of the composite. The volume resistivity of the composites first increased and then decreased with increasing mass fraction of fillers, but each nanofiller exhibited a maximum volume resistivity for a distinct mass fraction. More specifically, the mass fraction of Al2O3-NPLs was significantly higher than that of the other two fillers. In addition, Al2O3-NPLs improved the volume resistivity more significantly than the other fillers, which was 53% higher than pure epoxy resin.
- The dielectric properties of the composites were enhanced with the addition of fillers. The dielectric constants of the composites increased with increasing mass fraction of fillers, since Al2O3 has a higher dielectric constant than the epoxy resin. However, the dielectric losses of the composites first decreased and then increased due to the deep traps introduced by the fillers. It was found that the minimum dielectric loss for the Al2O3-NPLs/epoxy composite was lower than for the other two composites.
- A proper amount of nano-Al2O3 filler can improve the AC breakdown performance of the composite. The breakdown strength of the composites first increased and then decreased with increasing mass fraction of filler. Al2O3-NPLs exhibited the most significant enhancement of the AC breakdown performance of the composites. This may be due to the fact that the volume resistivity and dielectric loss of the composite play a vital role in the electrothermal breakdown process of the composite. The layered structure formed by the Al2O3-NPLs in the epoxy resin matrix also improved the breakdown strength of the composite.
Author Contributions
Funding
Conflicts of Interest
References
- Lee, K.H.; Kang, M.S.; Zhang, S.; Gu, Y.; Lodge, T.P.; Frisbie, C.D. “Cut and Stick” Rubbery Ion Gels as High Capacitance Gate Dielectrics. Adv. Mater. 2012, 24, 4457–4462. [Google Scholar] [CrossRef] [PubMed]
- Kim, S.; Cherney, E.; Hackam, R. The loss and recovery of hydrophobicity of RTV silicone rubber insulator coatings. IEEE Trans. Power Deliv. 1990, 5, 1491–1500. [Google Scholar] [CrossRef]
- Nagendiran, S.; Alagar, M.; Hamerton, I. Octasilsesquioxane-reinforced DGEBA and TGDDM epoxy nanocomposites: Characterization of thermal, dielectric and morphological properties. Acta Mater. 2010, 58, 3345–3356. [Google Scholar] [CrossRef]
- Lee, T.K.; Zaini, N.F.M.; Mobarak, N.N.; Hassan, N.H.; Noor, S.A.M.; Mamat, S.; Loh, K.S.; KuBulat, K.H.; Su’Ait, M.S.; Ahmad, A. PEO based polymer electrolyte comprised of epoxidized natural rubber material (ENR50) for Li-Ion polymer battery application. Electrochim. Acta 2019, 316, 283–291. [Google Scholar] [CrossRef]
- Mishra, P.; Gayathri, C.S.; Sarathi, R. Influence of Salt Fog Test on Silicone Rubber Insulating Material Under AC and DC Voltages. INAE Lett. 2018, 4, 1–6. [Google Scholar] [CrossRef]
- Xie, C.; Lai, X.; Li, H.; Zeng, X. Effective improvement of anti-tracking of addition-cure liquid silicone rubber via charge dissipation of fluorosilane-grafted silica. Polym. Degrad. Stab. 2019, 167, 250–258. [Google Scholar] [CrossRef]
- Saad, R.; Mustafa, E.; Tamus, Z.Á. Mechanical stresses on polymer insulating materials. In Proceedings of the 2018 International Conference on Diagnostics in Electrical Engineering (Diagnostika), Pilsen, Czech Republic, 4–7 September 2018. [Google Scholar]
- Li, S.; Yin, G.; Chen, G.; Li, J.; Bai, S.; Zhong, L.; Zhang, Y.; Lei, Q. Short-term breakdown and long-term failure in nanodielectrics: A review. IEEE Trans. Dielectr. Electr. Insul. 2010, 17, 1523–1535. [Google Scholar] [CrossRef]
- Desmars, L.; Galy, J.; Bachellerie, D.; Cristiano-Tassi, A.; Pruvost, S. High Voltage Electrical Properties of Epoxy / h-BN Microcomposites. In Proceedings of the IEEE 2nd International Conference on Dielectrics (ICD), Budapest, Hungary, 1–5 July 2018. [Google Scholar] [CrossRef]
- Luo, S.; Shen, Y.; Yu, S.-H.; Wan, Y.; Liao, W.-H.; Sun, R.; Wong, C.-P. Construction of a 3D-BaTiO 3 network leading to significantly enhanced dielectric permittivity and energy storage density of polymer composites. Energy Environ. Sci. 2017, 10, 137–144. [Google Scholar] [CrossRef]
- Li, Q.; Zhang, G.; Liu, F.; Han, K.; Gadinski, M.R.; Xiong, C.; Wang, Q. Solution-processed ferroelectric terpolymer nanocomposites with high breakdown strength and energy density utilizing boron nitride nanosheets. Energy Environ. Sci. 2015, 8, 922–931. [Google Scholar] [CrossRef]
- Chae, H.G.; Kumar, S. Making Strong Fibers. Science 2008, 319, 908–909. [Google Scholar] [CrossRef]
- Tang, Y.; Zhang, P.; Zhu, M.-X.; Li, J.; Li, Y.; Wang, Z.; Huang, L. Temperature Effects on the Dielectric Properties and Breakdown Performance of h-BN/Epoxy Composites. Materials 2019, 12, 4112. [Google Scholar] [CrossRef] [PubMed]
- Han, C.; Li, Z.; Dou, S.X. Recent progress in thermoelectric materials. Chin. Sci. Bull. 2014, 59, 2073–2091. [Google Scholar] [CrossRef]
- Loste, J.; Lopez-Cuesta, J.-M.; Billon, L.; Garay, H.; Save, M. Transparent polymer nanocomposites: An overview on their synthesis and advanced properties. Prog. Polym. Sci. 2019, 89, 133–158. [Google Scholar] [CrossRef]
- Mortazavi, B.; Benzerara, O.; Meyer, H.; Bardon, J.; Ahzi, S. Combined molecular dynamics-finite element multiscale modeling of thermal conduction in graphene epoxy nanocomposites. Carbon 2013, 60, 356–365. [Google Scholar] [CrossRef]
- Adnan, M.M.; Tveten, E.G.; Glaum, J.; Ese, M.-H.G.; Hvidsten, S.; Glomm, W.; Einarsrud, M.-A. Epoxy-Based Nanocomposites for High-Voltage Insulation: A Review. Adv. Electron. Mater. 2018, 5, 1800505. [Google Scholar] [CrossRef]
- Agrawal, A.; Satapathy, A. Thermal, mechanical, and dielectric properties of aluminium oxide and solid glass microsphere-reinforced epoxy composite for electronic packaging application. Polym. Compos. 2019, 40, 2573–2581. [Google Scholar] [CrossRef]
- Lee, K.-H.; Bae, J.-S.; Yeum, J.H.; Park, J.; Sung, C.; Kim, J.; Oh, W.; Park, J. Thermal characteristics of epoxy composites with graphite and alumina. Thermochim. Acta 2019, 676, 115–119. [Google Scholar] [CrossRef]
- Moreira, D.; Braga, J.N.R.; A Sphaier, L.; Nunes, L.C. Size effect on the thermal intensification of alumina-filled nanocomposites. J. Compos. Mater. 2016, 50, 3699–3707. [Google Scholar] [CrossRef]
- Eker, Y.R.; Özcan, M.; Özkan, A.O.; Kırkıcı, H. The influence of al 2 o 3 and tio 2 additives on the electrical resistivity of epoxy resin based composites at low temperature. Macromol. Mater. Eng. 2019, 304, 1800670. [Google Scholar] [CrossRef]
- Zhang, G.; Zhang, X.; Yang, T.; Li, Q.; Chen, L.-Q.; Jiang, S.; Wang, Q. Colossal Room-Temperature Electrocaloric Effect in Ferroelectric Polymer Nanocomposites Using Nanostructured Barium Strontium Titanates. ACS Nano 2015, 9, 7164–7174. [Google Scholar] [CrossRef]
- Guo, N.; DiBenedetto, S.A.; Tewari, P.; Lanagan, M.T.; Ratner, M.A.; Marks, T.J. Nanoparticle, Size, Shape, and Interfacial Effects on Leakage Current Density, Permittivity, and Breakdown Strength of Metal Oxide−Polyolefin Nanocomposites: Experiment and Theory. Chem. Mater. 2010, 22, 1567–1578. [Google Scholar] [CrossRef]
- Robertson, J. Band offsets of wide-band-gap oxides and implications for future electronic devices. J. Vac. Sci. Technol. B Microelectron. Nanometer Struct. 2000, 18, 1785. [Google Scholar] [CrossRef]
- Ramu, T.; Nagamani, H. Alumina and silica based epoxy nano-composites for electrical insulation. IEEE Trans. Dielectr. Electr. Insul. 2014, 21, 236. [Google Scholar] [CrossRef]
- Nascimento, E.D.; Ramos, A.; Windmöller, D.; Rodrigo, P.R.; Juanes, R.T.; Ribes-Greus, A.; Borras, V.A.; Coelho, L.A.F. Breakdown, free-volume and dielectric behavior of the nanodielectric coatings based on epoxy/metal oxides. J. Mater. Sci. Mater. Electron. 2016, 27, 9240–9254. [Google Scholar] [CrossRef]
- Huang, X.; Zhi, C.; Jiang, P.; Golberg, D.; Bando, Y.; Tanaka, T. Polyhedral Oligosilsesquioxane-Modified Boron Nitride Nanotube Based Epoxy Nanocomposites: An Ideal Dielectric Material with High Thermal Conductivity. Adv. Funct. Mater. 2012, 23, 1824–1831. [Google Scholar] [CrossRef]
- Zhu, Y.; Yao, H.; Jiang, P.; Wu, J.; Zhu, X.; Huang, X. Two-Dimensional High-k Nanosheets for Dielectric Polymer Nanocomposites with Ultrahigh Discharged Energy Density. J. Phys. Chem. C 2018, 122, 18282–18293. [Google Scholar] [CrossRef]
- Faleh, H.; Al-Mahaidi, R.; Shen, L. Fabrication and characterization of nano-particles-enhanced epoxy. Compos. Part B Eng. 2012, 43, 3076–3080. [Google Scholar] [CrossRef]
- Wang, H.; Chu, W.; Chen, G. A Brief Review on Measuring Methods of Thermal Conductivity of Organic and Hybrid Thermoelectric Materials. Adv. Electron. Mater. 2019, 5. [Google Scholar] [CrossRef]
- Kao, C.K. Dielectric Phenomena in Solids Electrical Aging, Discharge, and Breakdown Phenomena; Elsevier: San Diego, CA, USA, 2004; pp. 283–326. [Google Scholar]
- Yin, Y.; Dong, X.; Chen, J.; Li, Z.; Dang, Z. High Field Electrical Conduction in the Nanocomposite of Low-density Polyethylene and Nano-SiOX. IEEJ Trans. Fundam. Mater. 2006, 126, 1064–1071. [Google Scholar] [CrossRef]
- Lewis, T.J. Interfaces: Nanometric dielectrics. J. Phys. D Appl. Phys. 2005, 38, 202–212. [Google Scholar] [CrossRef]
- Tanaka, T.; Kozako, M.; Fuse, N.; Ohki, Y. Proposal of a multi-core model for polymer nanocomposite dielectrics. IEEE Trans. Dielectr. Electr. Insul. 2005, 12, 669–681. [Google Scholar] [CrossRef]
- Huang, X.; Sun, B.; Zhu, Y.; Li, S.; Jiang, P. High-k polymer nanocomposites with 1D filler for dielectric and energy storage applications. Prog. Mater. Sci. 2019, 100, 187–225. [Google Scholar] [CrossRef]
- Sihvola, A. Electromagnetic Mixing Formulas and Applications; Institution of Engineering and Technology (IET): London, UK, 1999; p. 61. [Google Scholar]
- Gereben, O.; Pusztai, L. On the accurate calculation of the dielectric constant from molecular dynamics simulations: The case of SPC/E and SWM4-DP water. Chem. Phys. Lett. 2011, 507, 80–83. [Google Scholar] [CrossRef]
- 38 Zhang, T.; Lei, Y.; Yin, J.; Du, J.; Yu, P. Effects of pores on dielectric breakdown of alumina ceramics under AC electric field. Ceram. Int. 2019, 45, 13951–13957. [Google Scholar] [CrossRef]


| Al2O3-NPs | Al2O3-NWs | Al2O3-NPLs | ||||
|---|---|---|---|---|---|---|
| Mass Fraction | E0 | β | E0 | β | E0 | β |
| 0 wt.% | 29.5 | 22.5 | 29.5 | 22.5 | 29.5 | 22.5 |
| 1 wt.% | 30.2 | 30.5 | 30.7 | 24.7 | 30.7 | 23.7 |
| 3 wt.% | 28.3 | 35.3 | 31.5 | 29.7 | 31.3 | 303 |
| 5 wt.% | 27.3 | 28.5 | 30.3 | 34.5 | 32.3 | 28.0 |
| 7 wt.% | 25.8 | 21.3 | 30.0 | 29.3 | 31.9 | 24.0 |
| 10 wt.% | 25.3 | 33.8 | 28.9 | 28.5 | 30.2 | 29.2 |
© 2020 by the authors. Licensee MDPI, Basel, Switzerland. This article is an open access article distributed under the terms and conditions of the Creative Commons Attribution (CC BY) license (http://creativecommons.org/licenses/by/4.0/).
Share and Cite
Tang, Y.; Ge, G.; Li, Y.; Huang, L. Effect of Al2O3 with Different Nanostructures on the Insulating Properties of Epoxy-Based Composites. Materials 2020, 13, 4235. https://doi.org/10.3390/ma13194235
Tang Y, Ge G, Li Y, Huang L. Effect of Al2O3 with Different Nanostructures on the Insulating Properties of Epoxy-Based Composites. Materials. 2020; 13(19):4235. https://doi.org/10.3390/ma13194235
Chicago/Turabian StyleTang, Yongzhe, Guanghui Ge, Yuxia Li, and Liangsong Huang. 2020. "Effect of Al2O3 with Different Nanostructures on the Insulating Properties of Epoxy-Based Composites" Materials 13, no. 19: 4235. https://doi.org/10.3390/ma13194235
APA StyleTang, Y., Ge, G., Li, Y., & Huang, L. (2020). Effect of Al2O3 with Different Nanostructures on the Insulating Properties of Epoxy-Based Composites. Materials, 13(19), 4235. https://doi.org/10.3390/ma13194235