THz Fingerprints of Cement-Based Materials

 , , ,
, , , 
Abstract
1. Introduction
2. Materials and Methods
2.1. Sample Preparation
2.1.1. OPC Cement Pastes
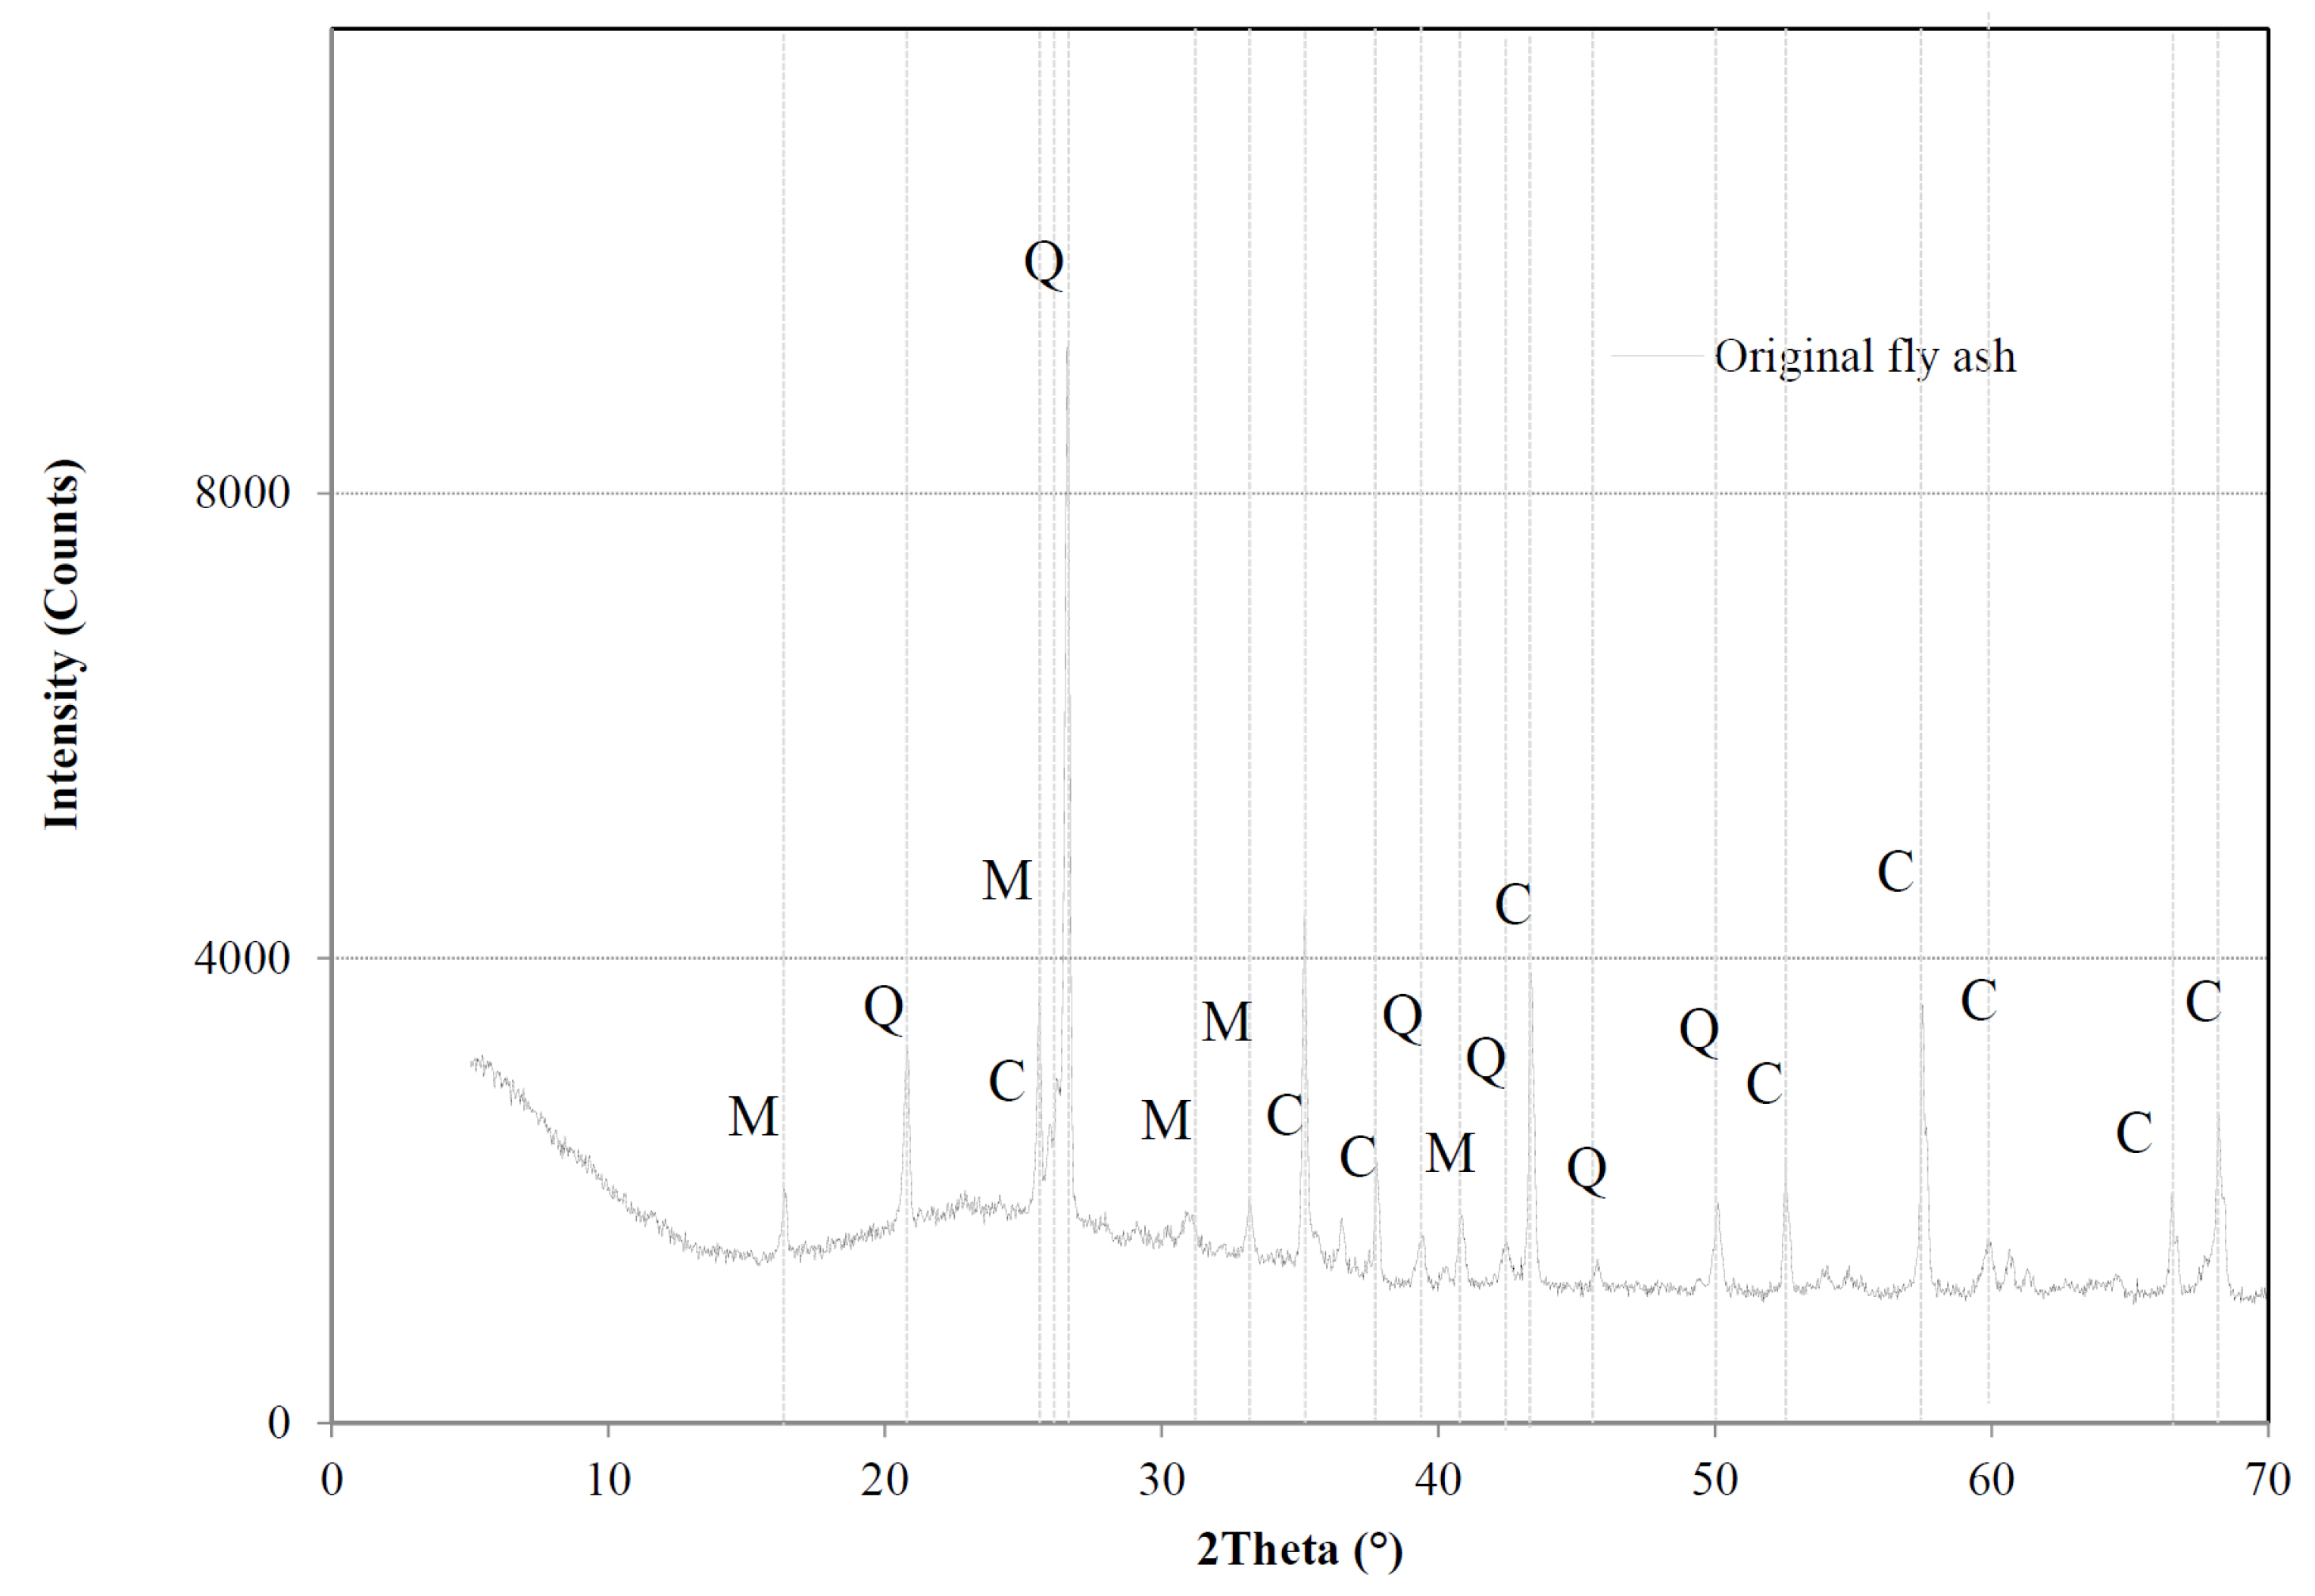
2.1.2. GEO Cement Pastes
2.2. THz Measurements
2.3. Atomistic Simulations
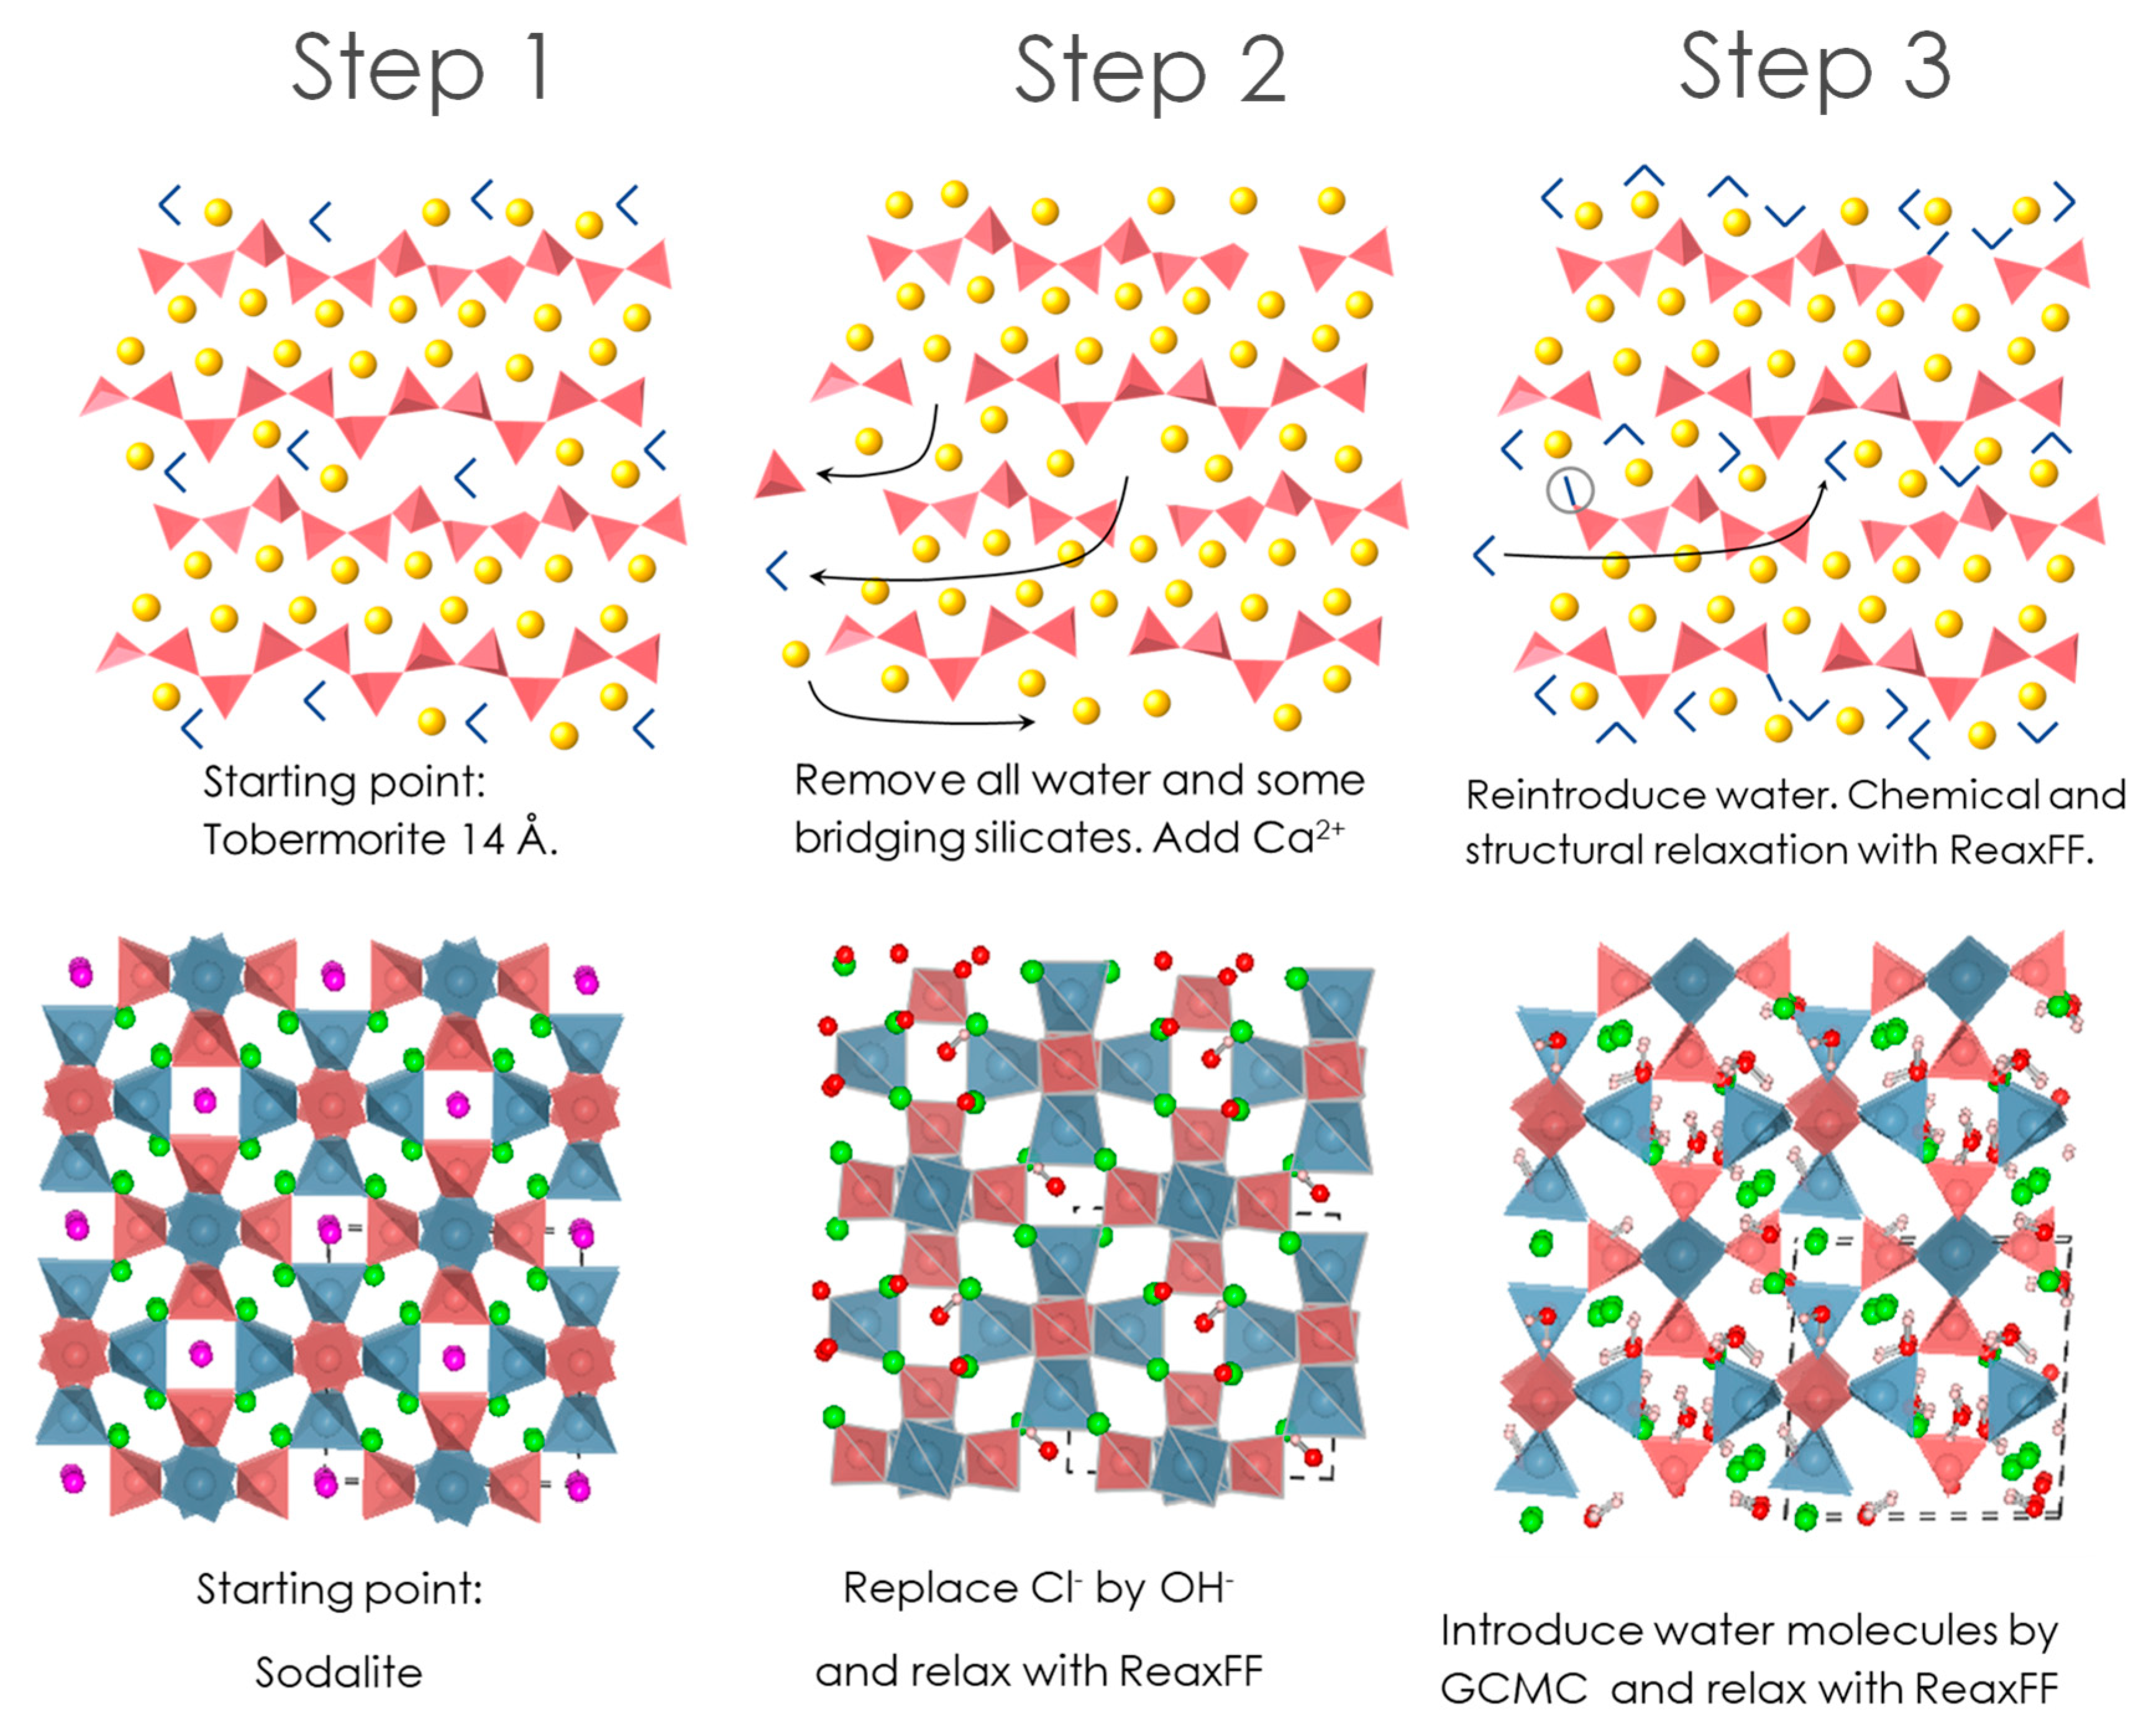
2.3.1. Starting Structures
2.3.2. Dielectric Response Simulations
3. Results
4. Discussion
Author Contributions
Funding
Acknowledgments
Conflicts of Interest
Appendix A


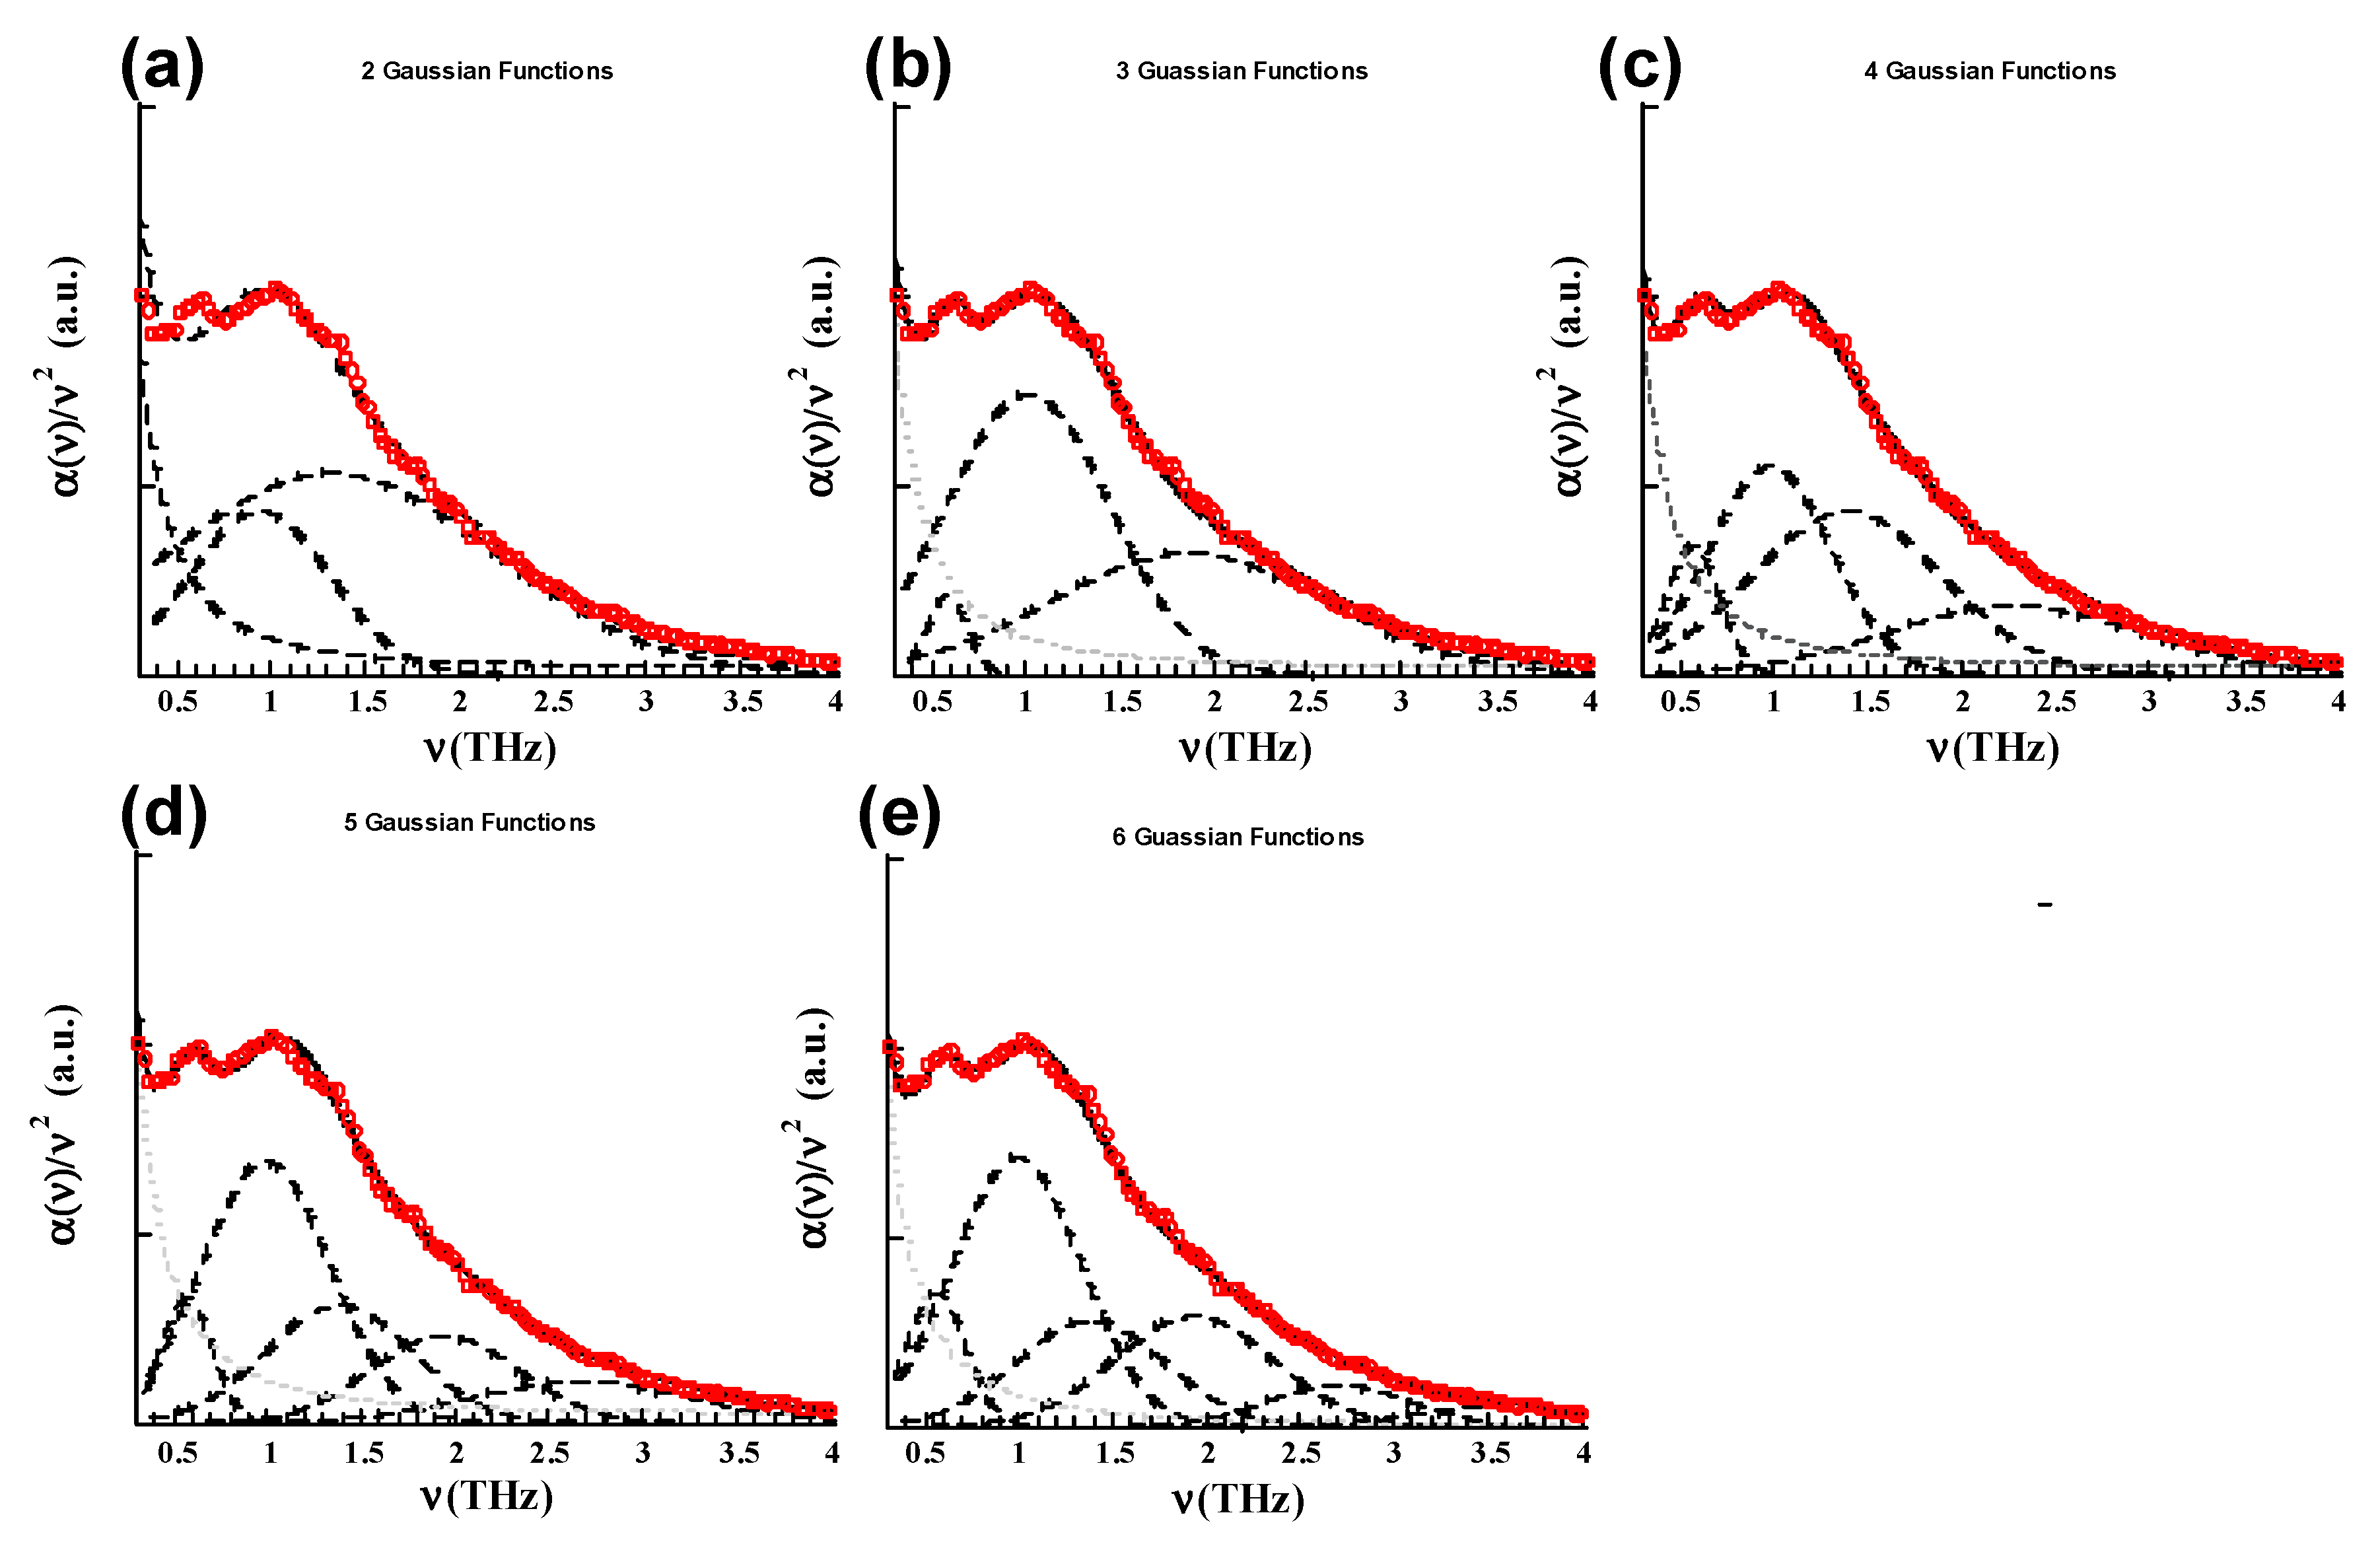
| OPC spectra | (THz) | (THz) | (THz) | (THz) | (THz) | (THz) |
| N = 2 | 0.92 (0.34) | 1.32 (0.34) | ||||
| N = 3 | 0.58 (0.0) | 1.01 (0.01) | 1.88 (0.48) | |||
| N = 4 | 0.58 (0) | 1.0 (0) | 1.40 (0) | 2.35 (0.4) | ||
| N = 5 | 0.58 (0.01) | 1.00 (0.01) | 1.40 (0) | 1.95 (0) | 2.75 (0) | |
| N = 6 | 0.57 | 0.99 | 1.40 | 1.95 | 2.75 | 3.65 |
| GEO spectra | (THz) | (THz) | (THz) | (THz) | (THz) | (THz) |
| N = 2 | 0.45 (0.04) | 1.44 (0.32) | ||||
| N = 3 | 0.49 (0.02)) | 1.12 (0.05) | 1.82 (0.41) | |||
| N = 4 | 0.51 (0.09) | 1.07 (0.07) | 1.41 (0.01) | 2.05 (0.1) | ||
| N = 5 | 0.6 (0.06) | 1.0 (0.05) | 1.40 (0.01) | 1.95 (0.05) | 2.75 (0.02) | |
| N = 6 | 0.54 | 1.05 | 1.41 | 2.0 | 2.73 | 3.53 |
References
- Tonouch, M. Cutting-edge Terahertz technology. Nat. Photonics 2007, 1, 97–105. [Google Scholar] [CrossRef]
- Martin-Moreno, L.; Garcia-Vidal, F.J.; Lezec, H.J.; Pellerin, K.M.; Thio, T.; Pendry, J.B.; Ebbesen, T.W. Theory of Extraordinary Optical Transmission through Subwavelength Hole Arrays. Phys. Rev. Lett. 2001, 86, 1114–1117. [Google Scholar] [CrossRef]
- Ebbesen, T.W.; Lezec, H.J.; Ghaemi, H.; Thio, T.; Wolf, P.A. Extraordinay optical transmission through subwavelength hole mays. Nature 1998, 391, 667–669. [Google Scholar] [CrossRef]
- Krishnamoorthy, H.N.S.; Adamo, G.; Yin, J.; Savinov, V.; Zheludev, N.I.; Soci, C. Infrared dielectric metamaterials from high refractive index chalcogenides. Nat. Commun. 2020, 11, 169. [Google Scholar] [CrossRef]
- Liu, X.; Chang, Q.; Yan, M.; Wang, X.; Zhang, H.; Zhou, H.; Fan, T. Scalable spectrally selective mid-infrared meta-absorbers for advanced radiative thermal engineering. Phys. Chem. Chem. Phys. 2020, 22, 13965–13974. [Google Scholar] [CrossRef]
- Beruete, M.; Sorolla, M.; Campillo, I.; Dolado, J.S.; Martin-Moreno, L.; Bravo-Abad, J.; Garcia-Vidal, F.J. Enhanced millimeter-wave transmission through subwavelength hole arrays. Opt. Lett. 2004, 29, 2500–2502. [Google Scholar] [CrossRef] [PubMed]
- Beruete, M.; Sorolla, M.; Campillo, I.; Dolado, J.S.; Martín-Moreno, L.; Bravo-Abad, J.; García-Vidal, F.J. Enhanced Millimeter Wave Transmission Through Quasioptical Subwavelength Perforated Plates. IEEE Trans. Antennas Propag. 2005, 53, 1897–1903. [Google Scholar] [CrossRef]
- Beruete, M.; Campillo, I.; Dolado, J.S.; Rodriguez-Seco, J.E.; Perea, E.; Falcone, F.; Sorolla, M. Very low profile and dielectric loaded feeder antenna. IEEE Antennas Wirel. Propag. Lett. 2007, 6, 544–548. [Google Scholar] [CrossRef]
- Beruete, M.; Campillo, I.; Dolado, J.S.; Rodriguez-Seco, J.E.; Perea, E.; Falcone, F.; Sorolla, M. Low-profile corrugated feeder antenna. IEEE Antennas Wirel. Propag. Lett. 2005, 4, 378–380. [Google Scholar] [CrossRef]
- Ramachandran, V.S.; Beaudoin, J.J. Handbook of Analytical Techniques in Concrete Science and Technology: Principles, Techniques and Applications; Elsevier: Amsterdam, The Netherlands, 2000. [Google Scholar]
- Cong, X.; Kirkpatrick, R.J. 29Si MAS NMR Study of the Structure of Calcium Silicate Hydrate. Adv. Cement Based Mater. 1996, 3, 144–146. [Google Scholar] [CrossRef]
- Brough, A.R.; Dobson, C.M.; Richardson, I.G.; Groves, G.W. In Situ Solid State NMR Studies of Ca3SiO5: Hydration at Room Temperature and at Elevated Temperatures Using 29Si Enrichment. J. Mater. Sci. 1994, 29, 3926–3940. [Google Scholar] [CrossRef]
- Palomo, A.; Grutzeck, M.W.; Blanco, M. Alkali-activated fly ashes-A cement for the future. Cem. Concr. Res. 1999, 29, 1323–1329. [Google Scholar] [CrossRef]
- Duxson, P.; Fernández-Jiménez, A.; Provis, J.L.; Lukey, G.C.; Palomo, A.; van Deventer, J.S.J. Geopolymer technology: The current state of the art. J. Mater. Sci. 2007, 42, 2917–2933. [Google Scholar] [CrossRef]
- Provis, J.L.; Lukey, G.C.; van Deventer, J.S.J. Do Geopolymers Actually Contain Nanocrystalline Zeolites? A Reexamination of Existing Results. Chem. Mater. 2005, 17, 3075–3085. [Google Scholar] [CrossRef]
- Pellenq, R.J.-M.; Kushima, A.; Shahsavari, R.; Van Vliet, K.J.; Buehler, M.J.; Yip, S.; Ulm, F.J. A realistic moleculart model of cement hydrates. Proc. Natl. Acad. Sci. USA 2009, 106, 16102–16107. [Google Scholar] [CrossRef] [PubMed]
- Dolado, J.S.; Griebel, M.; Hamaekers, J.; Heber, F. The nano-branched structure of cementitious calcium-silicate-hydrate gel. J. Mater. Chem. 2011, 21, 4445–4449. [Google Scholar] [CrossRef]
- Manzano, H.; Dolado, J.; Ayuela, A. Elastic Properties of the Main Species Present in Portland Cement Pastes. Acta Mater. 2009, 57, 1666–1674. [Google Scholar] [CrossRef]
- Qomi, M.J.A.; Krakowiak, K.J.; Bauchy, M.; Stewart, K.L.; Shahsavari, R.; Jagannathan, D.; Brommer, D.B.; Baronnet, A.; Buehler, M.J.; Yip, S.; et al. Combinatorial Molecular Optimization of Cement Hydrates. Nat. Commun. 2014, 5, 1–10. [Google Scholar] [CrossRef]
- Lolli, F.; Manzano, H.; Provis, J.L.; Bignozzi, M.C.; Masoero, E. Atomistic simulations of geopolymer models: The impact of disorder on structure and mechanics. Appl. Mater. Interfaces 2018, 25, 22809–22820. [Google Scholar] [CrossRef]
- Richet, N.F.; Kawaji, H.; Rouxel, T. The boson peak of silicate glasses: The role of Si–O, Al–O, and Si–N bonds. J. Chem. Phys. 2010, 133, 044510. [Google Scholar] [CrossRef]
- Baggioli, M.; Zaccone, A. Universal Origin of Boson Peak Vibrational Anomalies in Ordered Crystals and in Amorphous Materials. Phys. Rev. Lett. 2019, 2019 122, 145501. [Google Scholar] [CrossRef]
- Grigera, T.S.; Martin-Mayo, V.; Parisi, G.; Verrocchio, P. Phonon interpretation of the ‘bosonpeak’ in supercooled liquids. Nature 2003, 422, 289–292. [Google Scholar] [CrossRef] [PubMed]
- Qomi, M.J.A.; Ulm, F.-J.; Pellenq, R.J.-M. Physical Origins of Thermal Properties of Cement Paste. Phys. Rev. Appl. 2015, 3, 064010. [Google Scholar] [CrossRef]
- Lunkenheimer, P.; Emmert, S.; Gulich, R.; Köhler, M.; Wolf, M.; Schwab, M.; Loid, A. Electromagnetic-radiation absorption by water. Phys. Rev. E 2017, 96, 062607. [Google Scholar] [CrossRef] [PubMed]
- Cerveny, S.; Arrese-Igor, S.; Dolado, J.S.; Gaitero, J.J.; Alegría, A.; Colmenero, J. Effect of hydration on the dielectric properties of C-S-H gel. J. Chem. Phys. 2011, 134, 034509. [Google Scholar] [CrossRef] [PubMed]
- Monasterio, M.; Jansson, H.; Gaitero, J.J.; Dolado, J.S.; Cerveny, S. Cause of the fragile-to-strong transition observed in water confined in C-S-H gel. J. Chem. Phys. 2013, 139, 164714. [Google Scholar] [CrossRef]
- Goracci, G.; Monasterio, M.; Jansson, H.; Cerveny, S. Dynamics of nano-confined water in Portland cement-Comparison with synthetic C-S-H gel and other silicate materials. Sci. Rep. 2017, 7, 1–10. [Google Scholar] [CrossRef]
- Goracci, G.; Dolado, J.S. Elucidation of Conduction Mechanism in Graphene Nanoplatelets (GNPs)/Cement Composite Using Dielectric Spectroscopy. Materials 2020, 13, 275. [Google Scholar] [CrossRef]
- Senftle, T.P.; Hong, S.; Islam, M.M.; Kylasa, S.B.; Zheng, Y.; Shin, Y.K.; Junkermeier, C.; Engel-Herbert, R.; Janik, M.J.; Aktulga, H.M.; et al. The ReaxFF Reactive Force-Field: Development, Applications and Future Directions. NPJ Comput. Mater. 2016, 2, 15011. [Google Scholar] [CrossRef]
- Duque, E. Atomistic Simulations of Confined Species in 2D Nanostructures: Clays and C-S-H Gel. Ph.D. Thesis, Basque Country University, Leioa, Spain, 2018. [Google Scholar]
- Hassan, I.; Antao, S.M.; Parise, J.B. Sodalite: High-temperature structures obtained from synchrotron radiation and Rietveld refinements. Am. Mineral. 2004, 89, 359–364. [Google Scholar] [CrossRef]
- Sanders, M.J.; Leslie, M.; Catlow, C.R.A. Interatomic potentials for SiO2. J. Chem. Soc. Chem. Commun. 1984, 1271–1273. [Google Scholar] [CrossRef]
- Gale, J.D. GULP-a computer program for the symmetry adapted simulation of solids. J. Chem. Soc. Faraday Trans. 1997, 93, 629–637. [Google Scholar] [CrossRef]
- Kumar, P.; Wikfeldt, K.T.; Schlesinger, D.; Pettersson, L.G.M.; Stanley, H.E. The Boson peak in superccoled water. Sci. Rep. 2013, 3, 1980. [Google Scholar] [CrossRef] [PubMed]
- Woods, K.N. The glassy state of crambin and the THz time scale protein-solvent fluctuations possibly related to protein function. BMC Biophys. 2014, 7, 8. [Google Scholar] [CrossRef] [PubMed]
- Mallamace, F.; Corsaro, C.; Mallamace, D.; Chen, S.; Fratini, E.; Baglioni, P. The Boson peak interpretation and evolution in confined amorphous water. Sci. China Phys. Mech. Astron. 2019, 62, 107004. [Google Scholar] [CrossRef]
- Woods, K.N. Solvent-induced backbone fluctuations and the collective librational dynamics of lysozyme studied by THz spectroscopy. Phys. Rev. E 2010, 81, 031915. [Google Scholar] [CrossRef]
- Martauz, P.; Janotka, I.; Strigáč, J.; Bačuvčík, M. Fundamental properties of industrial hybrid cement: Utilization in ready-mixed concretes and shrinkage-reducing applications. Mater. Construcción 2016, 66, 322. [Google Scholar] [CrossRef]


| Oxide (wt.%) | |||||||||
|---|---|---|---|---|---|---|---|---|---|
| SiO2 | Al2O3 | CaO | MgO | Fe2O3 | SO3 | K2O | TiO2 | Other | |
| Fly ash | 56.8 | 23.8 | 4.8 | 1.5 | 7.2 | 0.3 | 1.6 | 1.2 | 2.8 |
| C-S-H | N-A-S-H | |
|---|---|---|
| Composition | (CaO)254 (SiO2)152 (H2O)306 | (Na2O)4 (Al2O3)3 (SiO2)6 (OH)2 (H2O)9 |
| a (Å) | 26.083000 | 9.483393 |
| b (Å) | 30.847000 | 9.11116 |
| c (Å) | 25.885000 | 9.040023 |
| 90 | 92.536179 | |
| 90 | 91.007071 | |
| 90 | 88.652042 |
| v1 (THz) | v2 (THz) | v3 (THz) | v4 (THz) | v5 (THz) | |
|---|---|---|---|---|---|
| OPC (Exp) | 0.58 ± 0.01 | 1.0 ± 0.01 | 1.40 ± 0.001 | 1.95 ± 0.001 | 2.75 ± 0.01 |
| C-S-H (Sim) | 0.58 | 1.05 | 1.30 | 1.90 | 2.30, 2.85 |
| GEO (Exp) | 0.6 ± 0.06 | 1.0 ± 0.05 | 1.4 ± 0.01 | 1.95 ± 0.05 | 2.75 ± 0.02 |
| N-A-S-H (Sim) | 0.5–0.8 hump | 1.15 | 1.4 | 1.95 | 2.57 |
© 2020 by the authors. Licensee MDPI, Basel, Switzerland. This article is an open access article distributed under the terms and conditions of the Creative Commons Attribution (CC BY) license (http://creativecommons.org/licenses/by/4.0/).
Share and Cite
Dolado, J.S.; Goracci, G.; Duque, E.; Martauz, P.; Zuo, Y.; Ye, G. THz Fingerprints of Cement-Based Materials. Materials 2020, 13, 4194. https://doi.org/10.3390/ma13184194
Dolado JS, Goracci G, Duque E, Martauz P, Zuo Y, Ye G. THz Fingerprints of Cement-Based Materials. Materials. 2020; 13(18):4194. https://doi.org/10.3390/ma13184194
Chicago/Turabian StyleDolado, Jorge S., Guido Goracci, Eduardo Duque, Pavel Martauz, Yibing Zuo, and Guang Ye. 2020. "THz Fingerprints of Cement-Based Materials" Materials 13, no. 18: 4194. https://doi.org/10.3390/ma13184194
APA StyleDolado, J. S., Goracci, G., Duque, E., Martauz, P., Zuo, Y., & Ye, G. (2020). THz Fingerprints of Cement-Based Materials. Materials, 13(18), 4194. https://doi.org/10.3390/ma13184194