Laser-Based Trace Gas Detection inside Hollow-Core Fibers: A Review


Abstract
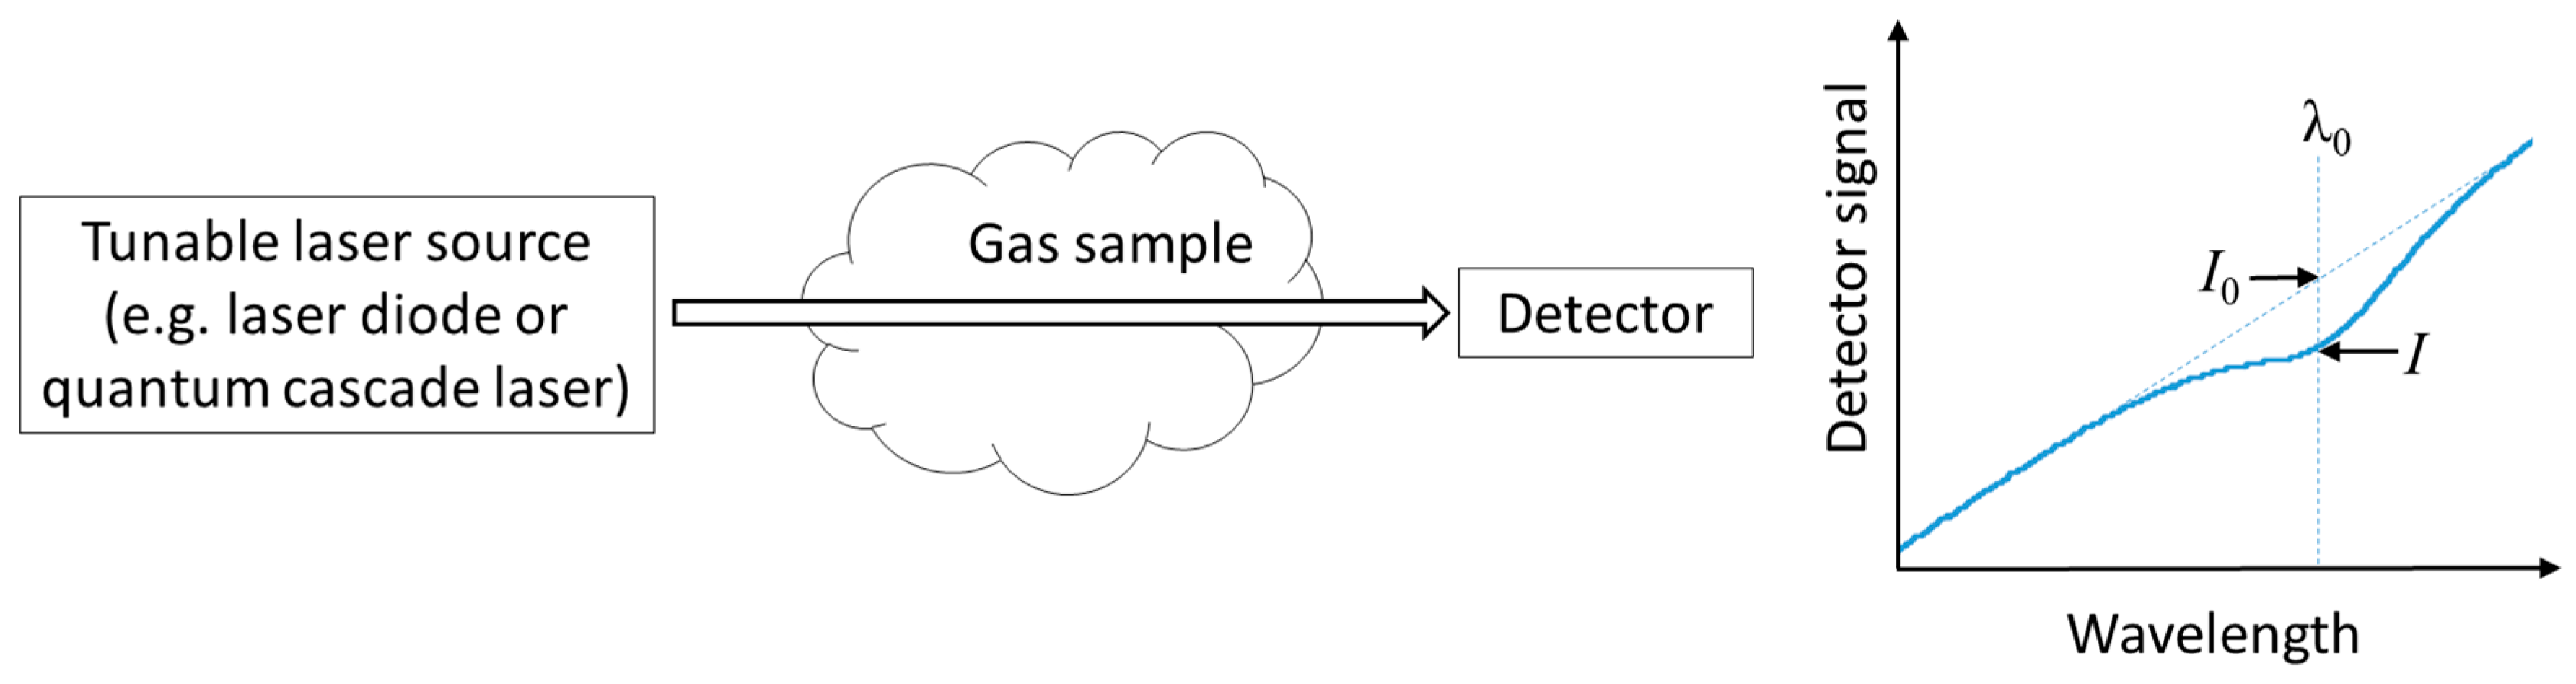
1. Introduction
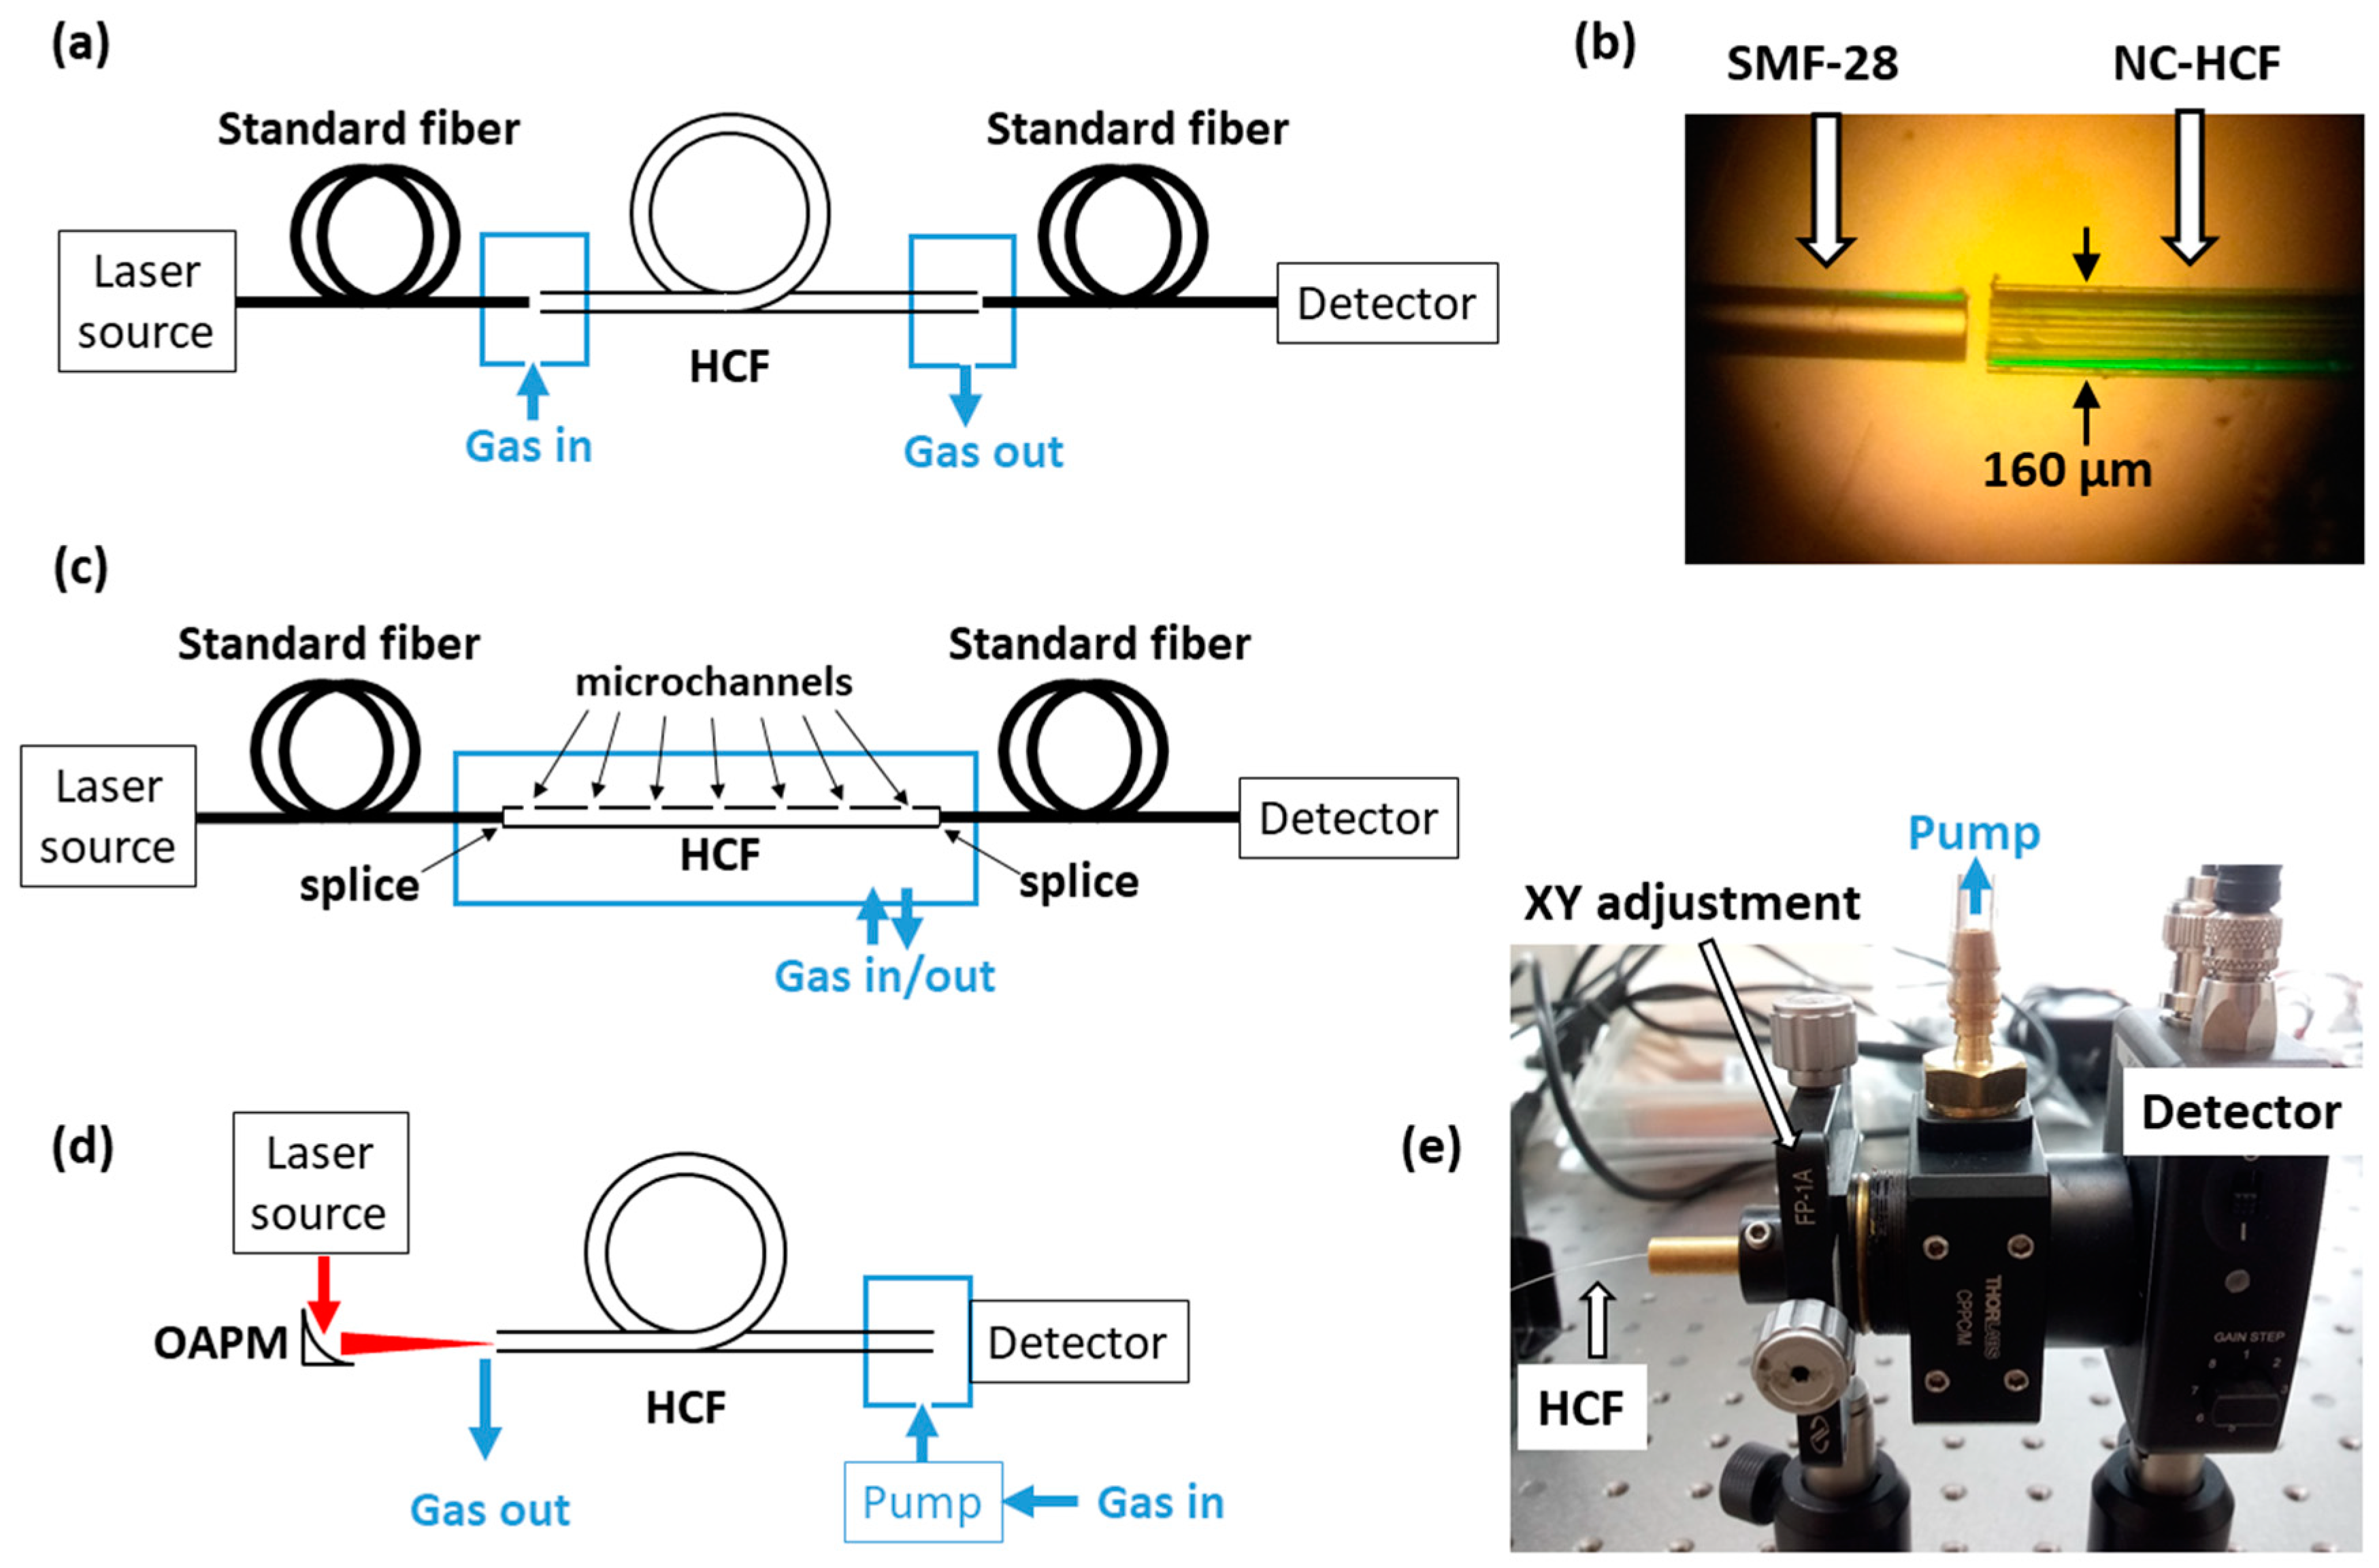
2. Configurations of HCF-Based Gas Sensing Systems
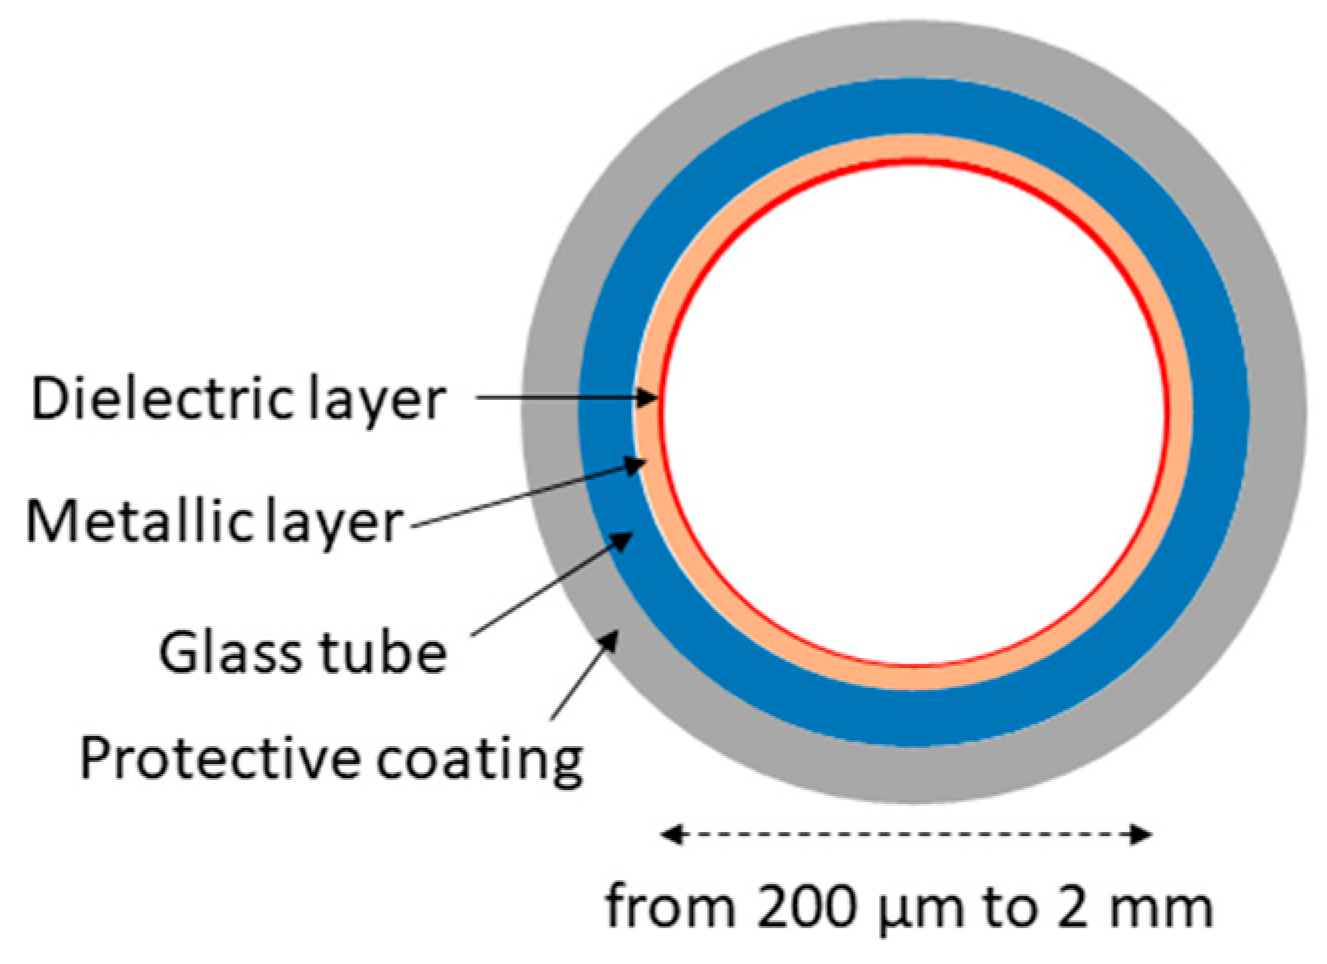
3. Gas Sensing Using Capillary Fibers/Waveguides
4. Gas Sensing Inside Photonic Bad-Gap Hollow-Core Fibers
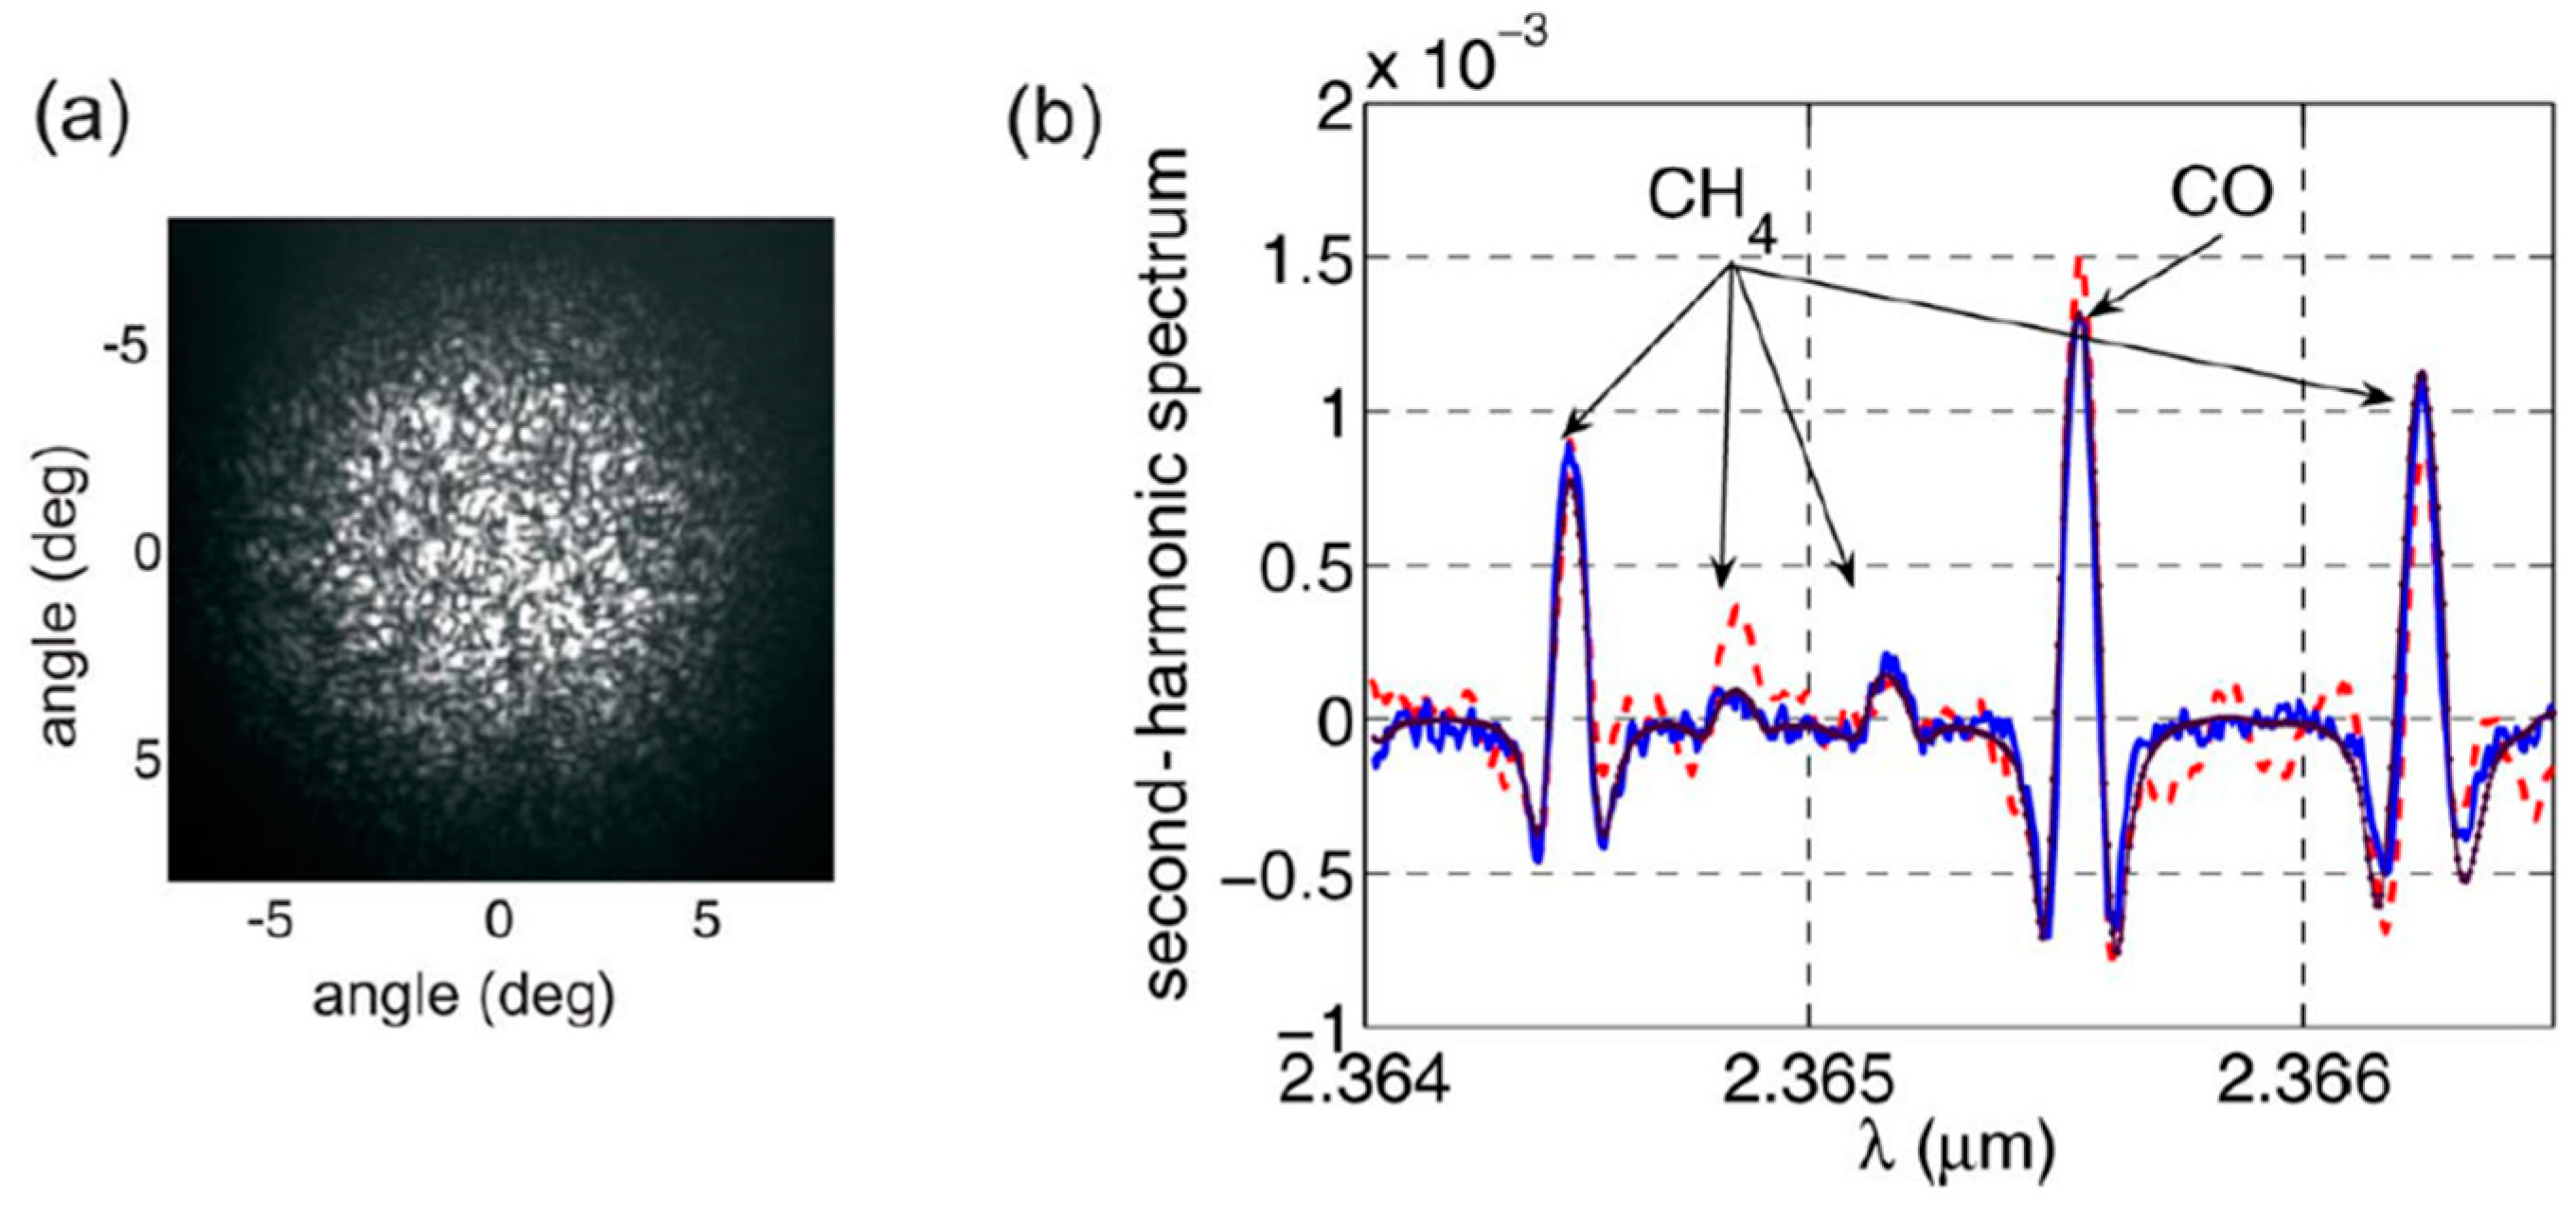
5. Trace-Gas Detection Using Hollow-Core Fibers with Inhibited Coupling Guidance
6. Conclusions
Funding
Conflicts of Interest
References
- White, J.U. Long optical paths of large aperture. J. Opt. Soc. Am. 1942, 32, 285–288. [Google Scholar] [CrossRef]
- Herriott, D.R.; Schulte, H.J. Folded optical delay lines. Appl. Opt. 1965, 4, 883–889. [Google Scholar] [CrossRef]
- Hundt, P.M.; Tuzson, B.; Aseev, O.; Liu, C.; Scheidegger, P.; Looser, H.; Kapsalidis, F.; Shahmohammadi, M.; Faist, J.; Emmenegger, L. Multi-species trace gas sensing with dual-wavelength QCLs. Appl. Phys. B 2018, 124, 108. [Google Scholar] [CrossRef]
- Aseev, O.; Tuzson, B.; Looser, H.; Scheidegger, P.; Liu, C.; Morstein, C.; Niederhauser, B.; Emmenegger, L. High-precision ethanol measurement by mid-IR laser absorption spectroscopy for metrological applications. Opt. Express 2019, 27, 5314–5325. [Google Scholar] [CrossRef]
- McManus, J.B.; Kebabian, P.L.; Zahniser, M.S. Astigmatic mirror multipass absorption cells for long-path-length spectroscopy. Appl. Opt. 1995, 34, 3336–3348. [Google Scholar] [CrossRef]
- Dong, L.; Yu, Y.; Li, C.; So, S.; Tittel, F.K. Ppb-level formaldehyde detection using a CW room-temperature interband cascade laser and a miniature dense pattern multipass gas cell. Opt. Express 2015, 23, 19821–19830. [Google Scholar] [CrossRef]
- Tuzson, B.; Mangold, M.; Looser, H.; Manninen, A.; Emmenegger, L. Compact multipass optical cell for laser spectroscopy. Opt. Lett. 2013, 38, 257–259. [Google Scholar] [CrossRef]
- Thoma, M.L.; Kaschow, R.; Hindelang, F.J. A multiple-reflection cell suited for absorption measurements in shock tubes. Shock Waves 1994, 4, 51–53. [Google Scholar] [CrossRef]
- Graf, M.; Emmenegger, L.; Tuzson, B. Compact, circular, and optically stable multipass cell for mobile laser absorption spectroscopy. Opt. Lett. 2018, 43, 2434–2437. [Google Scholar] [CrossRef]
- Ye, W.; Zheng, C.; Sanchez, N.P.; Girija, A.V.; He, Q.; Zheng, H.; Griffin, R.J.; Tittel, F.K. Thermal effects of an ICL-based mid-infrared CH4 sensor within a wide atmospheric temperature range. Infrared Phys. Technol. 2018, 89, 299–303. [Google Scholar] [CrossRef]
- Nikodem, M.; Gomółka, G.; Klimczak, M.; Pysz, D.; Buczyński, R. Laser absorption spectroscopy at 2 µm inside revolver-type anti-resonant hollow core fiber. Opt. Express 2019, 27, 14998. [Google Scholar] [CrossRef] [PubMed]
- Kuruba, N.; Lu, T. Hollow fiber coupler sensor. Sensors 2019, 19, 806. [Google Scholar] [CrossRef] [PubMed]
- Marcatili, E.A.J.; Schmeltzer, R.A. Hollow metallic and dielectric waveguides for long distance optical transmission and lasers. Bell Syst. Tech. J. 1964, 43, 1783–1809. [Google Scholar] [CrossRef]
- Harrington, J.A.; Rabii, C.; Gibson, D. Transmission properties of hollow glass waveguides for the delivery of CO/sub 2/ surgical laser power. IEEE J. Sel. Top. Quantum Electron. 1999, 5, 948–953. [Google Scholar] [CrossRef]
- Alaluf, M.; Dror, J.; Dahan, R.; Croitoru, N. Plastic hollow fibers as a selective infrared radiation transmitting medium. J. Appl. Phys. 1992, 72, 3878–3883. [Google Scholar] [CrossRef]
- Iwai, K.; Takaku, H.; Miyagi, M.; Shi, Y.-W.; Matsuura, Y. Fabrication of shatter-proof metal hollow-core optical fibers for endoscopic mid-infrared laser applications. Fibers 2018, 6, 24. [Google Scholar] [CrossRef]
- Matsuura, Y.; Abel, T.; Hirsch, J.; Harrington, J.A. Small-bore hollow waveguide for delivery of near singlemode IR laser radiation. Electron. Lett. 1994, 30, 1688–1690. [Google Scholar] [CrossRef]
- Blake, T.A.; Kelly, J.F.; Stewart, T.L.; Hartman, J.S.; Sharpe, S.W.; Sams, R.L. Absorption spectroscopy in hollow-glass waveguides using infrared diode lasers. In Proceedings of the Diode Lasers and Applications in Atmospheric Sensing, Denver, CO, USA, 21 October 1996; Fried, A., Ed.; SPIE, 2002; Volume 4817, pp. 216–232. [Google Scholar]
- Kelly, J.F.; Sams, R.L.; Blake, T.A.; Kriesel, J.M. Further developments of capillary absorption spectrometers using small hollow-waveguide fibers. In Proceedings of the Quantum Sensing and Nanophotonic Devices XI., Seattle, WA, USA, 23 September 2002; Razeghi, M., Tournié, E., Brown, G.J., Eds.; SPIE: Bellingham, WA, USA, 2014; Volume 8993, pp. 261–276. [Google Scholar]
- Chen, J.; Hangauer, A.; Strzoda, R.; Fleischer, M.; Amann, M.-C. Low-level and ultralow-volume hollow waveguide based carbon monoxide sensor. Opt. Lett. 2010, 35, 3577–3579. [Google Scholar] [CrossRef][Green Version]
- Hangauer, A.; Chen, J.; Strzoda, R.; Amann, M.-C. Feasibility study of Zeeman modulation spectrometry with a hollow capillary fiber based gas cell. Opt. Lett. 2012, 37, 1265–1267. [Google Scholar] [CrossRef]
- Litfin, G.; Pollock, C.R.; Curl, R.F.; Tittel, F.K. Sensitivity enhancement of laser absorption spectroscopy by magnetic rotation effect. J. Chem. Phys. 1980, 72, 6602–6605. [Google Scholar] [CrossRef]
- Kim, S.-S.; Young, C.; Chan, J.; Carter, C.; Mizaikoff, B. Hollow Waveguide Gas Sensor for Mid-Infrared Trace Gas Analysis. In Proceedings of the 2007 IEEE Sensors, Atlanta, GA, USA, 28–31 October 2007; pp. 1267–1270. [Google Scholar]
- Francis, D.; Hodgkinson, J.; Livingstone, B.; Black, P.; Tatam, R.P. Low-volume, fast response-time hollow silica waveguide gas cells for mid-IR spectroscopy. Appl. Opt. 2016, 55, 6797–6806. [Google Scholar] [CrossRef] [PubMed]
- Herbst, J.; Scherer, B.; Ruf, A.; Erb, J.; Lambrecht, A. Hollow fiber based quantum cascade laser spectrometer for fast and sensitive drug identification. In Proceedings of the Quantum Sensing and Nanophotonic Devices IX, San Francisco, CA, USA, 20 January 2012; Razeghi, M., Tournie, E., Brown, G.J., Eds.; SPIE: Bellingham, WA, USA, 2012; Volume 8268, pp. 391–398. [Google Scholar]
- Kriesel, J.M.; Makarem, C.N.; Phillips, M.C.; Moran, J.J.; Coleman, M.L.; Christensen, L.E.; Kelly, J.F. Versatile, ultra-low sample volume gas analyzer using a rapid, broad-tuning ECQCL and a hollow fiber gas cell. In Proceedings of the Next-Generation Spectroscopic Technologies X, Anaheim, CA, USA, 9–13 April 2017; Druy, M.A., Crocombe, R.A., Barnett, S.M., Profeta, L.T., Eds.; SPIE: Bellingham, WA, USA, 2017; Volume 10210, pp. 14–20. [Google Scholar]
- Wörle, K.; Seichter, F.; Wilk, A.; Armacost, C.; Day, T.; Godejohann, M.; Wachter, U.; Vogt, J.; Radermacher, P.; Mizaikoff, B. Breath Analysis with Broadly Tunable Quantum Cascade Lasers. Anal. Chem. 2013, 85, 2697–2702. [Google Scholar] [CrossRef] [PubMed]
- Li, Z.; Wang, Z.; Yang, F.; Jin, W.; Ren, W. Mid-infrared fiber-optic photothermal interferometry. Opt. Lett. 2017, 42, 3718–3721. [Google Scholar] [CrossRef] [PubMed]
- Zhou, T.; Wu, T.; Wu, Q.; Ye, C.; Hu, R.; Chen, W.; He, X. Real-time measurement of CO2 isotopologue ratios in exhaled breath by a hollow waveguide based mid-infrared gas sensor. Opt. Express 2020, 28, 10970–10980. [Google Scholar] [CrossRef]
- Huang, S.-H.; Huang, Y.-J.; Chui, H.-C. Trace methane sensor using mid-infrared light emitting diode in hollow-core fiber. Sens. Actuators B Chem. 2019, 282, 599–602. [Google Scholar] [CrossRef]
- Cregan, R.F.; Mangan, B.J.; Knight, J.C.; Birks, T.A.; Russell, P.S.J.; Roberts, P.J.; Allan, D.C. Single-Mode Photonic Band Gap Guidance of Light in Air. Science 1999, 285, 1537–1539. [Google Scholar] [CrossRef]
- Hoo, Y.L.; Jin, W.; Ho, H.L.; Ju, J.; Wang, D.N. Gas diffusion measurement using hollow-core photonic bandgap fiber. Sens. Actuators B Chem. 2005, 105, 183–186. [Google Scholar] [CrossRef]
- Ritari, T.; Tuominen, J.; Ludvigsen, H.; Petersen, J.C.; Sørensen, T.; Hansen, T.P.; Simonsen, H.R. Gas sensing using air-guiding photonic bandgap fibers. Opt. Express 2004, 12, 4080–4087. [Google Scholar] [CrossRef]
- Cubillas, A.M.; Silva-Lopez, M.; Lazaro, J.M.; Conde, O.M.; Petrovich, M.N.; Lopez-Higuera, J.M. Methane detection at 1670-nm band using a hollow-core photonic bandgap fiber and a multiline algorithm. Opt. Express 2007, 15, 17570–17576. [Google Scholar] [CrossRef]
- Cubillas, A.M.; Silva-Lopez, M.; Lazaro, J.M.; Conde, O.M.; Petrovich, M.N.; Lopez-Higuera, J.M. Detection of methane at 1670-nm band with a hollow-core photonic bandgap fiber. In Proceedings of the Proc.SPIE, Strasbourg, France, 21 April 2008; Volume 6990. [Google Scholar]
- Cubillas, A.; Lazaro, J.; Conde, O.; Petrovich, M.; Lopez-Higuera, J. Gas sensor based on photonic crystal fibres in the 2ν3 and ν2 + 2ν3 vibrational bands of methane. Sensors 2009, 9, 6261–6272. [Google Scholar] [CrossRef]
- Masum, B.M.; Aminossadati, S.M.; Kizil, M.S.; Leonardi, C.R. Numerical and experimental investigations of pressure-driven gas flow in hollow-core photonic crystal fibers. Appl. Opt. 2019, 58, 963–972. [Google Scholar] [CrossRef]
- Tang, D.-L.; He, S.; Dai, B.; Tang, X.-H. Detection H2S mixed with natural gas using hollow-core photonic bandgap fiber. Optik 2014, 125, 2547–2549. [Google Scholar] [CrossRef]
- Mejia Quintero, S.M.; Guedes Valente, L.C.; De Paula Gomes, M.S.; da Silva, H.; de Souza, B.; Morikawa, S.R.K. All-Fiber CO2 sensor using hollow core PCF operating in the 2 µm region. Sensors 2018, 18, 4393. [Google Scholar] [CrossRef] [PubMed]
- Jaworski, P. Molecular dispersion spectroscopy in a CO2-filled all-fiber gas cells based on a hollow-core photonic crystal fiber. Opt. Eng. 2019, 58, 1–8. [Google Scholar] [CrossRef]
- Hu, L.; Zheng, C.; Zhang, Y.; Zheng, J.; Wang, Y.; Tittel, F.K. Compact all-fiber light-induced thermoelastic spectroscopy for gas sensing. Opt. Lett. 2020, 45, 1894–1897. [Google Scholar] [CrossRef]
- Hu, L.; Zheng, C.; Yao, D.; Yu, D.; Liu, Z.; Zheng, J.; Wang, Y.; Tittel, F.K. A hollow-core photonic band-gap fiber based methane sensor system capable of reduced mode interference noise. Infrared Phys. Technol. 2019, 97, 101–107. [Google Scholar] [CrossRef]
- Parry, J.P.; Griffiths, B.C.; Gayraud, N.; McNaghten, E.D.; Parkes, A.M.; MacPherson, W.N.; Hand, D.P. Towards practical gas sensing with micro-structured fibres. Meas. Sci. Technol. 2009, 20, 75301. [Google Scholar] [CrossRef]
- Carvalho, J.P.; Lehmann, H.; Bartelt, H.; Magalhães, F.; Amezcua-Correa, R.; Santos, J.L.; Van Roosbroeck, J.; Araújo, F.M.; Ferreira, L.A.; Knight, J.C. Remote system for detection of low-levels of methane based on photonic crystal fibres and wavelength modulation spectroscopy. J. Sens. 2009, 2009, 398403. [Google Scholar] [CrossRef]
- Jin, W.; Cao, Y.; Yang, F.; Ho, H.L. Ultra-sensitive all-fibre photothermal spectroscopy with large dynamic range. Nat. Commun. 2015, 6, 6767. [Google Scholar] [CrossRef]
- Hoo, Y.L.; Liu, S.; Ho, H.L.; Jin, W. Fast response microstructured optical fiber methane sensor with multiple side-openings. IEEE Photonics Technol. Lett. 2010, 22, 296–298. [Google Scholar] [CrossRef]
- Yang, F.; Jin, W.; Lin, Y.; Wang, C.; Lut, H.; Tan, Y. Hollow-core microstructured optical fiber gas sensors. J. Light. Technol. 2017, 35, 3413–3424. [Google Scholar] [CrossRef]
- Yang, F.; Jin, W.; Cao, Y.; Ho, H.L.; Wang, Y. Towards high sensitivity gas detection with hollow-core photonic bandgap fibers. Opt. Express 2014, 22, 24894–24907. [Google Scholar] [CrossRef] [PubMed]
- Lin, Y.; Jin, W.; Yang, F.; Ma, J.; Wang, C.; Ho, H.L.; Liu, Y. Pulsed photothermal interferometry for spectroscopic gas detection with hollow-core optical fibre. Sci. Rep. 2016, 6, 39410. [Google Scholar] [CrossRef] [PubMed]
- He, Q.; Dang, P.; Liu, Z.; Zheng, C.; Wang, Y. TDLAS–WMS based near-infrared methane sensor system using hollow-core photonic crystal fiber as gas-chamber. Opt. Quantum Electron. 2017, 49, 115. [Google Scholar] [CrossRef]
- Shephard, J.D.; MacPherson, W.N.; Maier, R.R.J.; Jones, J.D.C.; Hand, D.P.; Mohebbi, M.; George, A.K.; Roberts, P.J.; Knight, J.C. Single-mode mid-IR guidance in a hollow-core photonic crystal fiber. Opt. Express 2005, 13, 7139–7144. [Google Scholar] [CrossRef]
- Gayraud, N.; Kornaszewski, Ł.W.; Stone, J.M.; Knight, J.C.; Reid, D.T.; Hand, D.P.; MacPherson, W.N. Mid-infrared gas sensing using a photonic bandgap fiber. Appl. Opt. 2008, 47, 1269. [Google Scholar] [CrossRef]
- Petrovich, M.N.; Wheeler, N.V.; Heidt, A.M.; Baddela, N.K.; Reza Sandoghchi, S.; Chen, Y.; Poletti, F.; Richardson, D.J. High sensitivity gas detection using hollow core photonic bandgap fibres designed for mid-ir operation. In Proceedings of the SENSORS, Valencia, Spain, 2–5 November 2014; pp. 891–894. [Google Scholar]
- Triches, M.; Michieletto, M.; Hald, J.; Lyngsø, J.K.; Lægsgaard, J.; Bang, O. Optical frequency standard using acetylene-filled hollow-core photonic crystal fibers. Opt. Express 2015, 23, 11227–11241. [Google Scholar] [CrossRef]
- Triches, M.; Brusch, A.; Hald, J. Portable optical frequency standard based on sealed gas-filled hollow-core fiber using a novel encapsulation technique. Appl. Phys. B 2015, 121, 251–258. [Google Scholar] [CrossRef]
- Austin, E.; van Brakel, A.; Petrovich, M.N.; Richardson, D.J. Fibre optical sensor for C2H2 gas using gas-filled photonic bandgap fibre reference cell. Sens. Actuators B Chem. 2009, 139, 30–34. [Google Scholar] [CrossRef]
- Thapa, R.; Knabe, K.; Corwin, K.L.; Washburn, B.R. Arc fusion splicing of hollow-core photonic bandgap fibers for gas-filled fiber cells. Opt. Express 2006, 14, 9576–9583. [Google Scholar] [CrossRef]
- Benabid, F.; Couny, F.; Knight, J.C.; Birks, T.A.; Russell, P.S.J. Compact, stable and efficient all-fibre gas cells using hollow-core photonic crystal fibres. Nature 2005, 434, 488–491. [Google Scholar] [CrossRef] [PubMed]
- Westergaard, P.G.; Thomsen, J.W.; Henriksen, M.R.; Michieletto, M.; Triches, M.; Hald, J.K.L.J. Compact, CO2-stabilized tuneable laser at 2.05 microns. Opt. Express 2016, 24, 4872–4880. [Google Scholar] [CrossRef] [PubMed]
- Benabid, F.; Knight, J.C.; Antonopoulos, G.; Russell, P.S.J. Stimulated raman scattering in hydrogen-filled hollow-core photonic crystal fiber. Science 2002, 298, 399–402. [Google Scholar] [CrossRef] [PubMed]
- Debord, B.; Amrani, F.; Vincetti, L.; Gérôme, F.; Benabid, F. Hollow-core fiber technology: The RIsing of “gas photonics”. Fibers 2019, 7, 16. [Google Scholar] [CrossRef]
- Wei, C.; Weiblen, R.J.; Menyuk, C.R.; Hu, J. Negative curvature fibers. Adv. Opt. Photon. 2017, 9, 504–561. [Google Scholar] [CrossRef]
- Wang, Y.Y.; Couny, F.; Roberts, P.J.; Benabid, F. Low loss broadband transmission in optimized core-shape Kagome Hollow-Core PCF. Opt. Soc. of Am. 2010. [Google Scholar] [CrossRef]
- Pryamikov, A.D.; Biriukov, A.S.; Kosolapov, A.F.; Plotnichenko, V.G.; Semjonov, S.L.; Dianov, E.M. Demonstration of a waveguide regime for a silica hollow core microstructured optical fiber with a negative curvature of the core boundary in the spectral region > 35 μm. Opt. Express 2011, 19, 1441. [Google Scholar] [CrossRef]
- Jaworski, P.; Kozioł, P.; Krzempek, K.; Wu, D.; Yu, F.; Bojęś, P.; Dudzik, G.; Liao, M.; Abramski, K.; Knight, J. Antiresonant hollow-core fiber-based dual gas sensor for detection of methane and carbon dioxide in the near- and mid-infrared regions. Sensors 2020, 20, 3813. [Google Scholar] [CrossRef]
- Yao, C.; Wang, Q.; Lin, Y.; Jin, W.; Xiao, L.; Gao, S.; Wang, Y.; Wang, P.; Ren, W. Photothermal CO detection in a hollow-core negative curvature fiber. Opt. Lett. 2019, 44, 4048–4051. [Google Scholar] [CrossRef]
- Nikodem, M.; Gomółka, G.; Klimczak, M.; Pysz, D.; Buczyński, R. Demonstration of mid-infrared gas sensing using an anti-resonant hollow core fiber and a quantum cascade laser. Opt. Express 2019, 27, 36350–36357. [Google Scholar] [CrossRef]
- Partridge, M.; Curtis, R.; Khodabandehloo, K.; Chen, Y.; Bradley, T.; Wheeler, N.; Hayes, J.R.; Davidson, I.A.; Sandoghchi, S.R.; Petrovich, M.N.; et al. Gas flow within Hollow Core optical fibers. In Proceedings of the Conference on Lasers and Electro-Optics, San Jose, CA, USA, 5–10 May 2019; p. STh1L.2. [Google Scholar]
- Challener, W.A.; Choudhury, N.; Karp, J.; Kasten, A.M.; Palit, S.; Pickrell, G.; Homa, D.; Floyd, A.; Cheng, Y.; Yu, F. Gas sensing with hollow core fiber for leak detection and localization. In Proceedings of the Conference on Lasers and Electro-Optics, San Jose, CA, USA, 5–10 June 2016; p. AW1J.1. [Google Scholar]
- Nikodem, M.; Krzempek, K.; Dudzik, G.; Abramski, K. Hollow core fiber-assisted absorption spectroscopy of methane at 3.4 µm. Opt. Express 2018, 26, 21843. [Google Scholar] [CrossRef] [PubMed]
- Krzempek, K.; Abramski, K.; Nikodem, M. Kagome Hollow Core Fiber-based mid-infrared dispersion spectroscopy of methane at sub-ppm levels. Sensors 2019, 19, 3352. [Google Scholar] [CrossRef] [PubMed]
- Yao, C.; Xiao, L.; Gao, S.; Wang, Y.; Wang, P.; Kan, R.; Jin, W.; Ren, W. Sub-ppm CO detection in a sub-meter-long hollow-core negative curvature fiber using absorption spectroscopy at 2.3 μm. Sens. Actuators B Chem. 2020, 303, 127238. [Google Scholar] [CrossRef]
- Yao, C.; Gao, S.; Wang, Y.; Wang, P.; Jin, W.; Ren, W. Silica hollow-core negative curvature fibers enable ultrasensitive mid-infrared absorption spectroscopy. J. Light. Technol. 2020, 38, 2067–2072. [Google Scholar] [CrossRef]
- Zhao, P.; Zhao, Y.; Bao, H.; Ho, H.L.; Jin, W.; Fan, S.; Gao, S.; Wang, Y.; Wang, P. Mode-phase-difference photothermal spectroscopy for gas detection with an anti-resonant hollow-core optical fiber. Nat. Commun. 2020, 11, 847. [Google Scholar] [CrossRef]
- Bao, H.; Hong, Y.; Jin, W.; Ho, H.L.; Wang, C.; Gao, S.; Wang, Y.; Wang, P. Modeling and performance evaluation of in-line Fabry-Perot photothermal gas sensors with hollow-core optical fibers. Opt. Express 2020, 28, 5423–5435. [Google Scholar] [CrossRef]
- Klimczak, M.; Dobrakowski, D.; Ghosh, A.N.; Stępniewski, G.; Pysz, D.; Huss, G.; Sylvestre, T.; Buczyński, R. Nested capillary anti-resonant silica fiber with mid-infrared transmission and low bending sensitivity at 4000 nm. Opt. Lett. 2019, 44, 4395–4398. [Google Scholar] [CrossRef]
- Belardi, W.; Sazio, P.J. Borosilicate Based Hollow-Core Optical Fibers. Fibers 2019, 7, 73. [Google Scholar] [CrossRef]
- Tong, H.T.; Nishiharaguchi, N.; Suzuki, T.; Ohishi, Y. Mid-infrared transmission by a tellurite hollow core optical fiber. Opt. Express 2019, 27, 30576–30588. [Google Scholar] [CrossRef]
- Kosolapov, A.F.; Pryamikov, A.D.; Biriukov, A.S.; Shiryaev, V.S.; Astapovich, M.S.; Snopatin, G.E.; Plotnichenko, V.G.; Churbanov, M.F.; Dianov, E.M. Demonstration of CO2-laser power delivery through chalcogenide-glass fiber with negative-curvature hollow core. Opt. Express 2011, 19, 25723–25728. [Google Scholar] [CrossRef]
- Wei, C.; Menyuk, C.R.; Hu, J. Geometry of chalcogenide negative curvature fibers for CO2 laser transmission. Fibers 2018, 6, 74. [Google Scholar] [CrossRef]
- Gattass, R.R.; Rhonehouse, D.; Gibson, D.; McClain, C.C.; Thapa, R.; Nguyen, V.Q.; Bayya, S.S.; Weiblen, R.J.; Menyuk, C.R.; Shaw, L.B.; et al. Infrared glass-based negative-curvature anti-resonant fibers fabricated through extrusion. Opt. Express 2016, 24, 25697–25703. [Google Scholar] [CrossRef] [PubMed]
- Jaworski, P.; Krzempek, K.; Dudzik, G.; Sazio, P.; Belardi, W. Nitrous oxide detection at 5.26 μm with a compound glass antiresonant hollow-core optical fiber. Opt. Lett. 2020, 45, 1326–1329. [Google Scholar] [CrossRef] [PubMed]
- Knabe, K.; Wu, S.; Lim, J.; Tillman, K.A.; Light, P.S.; Couny, F.; Wheeler, N.; Thapa, R.; Jones, A.M.; Nicholson, J.W.; et al. 10 kHz accuracy of an optical frequency reference based on 12C2H2-filled large-core kagome photonic crystal fibers. Opt. Express 2009, 17, 16017–16026. [Google Scholar] [CrossRef]
- Curtis, E.A.; Bradley, T.; Barwood, G.P.; Edwards, C.S.; Wheeler, N.V.; Phelan, R.; Richardson, D.J.; Petrovich, M.N.; Gill, P. Laser frequency stabilization and spectroscopy at 2051 nm using a compact CO2-filled Kagome hollow core fiber gas-cell system. Opt. Express 2018, 26, 28621–28633. [Google Scholar] [CrossRef]
- Wu, S.; Wang, C.; Fourcade-Dutin, C.; Washburn, B.R.; Benabid, F.; Corwin, K.L. Direct fiber comb stabilization to a gas-filled hollow-core photonic crystal fiber. Opt. Express 2014, 22, 23704–23715. [Google Scholar] [CrossRef] [PubMed]
- Ge, A.; Meng, F.; Li, Y.; Liu, B.; Hu, M. Higher-order mode suppression in antiresonant nodeless hollow-core fibers. Micromachines 2019, 10, 128. [Google Scholar] [CrossRef]


| Reference | Fiber Length (m) | Approximate Diffusion Time (minutes) | Core Diameter (µm) | Sample Gas |
|---|---|---|---|---|
| [35] | 5.1 | 7 | 12 | CH4 |
| [38] | 0.55 | 4 | − 1 | H2S |
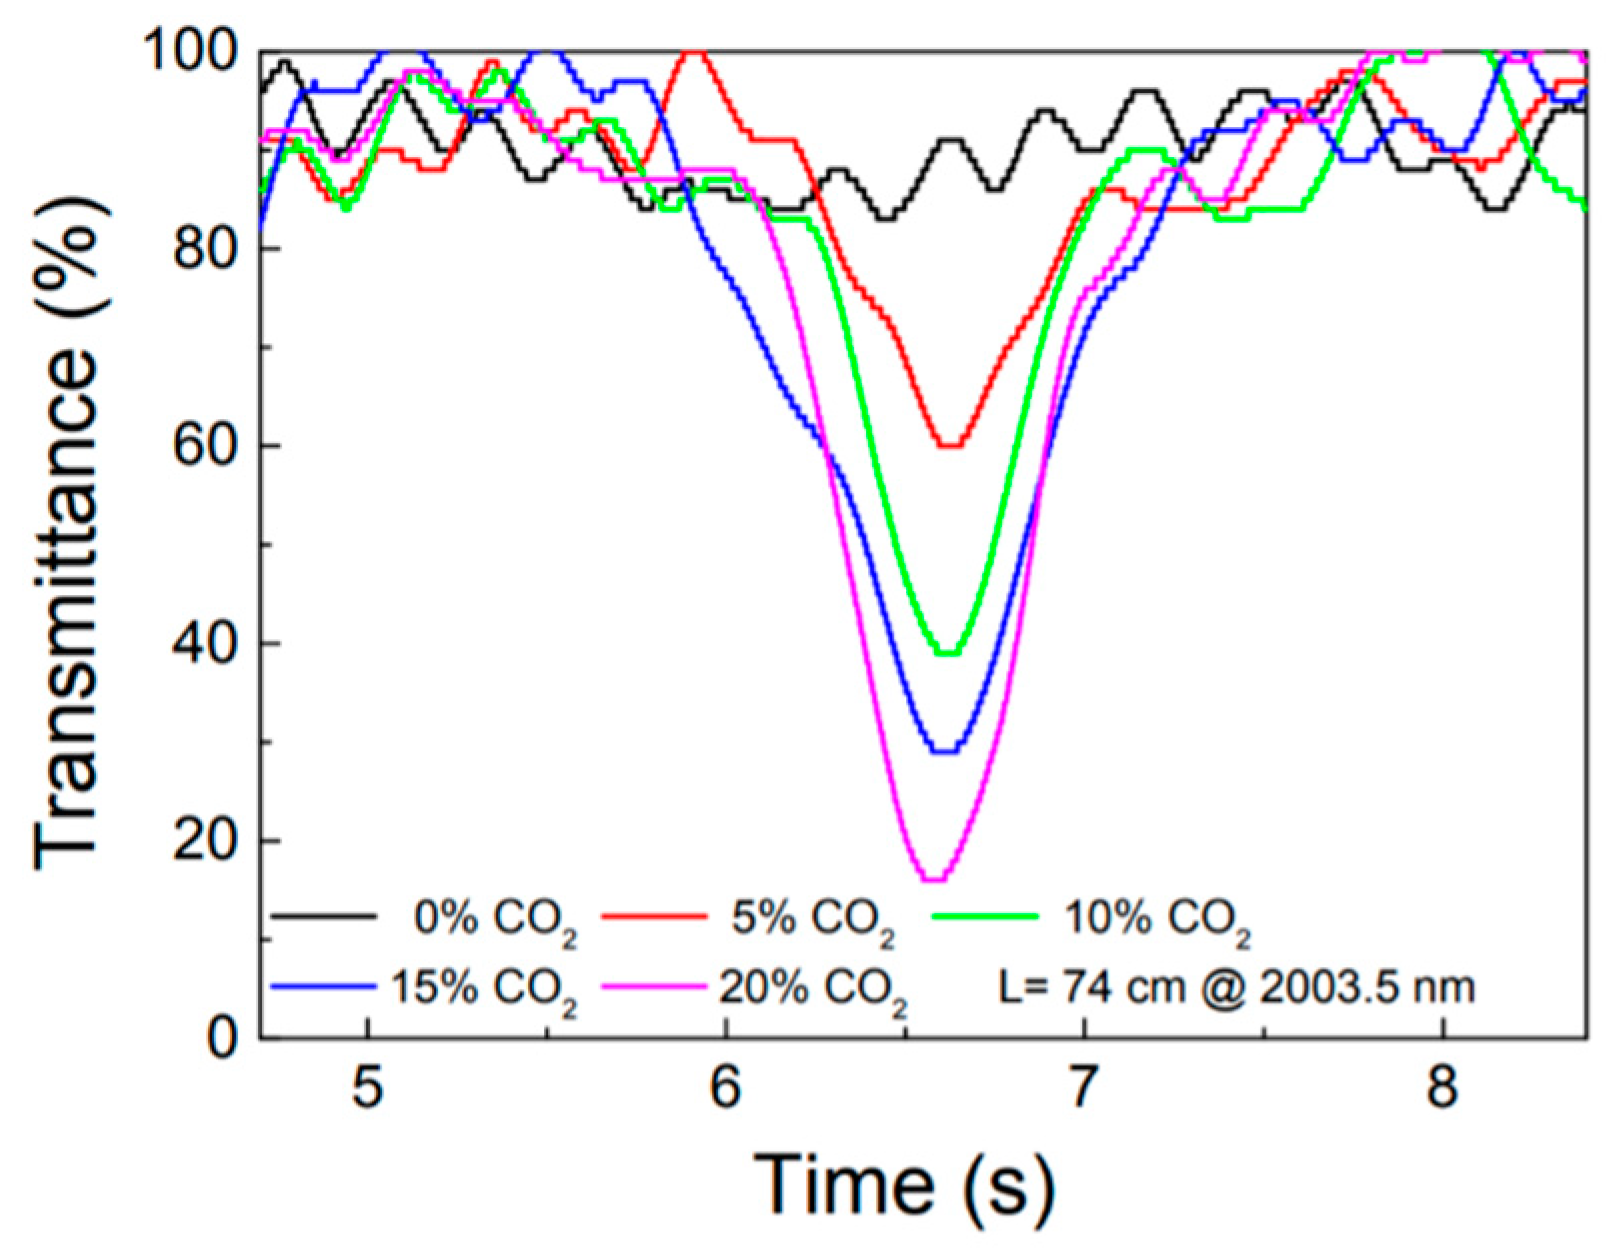
| [39] | 0.74 | 10 | 14.5 | CO2 |
| [40] | 1 | 20 | 10.5 | CO2 |
| [40] | 20 | 90 | 10.5 | CO2 |
| [41] | 0.3 | 60 | 10 | CH4 |
| [42] | 0.45 | 80 | 10 | CH4 |
| Advantages | Drawbacks |
|---|---|
| • Commercially available with lengths beyond tens of meters | • Very long filling times |
| • Can be easily spliced with other silica-based fibers using standard fusion splicers | • Optical fringes usually visible in the background |
| • Low losses | • Expensive |
| Ref. | Fiber Length | Diffusion Time (s) | λ (µm) | Target Molecule | Detection Technique | Detection Limit |
|---|---|---|---|---|---|---|
| [11] | 1.35 m | 5 | 2 | CO2 | WMS | 5 ppm in 1 s |
| [65] | 1 m | 19 | 1.57 and 3.33 | CO2 and CH4 | WMS | 63 ppb (CH4) and 153 ppm (CO2) in 1 s |
| [66,72] | 85 cm | 5 [72] | 2.3 | CO | TDLAS, WMS, PTI | 0.4 ppm in 30 s [72] |
| [67] | 3.2 m | 23 | 4.53 | N2O | TDLAS, WMS | 5.4 ppb in 1 s |
| [70,71] | 1.3 m | <10 | 3.33 | CH4 | WMS, CLaDS | 500 ppb in 1 s [71] |
| [73] | 1.2 m | not specified | 3.6 | N2O | TDLAS | 35 ppm (TDLAS) |
| [74] | 74 cm | 44 1 | 1.53 | C2H2 | PTI | 15 ppt in 100 s 2 |
| [82] | 1.15 m | 9 | 5.26 | NO | TDLAS, WMS | 30 ppb in 1 s |
© 2020 by the author. Licensee MDPI, Basel, Switzerland. This article is an open access article distributed under the terms and conditions of the Creative Commons Attribution (CC BY) license (http://creativecommons.org/licenses/by/4.0/).
Share and Cite
Nikodem, M. Laser-Based Trace Gas Detection inside Hollow-Core Fibers: A Review. Materials 2020, 13, 3983. https://doi.org/10.3390/ma13183983
Nikodem M. Laser-Based Trace Gas Detection inside Hollow-Core Fibers: A Review. Materials. 2020; 13(18):3983. https://doi.org/10.3390/ma13183983
Chicago/Turabian StyleNikodem, Michal. 2020. "Laser-Based Trace Gas Detection inside Hollow-Core Fibers: A Review" Materials 13, no. 18: 3983. https://doi.org/10.3390/ma13183983
APA StyleNikodem, M. (2020). Laser-Based Trace Gas Detection inside Hollow-Core Fibers: A Review. Materials, 13(18), 3983. https://doi.org/10.3390/ma13183983