Effects of Normal Force on the Tribocorrosion Behavior of a Nickel-Based Superalloy in Alkaline Solution: An Electrochemical Study


Abstract
1. Introduction
2. Materials and Methods
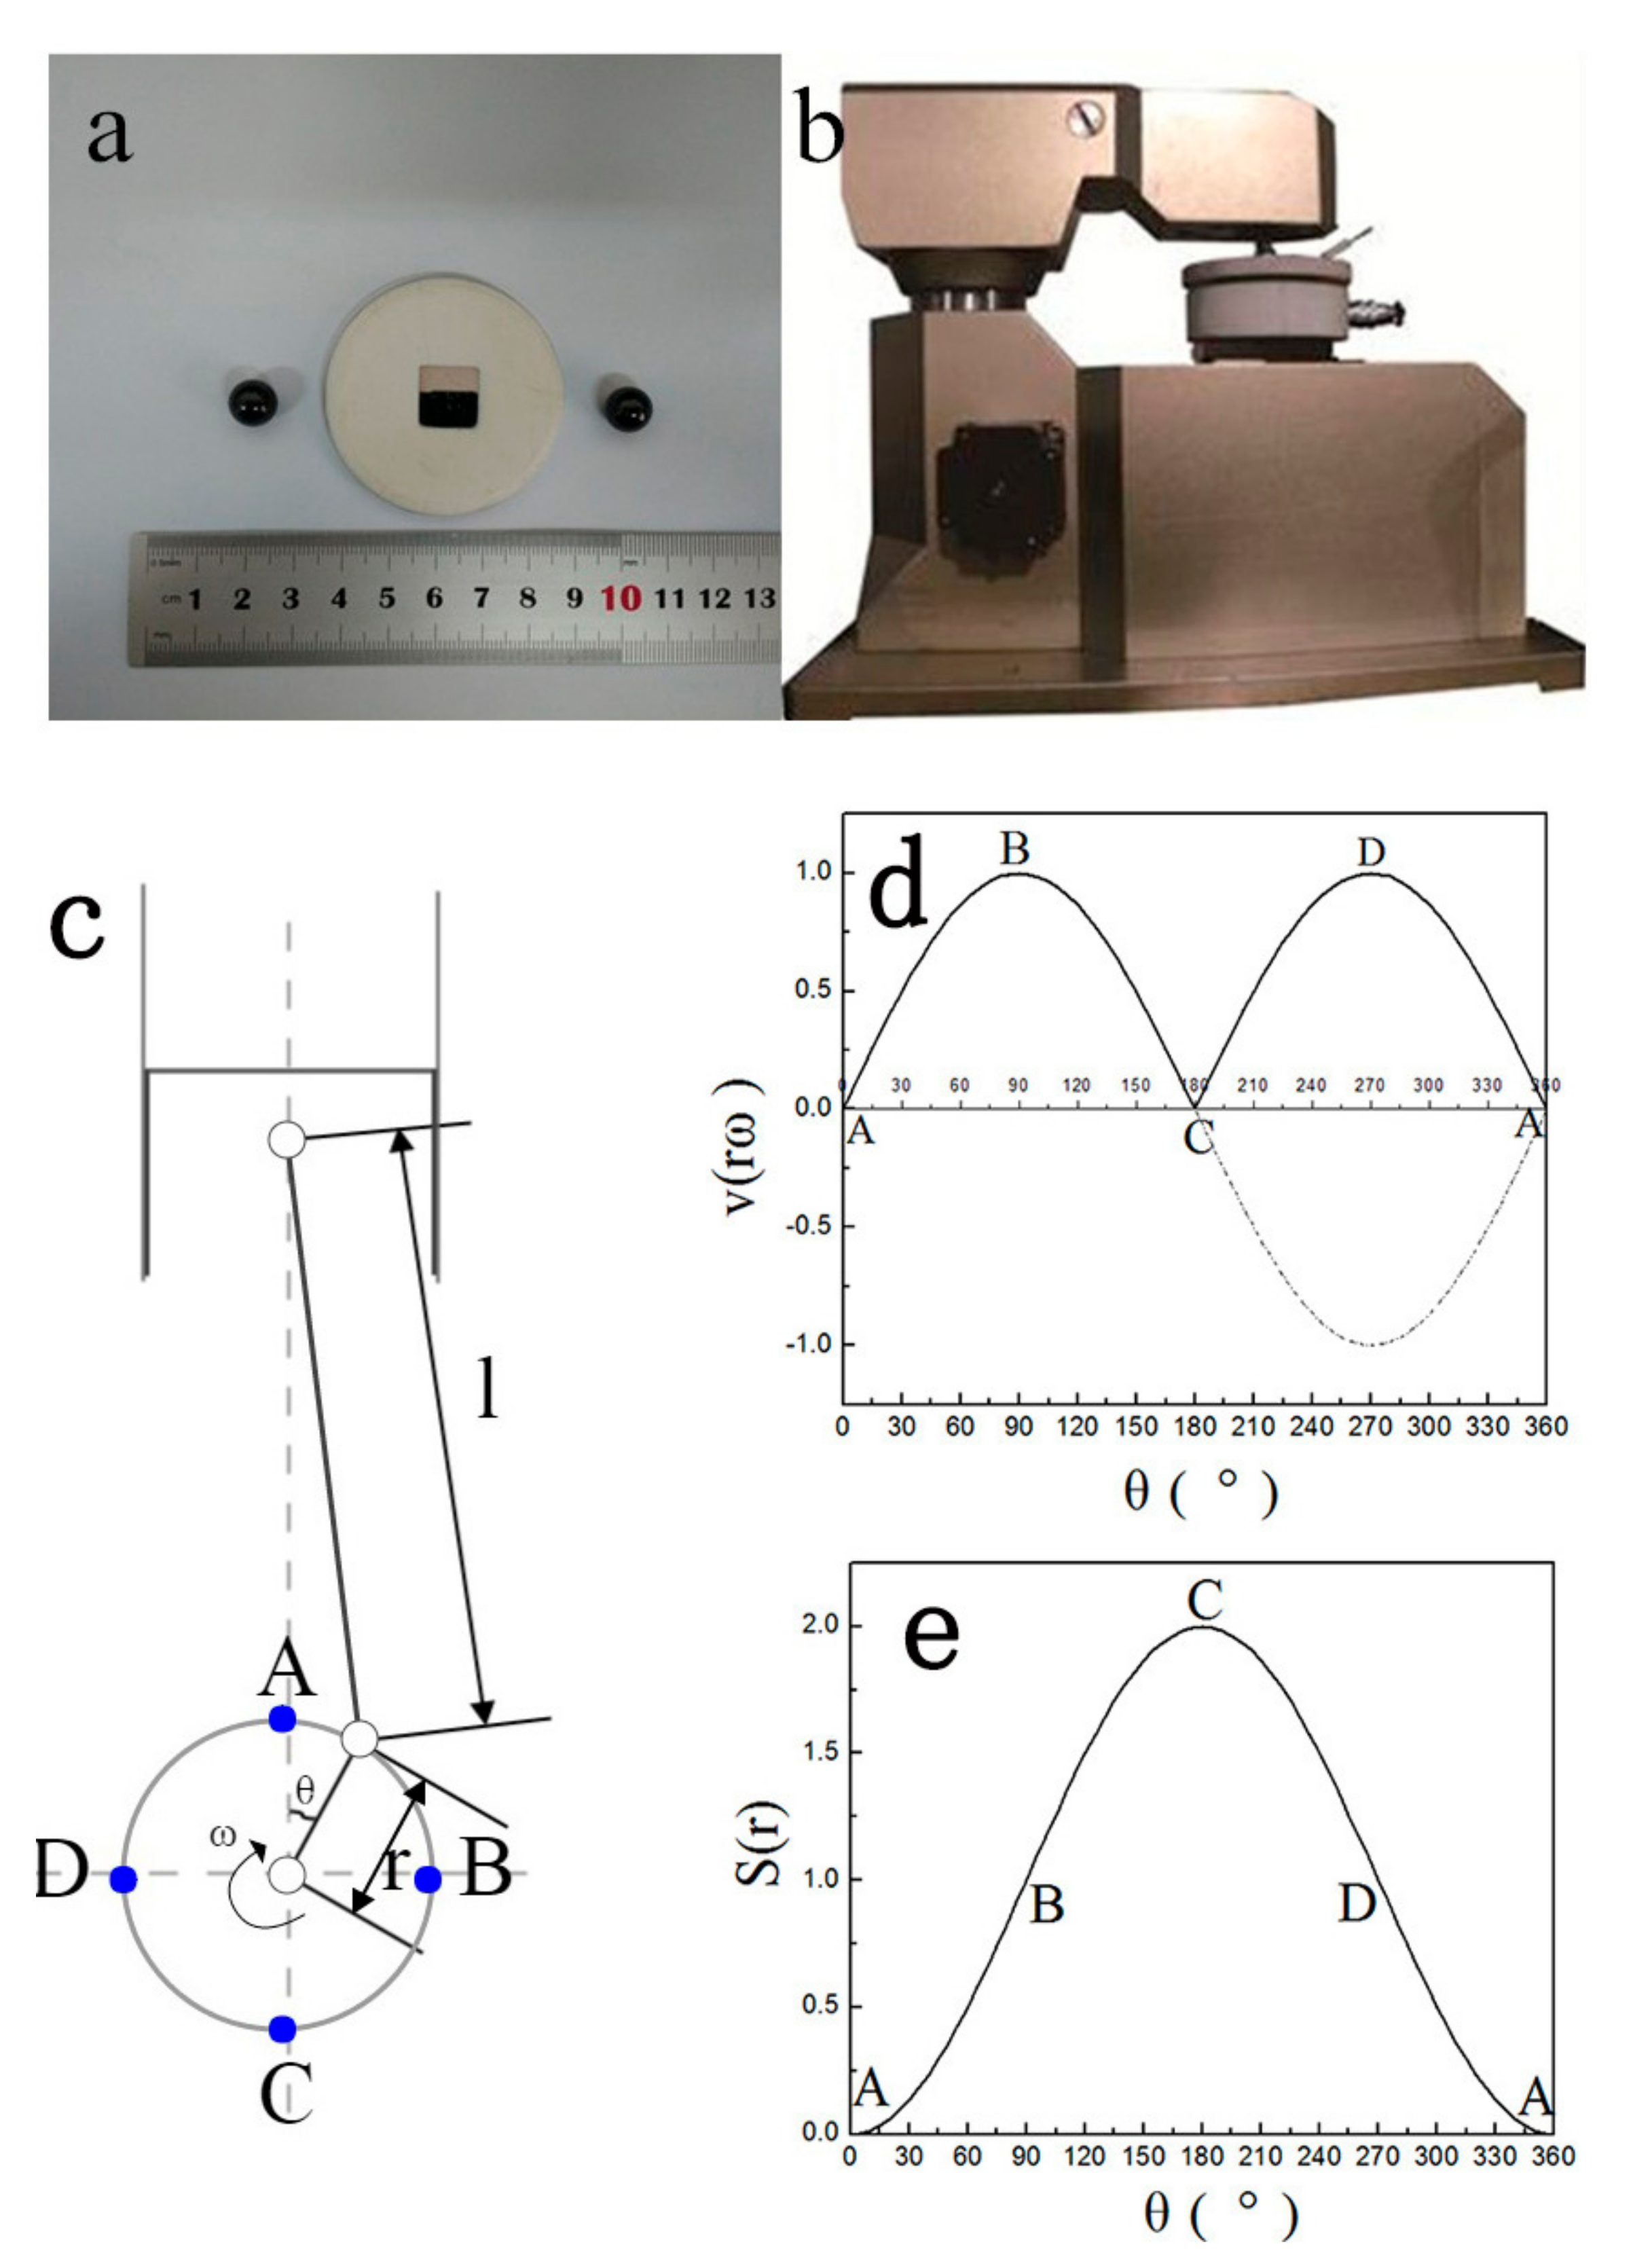
- (1)
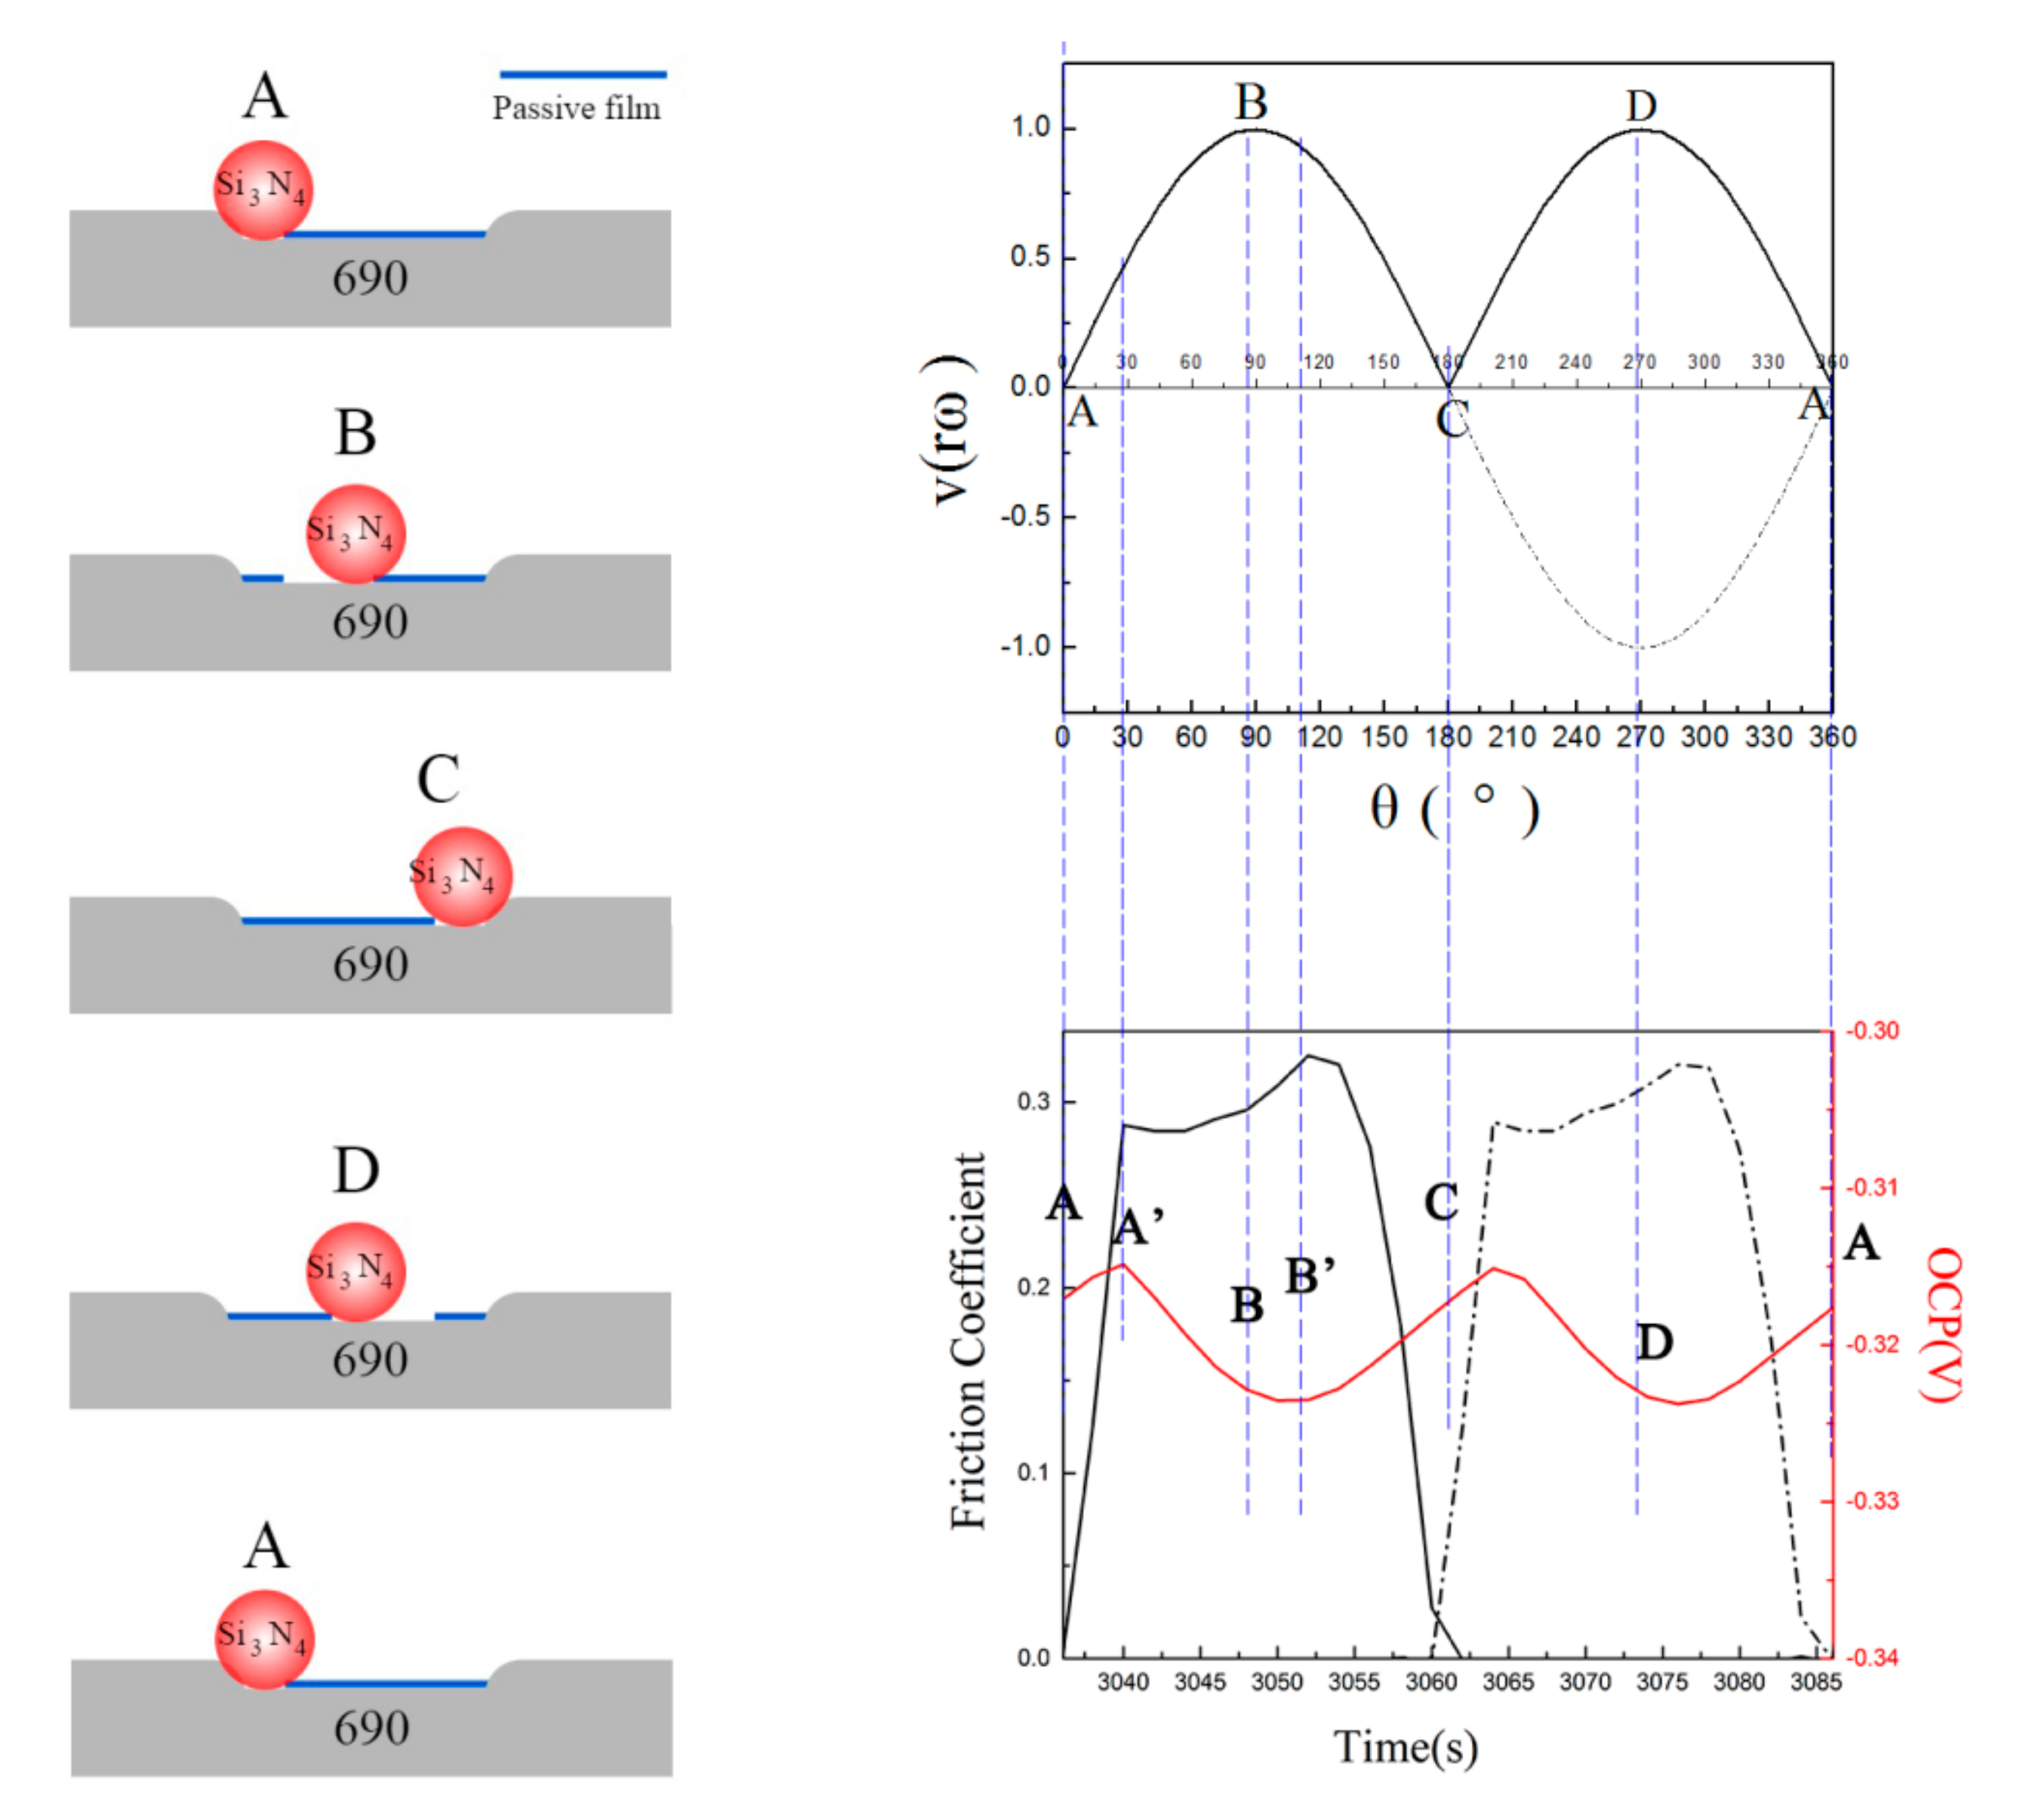
- when the crank starts rotating from point A, both the velocity and stroke values of piston are zero;
- (2)
- when the crank rotates to point B, the stroke value becomes half of the maximum, which means the ball is at the middle way of the scratch, the velocity value of piston comes to the maximum;
- (3)
- when the crank rotates to point C, the stroke value of piston comes to the maximum, while the velocity value becomes zero, the ball is at the other endpoint of the scratch, and the piston starts to move to the opposite direction;
- (4)
- when the crank rotates to point D, the condition is the same to that at point B;
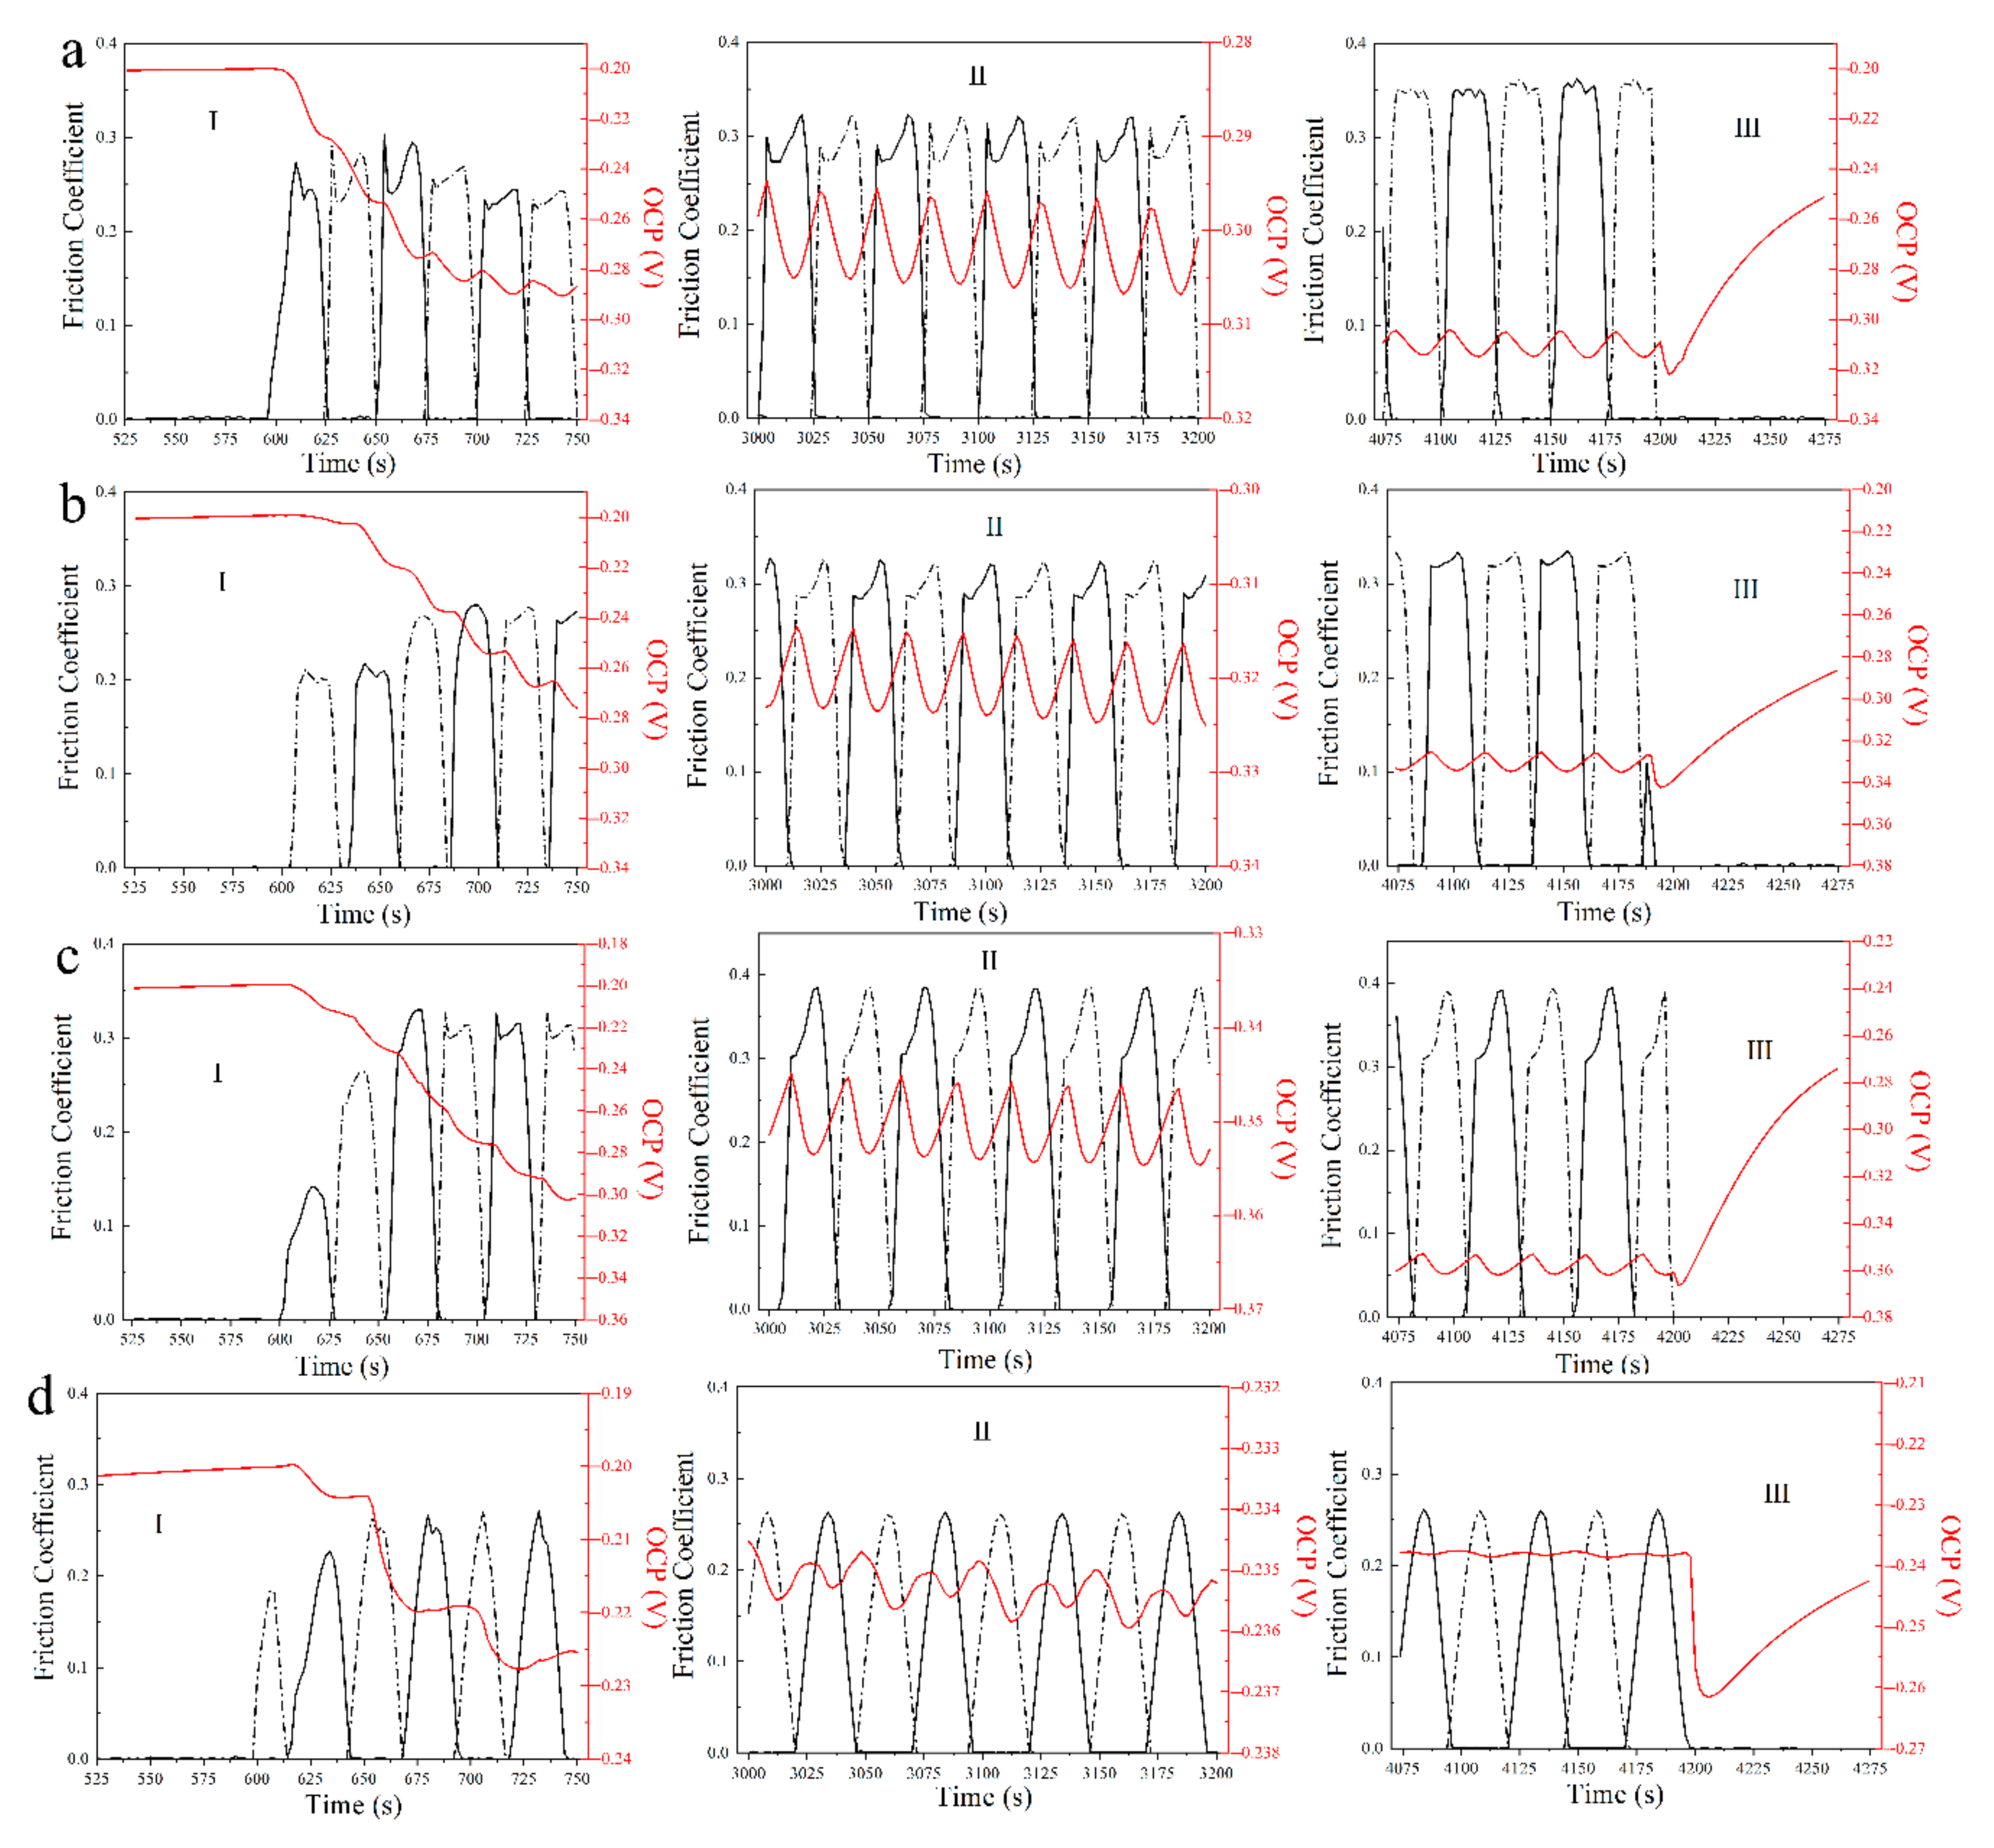
3. Results
4. Discussion
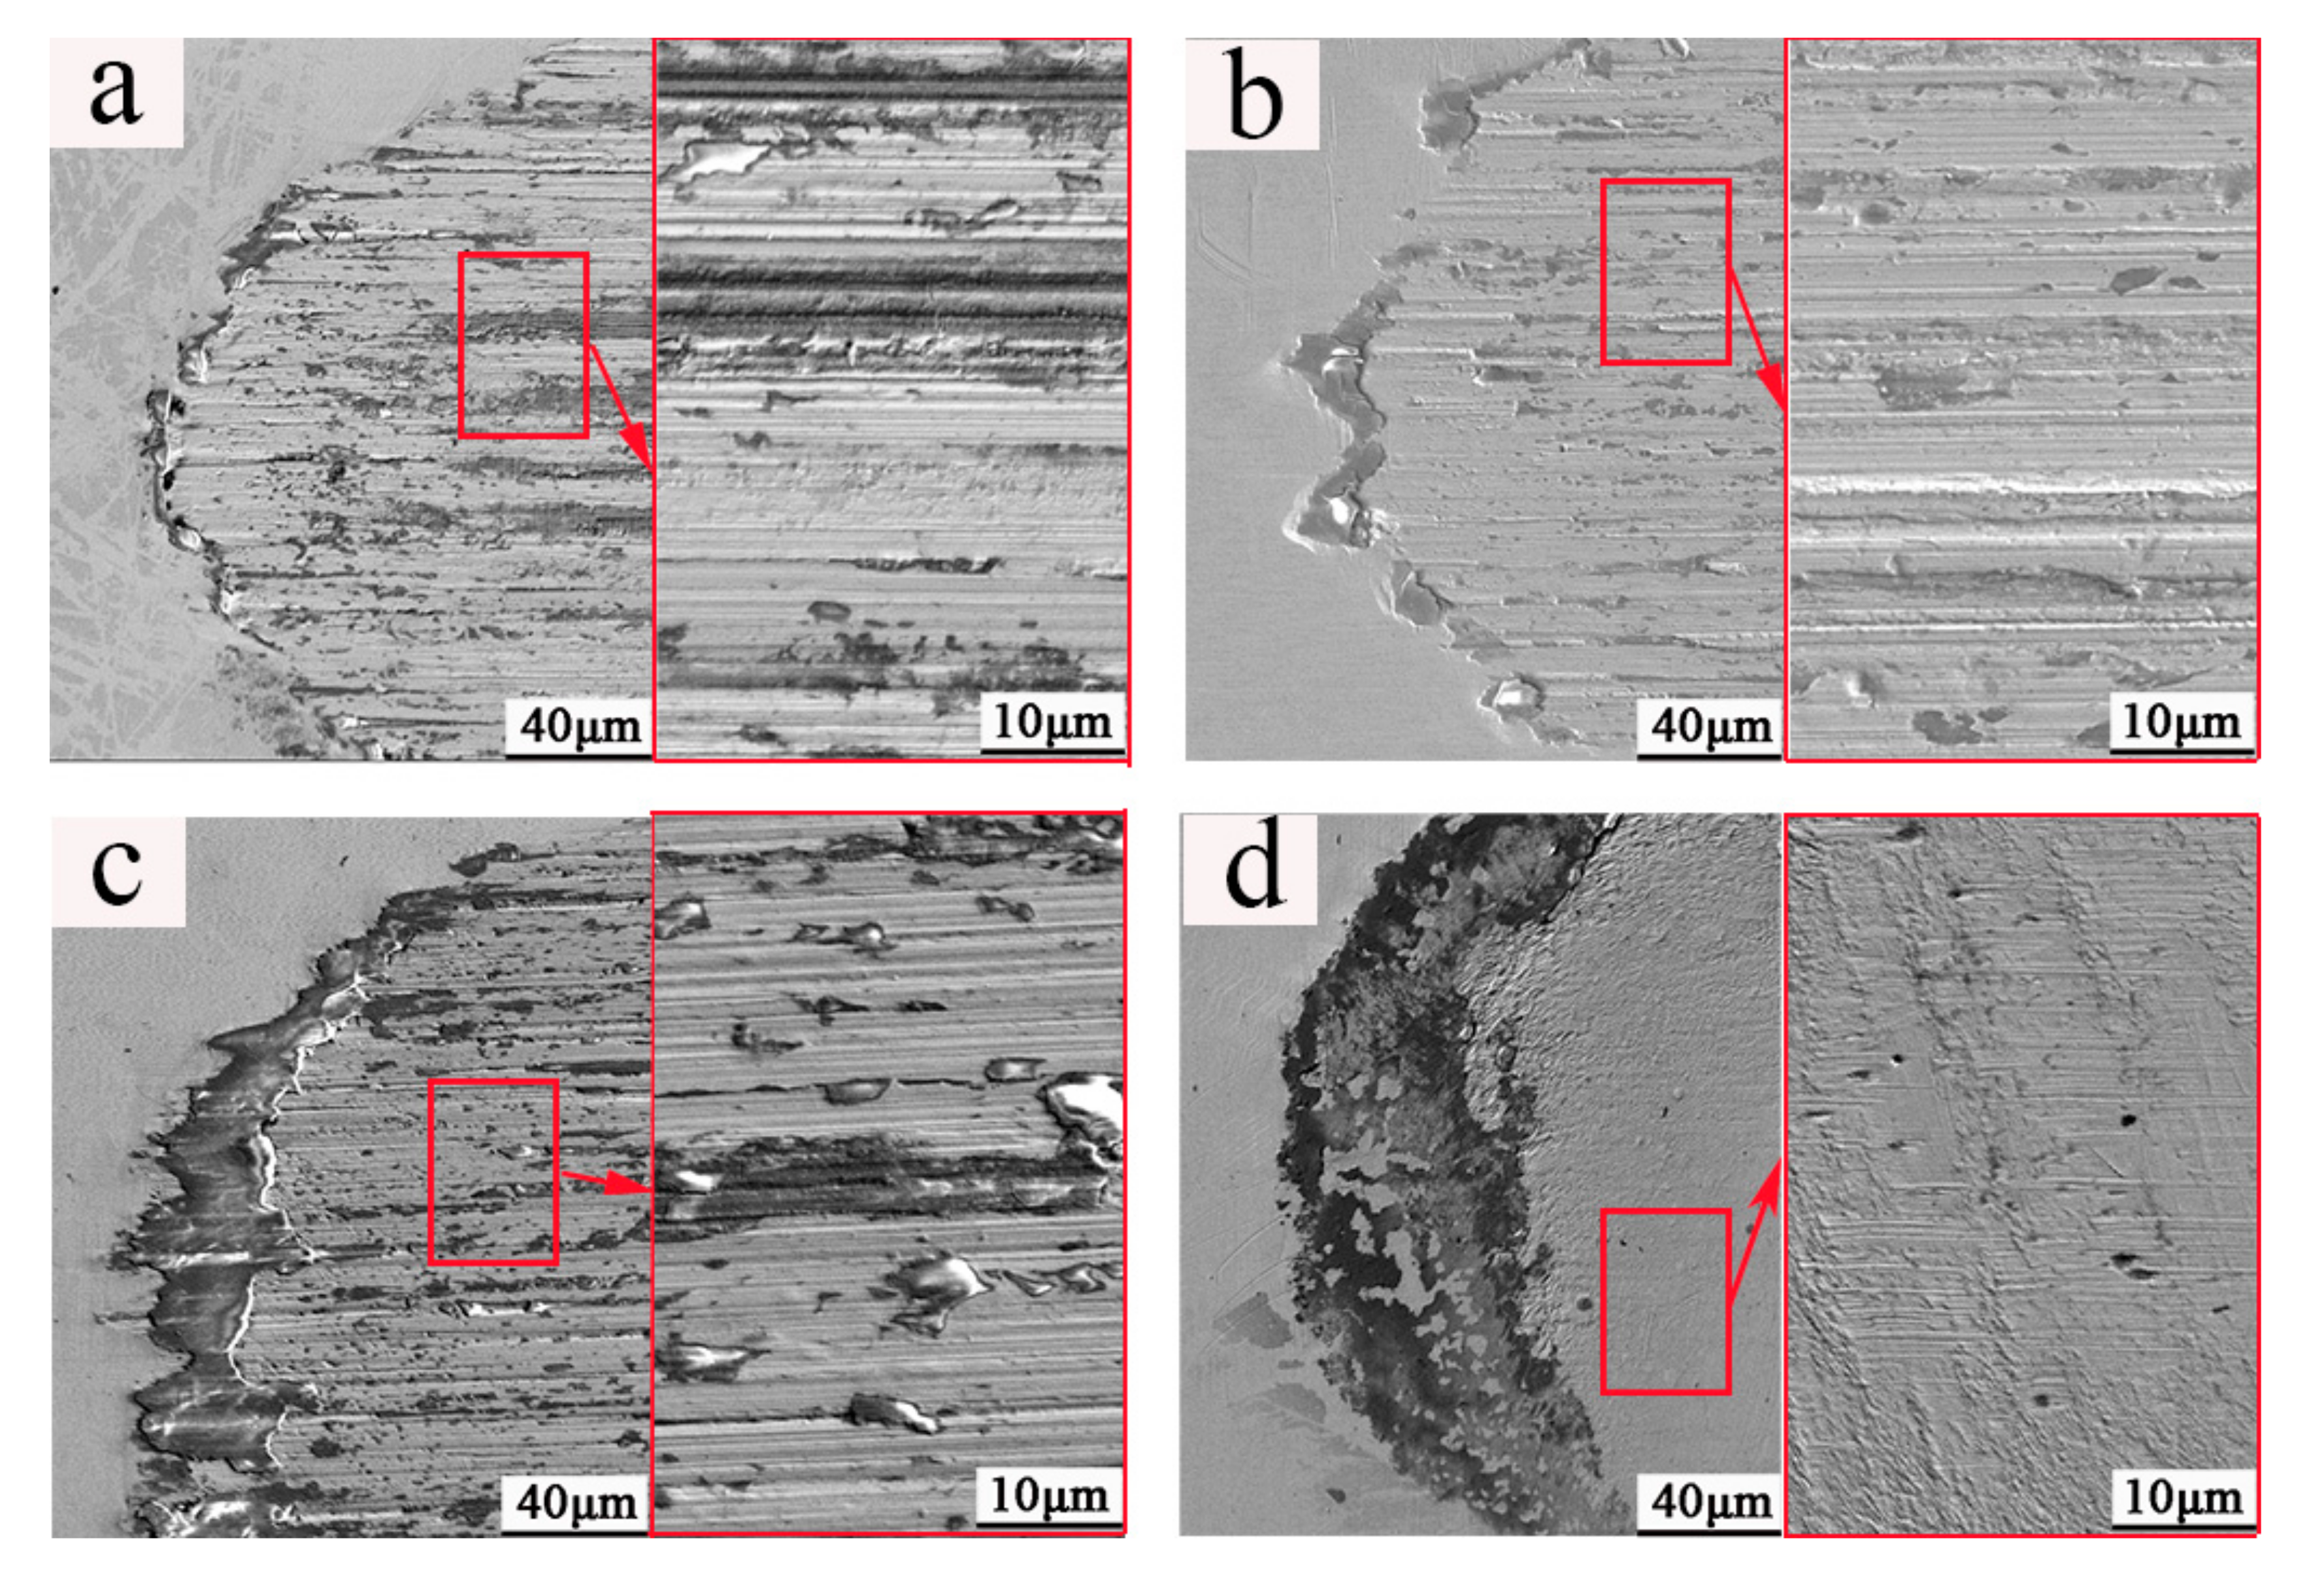
4.1. Surface State
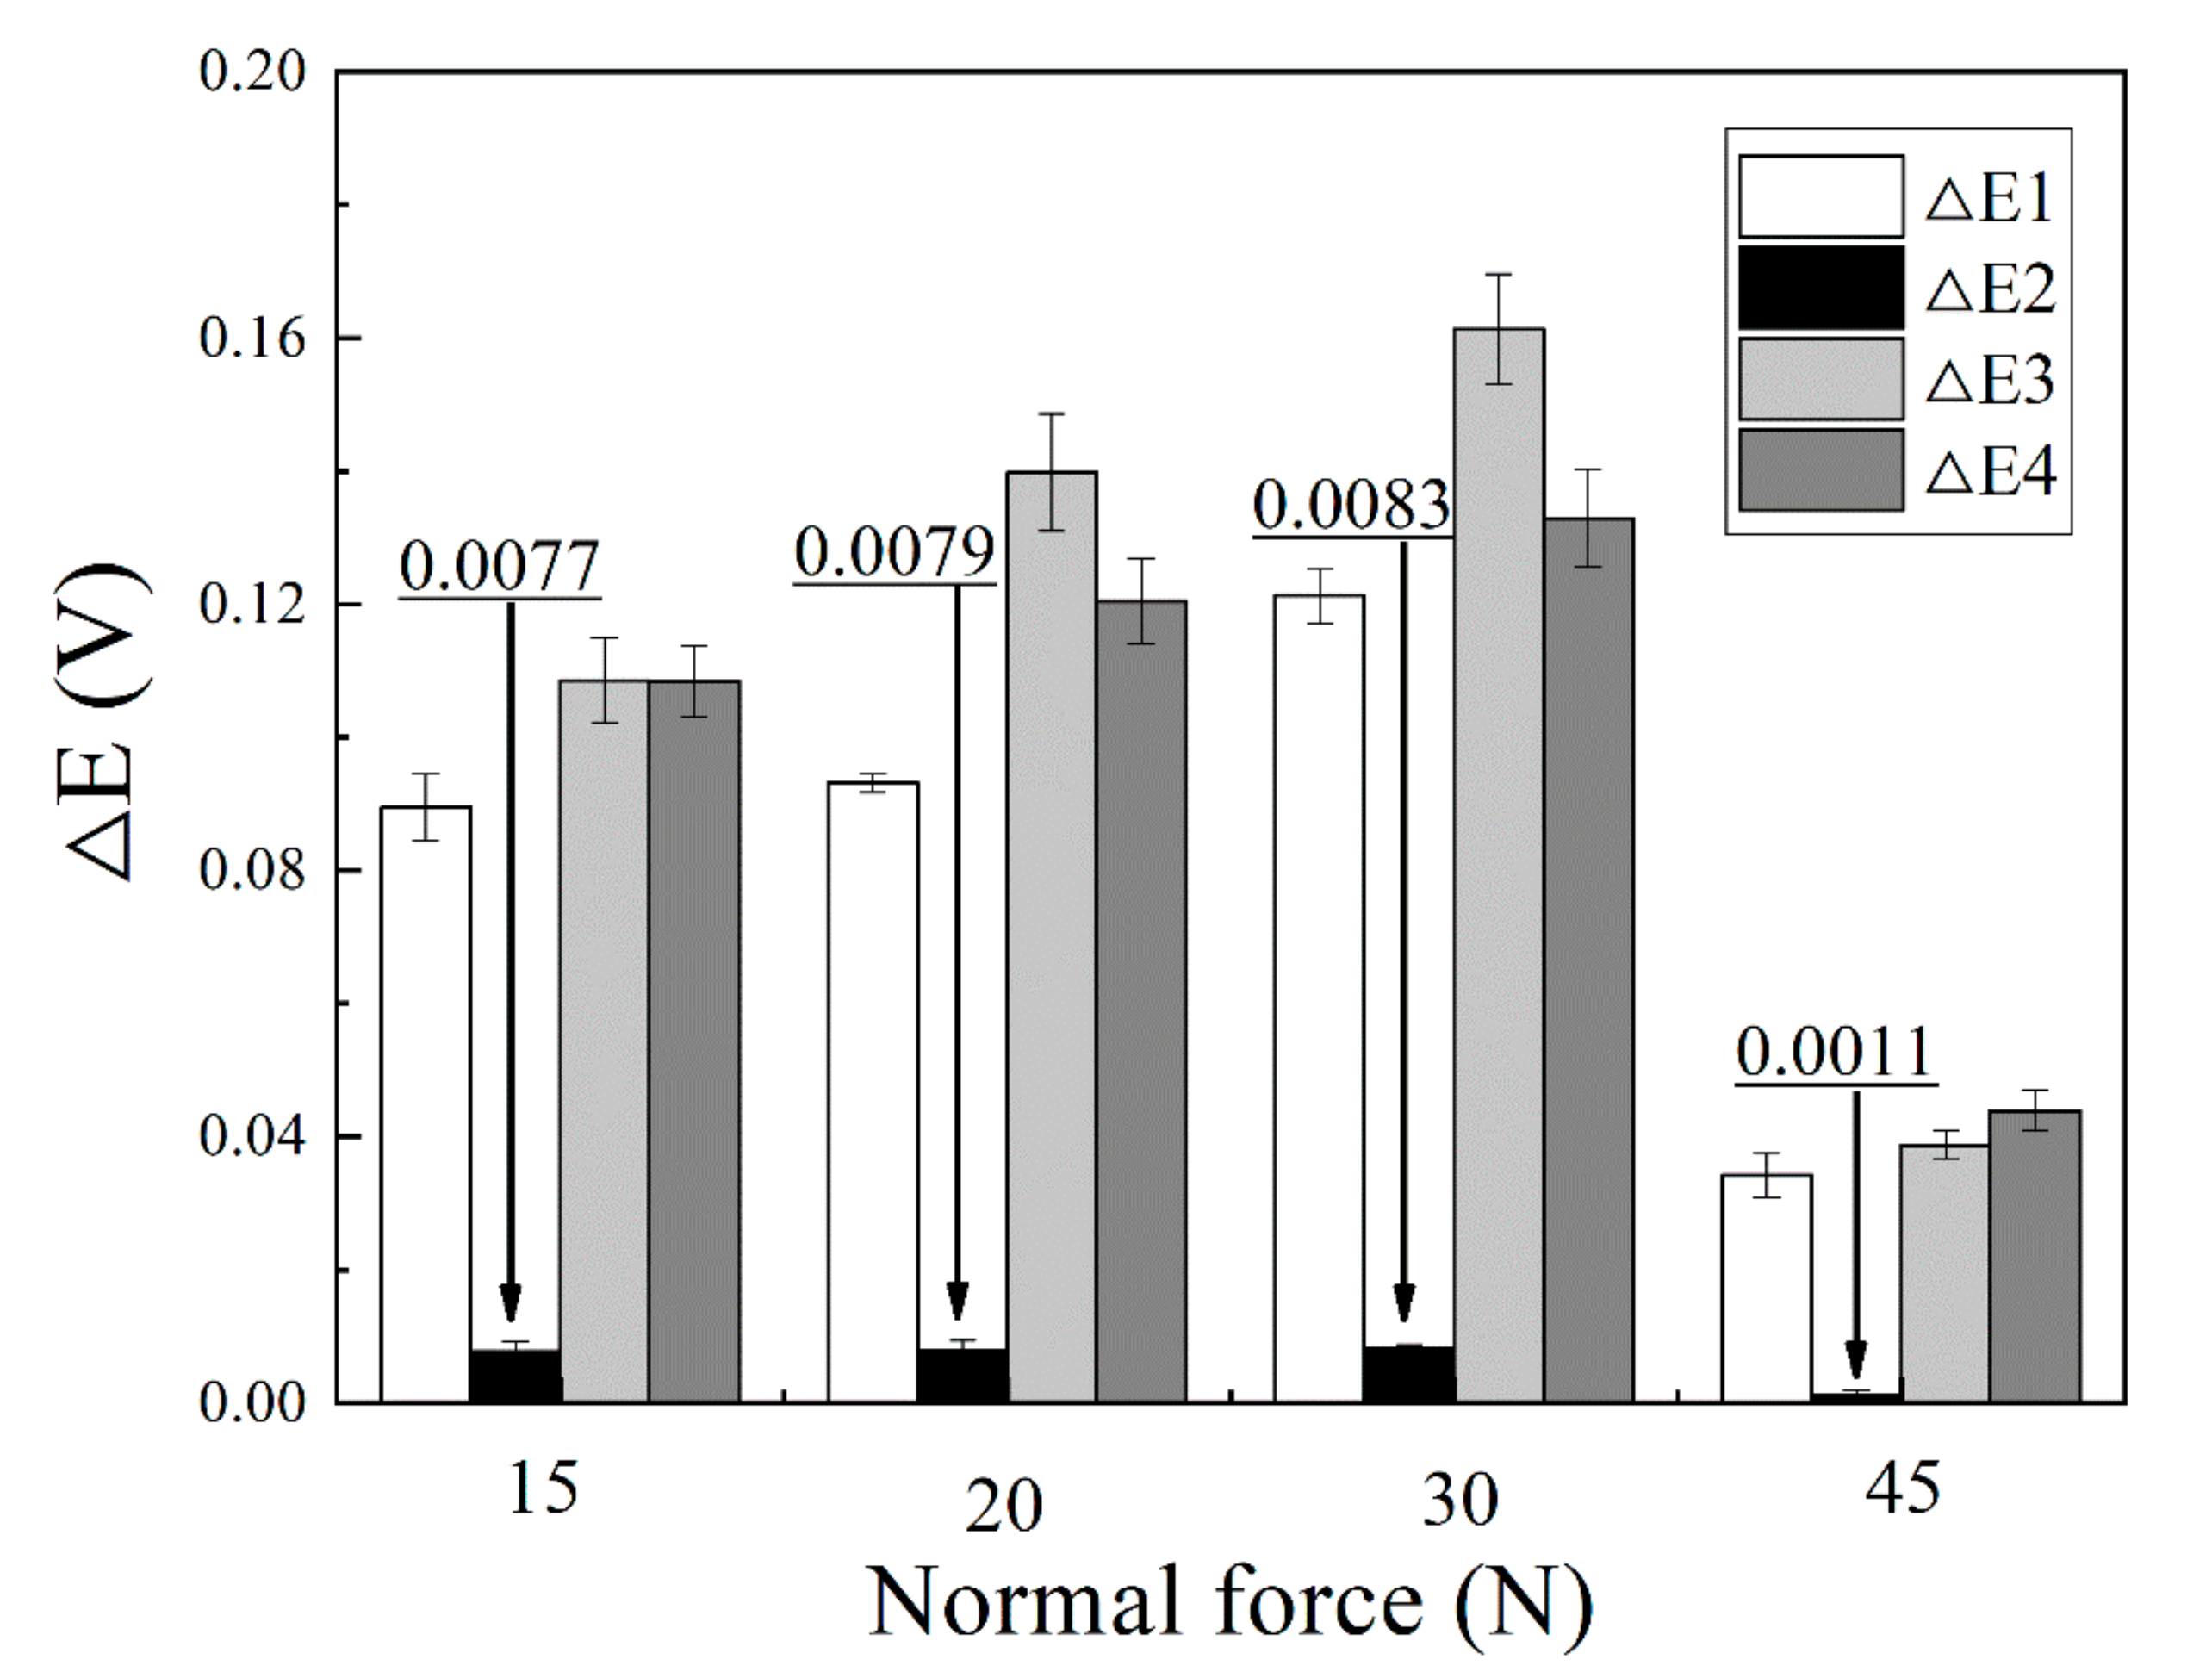
4.2. Wear and Corrosion Behaviors
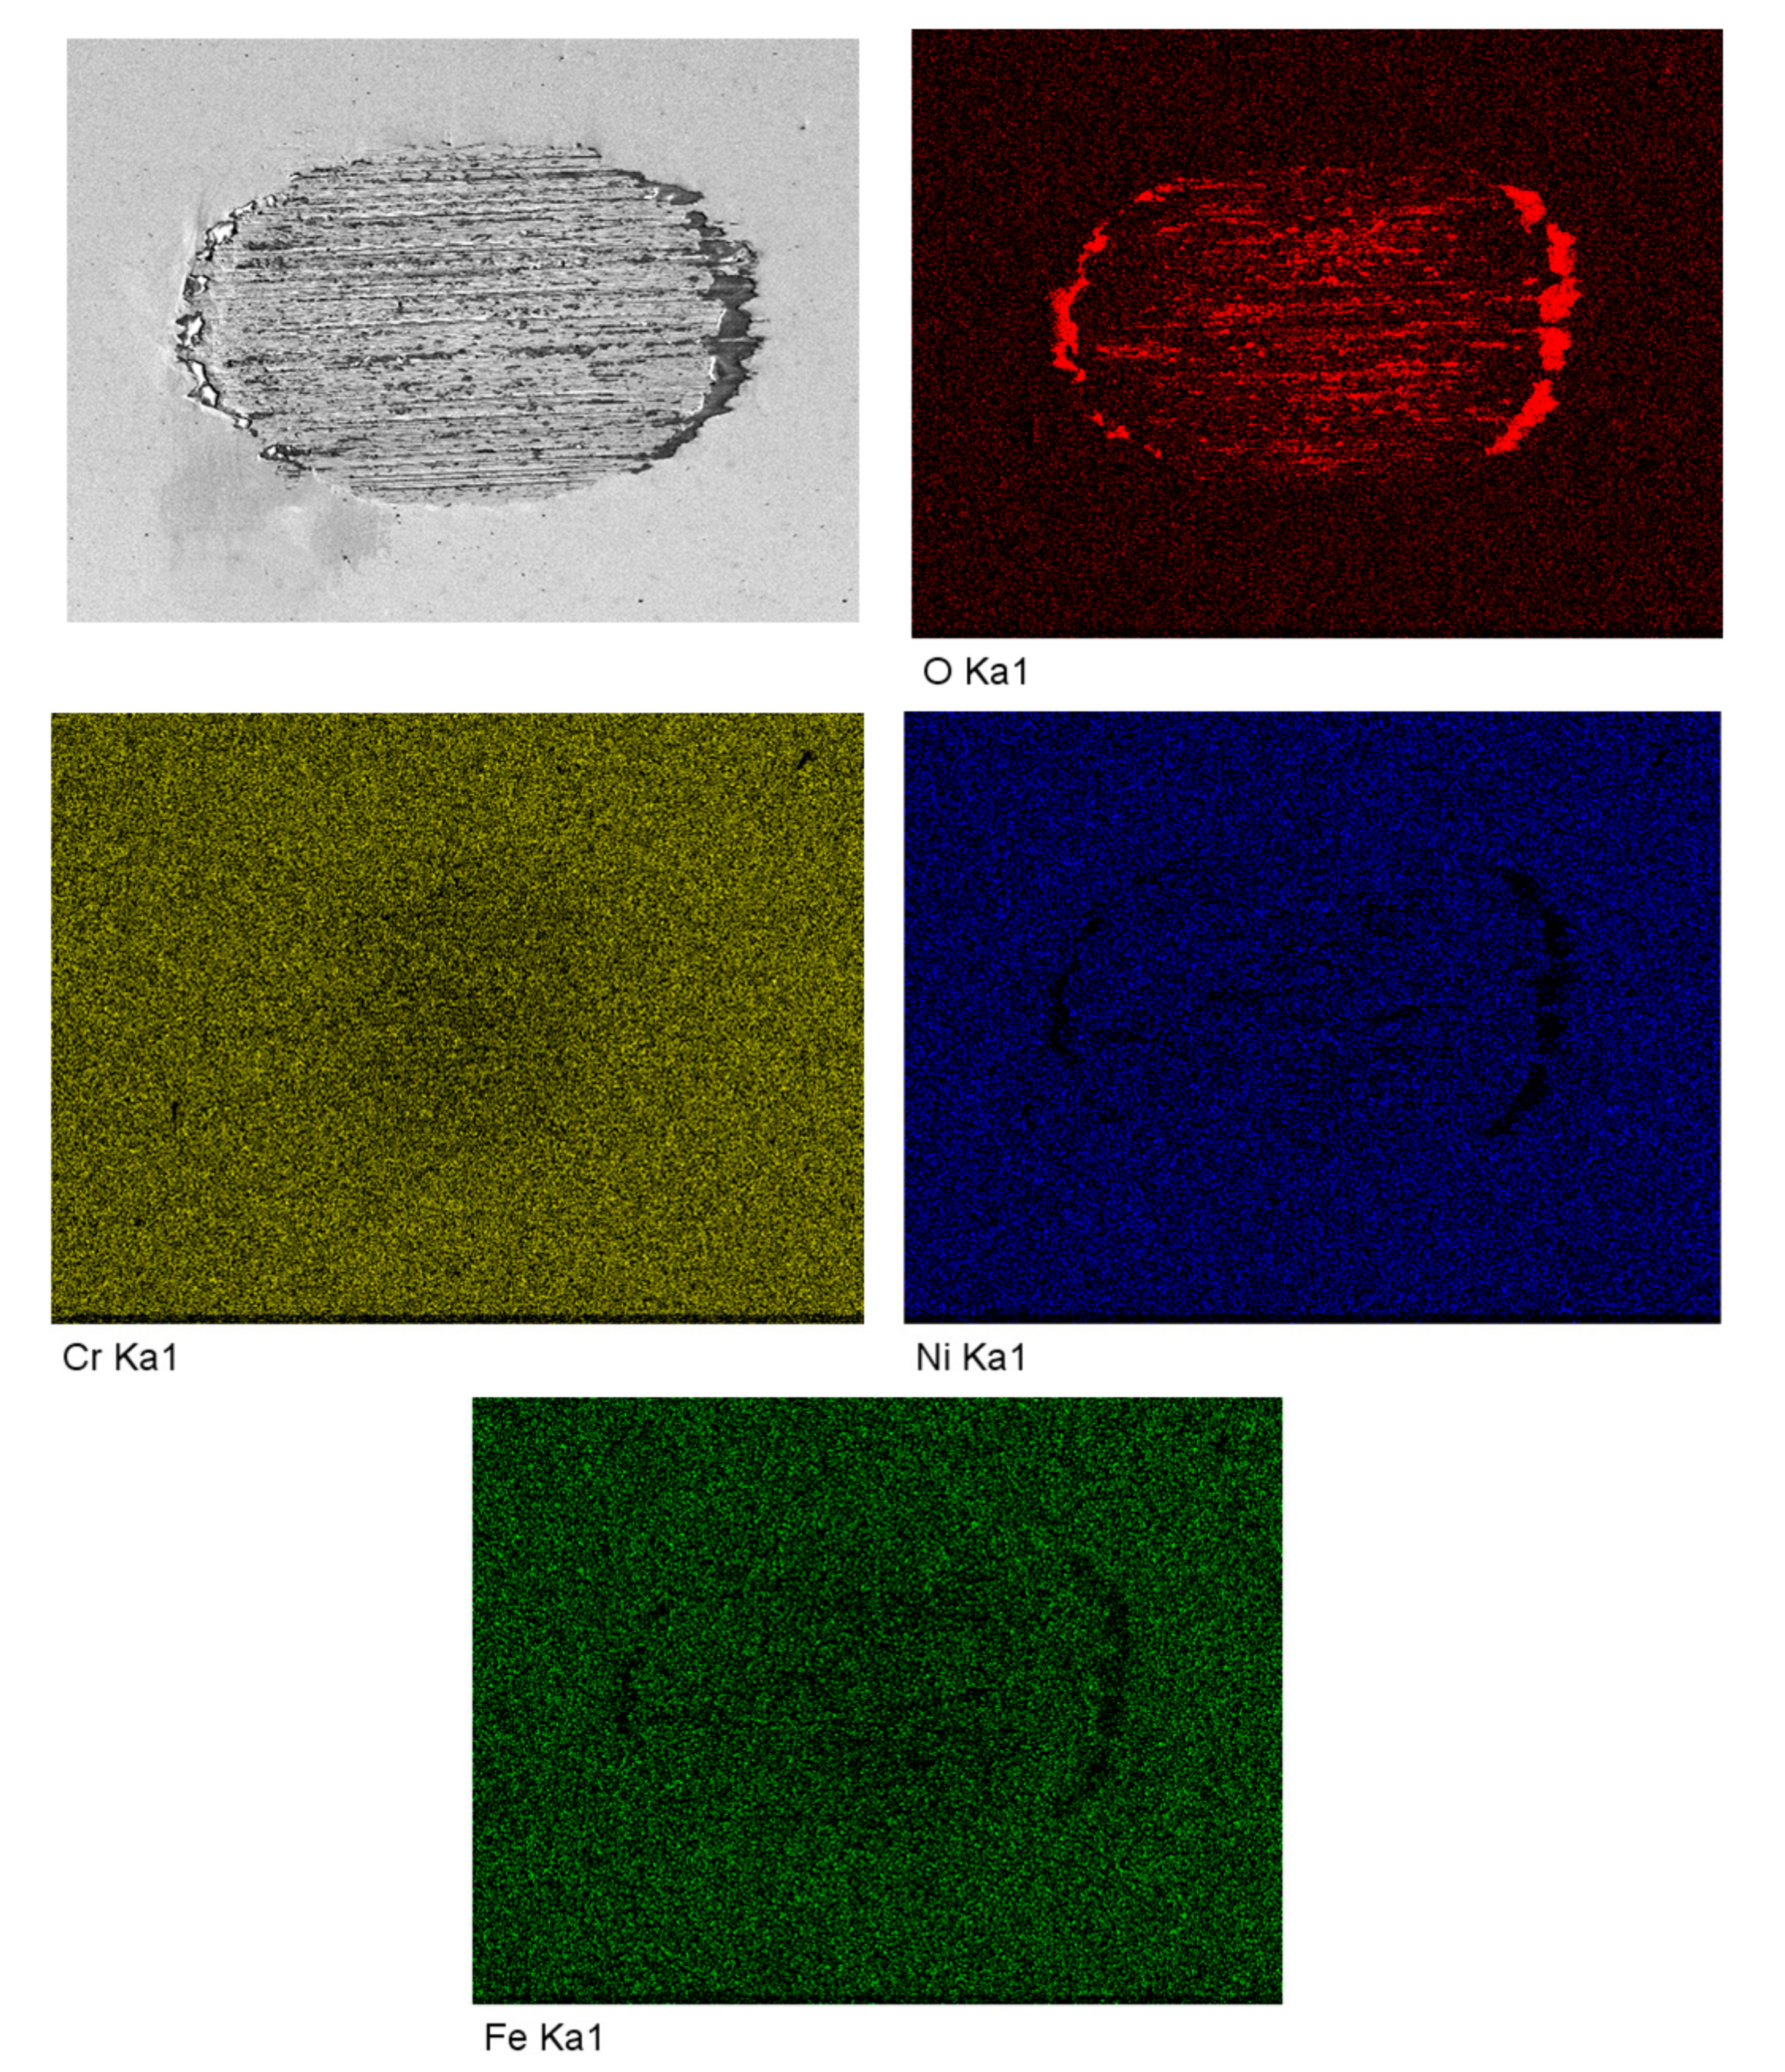
4.3. Changes of Passive Film
5. Conclusions
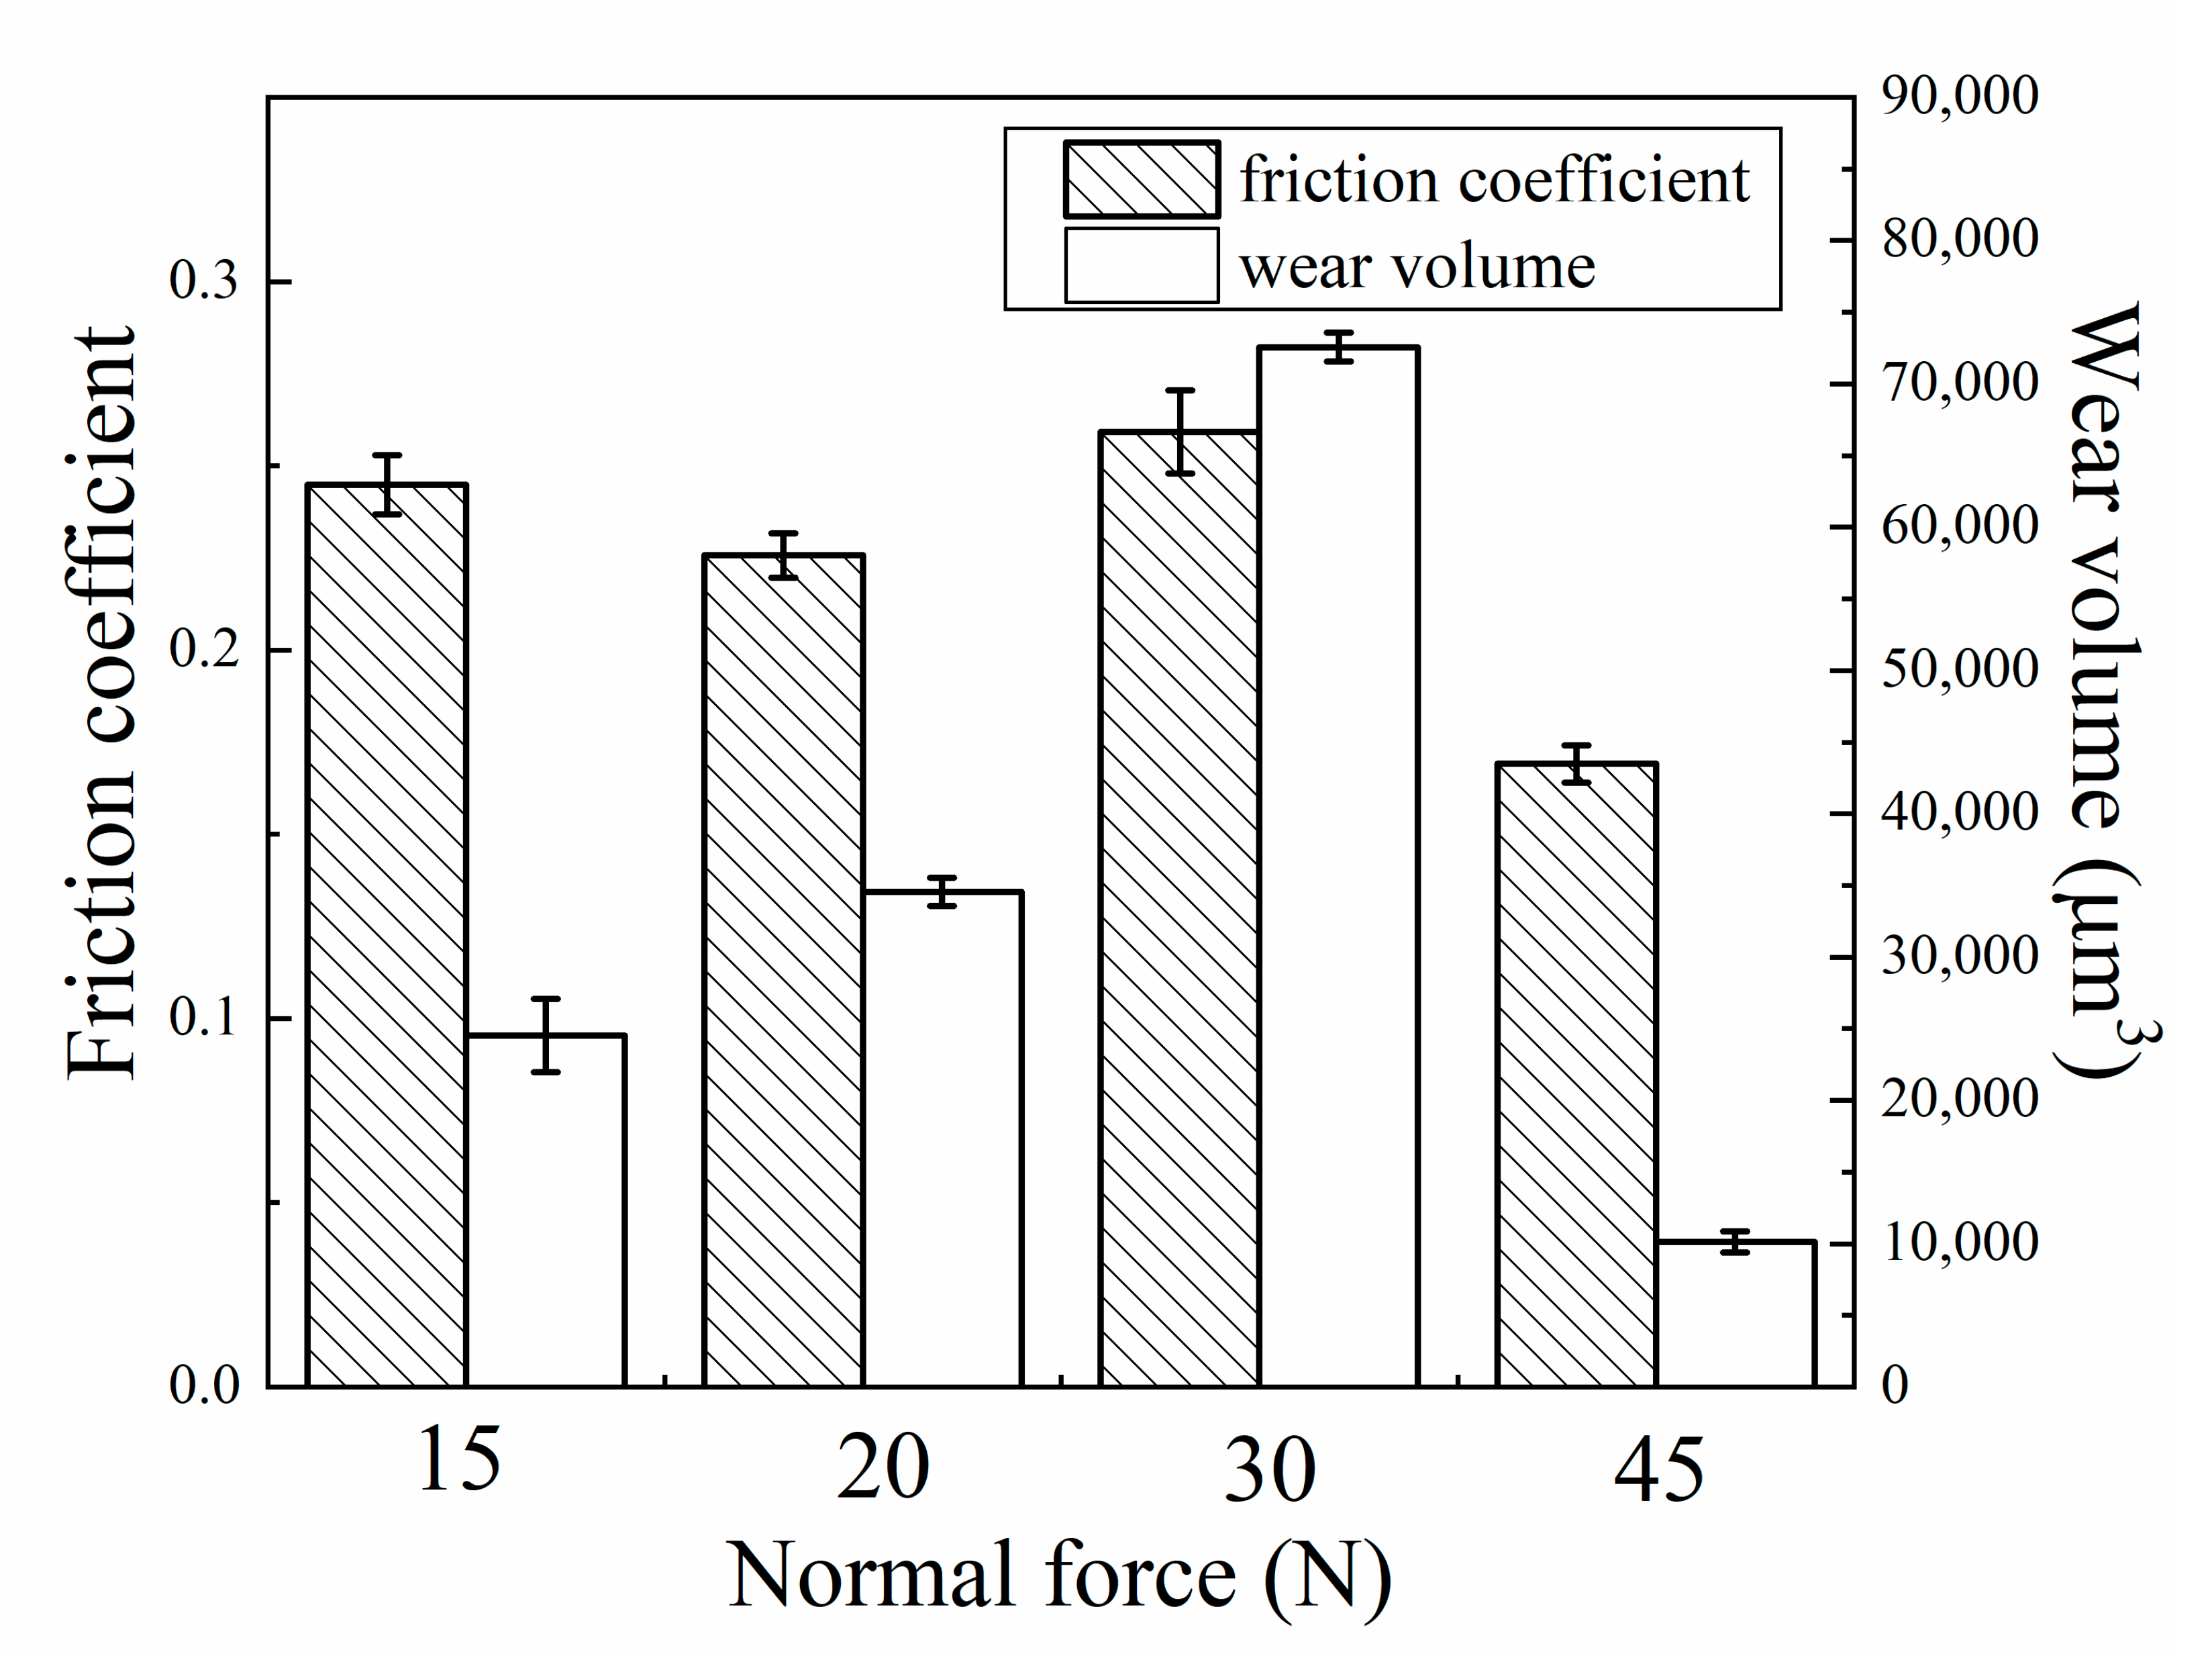
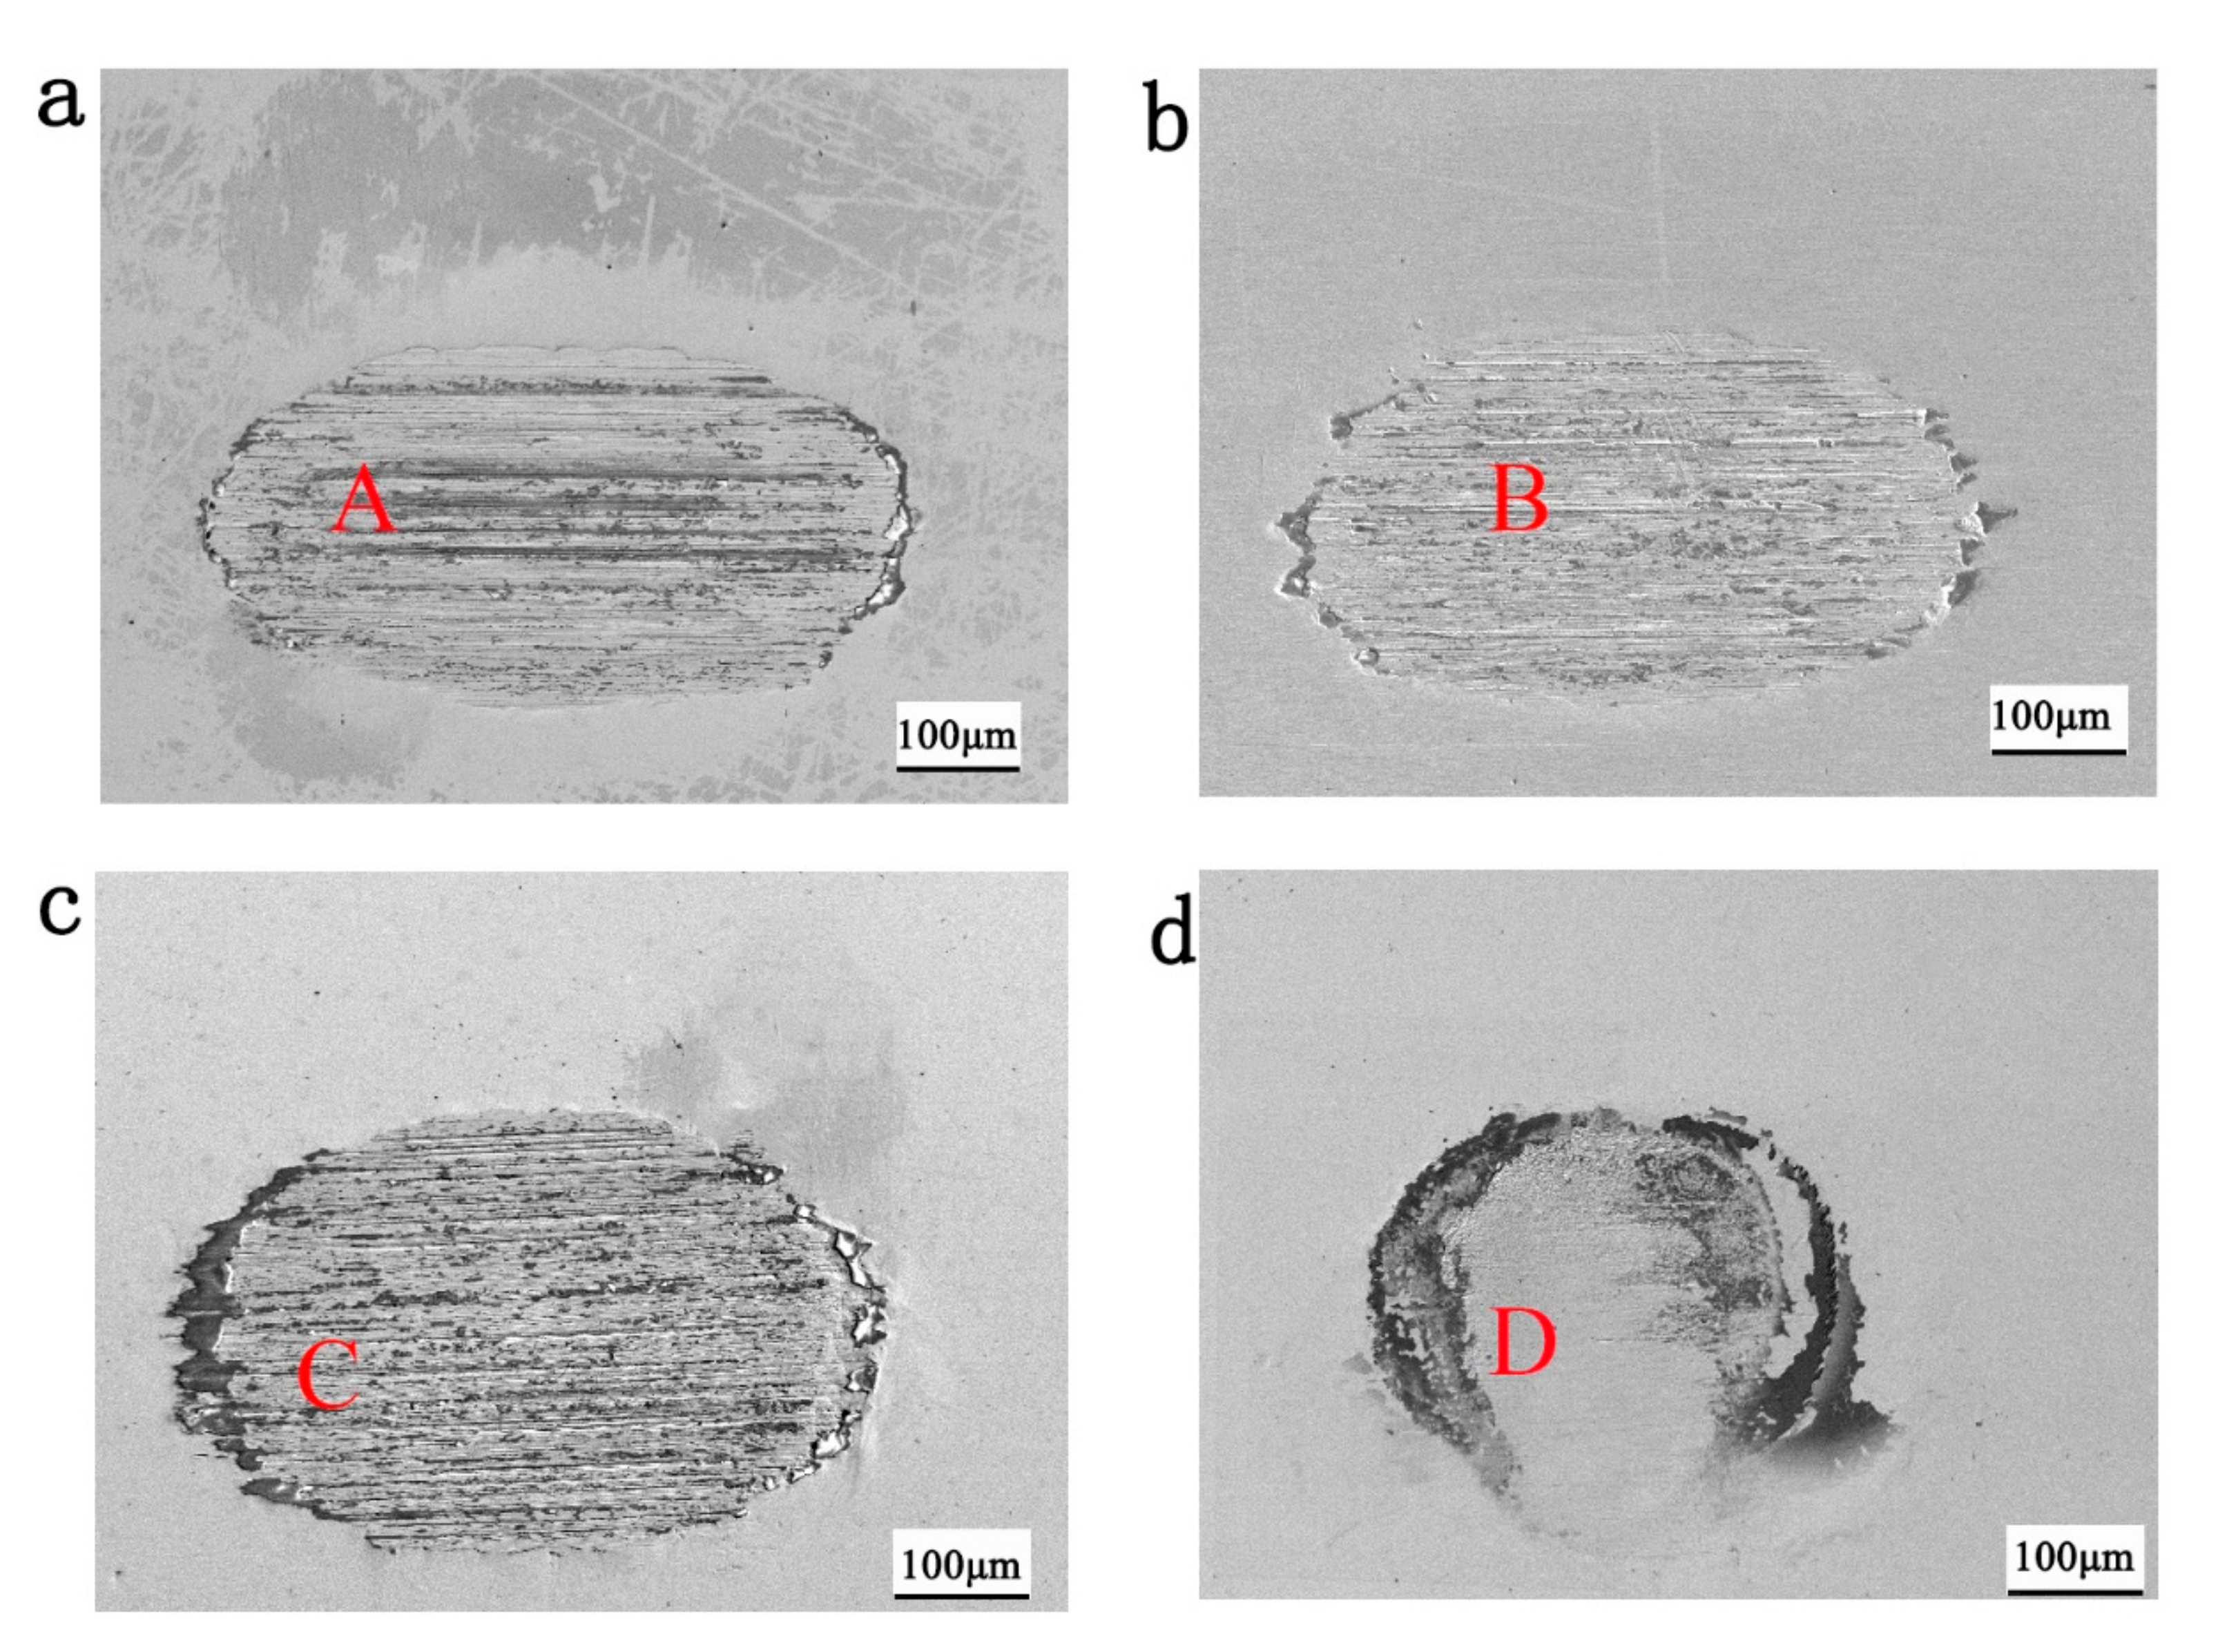
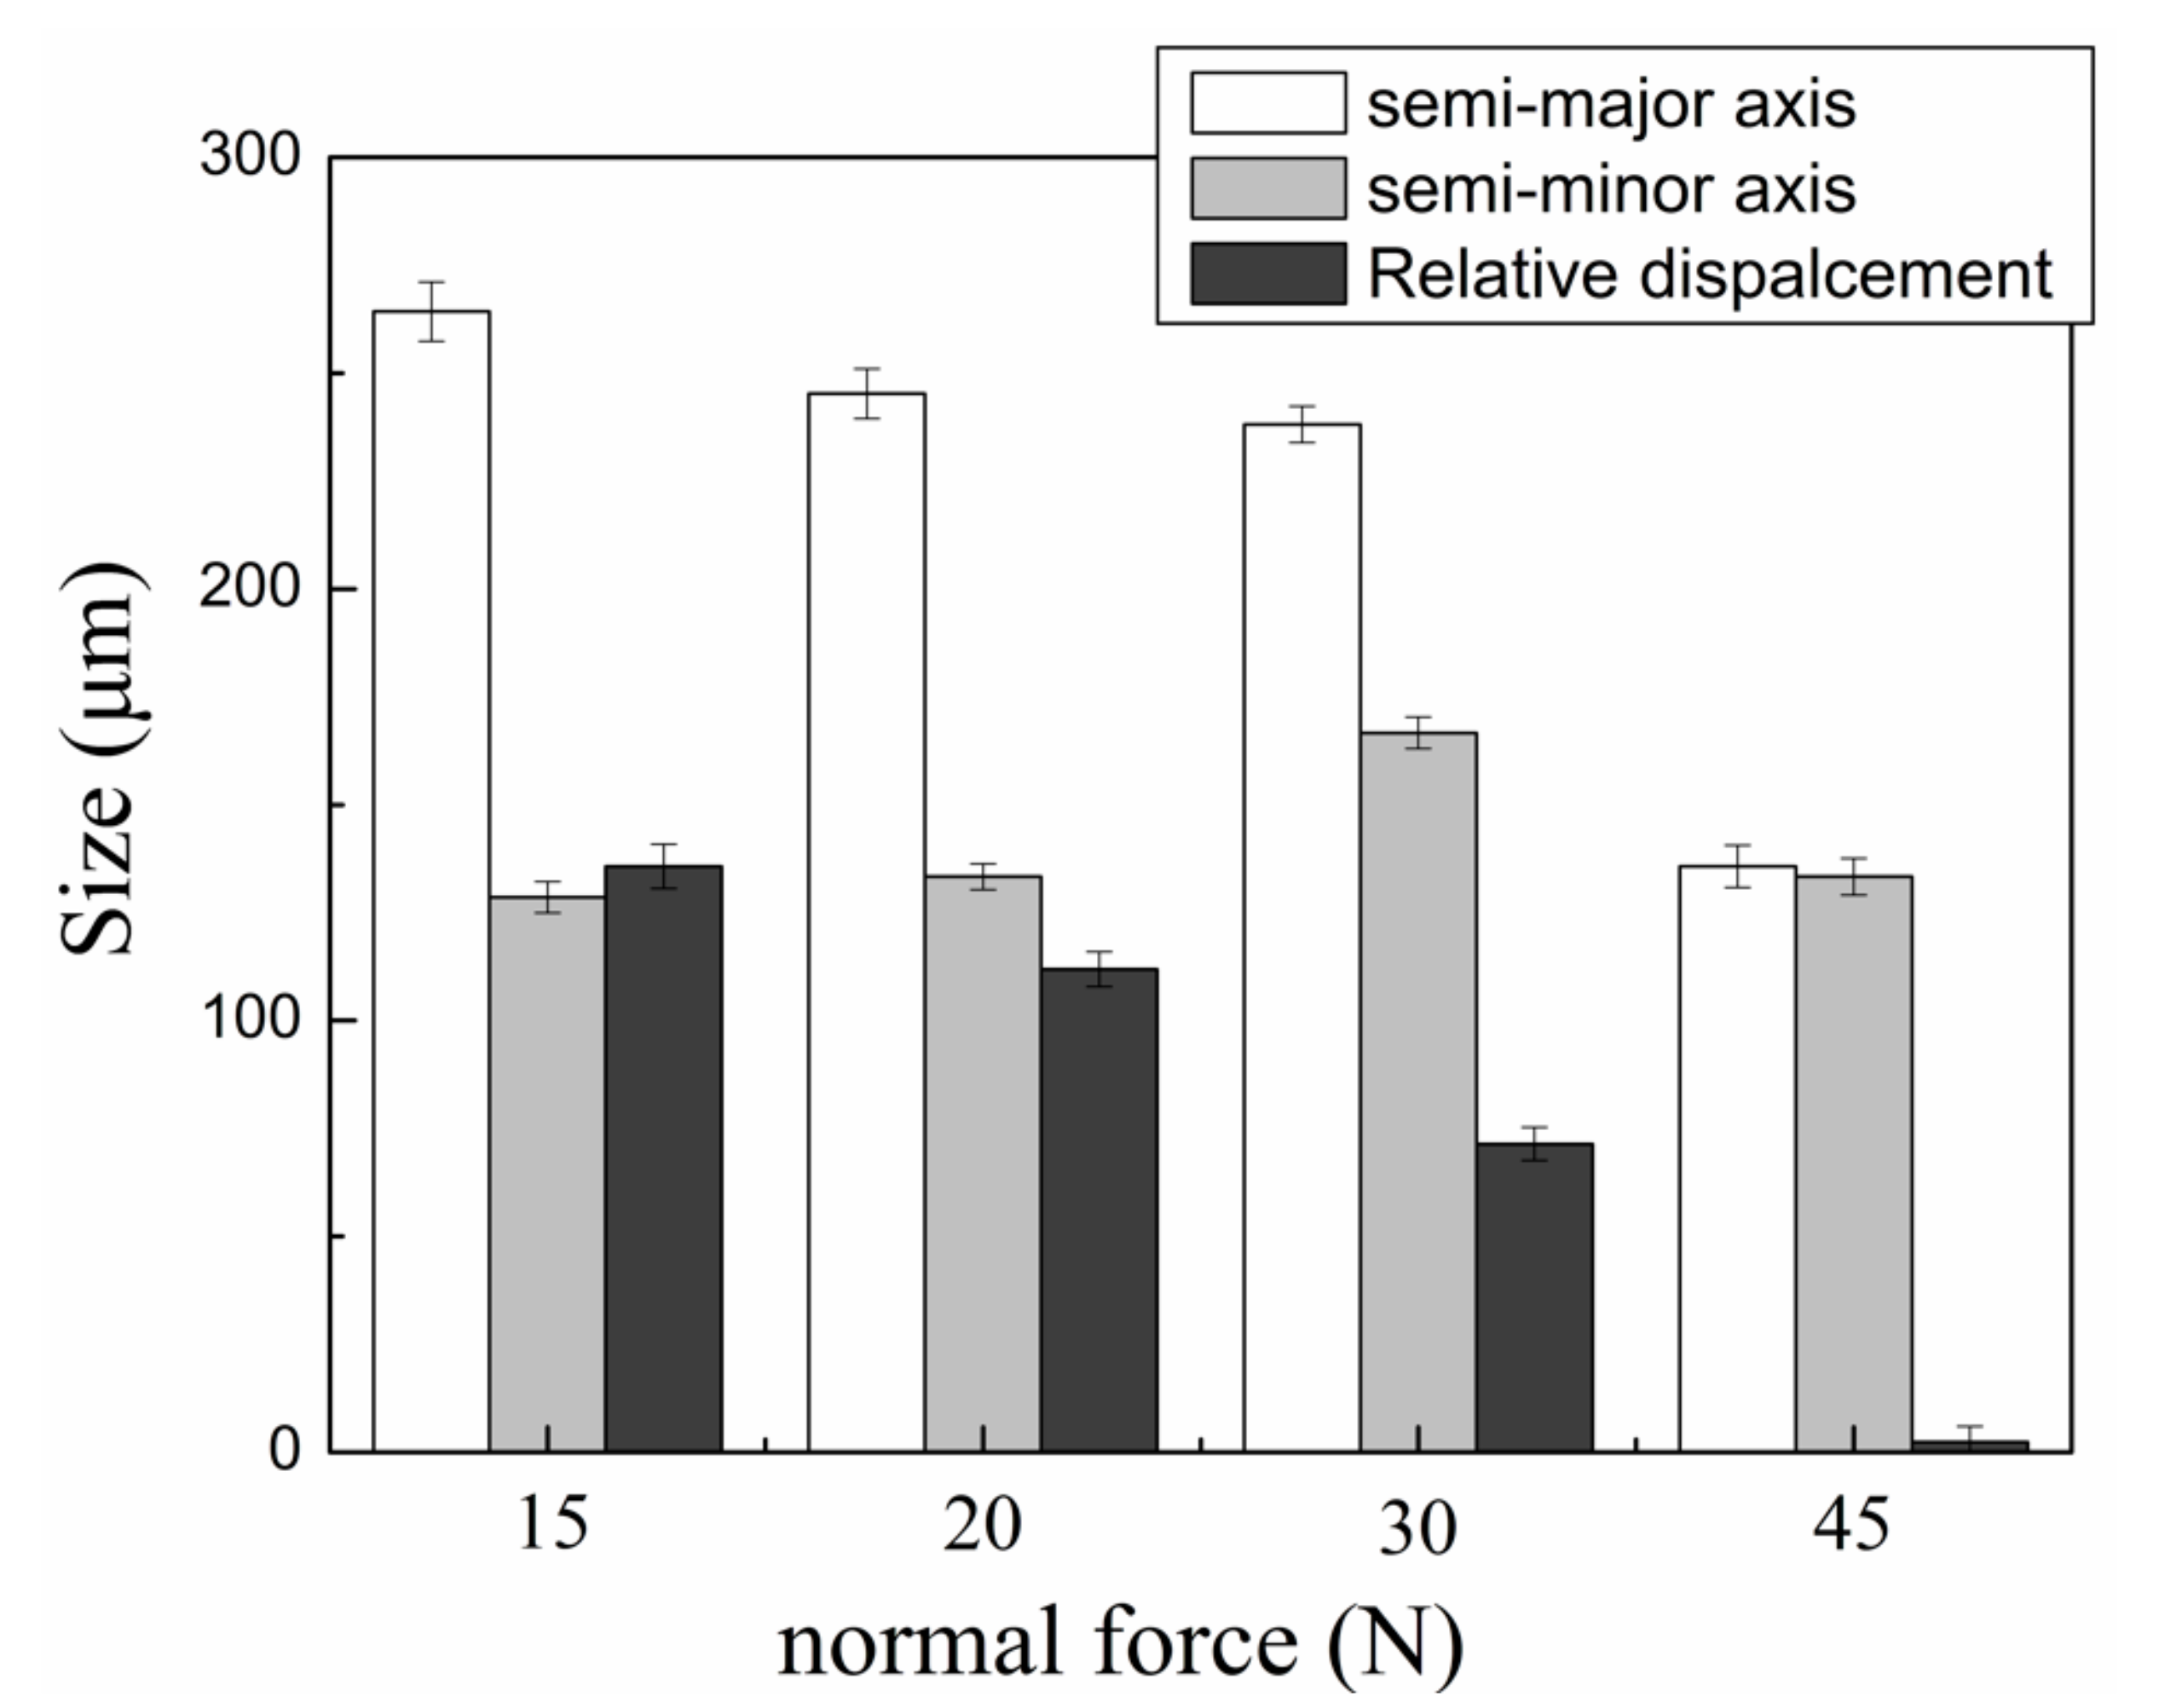
- The normal force had a great effect on the tribocorrosion behavior and mechanism. When the normal force increased from 15 to 30 N, the fretting regime was in a gross slip regime and the wear volume had an upward trend. When the normal force further increased to 45 N, the wear volume decreased significantly due to the change in the fretting regime from a gross slip regime to a partial slip regime;
- The electrochemical behavior on the worn surface strongly depended on the fretting wear mechanism. The fretting wear accelerated the corrosion reaction at the contact area. When fretting ran in a gross slip regime, the corrosion resistance decreased with the increase of normal force by negative shifts of OCP. However, when the fretting regime changed to a partial slip regime, the corrosion reaction decreased significantly due to the adhesive wear;
- Passive film played an important role in the fretting corrosion behavior. Fretting wear broke the passive film at contacting surface, which caused the worn surface to be more active and more prone to be corrosive. However, the broken passive film was quickly repaired by oxides produced in subsequent oxidation, and the corrosion continued to occur only after the break of passive film by the fretting wear;
- The break and repair of passive film on the wear scar strongly depended on the normal force. In the gross slip regime, the increase of normal force aggravated the break of passive film. In the case of a partial slip regime, the passive film was as easily broken with a further increase in the normal force.
Author Contributions
Funding
Conflicts of Interest
References
- Guo, X.L.; Lai, P.; Li, L.; Tang, L.C.; Zhang, L.F. Progress in studying the fretting wear/corrosion of nuclear steam generator tubes. Ann. Nucl. Energy 2020, 144, 107556. [Google Scholar] [CrossRef]
- Cai, Z.B.; Li, Z.Y.; Yin, M.G.; Zhu, M.H.; Zhou, Z.R. A review of fretting study on nuclear power equipment. Tribol. Int. 2020, 144, 106095. [Google Scholar] [CrossRef]
- Liu, X.C.; Ming, H.L.; Zhang, Z.M.; Wang, J.Q.; Tang, L.C.; Qian, H.; Xie, Y.C.; Han, E.H. Effects of temperature on fretting corrosion between Alloy 690TT and 405 Stainless Steel in Pure Water. Acta Metall. Sin. Engl. Lett. 2019, 32, 1437–1448. [Google Scholar] [CrossRef]
- Guo, X.L.; Lai, P.; Tang, L.C.; Lu, J.Q.; Wang, J.M.; Zhang, L.F. Fretting wear of alloy 690 tube mated with different materials in high temperature water. Wear 2018, 400–401, 119–126. [Google Scholar] [CrossRef]
- Stojadinović, J.; Bouvet, D.; Declercq, M.; Mischler, S. Effect of electrode potential on the tribocorrosion of tungsten. Tribol. Int. 2009, 42, 575–583. [Google Scholar] [CrossRef]
- Ming, H.L.; Liu, X.C.; Lai, J.; Wang, J.Q.; Gao, L.X.; Han, E.H. Fretting wear between Alloy 690 and 405 stainless steel in high temperature pressurized water with different normal force and displacement. J. Nucl. Mater. 2020, 529, 151930. [Google Scholar] [CrossRef]
- Guo, X.L.; Lai, P.; Tang, L.C.; Wang, J.M.; Zhang, L.F. Effects of sliding amplitude and normal load on the fretting wear behavior of alloy 690 tube exposed to high temperature water. Tribol. Int. 2017, 116, 155–163. [Google Scholar] [CrossRef]
- Ming, H.L.; Liu, X.C.; Zhang, Z.M.; Wang, J.Q.; Han, E.H. Effect of normal force on the fretting wear behavior of Inconel 690TT against 304 stainless steel in simulated secondary water of pressurized water reactor. Tribol. Int. 2018, 126, 133–143. [Google Scholar] [CrossRef]
- Xin, L.; Han, Y.M.; Ling, L.G.; Zhang, W.D.; Lu, Y.H.; Shoji, T. The evolution of fretting wear behavior and damage mechanism in Alloy 690TT with Cycle Number. Materials 2020, 13, 2417. [Google Scholar] [CrossRef]
- Li, J.; Ma, M.; Lu, Y.H.; Xin, L. Evolution of wear damage in Inconel 600 alloy due to fretting against type 304 stainless steel. Wear 2016, 346, 15–21. [Google Scholar] [CrossRef]
- Mi, X.; Xie, H.; Tang, P.; Cai, Z.B.; Peng, J.F.; Zhu, M.H. Effect of environmental condition on the chemical behavior of 690 alloy during fretting wear. Tribol. Int. 2020, 146, 106202. [Google Scholar] [CrossRef]
- Lai, P.; Gao, X.C.; Tang, L.C.; Guo, X.L.; Zhang, L.F. Effect of temperature on fretting wear behavior and mechanism of alloy 690 in water. Nucl. Eng. Des. 2018, 327, 51–60. [Google Scholar] [CrossRef]
- Hong, J.K.; Kim, I.-S. Environment effects on the reciprocating wear of Inconel 690 steam generator tubes. Wear 2003, 255, 1174–1182. [Google Scholar] [CrossRef]
- Ming, H.L.; Liu, X.C.; Yan, H.L.; Zhang, Z.M.; Wang, J.Q.; Gao, L.X.; Lai, J.; Han, E.H. Understanding the microstructure evolution of Ni-based superalloy within two different fretting wear regimes in high temperature high pressure water. Scr. Mater. 2019, 170, 111–115. [Google Scholar] [CrossRef]
- Xin, L.; Huang, Q.; Han, Y.M.; Lu, Y.H.; Zhang, W.D.; Shoji, T. The damage mechanism of Alloy 690TT against Alloy 600 caused by fretting wear in room temperature pure water. Mater. Charact. 2020, 161, 110176. [Google Scholar] [CrossRef]
- Xin, L.; Yang, B.B.; Li, J.; Lu, Y.H.; Shoji, T. Wear damage of Alloy 690TT in partial and gross slip fretting regimes at high temperature. Wear 2017, 390, 71–79. [Google Scholar] [CrossRef]
- Xin, L.; Yang, B.B.; Li, J.; Lu, Y.H.; Shoji, T. Microstructural characteristics of Alloy 690TT subjected to fretting corrosion in high temperature water. Corros. Sci. 2017, 123, 116–128. [Google Scholar] [CrossRef]
- Xin, L.; Luo, H.J.; Han, Y.M.; Lu, Y.H.; Shoji, T. Damage mechanism of Alloy 690TT mated with Type 304 stainless steel during fretting wear in partial slip regime. Mater. Charact. 2017, 132, 284–292. [Google Scholar] [CrossRef]
- Wang, Z.H.; Lu, Y.H.; Li, J.; Shoji, T. Effect of pH value on the fretting wear behavior of Inconel 690 alloy. Tribol. Int. 2016, 95, 162–169. [Google Scholar] [CrossRef]
- Li, J.; Yang, B.B.; Lu, Y.H.; Xin, L.; Wang, Z.H.; Shoji, T. The effects of electrochemical polarization condition and applied potential on tribocorrosion behaviors of Inconel 690 alloys in water environment. Mater. Des. 2017, 119, 93–103. [Google Scholar] [CrossRef]
- Huang, J.; Wu, X.Q.; Han, E.H. Electrochemical properties and growth mechanism of passive films on Alloy 690 in high-temperature alkaline environments. Corros. Sci. 2010, 52, 3444–3452. [Google Scholar] [CrossRef]
- Lv, J.L.; Liang, T.X.; Chen, W.; Guo, T. Comparison of corrosion behavior between coarse grained and nano/ultrafine grained alloy 690. Appl. Surf. Sci. 2016, 360(Part A), 403–408. [Google Scholar] [CrossRef]
- Tekin, K.C.; Malayoglu, U. Assessing the tribocorrosion performance of three different nickel-based superalloys. Tribol. Lett. 2010, 37, 563–572. [Google Scholar] [CrossRef]
- Li, B.; Gao, Y.M.; Li, C.; Guo, H.J.; Zhao, S.Y. Tribocorrosion properties of NiCrAlY Coating in different corrosive environments. Materials 2020, 13, 1864. [Google Scholar] [CrossRef]
- Lgried, M.; Liskiewicz, T.; Neville, A. Electrochemical investigation of corrosion and wear interactions under fretting conditions. Wear 2012, 282, 52–58. [Google Scholar] [CrossRef]
- Xin, L.; Lu, Y.H.; Shoji, T. The role of material transfer in fretting wear behavior and mechanism of Alloy 690TT mated with Type 304 stainless steel. Mater. Charact. 2017, 130, 250–259. [Google Scholar] [CrossRef]
- Li, J.; Yang, B.B.; Lu, Y.H.; Xin, L.; Wang, Z.H.; Shoji, T. The effect of normal force on fretting corrosion behavior of Inconel 690 in 3.5% sodium chloride. Mater. Charact. 2017, 131, 224–233. [Google Scholar] [CrossRef]
- Xin, L.; Yang, B.B.; Wang, Z.H.; Li, J.; Lu, Y.H.; Shoji, T. Effect of normal force on fretting wear behavior and mechanism of Alloy 690TT in high temperature water. Wear 2016, 368–369, 210–218. [Google Scholar] [CrossRef]
- Archard, J.F. Contact and rubbing of flat surfaces. J. Appl. Phys. 1953, 24, 981–988. [Google Scholar] [CrossRef]
- Xin, L.; Huang, Q.; Han, Y.M.; Ji, H.C.; Lu, Y.H.; Shoji, T. Insights into the fatigue cracking of Alloy 690TT subjected to fretting wear under partial slip conditions. Mater. Charact. 2020, 159, 110040. [Google Scholar] [CrossRef]
- Xin, L.; Wang, Z.H.; Li, J.; Lu, Y.H.; Shoji, T. Fretting wear behavior and mechanism of inconel 690 Alloy Related to the displacement amplitude. Tribol. Trans. 2017, 60, 913–922. [Google Scholar] [CrossRef]
- Geringer, J.; Macdonald, D.D. Friction/fretting-corrosion mechanisms: Current trends and outlooks for implants. Mater. Lett. 2014, 134, 152–157. [Google Scholar] [CrossRef]
- Fouvry, S.; Kapsa, P.; Vincent, L. An elastic–plastic shakedown analysis of fretting wear. Wear 2001, 247, 41–54. [Google Scholar] [CrossRef]
- Bryant, M.; Farrar, R.; Brummitt, K.; Freeman, R.; Neville, A. Fretting corrosion of fully cemented polished collarless tapered stems: The influence of PMMA bone cement. Wear 2013, 301, 290–299. [Google Scholar] [CrossRef]
- Sivakumar, B.; Kumar, S.; Sankara Narayanan, T.S.N. Fretting corrosion behaviour of Ti–6Al–4V alloy in artificial saliva containing varying concentrations of fluoride ions. Wear 2011, 270, 317–324. [Google Scholar] [CrossRef]
- Xie, Z.W.; Chen, T.; Chen, Q.; Yang, Q.; Tan, S.; Wang, Y.J.; Luo, Y.M.; Luo, Z.Z.; Hua, M.Q. Tribocorrosion behaviors of AlN/MoS2–phenolic resin duplex coatings on nitrogen implanted magnesium alloys. Surf. Coct. Tech. 2015, 266, 64–69. [Google Scholar] [CrossRef]
- Kuang, W.J.; Wu, X.Q.; Han, E.H. Influence of dissolved oxygen concentration on the oxide film formed on Alloy 690 in high temperature water. Corros. Sci. 2013, 69, 197–204. [Google Scholar] [CrossRef]
- Lv, J.L.; Liang, T.X.; Wang, C.; Gao, W.L. Investigation of passive films formed on the surface of alloy 690 in borate buffer solution. J. Nucl. Mater. 2015, 465, 418–423. [Google Scholar] [CrossRef]
- Zhu, M.H.; Zhou, Z.R. On the mechanisms of various fretting wear modes. Tribol. Int. 2011, 44, 1378–1388. [Google Scholar] [CrossRef]


| Specimen | Element | ||||||||
|---|---|---|---|---|---|---|---|---|---|
| Ni | Fe | Cr | C | Ti | Mn | Si | P | S | |
| Inconel 690TT | Bal | 11.6 | 29.9 | 0.025 | 0.30 | 0.25 | 0.33 | 0.086 | 0.0025 |
© 2020 by the authors. Licensee MDPI, Basel, Switzerland. This article is an open access article distributed under the terms and conditions of the Creative Commons Attribution (CC BY) license (http://creativecommons.org/licenses/by/4.0/).
Share and Cite
Xin, L.; Jiang, L. Effects of Normal Force on the Tribocorrosion Behavior of a Nickel-Based Superalloy in Alkaline Solution: An Electrochemical Study. Materials 2020, 13, 3959. https://doi.org/10.3390/ma13183959
Xin L, Jiang L. Effects of Normal Force on the Tribocorrosion Behavior of a Nickel-Based Superalloy in Alkaline Solution: An Electrochemical Study. Materials. 2020; 13(18):3959. https://doi.org/10.3390/ma13183959
Chicago/Turabian StyleXin, Long, and Liwu Jiang. 2020. "Effects of Normal Force on the Tribocorrosion Behavior of a Nickel-Based Superalloy in Alkaline Solution: An Electrochemical Study" Materials 13, no. 18: 3959. https://doi.org/10.3390/ma13183959
APA StyleXin, L., & Jiang, L. (2020). Effects of Normal Force on the Tribocorrosion Behavior of a Nickel-Based Superalloy in Alkaline Solution: An Electrochemical Study. Materials, 13(18), 3959. https://doi.org/10.3390/ma13183959