Extended CT Void Analysis in FDM Additive Manufacturing Components

 , , ,
, , ,  and
and 
Abstract
1. Introduction
1.1. Additive Manufacturing
1.2. X-Ray Computed Tomography
1.3. Effect of Voids in Mechanical Properties
1.4. Aim and Scope
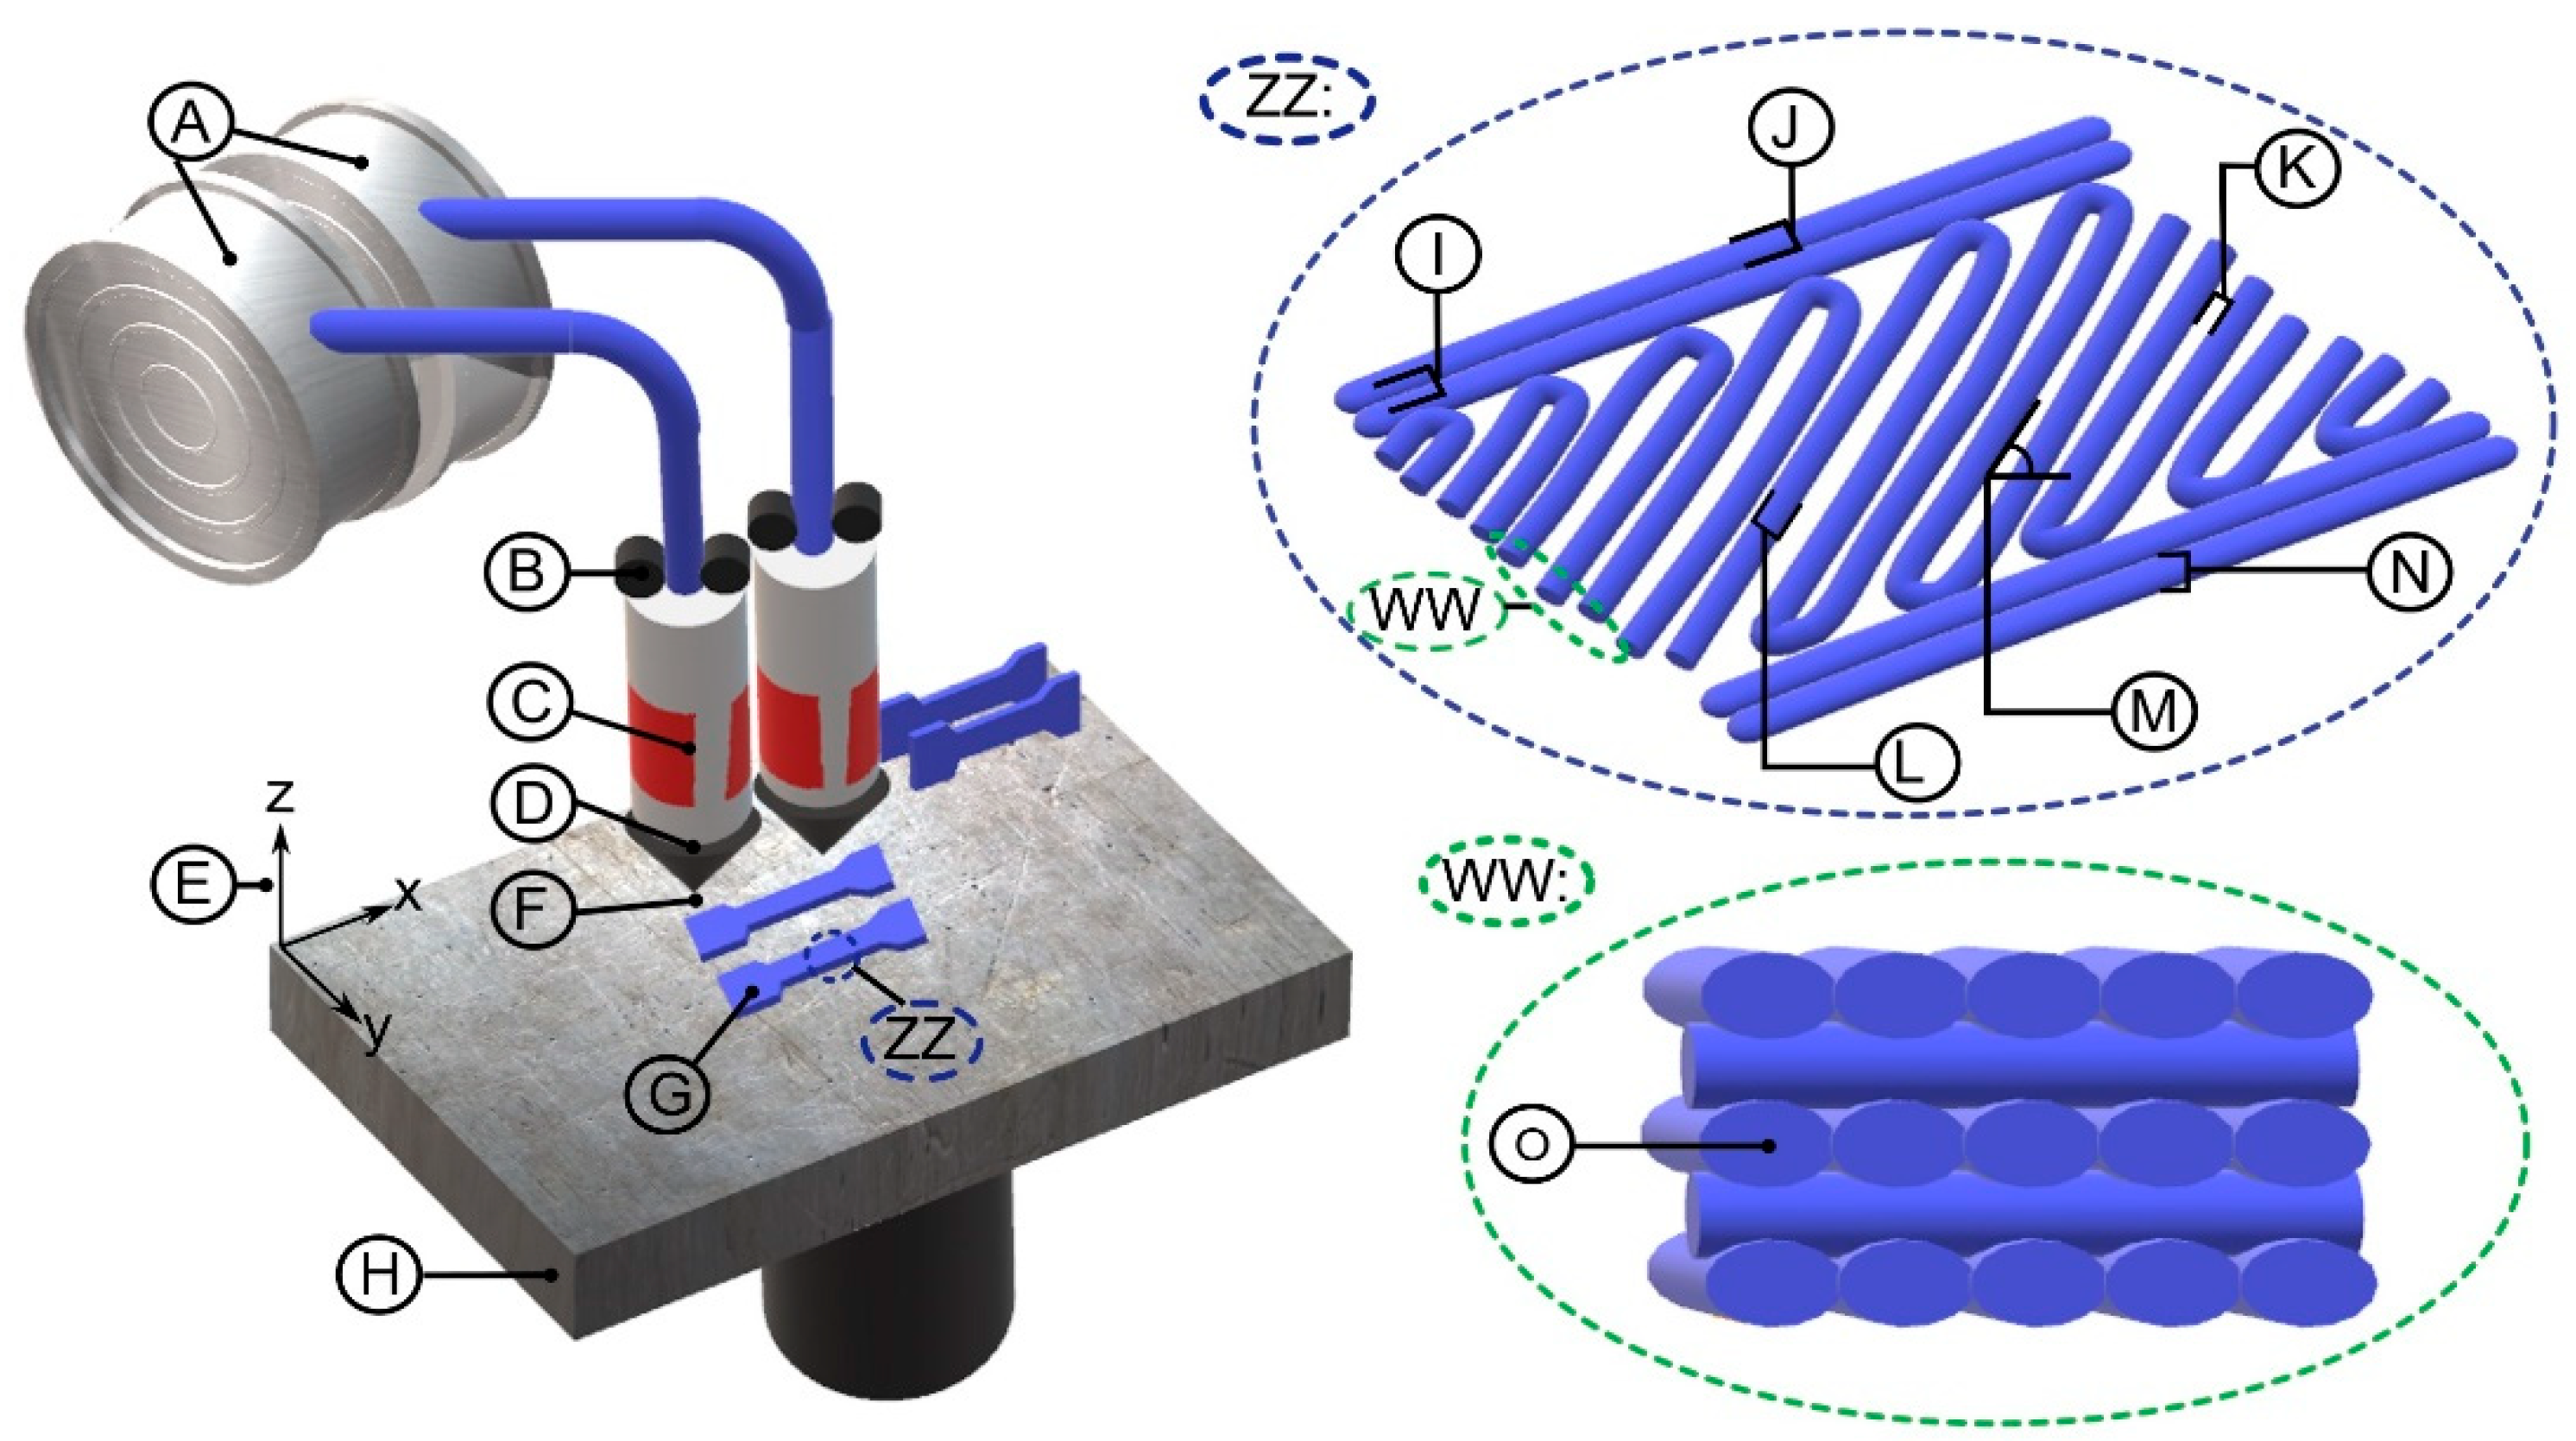
1.5. ME/FDM Process
2. Materials and Methods
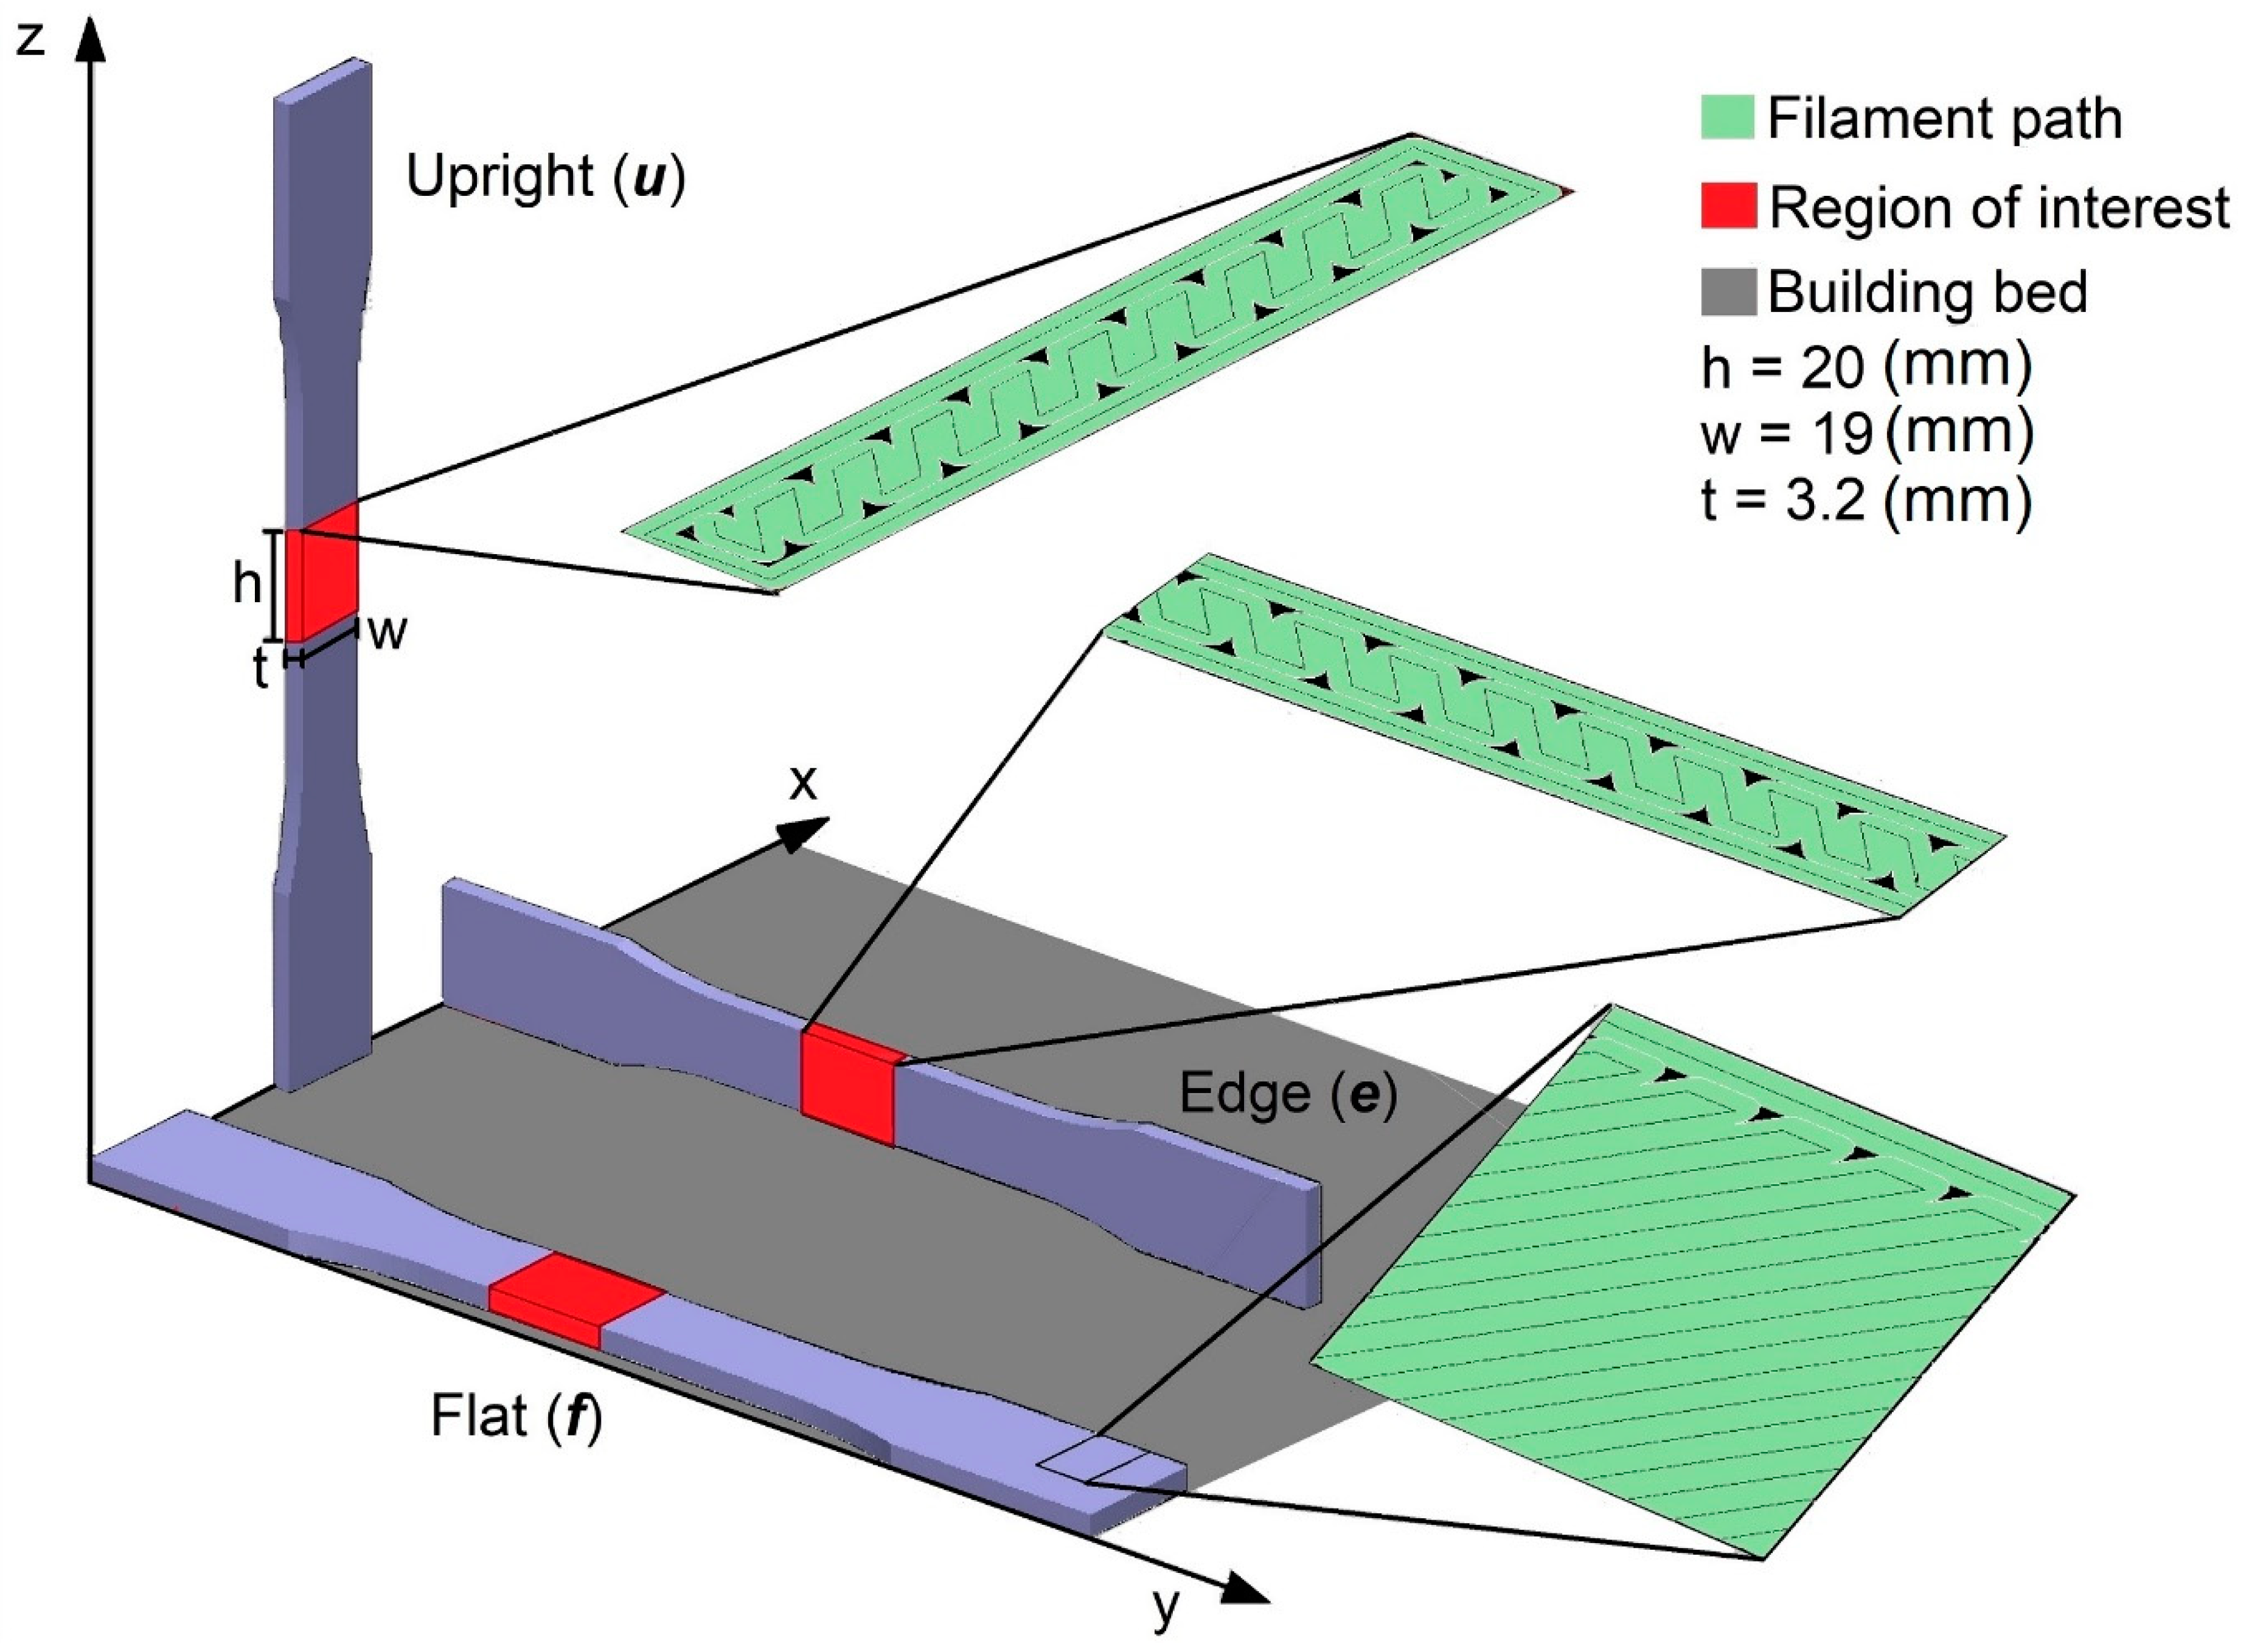
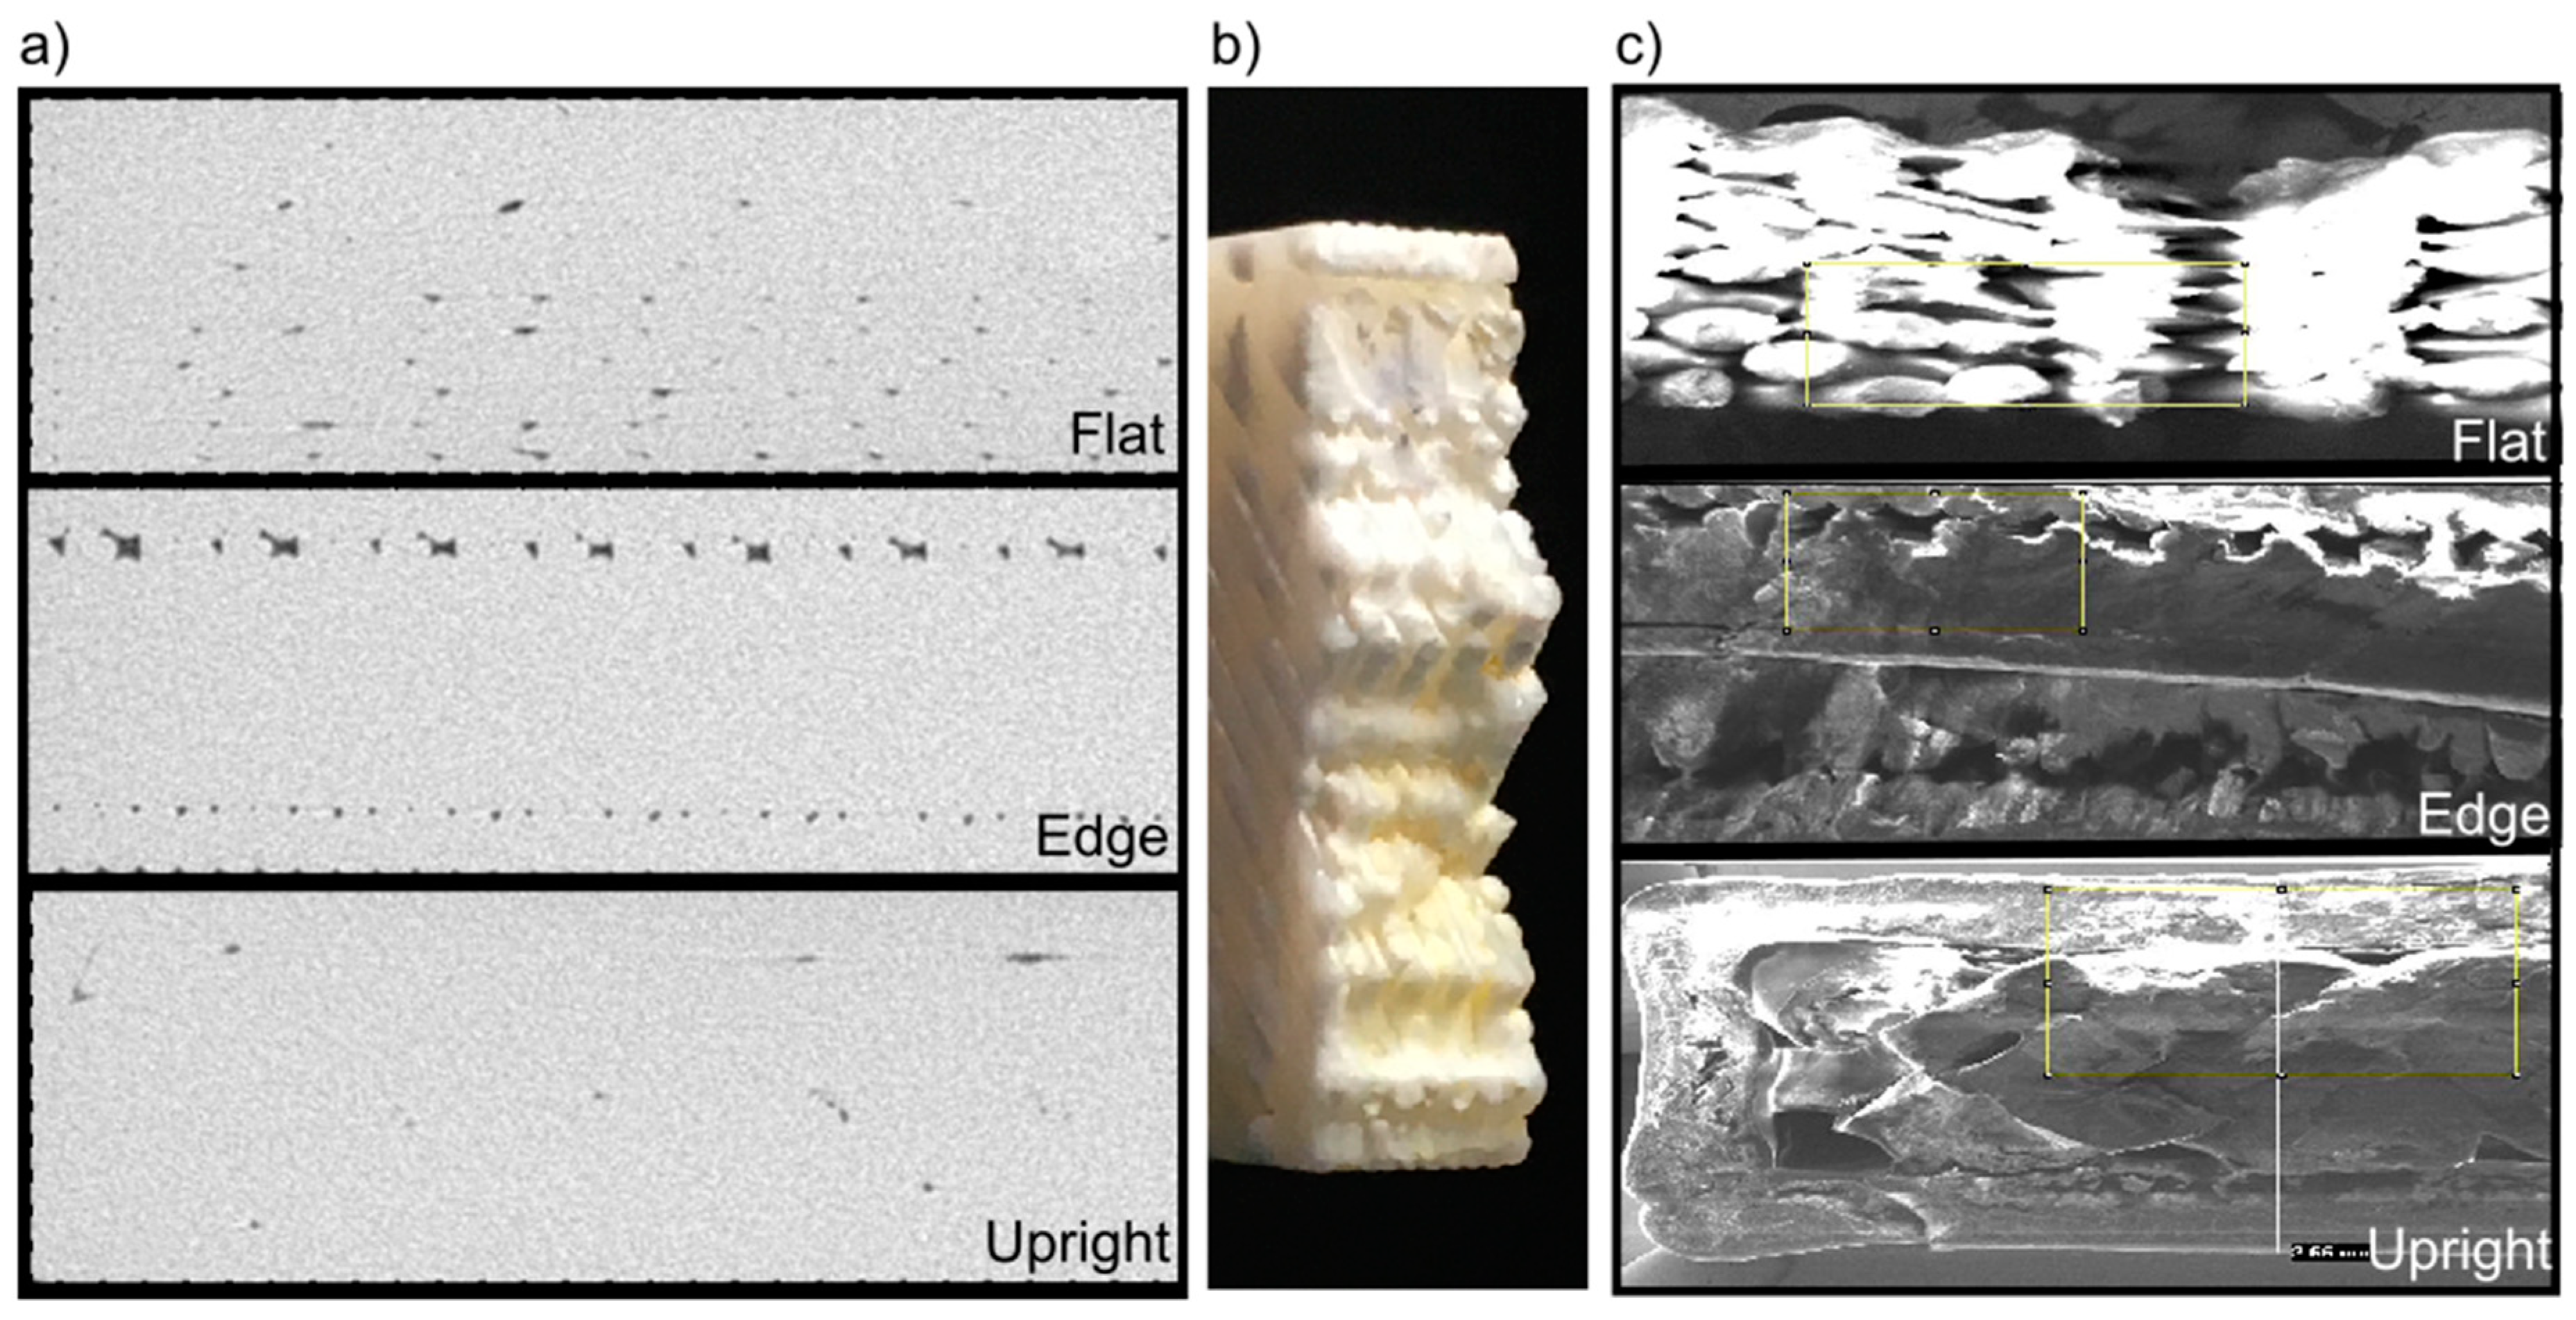
2.1. Samples
2.2. CT Scan
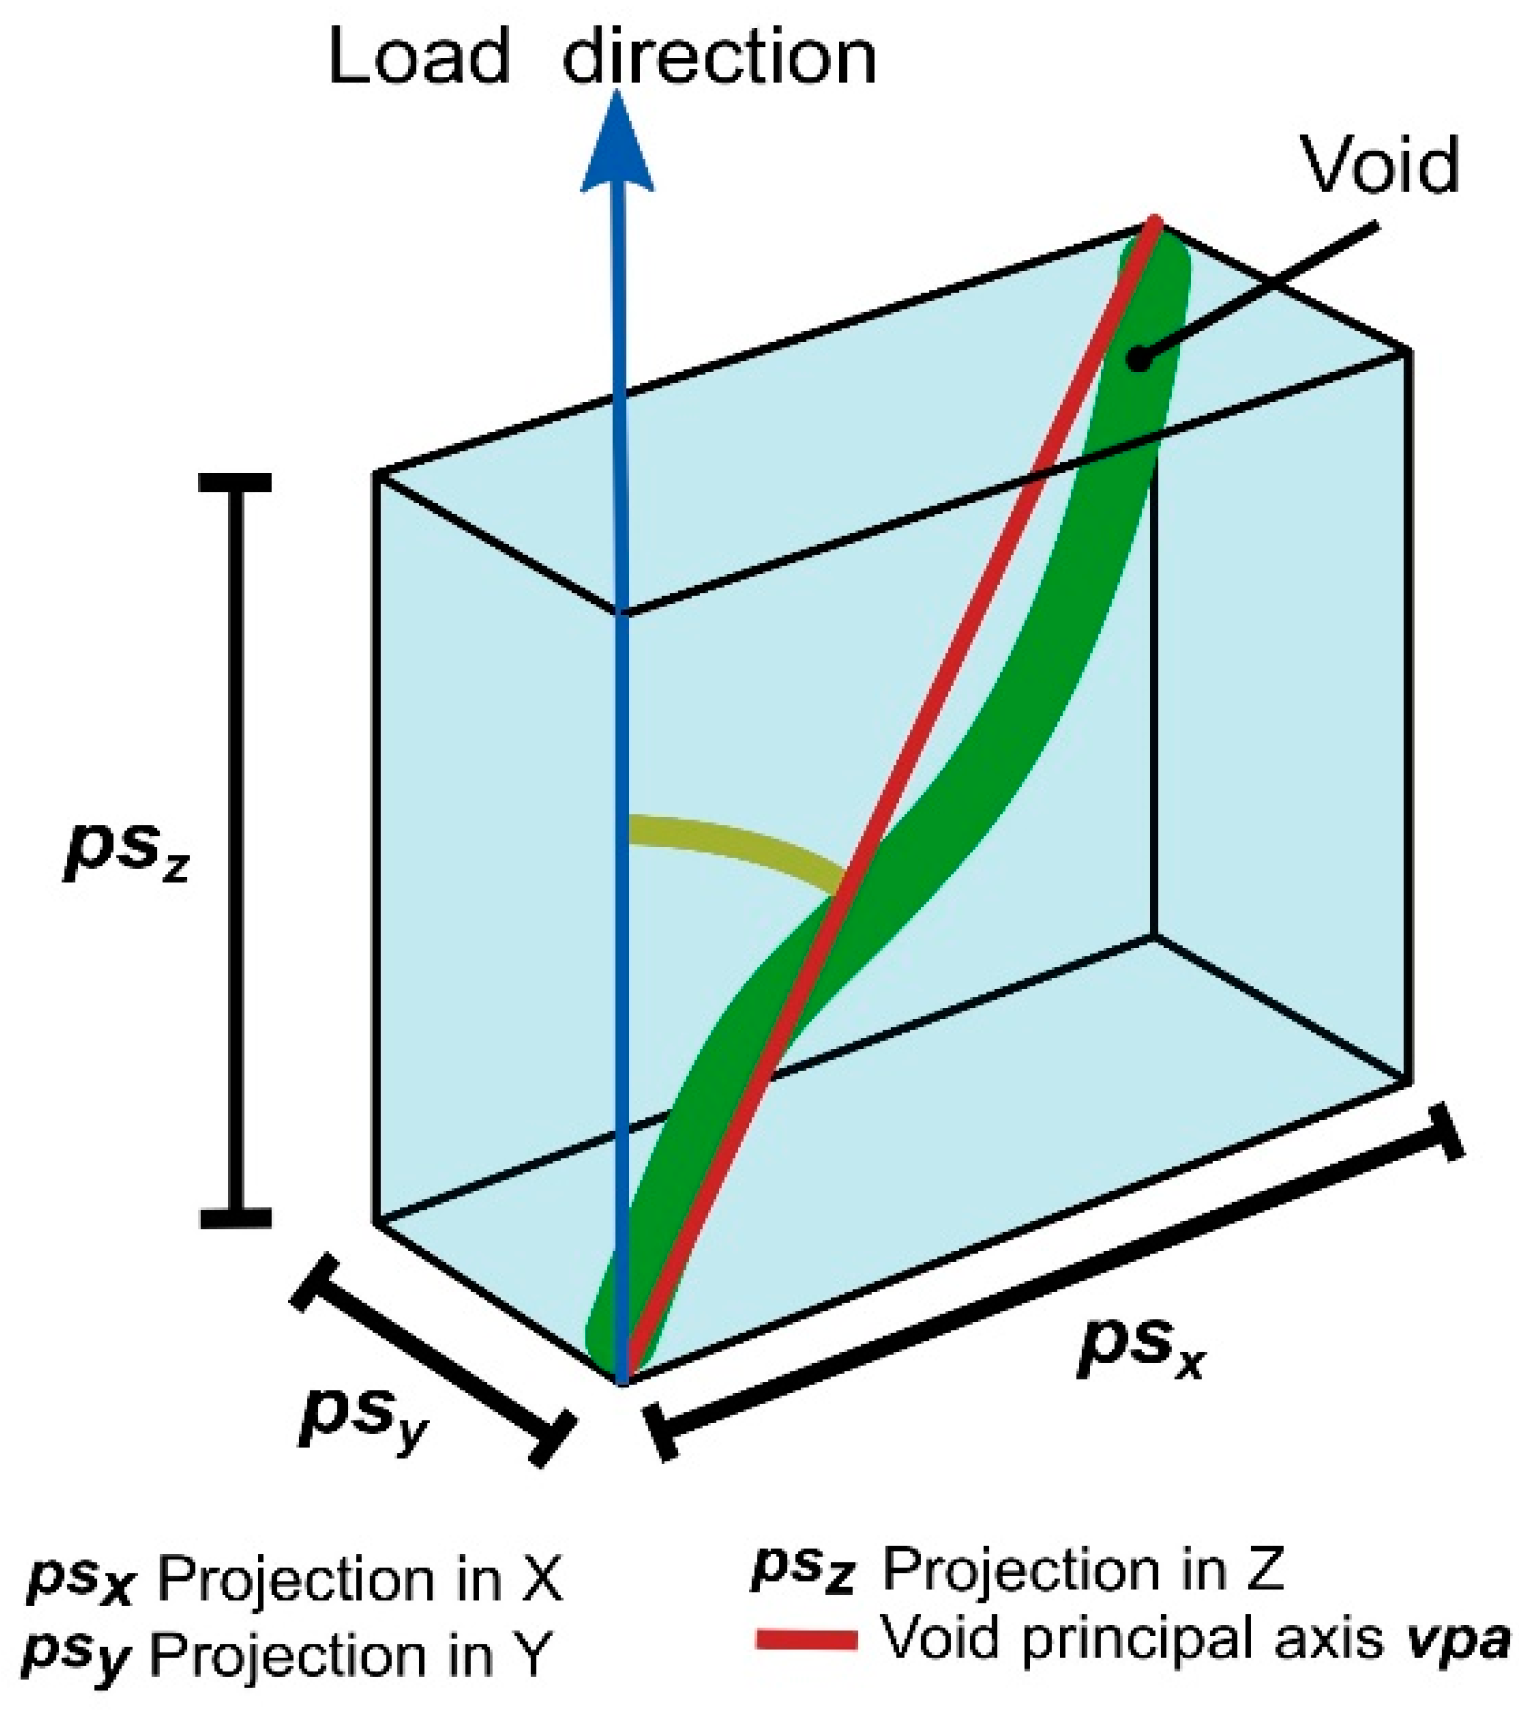
Voids Quantification
3. Results
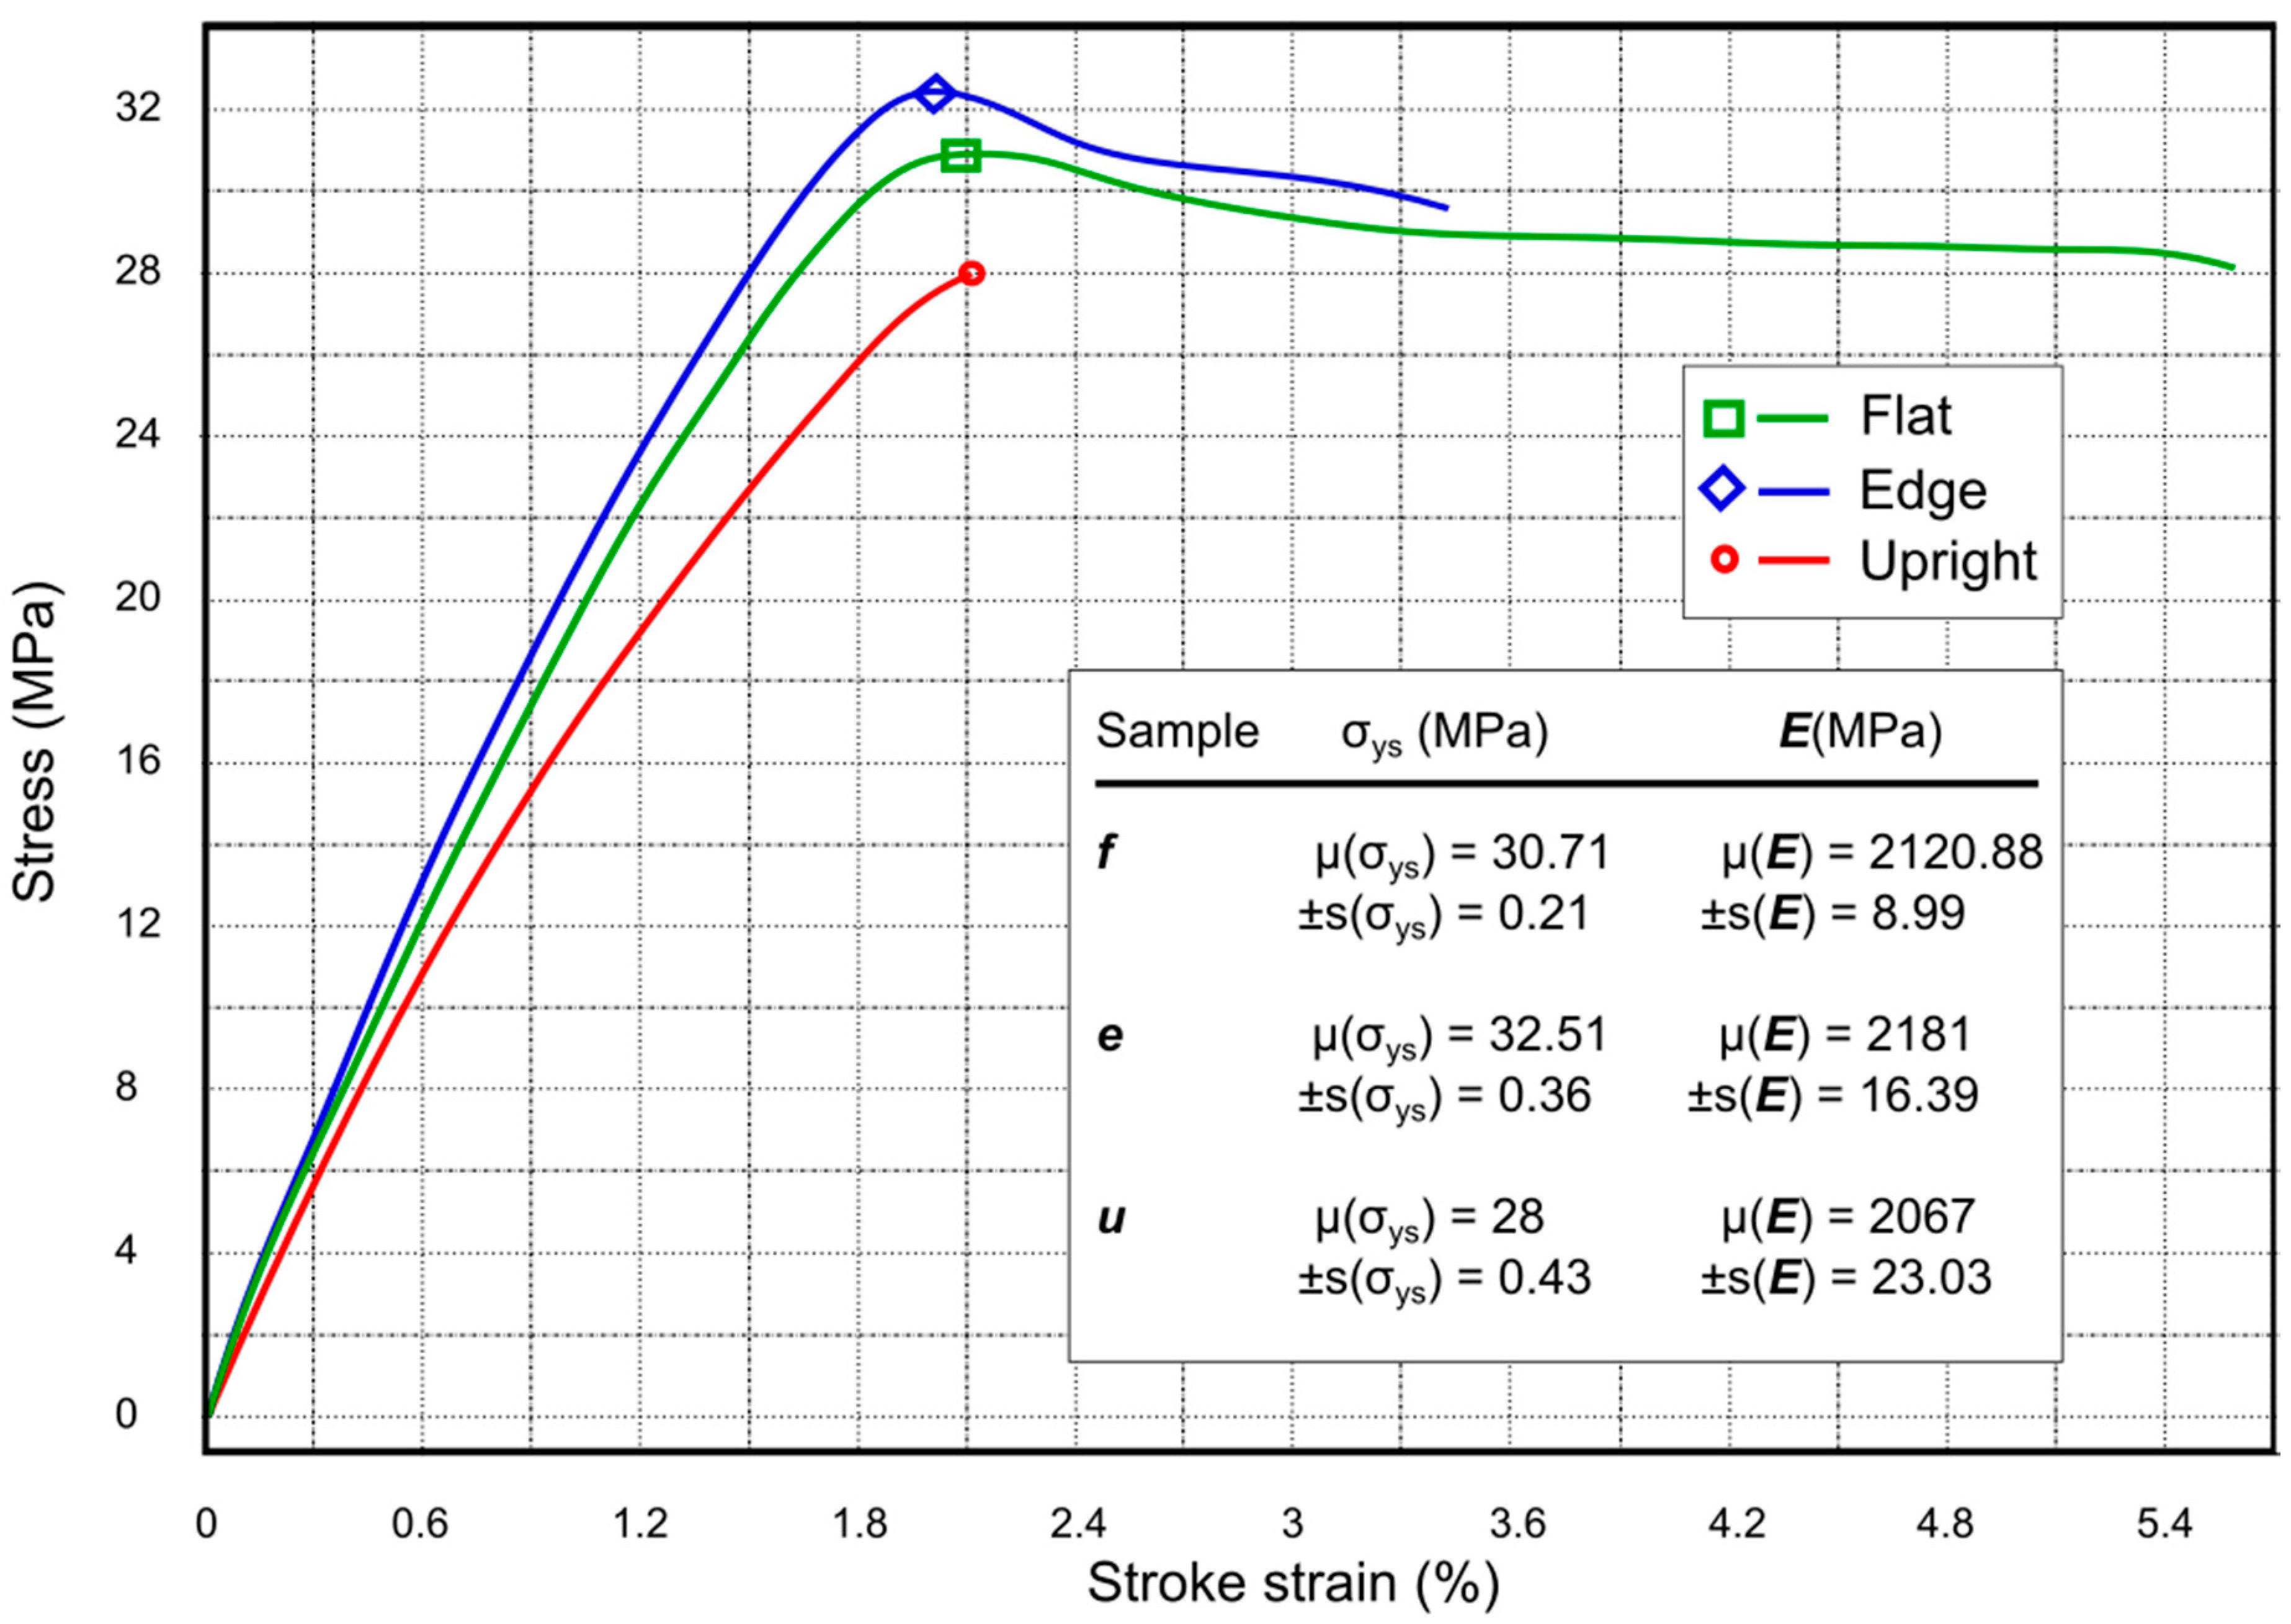
3.1. Tensile Test Results
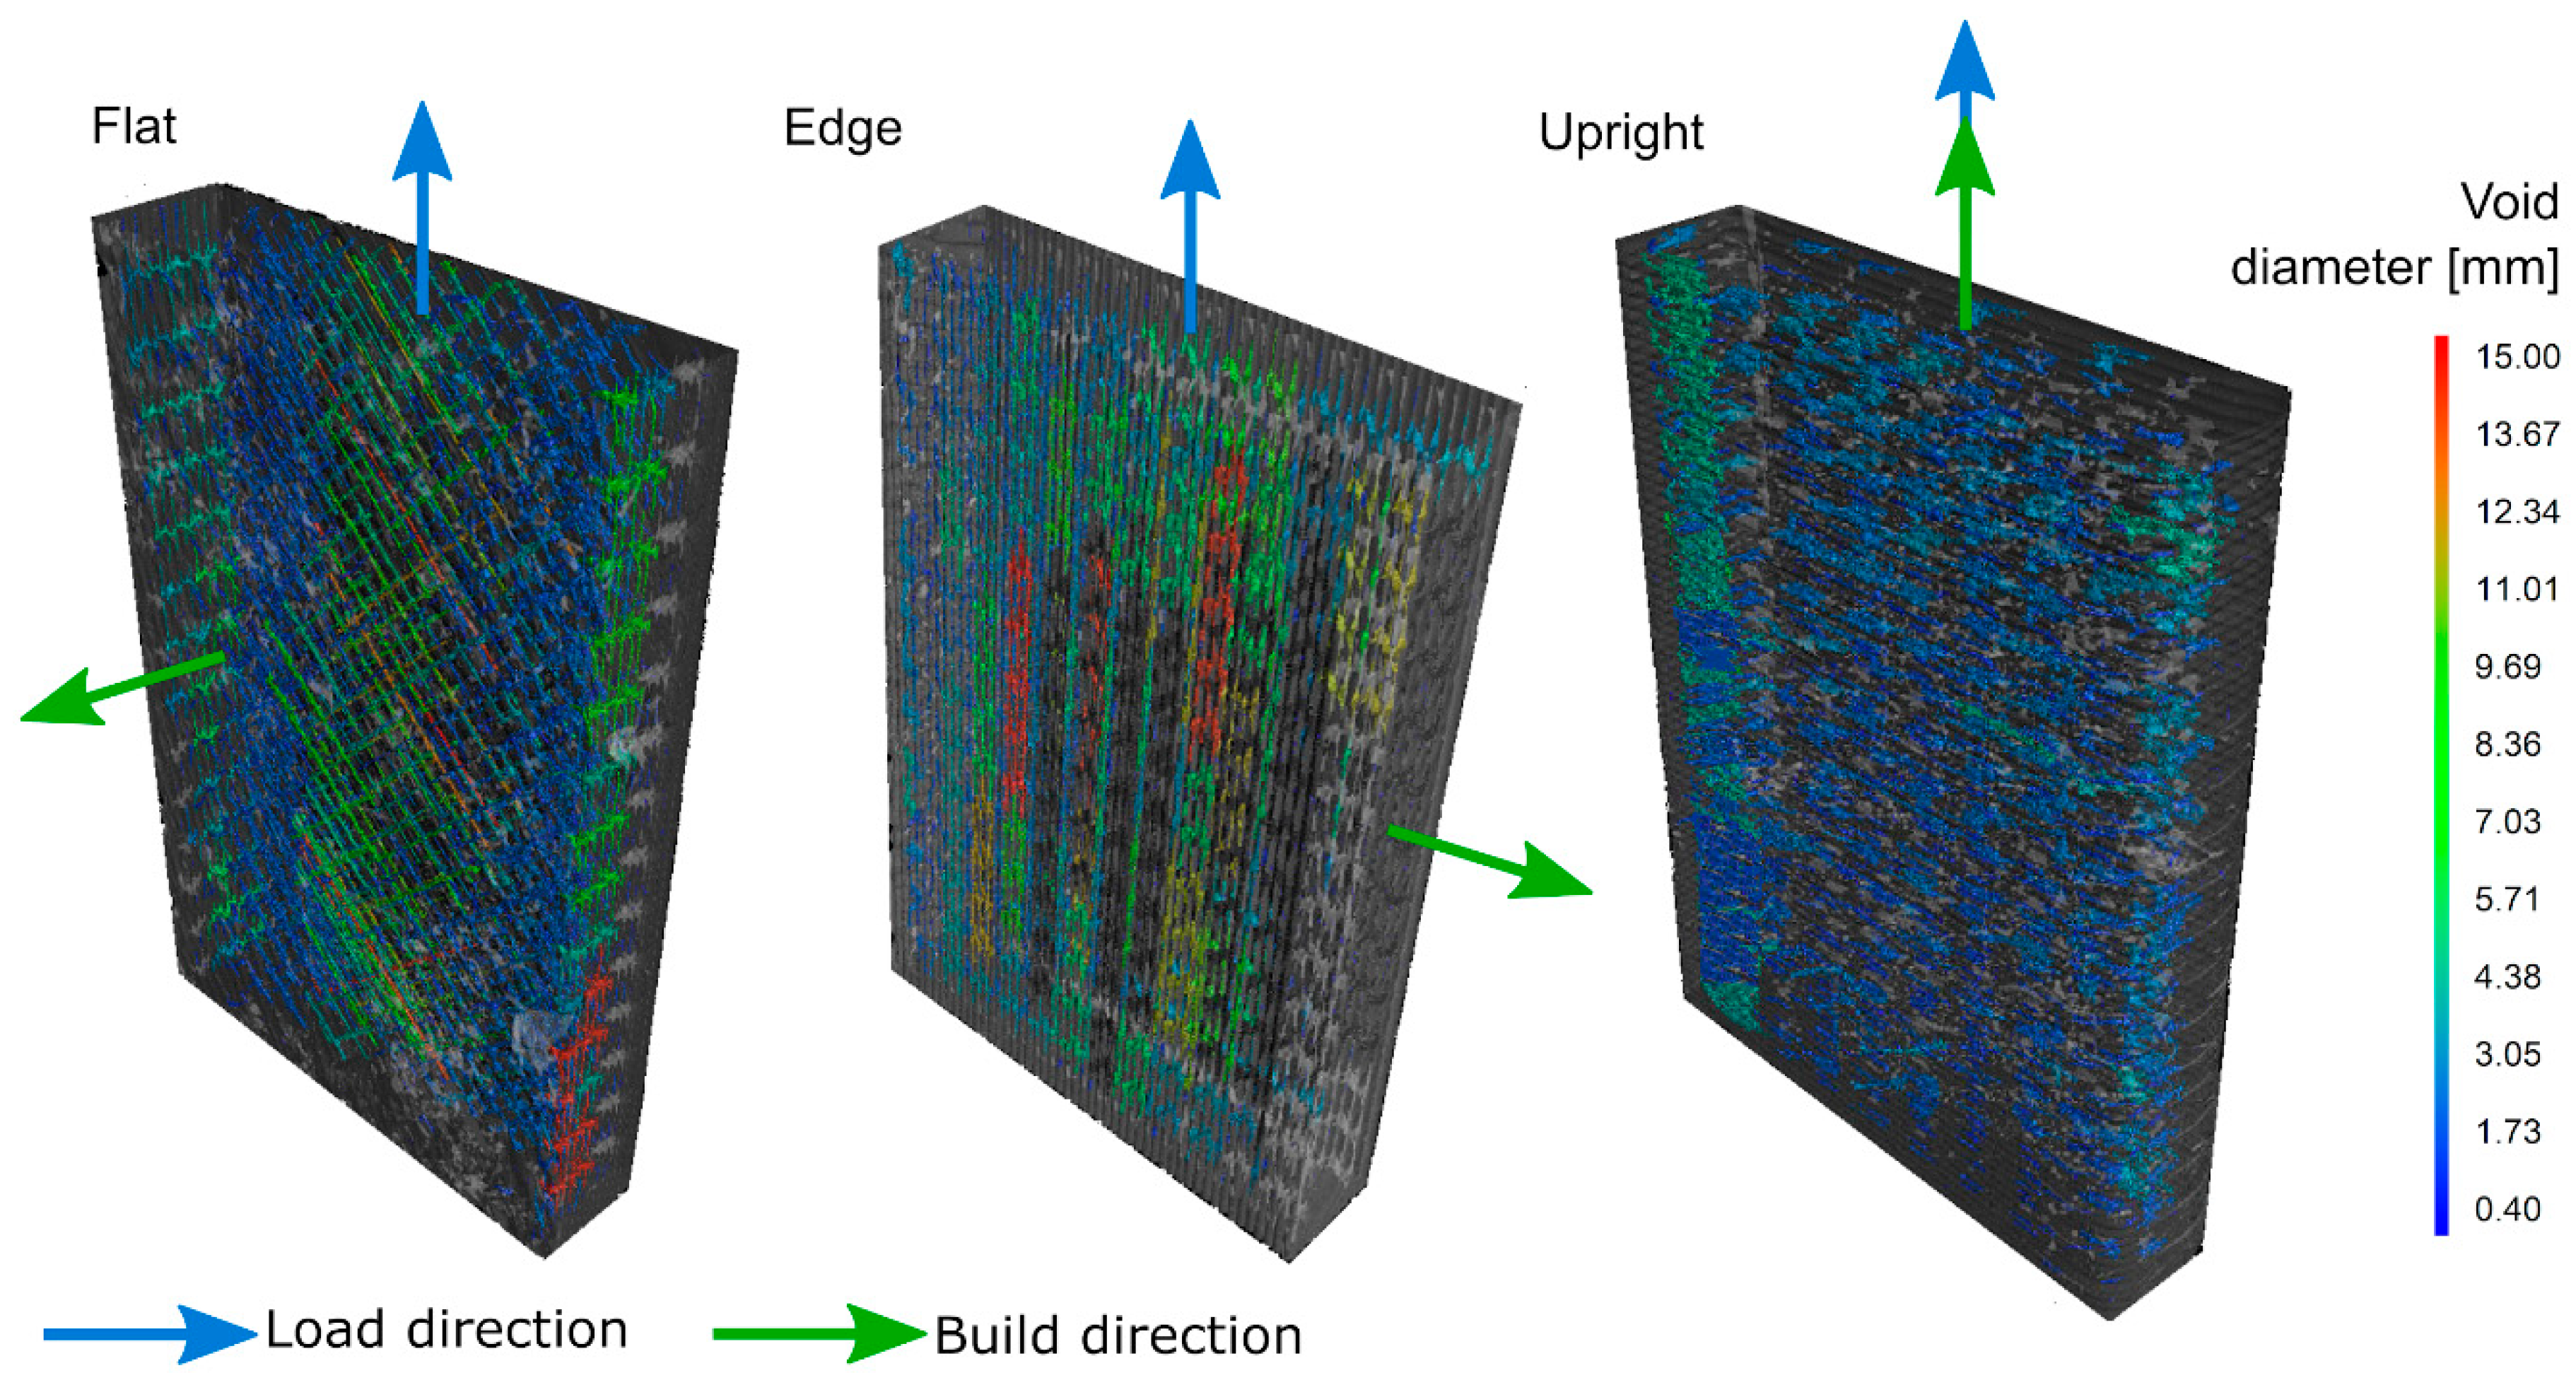
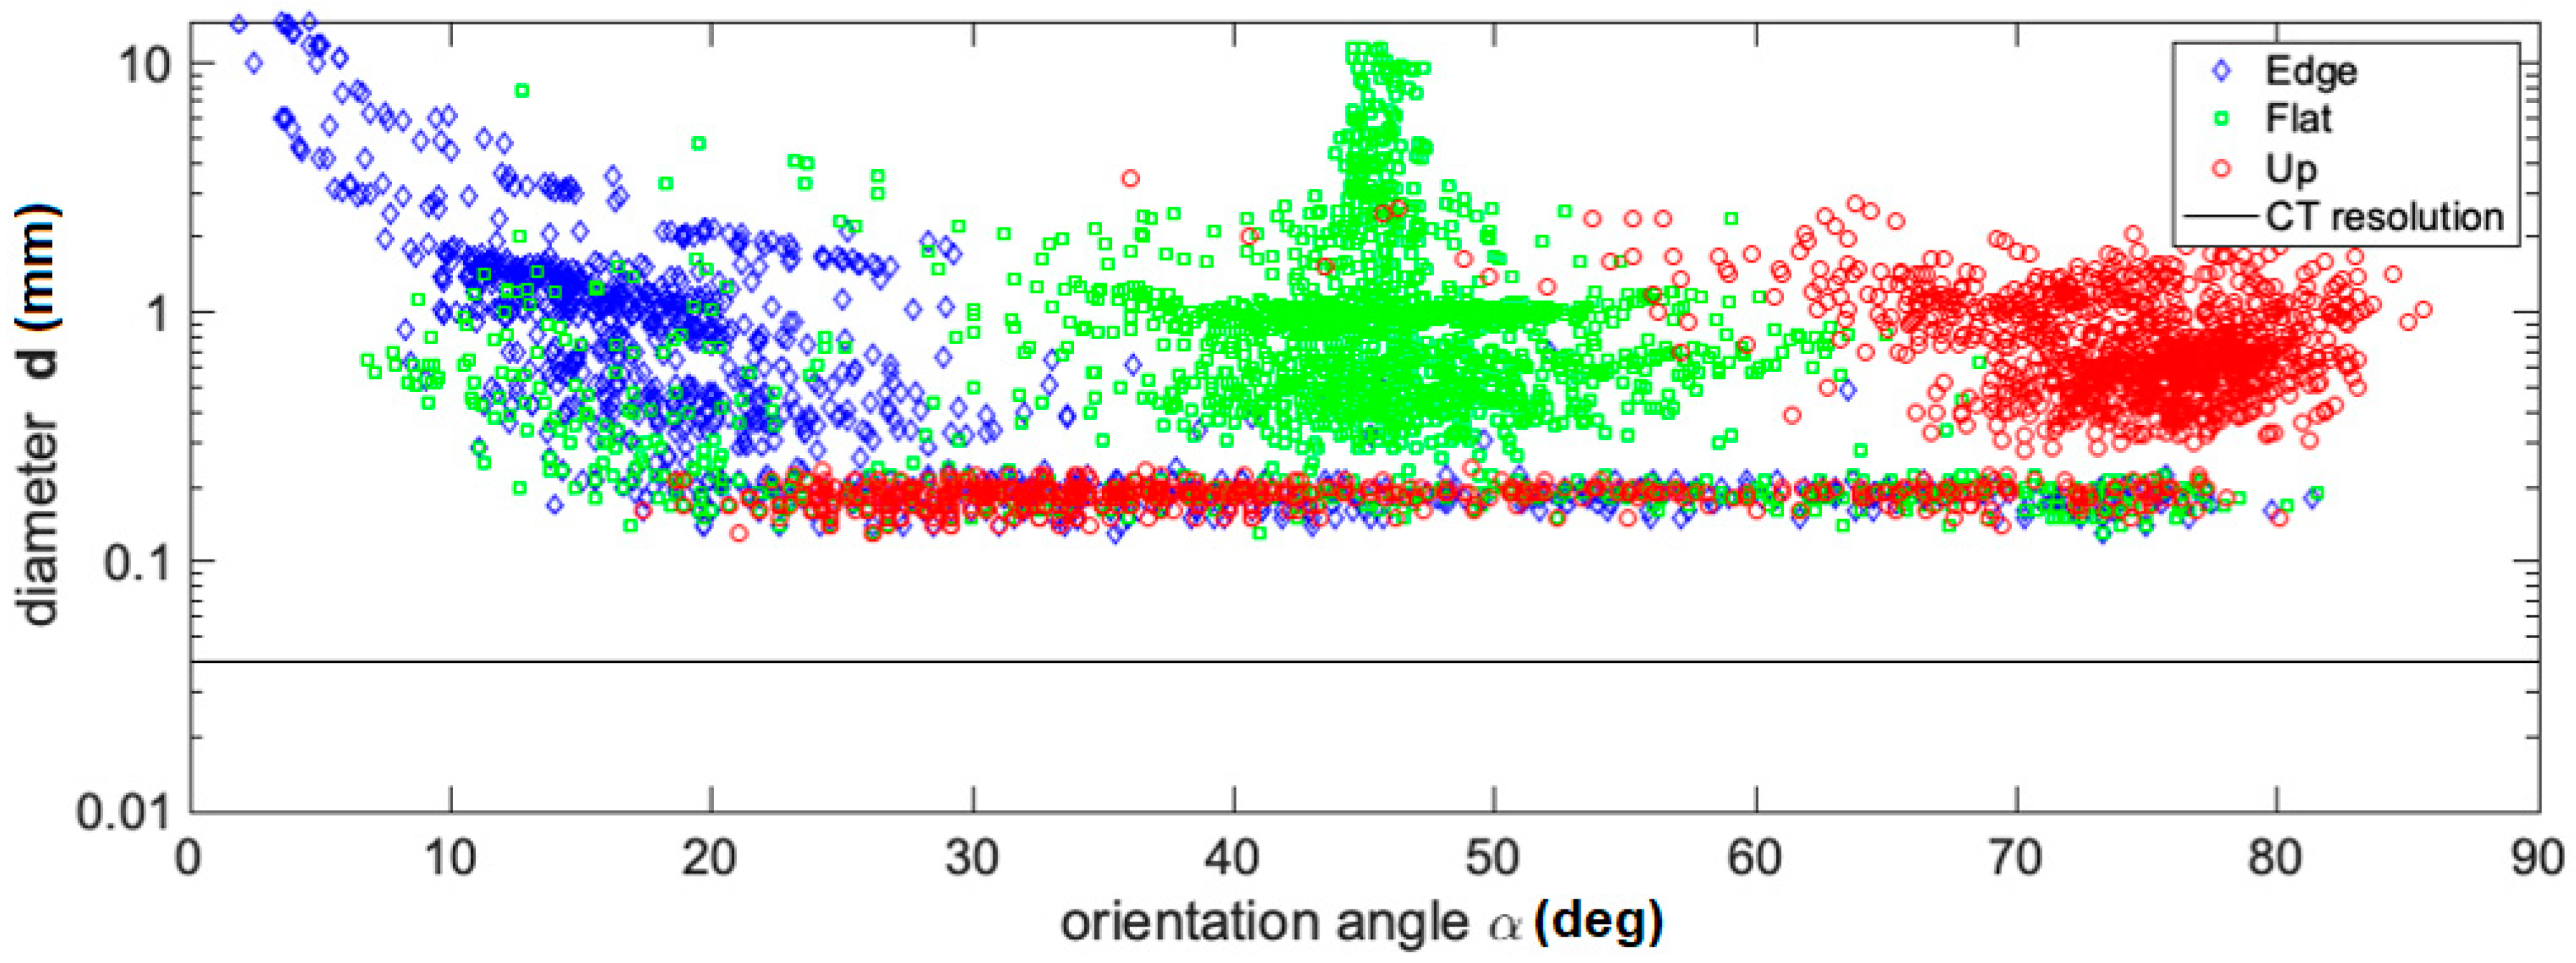
3.2. Void Analysis
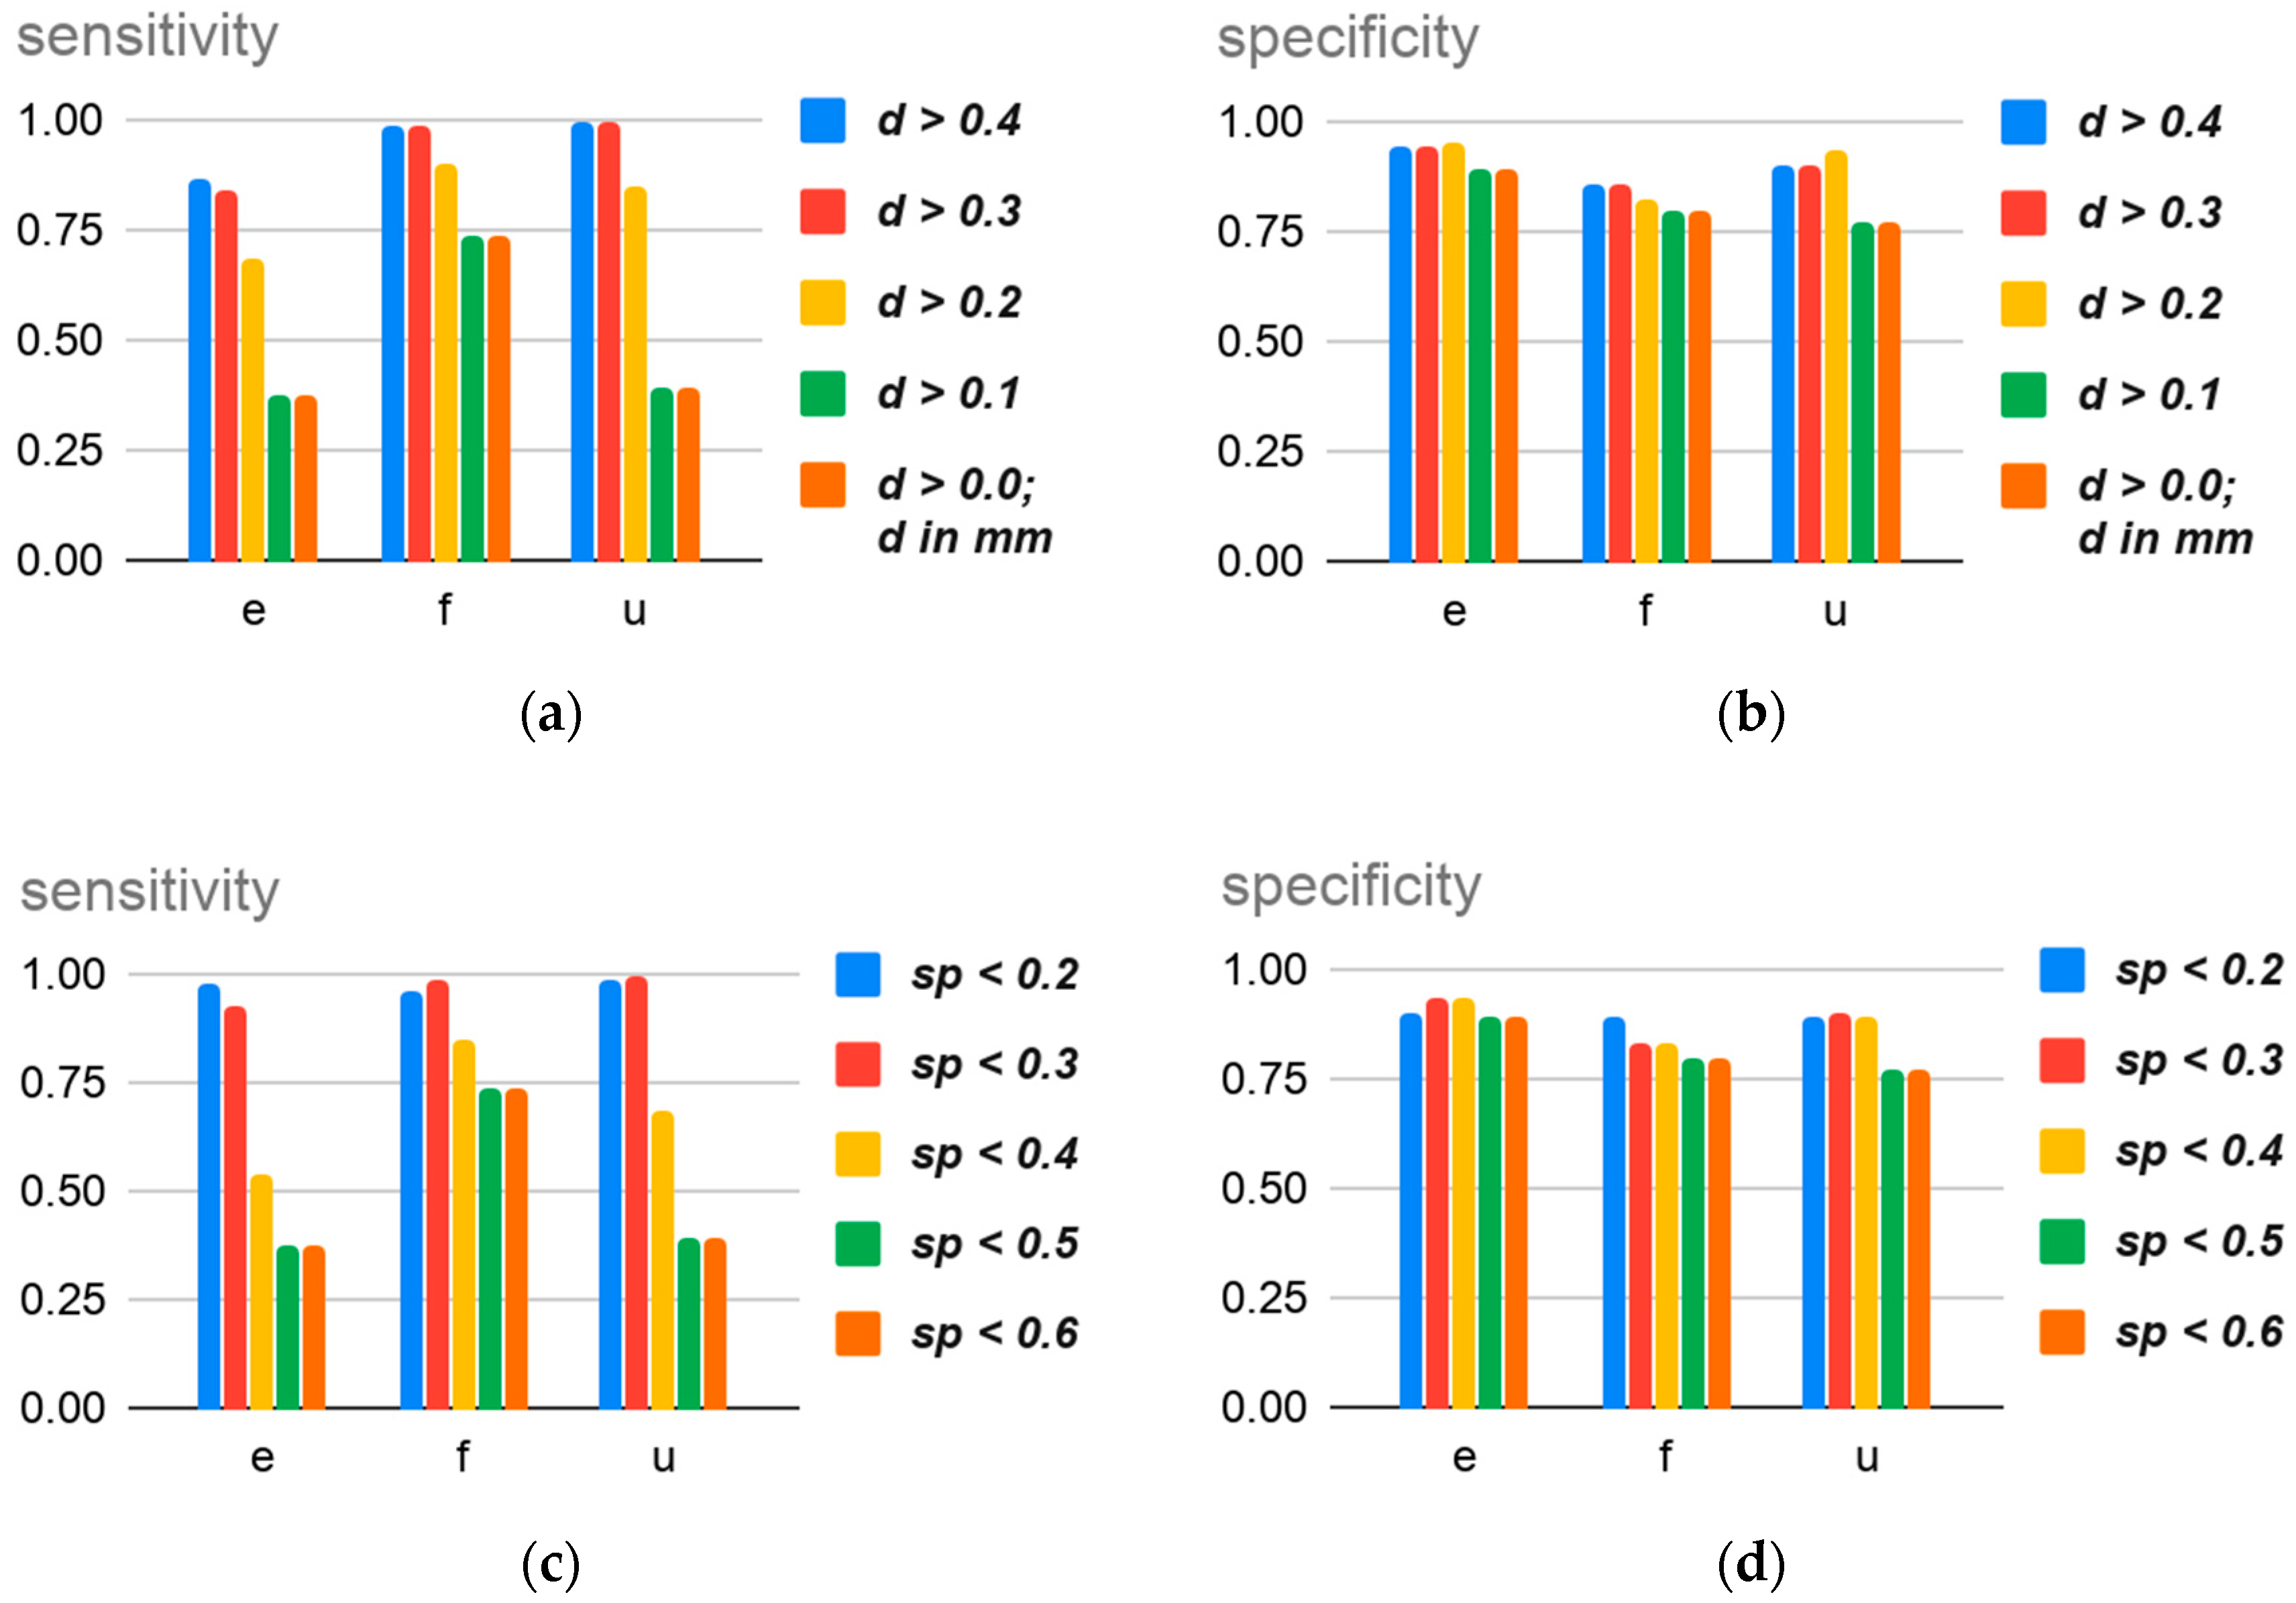
3.3. Sensibility and Specificity
4. Discussion
5. Conclusions
Author Contributions
Funding
Conflicts of Interest
References
- ISO/ASTM. Additive Manufacturing-General Principles; ASTM International: West Conshohocken, PA, USA, 2015. [Google Scholar]
- Guo, N.; Leu, M.C. Additive manufacturing: Technology, applications and research needs. Front. Mech. Eng. Chin. 2013, 8, 215–243. [Google Scholar] [CrossRef]
- Huang, Y.; Leu, M.C.; Mazumder, J.; Donmez, A. Additive manufacturing: Current state, future potential, gaps and needs, and recommendations. J. Manuf. Sci. Eng. 2015, 137, 014001. [Google Scholar] [CrossRef]
- Thomas, D. Costs, benefits, and adoption of additive manufacturing: A supply chain perspective. Int. J. Adv. Manuf. Technol. 2016, 85, 1857–1876. [Google Scholar] [CrossRef] [PubMed]
- Hazrat, A.M. 3D printing: A critical review of current development and future prospects. Rapid Prototyp. J. 2019, 25, 1108–1126. [Google Scholar] [CrossRef]
- Kritzinger, W.; Steinwender, A.; Lumetzberger, S.; Sihn, W. Impacts of additive manufacturing in value creation system. Procedia CIRP 2018, 72, 1518–1523. [Google Scholar] [CrossRef]
- Seifi, M.; Salem, A.A.; Satko, D.P.; Grylls, R.; Lewandowski, J.J. Effects of post-processing on microstructure and mechanical properties of SLM-processed IN-718. In Proceedings of the 9th International Symposium on Superalloy 718 and Derivatives: Energy, Aerospace, and Industrial Applications, Pittsburgh, PA, USA, 3–6 June 2018; Jablonski, P., Kaplan, M., Liu, X., Andersson, J., Bi, Z., Dempster, I., Sudbrack, C., Bockenstedt, K., Groh, J., Nagahama, D., et al., Eds.; Springer International Publishing: Berlin/Heidelberg, Germany, June 2018; pp. 515–526. [Google Scholar] [CrossRef]
- Medellin-Castillo, H.I.; Zaragoza-Siqueiros, J. Design and manufacturing strategies for fused deposition modelling in additive manufacturing: A review. Chin. J. Mech. Eng. 2019, 32, 53. [Google Scholar] [CrossRef]
- Bahnini, I.; Rivette, M.; Rechia, A.; Siadat, A.; Elmesbahi, A. Additive manufacturing technology: The status, applications, and prospects. Int. J. Adv. Manuf. Technol. 2018, 97, 147–161. [Google Scholar] [CrossRef]
- Singh, S.; Ramakrishna, S.; Singh, R. Material issues in additive manufacturing: A review. J. Manuf. Process. 2017, 25, 185–200. [Google Scholar] [CrossRef]
- Ahn, S.; Montero, M.; Odell, D.; Roundy, S.; Wright, P.K. Anisotropic material properties of fused deposition modeling ABS. Rapid Prototyp. J. 2002, 8, 248–257. [Google Scholar] [CrossRef]
- Es-Said, O.S.; Foyos, J.; Noorani, R.; Mendelson, M.; Marloth, R.; Pregger, B.A. Effect of layer orientation on mechanical properties of rapid prototyped samples. Mater. Manuf. Process. 2000, 15, 107–122. [Google Scholar] [CrossRef]
- Durgun, I.; Ertan, R. Experimental investigation of FDM process for improvement of mechanical properties and production cost. Rapid Prototyp. J. 2014, 20, 228–235. [Google Scholar] [CrossRef]
- Croccolo, D.; De Agostinis, M.; Olmi, G. Experimental characterization and analytical modelling of the mechanical behaviour of fused deposition processed parts made of ABS-M30. Comput. Mater. Sci. 2013, 79, 506–518. [Google Scholar] [CrossRef]
- Gurrala, P.K.; Regalla, S.P. Part strength evolution with bonding between filaments in fused deposition modelling. Virtual Phys. Prototyp. 2014, 9, 141–149. [Google Scholar] [CrossRef]
- Koch, C.; Van Hulle, L.; Rudolph, N. Investigation of mechanical anisotropy of the fused filament fabrication process via customized tool path generation. Addit. Manuf. 2017, 16, 138–145. [Google Scholar] [CrossRef]
- Cantrell, J.T.; Rohde, S.; Damiani, D.; Gurnani, R.; DiSandro, L.; Anton, J.; Young, A.; Jerez, A.; Steinbach, D.; Kroese, C.; et al. Experimental characterization of the mechanical properties of 3D-printed ABS and polycarbonate parts. Rapid Prototyp. J. 2017, 23, 811–824. [Google Scholar] [CrossRef]
- Alcisto, J.; Enriquez, A.; Garcia, H.; Hinkson, S.; Steelman, T.; Silverman, E.; Valdovino, P.; Gigerenzer, H.; Foyos, J.; Ogren, J.; et al. Tensile properties and microstructures of laser-formed Ti-6Al-4V. J. Mater. Eng. Perform. 2011, 20, 203–212. [Google Scholar] [CrossRef]
- Yadollahi, A.; Shamsaei, N. Additive manufacturing of fatigue resistant materials: Challenges and opportunities. Int. J. Fatigue 2017, 98, 14–31. [Google Scholar] [CrossRef]
- Chlebus, E.; Kuźnicka, B.; Kurzynowski, T.; Dybała, B. Microstructure and mechanical behaviour of Ti-6Al-7Nb alloy produced by selective laser melting. Mater. Charact. 2011, 62, 488–495. [Google Scholar] [CrossRef]
- Fatimatuzahraa, A.W.; Farahaina, B.; Yusoff, W.A.Y. The effect of employing different raster orientations on the mechanical properties and microstructure of Fused Deposition Modeling parts. In Proceedings of the 2011 IEEE Symposium on Business, Engineering and Industrial Applications (ISBEIA), Langkawi, Malaysia, 25–28 September 2011; pp. 22–27. [Google Scholar] [CrossRef]
- Furumoto, T.; Koizumi, A.; Alkahari, M.R.; Anayama, R.; Hosokawa, A.; Tanaka, R.; Ueda, T. Permeability and strength of a porous metal structure fabricated by additive manufacturing. J. Mater. Process. Technol. 2015, 219, 10–16. [Google Scholar] [CrossRef]
- Siddique, S.; Imran, M.; Rauer, M.; Kaloudis, M.; Wycisk, E.; Emmelmann, C.; Walther, F. Computed tomography for characterization of fatigue performance of selective laser melted parts. Mater. Des. 2015, 83, 661–669. [Google Scholar] [CrossRef]
- du Plessis, A.; Yadroitsev, I.; Yadroitsava, I.; Le Roux, S.G. X-Ray microcomputed tomography in additive manufacturing: A review of the current technology and applications. 3D Print Addit. Manuf. 2018, 5, 227–247. [Google Scholar] [CrossRef]
- Du Plessis, A.; Le Roux, S.G.; Booysen, G.; Els, J. Directionality of cavities and porosity formation in powder-bed laser additive manufacturing of metal components investigated using X-ray tomography. 3D Print Addit. Manuf. 2016, 3, 48–55. [Google Scholar] [CrossRef]
- Czichos, H.; Saito, T.; Smith, L.E. Springer Handbook of Metrology and Testing; Springer: Berlin/Heidelberg, Germany, 2011. [Google Scholar]
- Summerscales, J. Non-Destructive Testing of Fibre-Reinforced Plastics Composites; Springer: Dordrecht, The Netherlands, 1990. [Google Scholar]
- Busse, G.; Van Hemelrijck, D.; Solodov, I.; Anastasopoulos, A. Emerging Technologies in NDT; CRC Press: Florida, FL, USA, 2008. [Google Scholar]
- Swinehart, D.F. The beer-lambert law. J. Chem. Educ. 1962, 39, 333. [Google Scholar] [CrossRef]
- Carmignato, S.; Dewulf, W.; Leach, R. Industrial X-Ray Computed Tomography; Springer International Publishing: Berlin/Heidelberg, Germany, 2018. [Google Scholar]
- Dewulf, W.; Kiekens, K.; Tan, Y.; Welkenhuyzen, F.; Kruth, J.-P. Uncertainty determination and quantification for dimensional measurements with industrial computed tomography. Manuf. Tech. 2013, 62, 535–538. [Google Scholar] [CrossRef]
- Xue, L.; Suzuki, H.; Ohtake, Y.; Fujimoto, H.; Abe, M.; Sato, O.; Takatsuji, T. A method for improving measurement accuracy of cylinders in dimensional CT metrology. Comput. Aided Des. Appl. 2015, 69, 25–34. [Google Scholar] [CrossRef]
- Yagüe-Fabra, J.A.; Ontiveros, S.; Jiménez, R.; Chitchian, S.; Tosello, G.; Carmignato, S. A 3D edge detection technique for surface extraction in computed tomography for dimensional metrology applications. CIRP Ann. 2013, 62, 531–534. [Google Scholar] [CrossRef]
- Kittler, J.; Illingworth, J. Minimum error thresholding. Pattern Recognit. 1986, 19, 41–47. [Google Scholar] [CrossRef]
- Abera, K.A.; Manahiloh, K.N.; Motalleb Nejad, M. The effectiveness of global thresholding techniques in segmenting two-phase porous media. Constr. Build Mater. 2017, 142, 256–267. [Google Scholar] [CrossRef]
- Nobuyuki, O. A threshold selection method from Gray-Level Histograms. IEEE Trans. Syst. Man Cybern. 1979, 9, 62–66. [Google Scholar]
- Volume Graphics. VGStudiomax 3.3 Reference Manual; Volume Graphics GmbH: Heidelberg, Germany, 2019. [Google Scholar]
- Zhao, B.; Wang, J. 3D quantitative shape analysis on form, roundness, and compactness with μCT. Powder Technol. 2016, 291, 262–275. [Google Scholar] [CrossRef]
- Buffham, B.A. The size and compactness of particles of arbitrary shape: Application to catalyst e ectiveness factors. Chem. Eng. Sci. 2000, 55, 5803. [Google Scholar] [CrossRef]
- Wadell, H. Sphericity and roundness of rock particles. J. Geol. 1933, 41, 310–331. [Google Scholar] [CrossRef]
- Kubo, K.; Pehlke, R.D. Mathematical modeling of porosity formation in solidification. Metall. Mater. Trans. B 1985, 16, 359–366. [Google Scholar] [CrossRef]
- Fang, Q.T.; Granger, D.A. Porosity formation in modified and unmodified A356 alloy castings. AFS Trans. 1989, 97, 989–1000. [Google Scholar]
- Roy, N.; Samuel, A.M.; Samuel, F.H. Porosity formation in AI-9 Wt Pct Si-3 Wt Pct Cu alloy systems: Metallographic observations. Metall. Mater. Trans. A 1996, 27, 415–429. [Google Scholar] [CrossRef]
- Han, C.D.; Yoo, H.J. Studies on structural foam processing. IV. Bubble growth during mold filling. Polym. Eng. Sci. 1981, 21, 518–533. [Google Scholar] [CrossRef]
- Jeong, H. Effects of voids on the mechanical strength and ultrasonic attenuation of laminated composites. J. Compos. Mater. 1997, 31, 276–292. [Google Scholar] [CrossRef]
- Chambers, A.R.; Earl, J.S.; Squires, C.A.; Suhot, M.A. The effect of voids on the flexural fatigue performance of unidirectional carbon fibre composites developed for wind turbine applications. Int. J. Fatigue 2006, 28, 1389–1398. [Google Scholar] [CrossRef]
- Kim, F.H.; Moylan, S.P.; Garboczi, E.J.; Slotwinski, J.A. Investigation of pore structure in cobalt chrome additively manufactured parts using X-ray computed tomography and three-dimensional image analysis. Addit. Manuf. 2017, 17, 23–38. [Google Scholar] [CrossRef]
- Cunningham, R.; Narra, S.P.; Montgomery, C.; Beuth, J.; Rollett, A.D. Synchrotron-based X-ray microtomography characterization of the effect of processing variables on porosity formation in laser power-bed additive manufacturing of Ti-6Al-4V. JOM 2017, 69, 479–484. [Google Scholar] [CrossRef]
- Salam, I.; Tauqir, A.; Khan, A.Q. Creep-fatigue failure of an aero engine turbine blades. Eng. Fail. Anal. 2002, 9, 335–347. [Google Scholar] [CrossRef]
- Pridemore, W.D. Stress-rupture characterization in nickel-based superalloy gas turbine engine components. J. Fail. Anal. Prev. 2008, 8, 281–288. [Google Scholar] [CrossRef]
- Versnyder, F.I.; Shank, M.E. The development of columnar grain and single crystal high temperature materials through directional solidification. Mater. Sci. Eng. 1970, 6, 213–247. [Google Scholar] [CrossRef]
- Chawla, N.; Deng, X. Microstructure and mechanical behavior of porous sintered steels. Mater. Sci. Eng. A 2005, 390, 98–112. [Google Scholar] [CrossRef]
- Sui, D.; Cui, Z.; Wang, R.; Hao, S.; Han, Q. Effect of cooling process on porosity in the aluminum alloy automotive wheel during low-pressure die casting. Int. J. Metalcast. 2016, 10, 32–42. [Google Scholar] [CrossRef]
- Islam, M.A.; Farhat, Z.N. The influence of porosity and hot isostatic pressing treatment on wear characteristics of cast and P/M aluminum alloys. Wear 2011, 271, 1594–1601. [Google Scholar] [CrossRef]
- Hancox, N.L. The effects of flaws and voids on the shear properties of CFRP. J. Mater. Sci. 1977, 12, 884–892. [Google Scholar] [CrossRef]
- Judd, N.C.W.; Wright, W.W. Voids and their effects on the mechanical properties of composites. An approvisal. SAMPE J. 1978, 14, 10–14. [Google Scholar]
- Lambert, J.; Chambers, A.R.; Sinclair, I.; Spearing, S.M. 3D damage characterisation and the role of voids in the fatigue of wind turbine blade materials. Compos. Sci. Technol. 2012, 72, 337–343. [Google Scholar] [CrossRef]
- Lee, H.; Kim, J.-H.J.; Moon, J.-H.; Kim, W.-W.; Seo, E.-A. Correlation between pore characteristics and tensile bond strength of additive manufactured mortar using X-ray computed tomography. Constr. Build Mater. 2019, 226, 712–720. [Google Scholar] [CrossRef]
- Arthurs, B.; Bull, D.J.; Arumugam, V.; Chambers, A.R.; Santulli, C. Porosity effect on residual flexural strength following low energy impact of carbon fibre composites. Polym. Polym. Compos. 2015, 23, 205–212. [Google Scholar] [CrossRef]
- Stamopoulos, A.G.; Tserpes, K.I.; Prucha, P.; Vavrik, D. Evaluation of porosity effects on the mechanical properties of carbon fiber-reinforced plastic unidirectional laminates by X-ray computed tomography and mechanical testing. J. Compos. Mater. 2016, 50, 2087–2098. [Google Scholar] [CrossRef]
- Liu, D.-M. Influence of porosity and pore size on the compressive strength of porous hydroxyapatite ceramic. Ceram. Int. 1997, 23, 135–139. [Google Scholar] [CrossRef]
- Anand, S.S.; Mohan, B.; Parthasarathy, T.R. Effect of slow cooling in reducing pore size in a sintered powder metallurgical 6061aluminium alloy. Mater. Sci. Appl. 2011, 2, 870–877. [Google Scholar] [CrossRef][Green Version]
- Zhu, H.-Y.; Li, D.-H.; Zhang, D.-X.; Wu, B.-C.; Chen, Y.-Y. Influence of voids on interlaminar shear strength of carbon/epoxy fabric laminates. Trans. Nonferrous Met. Soc. China 2009, 19, s470–s475. [Google Scholar] [CrossRef]
- Brenken, B.; Barocio, E.; Favaloro, A.; Kunc, V.; Pipes, R.B. Fused filament fabrication of fiber-reinforced polymers: A review. Addit. Manuf. 2018, 21, 1–16. [Google Scholar] [CrossRef]
- Sun, Q.; Rizvi, G.M.; Bellehumeur, C.T.; Gu, P. Effect of processing conditions on the bonding quality of FDM polymer filaments. Rapid Prototyp. J. 2008, 14, 72–80. [Google Scholar] [CrossRef]
- Gibson, I.; Rosen, D.W.; Stucker, B. Additive Manufacturing Technologies; Springer: New York, NY, USA, 2010. [Google Scholar]
- Duty, C.E.; Kunc, V.; Compton, B.; Post, B.; Erdman, D.; Smith, R.; Lind, R.; Lloyd, P.; Love, L. Structure and mechanical behavior of Big Area Additive Manufacturing (BAAM) materials. Rapid Prototyp. J. 2017, 23, 181–189. [Google Scholar] [CrossRef]
- An, T.; Hwang, K.-T.; Kim, J.-H.; Kim, J. Extrusion-based 3D direct ink writing of NiZn-ferrite structures with viscoelastic ceramic suspension. Ceram. Int. 2020, 46, 6469–6476. [Google Scholar] [CrossRef]
- Skardal, A. Chapter 1—Bioprinting essentials of cell and protein viability. In Essentials of 3D Biofabrication and Translation; Atala, A., Yoo, J.J., Eds.; Academic Press: Cambridge, MA, USA, 2015; pp. 1–17. [Google Scholar] [CrossRef]
- Find Materials and Filaments for 3D Printing Stratasys. Available online: https://www.stratasys.com/materials/search?technologies=ff37d7b8297c4e43977c155d765f3305&sortIndex=0 (accessed on 20 January 2020).
- Jyothish Kumar, L.; Pulak, M.; Pandey, D.I. Wimpenny 3D Printing and Additive Manufacturing Technologies; Springer: Singapore, 2019. [Google Scholar]
- Kulkarni, P.; Dutta, D. Deposition strategies and resulting part stiffnesses in fused deposition modeling. J. Manuf. Sci. Eng. 1999, 121, 93–103. [Google Scholar] [CrossRef]
- Li, L.; Sun, Q.; Bellehumeur, C.; Gu, P. Investigation of bond formation in FDM process. In Solid Freeform Fabrication Symposium; University of Texas at Austin: Austin, TX, USA, 2002; pp. 400–407. [Google Scholar]
- ASTM International. ASTM D638 Standard Test Method for Tensile Properties of Plastics; ASTM International: West Conshohocken, PA, USA, 2010. [Google Scholar]
- Stratasys ABSM30 Production-Grade Thermoplastic for FDM 3D Printers; Stratasys Ldt.: Rehovot, Israel, 2009.
- Riddick, J.; Hall, A.; Haile, M.; Von Wahlde, R.; Cole, D.; Biggs, S. Effect of manufacturing parameters on failure in acrylonitrile-butadiane-styrene fabricated by fused deposition modeling. In Structures, Structural Dynamics, and Materials and Co-located Conferences, Proceedings of the 53rd AIAA/ASME/ASCE/AHS/ASC Structures, Structural Dynamics and Materials Conference, Honolulu, HI, USA, 23–26 April 2012; American Institute of Aeronautics and Astronautics: Hunter Mill, VA, USA, 2012. [Google Scholar] [CrossRef]
- Catacosinos, P. Tables for the determination of sphericity and shape of rock particles. J. Sediment. Petrol. 1965, 35, 354–363. [Google Scholar] [CrossRef]
- Yang, Y.; Chen, J.; Peng, Z.; Guo, Z.; Tang, T.; Hu, H.; Hu, Y. X-ray quantitative analysis on spallation response in high purity copper under sweeping detonation. Mater. Sci. Eng. A 2016, 667, 54–60. [Google Scholar] [CrossRef]
- Yang, Y.; Jixiong, C.; Zhaoliang, G.; Tiegang, T.; Haibo, H.; Yanan, F. 3-D characterization of incipient spallation response in cylindrical copper under sweeping detonation. J. Mater. Res. 2017, 32, 1499–1505. [Google Scholar] [CrossRef]
- Cole, D.P.; Riddick, J.C.; Iftekhar Jaim, H.M.; Strawhecker, K.E.; Zander, N.E. Interfacial mechanical behavior of 3D printed ABS. J. Appl. Polym. Sci. 2016, 133, 913. [Google Scholar] [CrossRef]
- Altman, D.G.; Bland, J.M. Diagnostic tests. 1: Sensitivity and specificity. Br. Med J. 1994, 308, 1552. [Google Scholar] [CrossRef] [PubMed]
- Rezayat, H.; Zhou, W.; Siriruk, A.; Penumadu, D.; Babu, S.S. Structure–mechanical property relationship in fused deposition modelling. Mater. Sci. Technol. 2015, 31, 895–903. [Google Scholar] [CrossRef]
- Garg, A.; Bhattacharya, A. An insight to the failure of FDM parts under tensile loading: Finite element analysis and experimental study. Int. J. Mech. Sci. 2017, 120, 225–236. [Google Scholar] [CrossRef]
- Guessasma, S.; Belhabib, S.; Nouri, H. Significance of pore percolation to drive anisotropic effects of 3D printed polymers revealed with X-ray μ-tomography and finite element computation. Polymer 2015, 81, 29–36. [Google Scholar] [CrossRef]
- Nouri, H.; Guessasma, S.; Belhabib, S. Structural imperfections in additive manufacturing perceived from the X-ray micro-tomography perspective. J. Mater. Process. Technol. 2016, 234, 113–124. [Google Scholar] [CrossRef]
- Nakajima, H. Fabrication, properties and application of porous metals with directional pores. Prog. Mater. Sci. 2007, 52, 1091–1173. [Google Scholar] [CrossRef]
- Ichitsubo, T.; Tane, M.; Ogi, H.; Hirao, M.; Ikeda, T.; Nakajima, H. Anisotropic elastic constants of lotus-type porous copper: Measurements and micromechanics modeling. Acta Mater. 2002, 50, 4105–4115. [Google Scholar] [CrossRef]
- Tane, M.; Ichitsubo, T.; Hyun, S.K.; Nakajima, H. Anisotropic yield behavior of lotus-type porous iron: Measurements and micromechanical mean-field analysis. J. Mater. Res. 2005, 20, 135–143. [Google Scholar] [CrossRef]
- Hyun, S.-K.; Ikeda, T.; Nakajima, H. Fabrication of lotus-type porous iron and its mechanical properties. Sci. Technol. Adv. Mater. 2004, 5, 201–205. [Google Scholar] [CrossRef]
- Romano, S.; Brandão, A.; Gumpinger, J.; Gschweitl, M.; Beretta, S. Qualification of AM parts: Extreme value statistics applied to tomographic measurements. Mater. Des. 2017, 131, 32–48. [Google Scholar] [CrossRef]


| Characteristic | Descriptor | μ and s | Flat | Edge | Upright |
|---|---|---|---|---|---|
| Void-to-volume ratio | Vr (%) | - | 0.682 | 0.690 | 0.587 |
| Size | d (mm) | μ(d) | 1.604 | 2.105 | 0.992 |
| s(d) | 1.741 | 2.367 | 0.204 | ||
| ps (mm) | μ(psₓ) μ(psy) μ(psz) | 0.210 1.137 1.202 | 0.254 0.338 2.099 | 0.440 0.854 0.331 | |
| s(psₓ) s(psy) s(psz) | 0.198 1.246 1.247 | 0.073 0.228 2.367 | 0.350 0.400 0.273 | ||
| pa (mm2) | μ(paxy) μ(paxz) | 0.100 0.113 | 0.049 0.250 | 0.121 0.077 | |
| s(paxy) s(paxz) | 0.119 0.158 | 0.050 0.382 | 0.102 0.088 | ||
| vx | μ(vx) | 3483.521 | 9412.199 | 5049.888 | |
| s(vx) | 5309.964 | 20,932.911 | 8606.976 | ||
| Shape | sp | μ(sp) | 0.239 | 0.241 | 0.246 |
| s(sp) | 0.043 | 0.048 | 0.043 | ||
| cp | μ(cp) | 0.008 | 0.0048 | 0.015 | |
| s(cp) | 0.006 | 0.005 | 0.007 |
| Characteristic | Descriptor | Flat | Edge | Upright | |
|---|---|---|---|---|---|
| Orientation | Angle α (degree) between the principal void axis and the load axis | μ | 44.822 | 15.134 | 73.257 |
| s | 7.084 | 5.801 | 6.355 |
© 2020 by the authors. Licensee MDPI, Basel, Switzerland. This article is an open access article distributed under the terms and conditions of the Creative Commons Attribution (CC BY) license (http://creativecommons.org/licenses/by/4.0/).
Share and Cite
Hernandez-Contreras, A.; Ruiz-Huerta, L.; Caballero-Ruiz, A.; Moock, V.; Siller, H.R. Extended CT Void Analysis in FDM Additive Manufacturing Components. Materials 2020, 13, 3831. https://doi.org/10.3390/ma13173831
Hernandez-Contreras A, Ruiz-Huerta L, Caballero-Ruiz A, Moock V, Siller HR. Extended CT Void Analysis in FDM Additive Manufacturing Components. Materials. 2020; 13(17):3831. https://doi.org/10.3390/ma13173831
Chicago/Turabian StyleHernandez-Contreras, Adriana, Leopoldo Ruiz-Huerta, Alberto Caballero-Ruiz, Verena Moock, and Hector R. Siller. 2020. "Extended CT Void Analysis in FDM Additive Manufacturing Components" Materials 13, no. 17: 3831. https://doi.org/10.3390/ma13173831
APA StyleHernandez-Contreras, A., Ruiz-Huerta, L., Caballero-Ruiz, A., Moock, V., & Siller, H. R. (2020). Extended CT Void Analysis in FDM Additive Manufacturing Components. Materials, 13(17), 3831. https://doi.org/10.3390/ma13173831