Influence of General Mineral Condition on Collagen-Guided Alveolar Crest Augmentation


Abstract
1. Introduction
2. Materials and Methods
3. Results
4. Discussion
5. Conclusions
Author Contributions
Funding
Conflicts of Interest
References
- Sewerynek, E.; Horst-Sikorska, H.; Stępień-Kłos, W.; Antkowiak, A.; Janik, M.; Cieślak, K.; Marcinkowska, M.; Cegłowska, A.; Stuss, M. The role of counselling and other factors in compliance of postmenopausal osteoporotic patients to alendronate 70 therapy. Arch. Med. Sci. 2013, 9, 288–296. [Google Scholar] [CrossRef]
- Zanchetta, J.R.; Hakim, C.; Lombas, C. Observational study of compliance and continuance rates of raloxifene in the prevention and treatment of osteoporosis. Curr. Ther. Res. 2004, 65, 470–480. [Google Scholar] [CrossRef] [PubMed][Green Version]
- Takaishi, Y.; Arita, S.; Honda, M.; Sugishita, T.; Kamada, A.; Ikeo, T.; Miki, T.; Fujita, T. Assessment of Alveolar Bone Mineral Density as a Predictor of Lumbar Fracture Probability. Adv. Ther. 2013, 30, 487–502. [Google Scholar] [CrossRef] [PubMed]
- Obuchowicz, R.; Nurzyńska, K.; Obuchowicz, B.; Urbanik, A.; Piórkowski, A. Caries detection enhancement using texture feature maps of intraoral radiographs. Oral Radiol. 2020, 30, 275–287. [Google Scholar] [CrossRef] [PubMed]
- Georgiadis, M.; Müller, R.; Schneider, P. Techniques to assess bone ultrastructure organization: Orientation and arrangement of mineralized collagen fibrils. J. R. Soc. Interface 2016, 13, 20160088. [Google Scholar] [CrossRef]
- Kołaciński, M.; Kozakiewicz, M.; Materka, A. Textural entropy as a potential feature for quantitative assessment of jaw bone healing process. Arch. Med. Sci. 2015, 11, 78–84. [Google Scholar] [CrossRef]
- Kozakiewicz, M.; Hadrowicz, P.; Hadrowicz, J.M.; Gesing, A. Can Torque Force During Dental Implant Placement Combined with Bone Mineral Density of Lumbar Spine Be Prediction Factors for Crestal Bone Structure Alterations? Dent. Med. Probl. 2014, 51, 448–457. Available online: http://www.dmp.umed.wroc.pl/en/article/2014/51/4/448/ (accessed on 13 August 2020).
- Sfondrini, M.F.; Gandini, P.; Alcozer, R.; Vallittu, P.K.; Scribante, A. Failure load and stress analysis of orthodontic miniscrews with different transmucosal collar diameter. J. Mech. Behav. Biomed. Mater. 2018, 87, 132–137. [Google Scholar] [CrossRef]
- Cenkoglu, B.G.; Balcioglu, N.B.; Ozdemir, T.; Mijiritsky, E. The Effect of the Length and Distribution of Implants for Fixed Prosthetic Reconstructions in the Atrophic Posterior Maxilla: A Finite Element Analysis. Materials 2019, 12, 2556. [Google Scholar] [CrossRef]
- Bodek, K.H.; Michalska, M.; Bodek, A.; Kozakiewicz, M. Evaluation of the use of microcrystalline chitosan and collagen membranes as carriers for the platelet derived growth factor (PDGF-BB) in the presence of amoxicillin. Curr. Issues Pharm. Med. Sci. 2013, 26, 176–182. [Google Scholar] [CrossRef]
- Michalska, M.; Kozakiewicz, M.; Bodek, A.; Bodek, K.H. Estimation of the use of fibrin and collage membranes as carriers for platelet-derived growth factor-BB (PDGF-BB) in the presence of amoxicillin. Indian J. Biochem. Biophys. 2015, 52, 196–202. [Google Scholar]
- Kozakiewicz, M.; Wach, T. New oral surgery materials for bone reconstruction—A comparison of five bone substitute materials for dentoalveolar augmentation. Materials 2020, 13, 2935. [Google Scholar] [CrossRef] [PubMed]
- Kozakiewicz, M.; Bogusiak, K.; Hanclik, M.; Denkowski, M.; Arkuszewski, P. Noise in subtraction images made from pairs of intraoral radiographs: A comparison between four methods of geometric alignment. Dentomaxillofac. Radiol. 2008, 37, 40–46. [Google Scholar] [CrossRef] [PubMed]
- Szczypiński, P.M.; Strzelecki, M.; Materka, A.; Klepaczko, A. MaZda—A software package for image texture analysis. Comput. Methods Programs Biomed. 2009, 94, 66–76. [Google Scholar] [CrossRef]
- Haralick, R. Statistical and Structural Approaches to Texture. Proceed IEEE 1979, 67, 786–804. [Google Scholar] [CrossRef]
- Materka, A.; Strzelecki, M. Texture Analysis Methods—A review, COST B11 Report (Presented and Distributed at MC Meeting and Workshop in Brussels, June 1998); Technical University of Lodz: Lodz, Poland, 1998. [Google Scholar]
- Hadrowicz, P.; Hadrowicz, J.; Kozakiewicz, M.; Gesing, A. Assessment of Parathyroid Hormone Serum Level as a Predictor for Bone Condition around Dental Implants. Int. J. Oral Maxillofac. Implant. 2017, 32, e207–e212. [Google Scholar] [CrossRef]
- Pang, K.M.; Lee, J.K.; Choi, S.H.; Kim, Y.K.; Kim, B.J.; Lee, J.H. Maxillary sinus augmentation with calcium phosphate double-coated anorganic bovine bone: Comparative multicenter randomized clinical trial with histological and radiographic evaluation. Implant Dent. 2019, 28, 39–45. [Google Scholar] [CrossRef]
- Ferreira Júnior, O.; Munhoz, E.A.; Segantin, J.F.; Gonçales, E.S.; Carvalho, P.S.P. Tomographic late evaluation of xenogeneic bone grafts in sockets of impacted third molars. J. Appl. Oral Sci. 2018, 26, e20170396. [Google Scholar] [CrossRef]
- Kozakiewicz, M.; Marciniak-Hoffman, A.; Denkowski, M. Long-term comparison of application of two beta-tricalcium phosphates in oral surgery. Dent. Med. Probl. 2009, 46, 384–388. [Google Scholar]
- Kozakiewicz, M.; Marciniak-Hoffman, A.; Olszycki, M. Comparative analysis of 3 bone substitute materials based on co-occurance matrix. Dent. Med. Probl. 2010, 47, 23–29. [Google Scholar]
- Bassett, J.H.; van der Spek, A.; Logan, J.G.; Gogakos, A.; Bagchi-Chakraborty, J.; Murphy, E.; van Zeijl, C.; Down, J.; Croucher, P.I.; Boyde, A.; et al. Thyrostimulin regulates osteoblastic bone formation during early skeletal development. Endocrinology 2015, 156, 3098–3113. [Google Scholar] [CrossRef]
- Abe, E.; Marians, R.C.; Yu, W.; Wu, X.B.; Ando, T.; Li, Y.; Iqbal, J.; Eldeiry, L.; Rajendren, G.; Blair, H.C.; et al. TSH is a negative regulator of skeletal remodeling. Cell 2003, 115, 151–162. [Google Scholar] [CrossRef]
- Sampath, T.K.; Simic, P.; Sendak, R.; Draca, N.; Bowe, A.E.; O’Brien, S.; Schiavi, S.C.; McPherson, J.M.; Vukicevic, S. Thyroid-stimulating hormone restores bone volume, microarchitecture, and strength in aged ovariectomized rats. J. Bone Miner. Res. 2007, 22, 849–859. [Google Scholar] [CrossRef] [PubMed]
- Baliram, R.; Chow, A.; Huber, A.K.; Collier, L.; Ali, M.R.; Morshed, S.A.; Latif, R.; Teixeira, A.; Merad, M.; Liu, L.; et al. Thyroid and bone: Macrophage-derived TSH-β splice variant increases murine osteoblastogenesis. Endocrinology 2013, 154, 4919–4926. [Google Scholar] [CrossRef] [PubMed][Green Version]
- Ramajayam, G.; Vignesh, R.C.; Karthikeyan, S.; Senthil Kumar, K.; Karthikeyan, G.D.; Veni, S.; Sridhar, M.; Arunakaran, J.; Aruldhas, M.M.; Srinivasan, N. Regulation of insulin-like growth factors and their binding proteins by thyroid stimulating hormone in human osteoblast-like (SaOS2) cells. Mol. Cell Biochem. 2012, 368, 77–88. [Google Scholar] [CrossRef] [PubMed]
- Hase, H.; Ando, T.; Eldeiry, L.; Brebene, A.; Peng, Y.; Liu, L.; Amano, H.; Davies, T.F.; Sun, L.; Zaidi, M.; et al. TNFα mediates the skeletal effects of thyroid-stimulating hormone. Proc. Natl. Acad. Sci. USA 2006, 103, 12849–12854. [Google Scholar] [CrossRef] [PubMed]
- Ma, R.; Morshed, S.; Latif, R.; Zaidi, M.; Davies, T.F. The influence of thyroid-stimulating hormone and thyroid-stimulating hormone receptor antibodies on osteoclastogenesis. Thyroid 2011, 21, 897–906. [Google Scholar] [CrossRef]
- Bassett, J.H.D.; Williams, G.R. Role of Thyroid Hormones in Skeletal Development and Bone Maintenance. Endocr. Rev. 2016, 37, 135–187. [Google Scholar] [CrossRef]
- Graf, D.; Malik, Z.; Hayano, S.; Mishina, Y. Common mechanisms in development and disease: BMP signaling in craniofacial development. Cytokine Growth Factor Rev. 2016, 27, 129–139. [Google Scholar] [CrossRef]
- Kopf, J.; Petersen, A.; Duda, G.N.; Knaus, P. BMP2 and mechanical loading cooperatively regulate immediate early signalling events in the BMP pathway. BMC Biol. 2012, 10, 37. [Google Scholar] [CrossRef]
- Rui, Y.F.; Lui, P.P.; Ni, M.; Chan, L.S.; Lee, Y.W.; Chan, K.M. Mechanical loading increased BMP-2 expression which promoted osteogenic differentiation of tendon-derived stem cells. J. Orthop. Res. 2011, 29, 390–396. [Google Scholar] [CrossRef]
- Tuchendler, D.; Bolanowski, M. The influence of thyroid dysfunction on bone metabolism. Thyroid Res. 2014, 7, 12. [Google Scholar] [CrossRef] [PubMed]
- Groen, J.J.; Duyvensz, F.; Halsted, J.A. Diffuse alveolar atrophy of the jaw (non-inflammatory form of paradental disease) and pre-senile osteoporosis. Gerontol. Clin. 1960, 2, 68–86. [Google Scholar] [CrossRef] [PubMed]
- Klemetti, E.; Vainio, P. Effect of bone mineral density in skeleton and mandible on extraction of teeth and clinical alveolar height. J. Prosthet. Dent. 1993, 70, 21–25. [Google Scholar] [CrossRef]
- Manzke, E.; Chesnut, C.H., 3rd; Wergedal, J.E.; Baylink, D.J.; Nelp, W.B. Relationship between local and total bone mass in osteoporosis. Metabolism 1975, 24, 605–615. [Google Scholar] [CrossRef]
- Sigurdsson, G.; Halldorsson, B.V.; Styrkarsdottir, U.; Kristjansson, K.; Stefansson, K. Impact of Genetics on Low Bone Mass in Adults. J. Bone Miner Res. 2008, 23, 1584–1590. [Google Scholar] [CrossRef]
- Weaver, C.M.; Gordon, C.M.; Janz, K.F.; Kalkwarf, H.J.; Lappe, J.M.; Lewis, R.; O’Karma, M.; Wallace, T.C.; Zemel, B.S. The National Osteoporosis Foundation’s position statement on peak bone mass development and lifestyle factors: A systematic review and implementation recommendations. Osteoporos. Int. 2016, 27, 1281–1386. [Google Scholar] [CrossRef]
- Movassagh, E.Z.; Vatanparast, H. Current Evidence on the Association of Dietary Patterns and Bone Health: A Scoping Review. Adv. Nutr. 2017, 8, 1–16. [Google Scholar] [CrossRef]
- Pedone, C.; Napoli, N.; Lauretani, F.; Pozzilli, P.; Ferrucci, L.; Antonelli-Incalzi, R. Quality of diet and potential renal acid load as risk factors for reduced bone density in elderly women. Bone 2010, 46, 1063–1067. [Google Scholar] [CrossRef][Green Version]
- Modlesky, C.M.; Majumdar, S.; Dudley, G.A. Trabecular Bone Microarchitecture in Female Collegiate Gymnasts. Osteoporos. Int. 2008, 19, 1011–1018. [Google Scholar] [CrossRef]
- Nickols-Richardson, S.M.; Modlesky, C.M.; O’Connor, P.J.; Lewis, R.D. Premenarcheal Gymnasts Possess Higher Bone Mineral Density Than Controls. Med. Sci. Sports Exerc. 2000, 32, 63–69. [Google Scholar] [CrossRef]
- Bielemann, R.M.; Martinez-Mesa, J.; Petrucci Gigante, D. Physical activity during life course and bone mass: A systematic review of methods and findings from cohort studies with young adults. BMC Musculoskelet. Disord. 2013, 14, 77. [Google Scholar] [CrossRef] [PubMed]
- Jabłońska, M.K. Immunoaging—Impact of aging on the components of the immune system. Gerontol. Pol. 2013, 4, 143–147. [Google Scholar]


| Index | 00 M | 12 M | REF | Difference to Reference |
|---|---|---|---|---|
| BI | 0.73 ± 0.17 | 0.65 ± 0.22 | 0.80 ± 0.14 | p < 0.01 for 12 M |
| TI | 1.66 ± 0.34 | 1.51 ± 0.41 | 1.72 ± 0.28 | p < 0.05 for 12 M |
| Summary Statistic | T-Score | PTH | D3 | Ca | TSH | D3·Ca/PTH | D3/PTH | lgSQRT Ca/PTH |
|---|---|---|---|---|---|---|---|---|
| Average ± Stnd.deviation | −0.36 ± 1.33 | 38.95 ± 16.77 | 23.39 ± 10.89 | 9.71 ± 0.40 | 1.86 ± 0.91 | 6.70 ± 3.91 | 0.70 ± 0.42 | −0.28 ± 0.10 |
| Median | −0.2 | 37.25 | 20.92 | 9.61 | 1.81 | 4.90 | 0.51 | −0.30 |
| Minimum | −2.9 | 11.7 | 10.0 | 8.8 | 0,4 | 2.3 | 0.2 | −0.5 |
| Maximum | 2.9 | 96.3 | 54.0 | 10.7 | 5.05 | 15.5 | 1.66 | −0.02 |
| Range | 5.8 | 84.6 | 44.0 | 1.9 | 4.66 | 13.2 | 1.42 | 0.47 |
| Stnd. skewness | 0.36 | 3.09 * | 2.36 * | 1.33 | 3.32 * | 1.55 | 1.65 | 1.75 |
| Stnd. kurtosis | −0.12 | 3.41 * | 1.60 | −0.05 | 3.64 * | −0.61 | −0.49 | 1.18 |
| Parameter | CC | R2 | p |
|---|---|---|---|
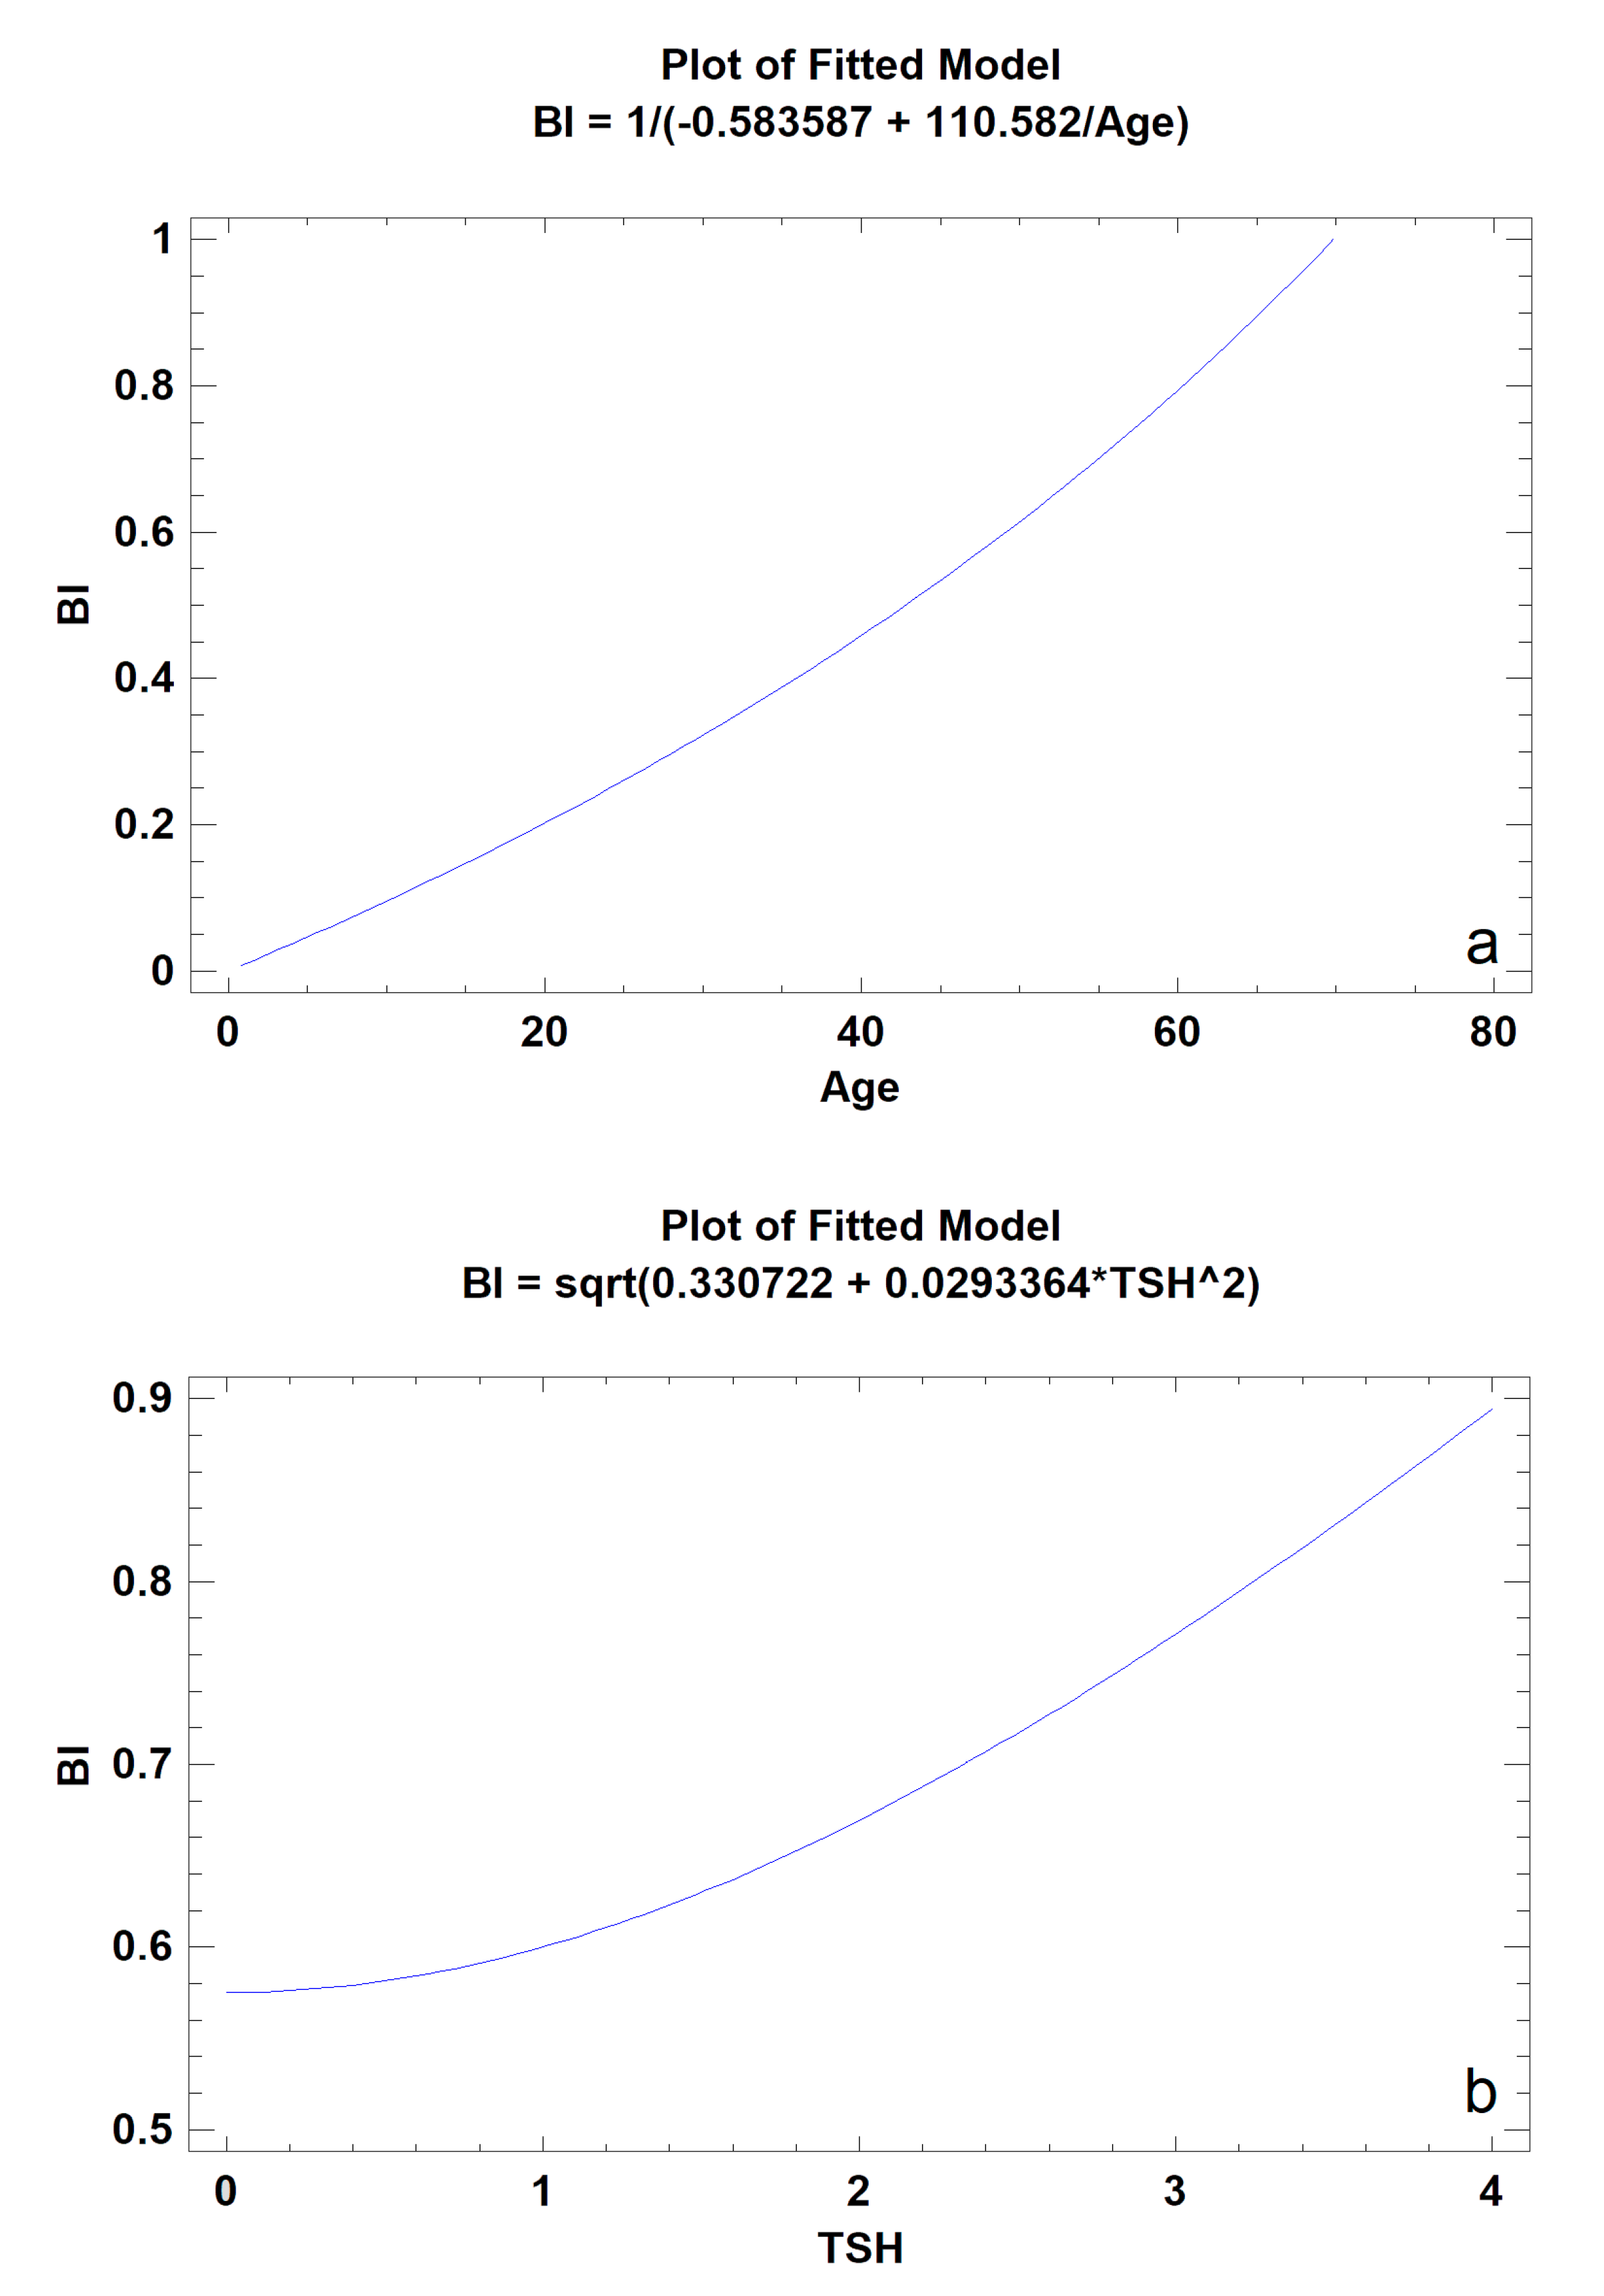
| Age | 0.81 | 65% | 0.0003 * |
| T-Score | 0.37 | 14% | 0.260 |
| PTH | 0.05 | 0.3% | 0.852 |
| D3 | 0.52 | 27% | 0.234 |
| Ca | −0.43 | 18% | 0.111 |
| TSH | 0.51 | 26% | 0.049 * |
| D3·Ca/PTH | −0.36 | 13% | 0.428 |
| D3/PTH | −0.34 | 12% | 0.450 |
| lgSQRT_Ca/PTH | −0.29 | 8% | 0.294 |
© 2020 by the authors. Licensee MDPI, Basel, Switzerland. This article is an open access article distributed under the terms and conditions of the Creative Commons Attribution (CC BY) license (http://creativecommons.org/licenses/by/4.0/).
Share and Cite
Kozakiewicz, M.; Szymor, P.; Wach, T. Influence of General Mineral Condition on Collagen-Guided Alveolar Crest Augmentation. Materials 2020, 13, 3649. https://doi.org/10.3390/ma13163649
Kozakiewicz M, Szymor P, Wach T. Influence of General Mineral Condition on Collagen-Guided Alveolar Crest Augmentation. Materials. 2020; 13(16):3649. https://doi.org/10.3390/ma13163649
Chicago/Turabian StyleKozakiewicz, Marcin, Piotr Szymor, and Tomasz Wach. 2020. "Influence of General Mineral Condition on Collagen-Guided Alveolar Crest Augmentation" Materials 13, no. 16: 3649. https://doi.org/10.3390/ma13163649
APA StyleKozakiewicz, M., Szymor, P., & Wach, T. (2020). Influence of General Mineral Condition on Collagen-Guided Alveolar Crest Augmentation. Materials, 13(16), 3649. https://doi.org/10.3390/ma13163649