Application of Texture and Fractal Dimension Analysis to Estimate Effectiveness of Oral Leukoplakia Treatment Using an Er:YAG Laser—A Prospective Study


Abstract
1. Introduction
2. Materials and Methods
2.1. Patients and Lesions
2.2. Laser Procedure
2.3. Image Acquisition
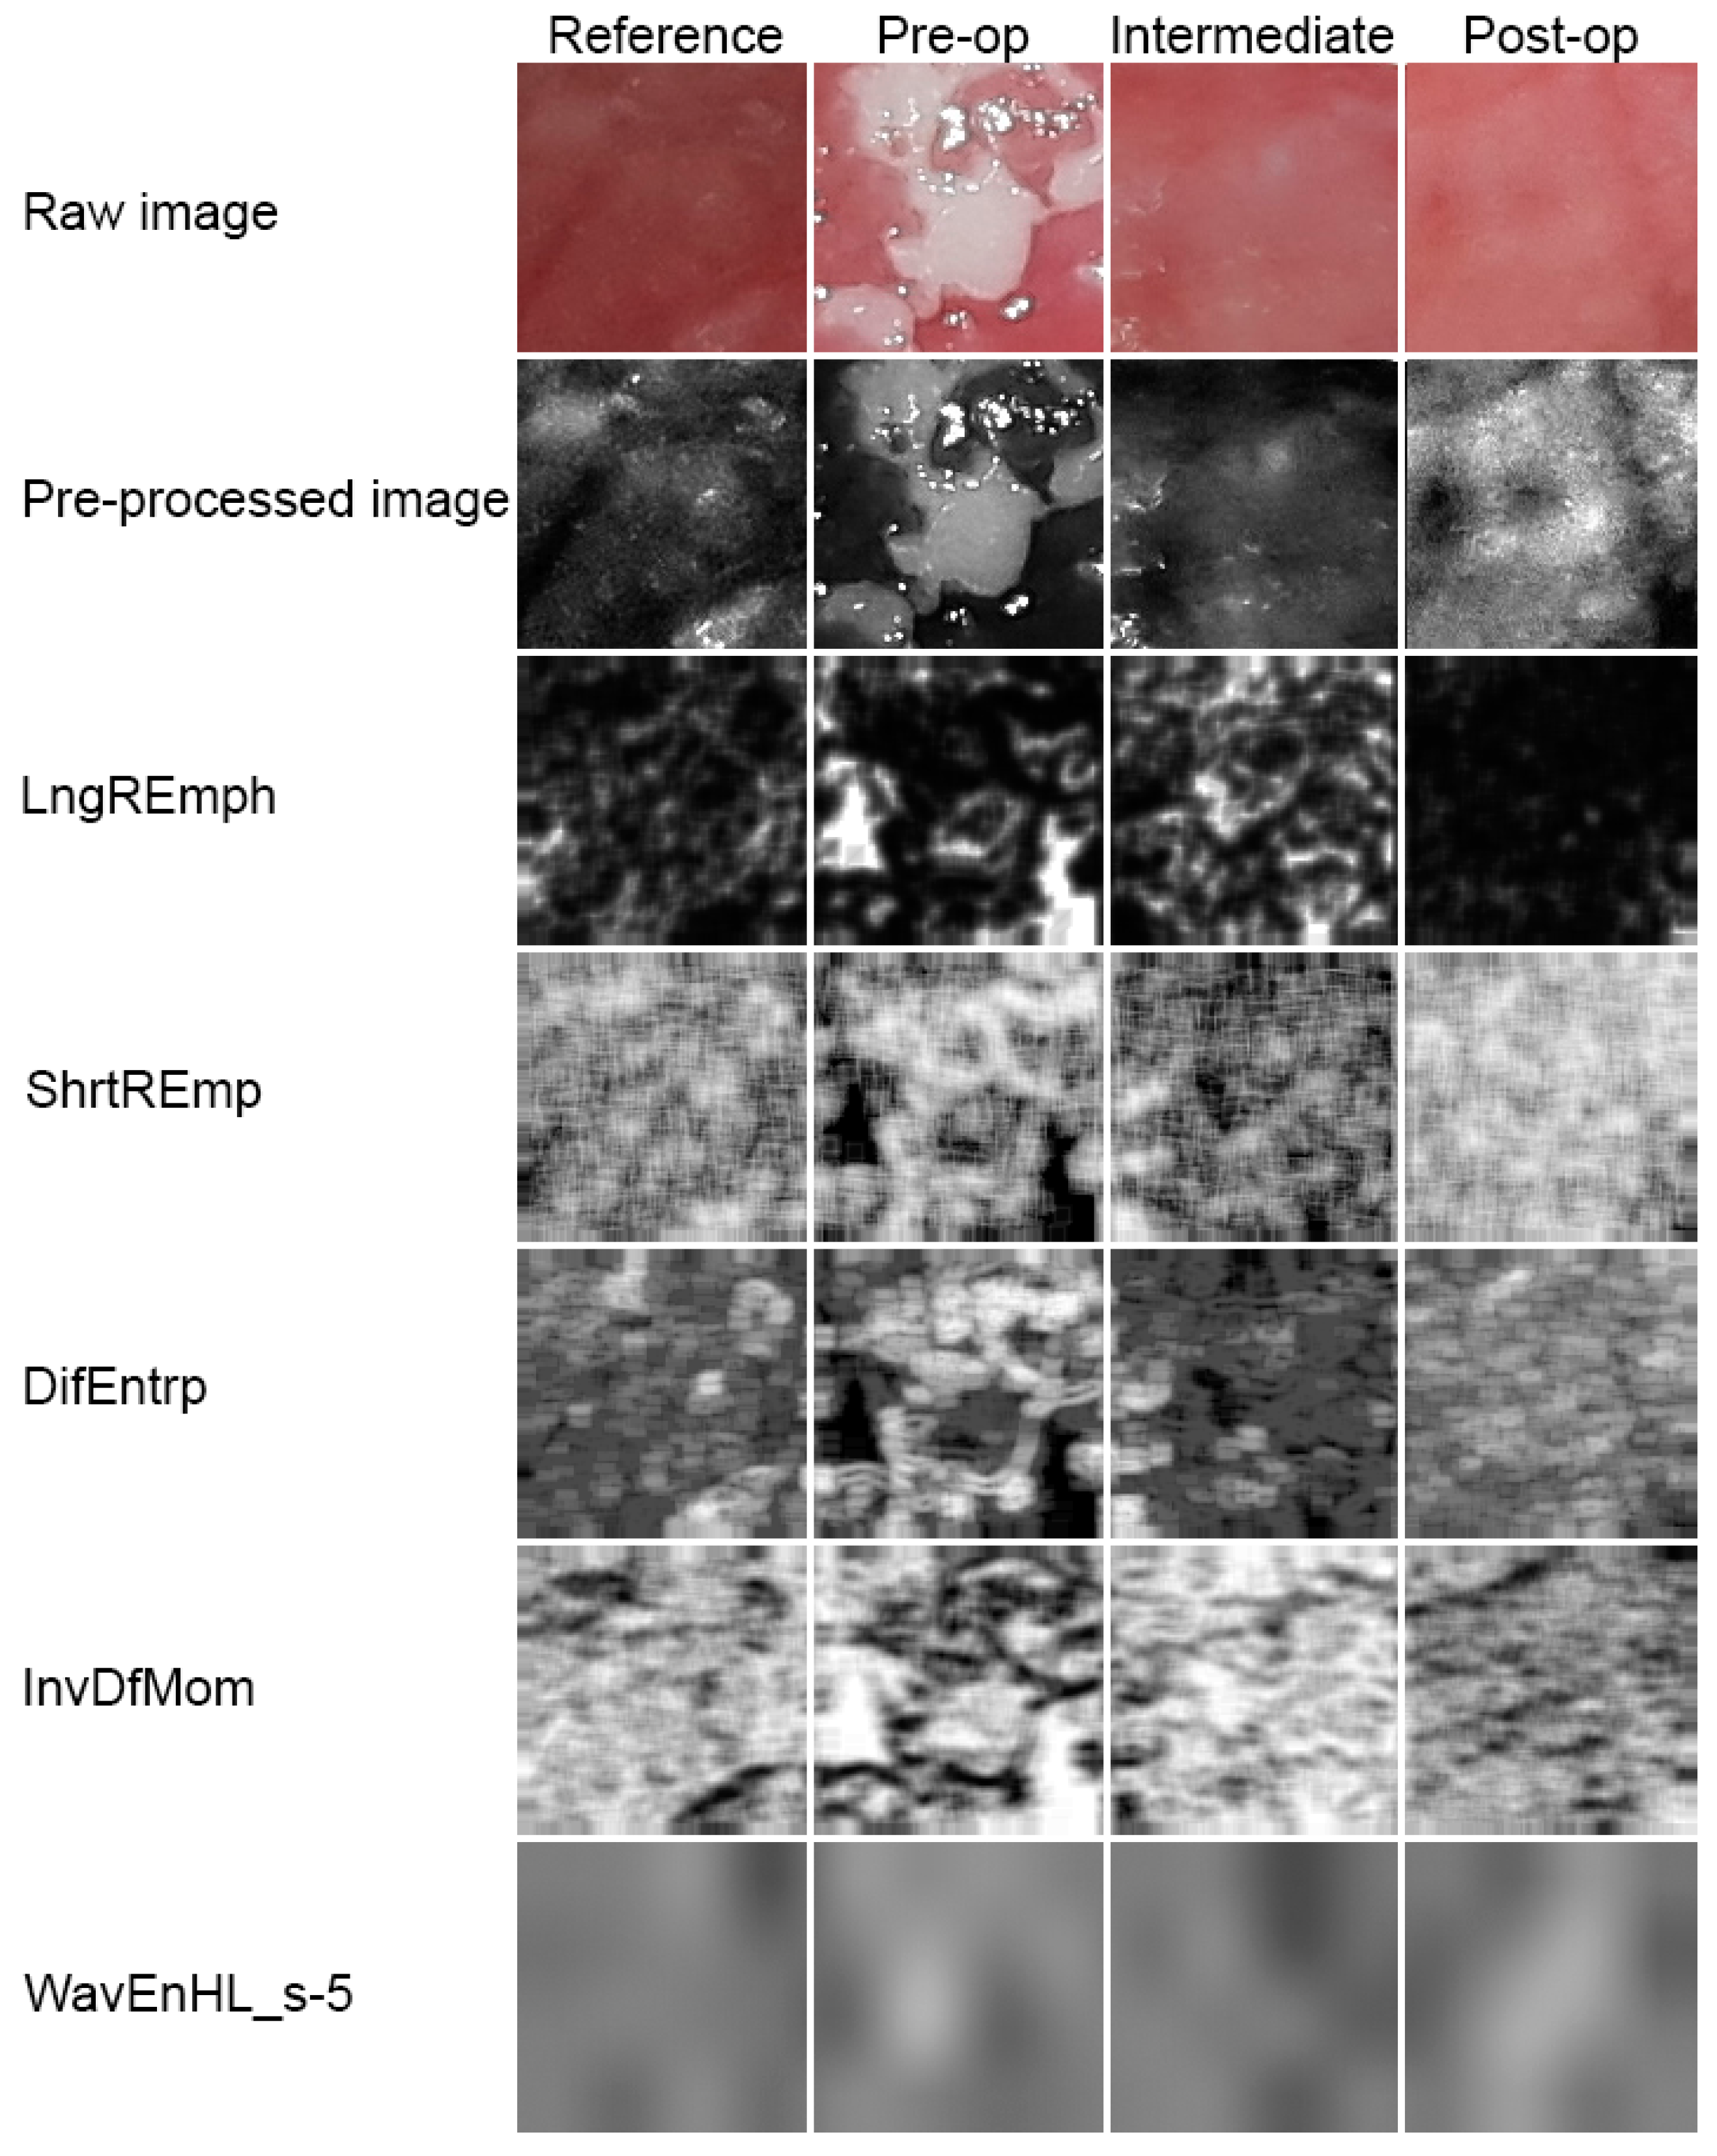
2.4. Image Preparation
2.5. Texture Analysis
2.6. Difference Entropy
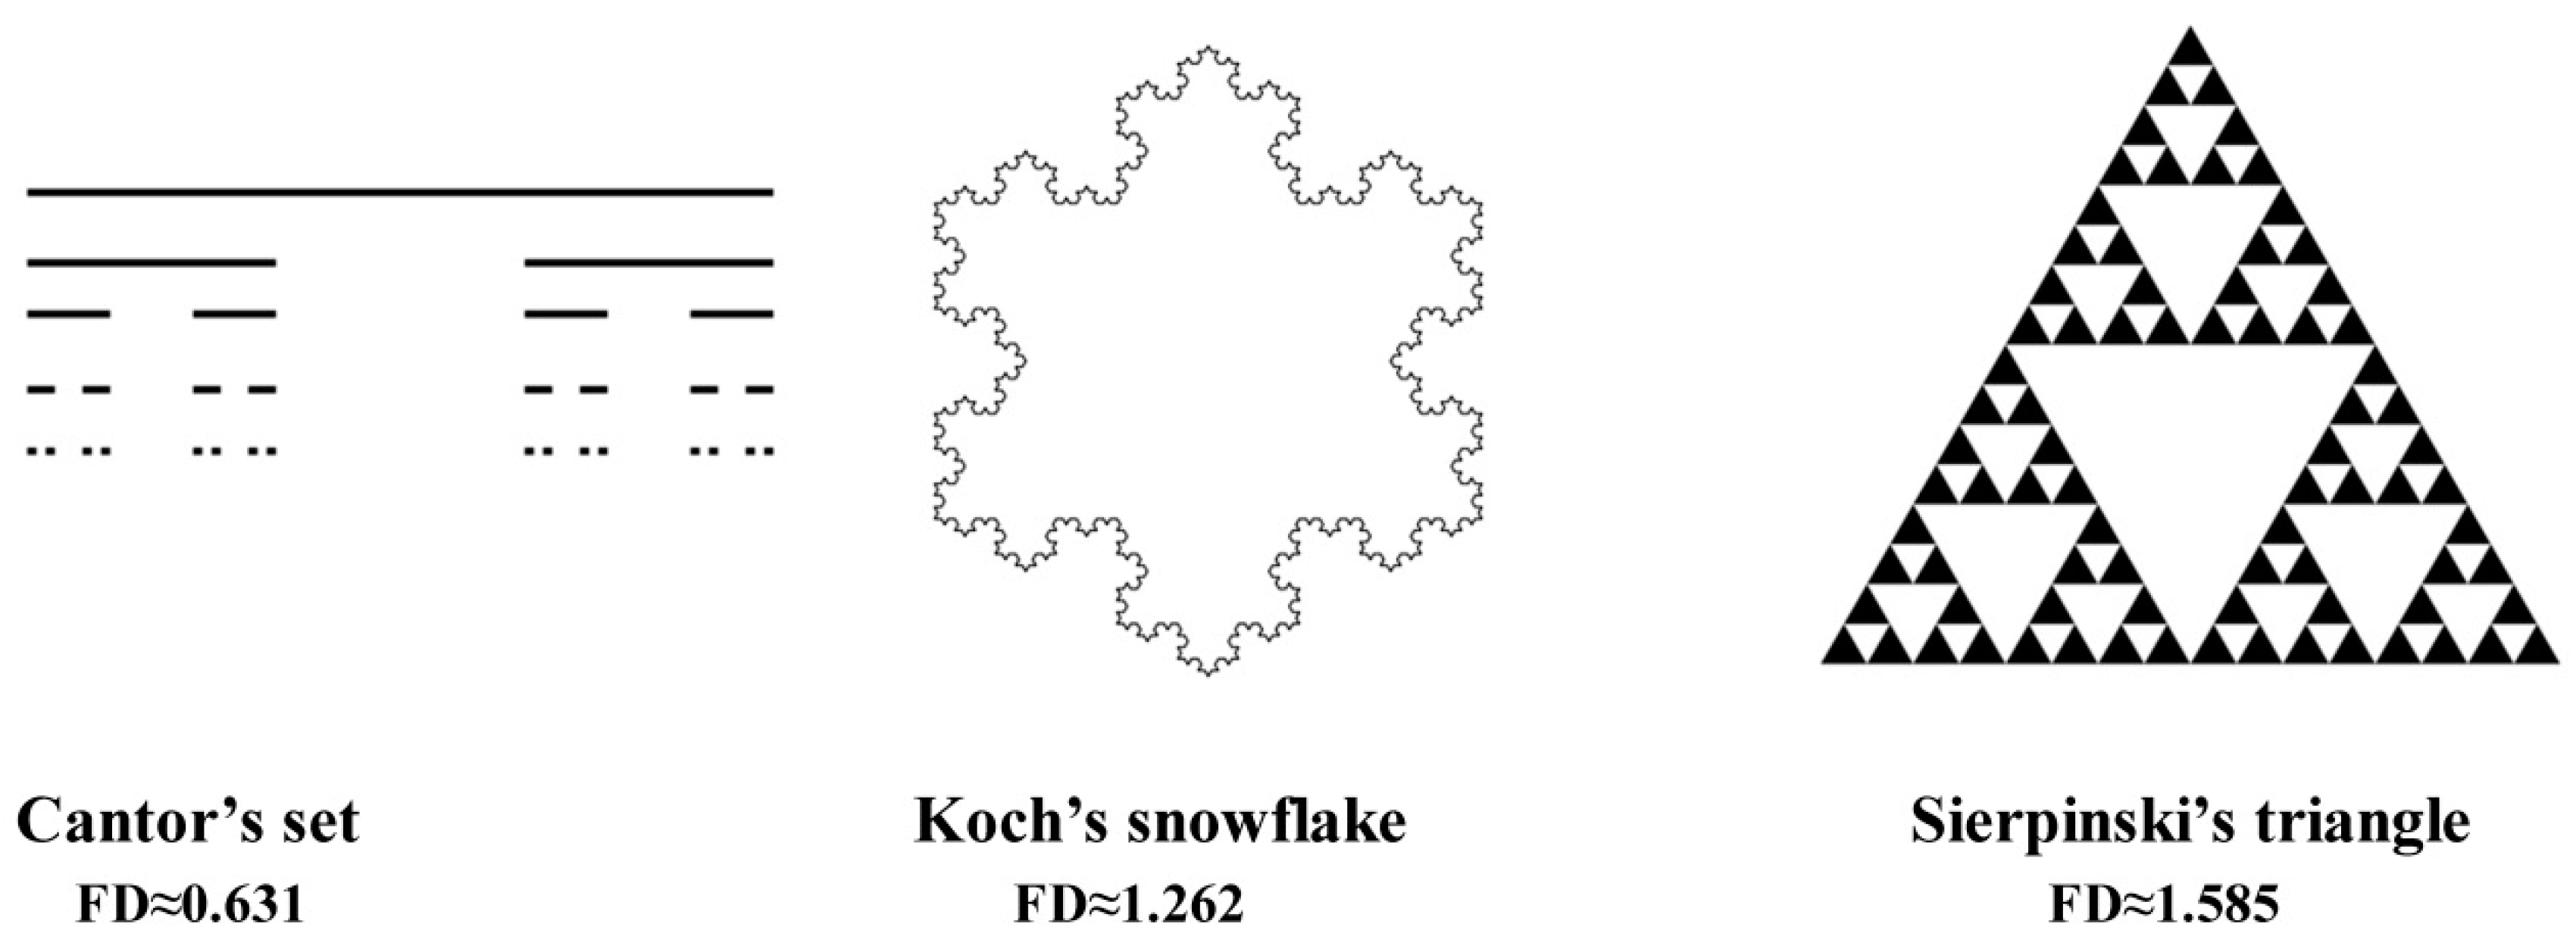
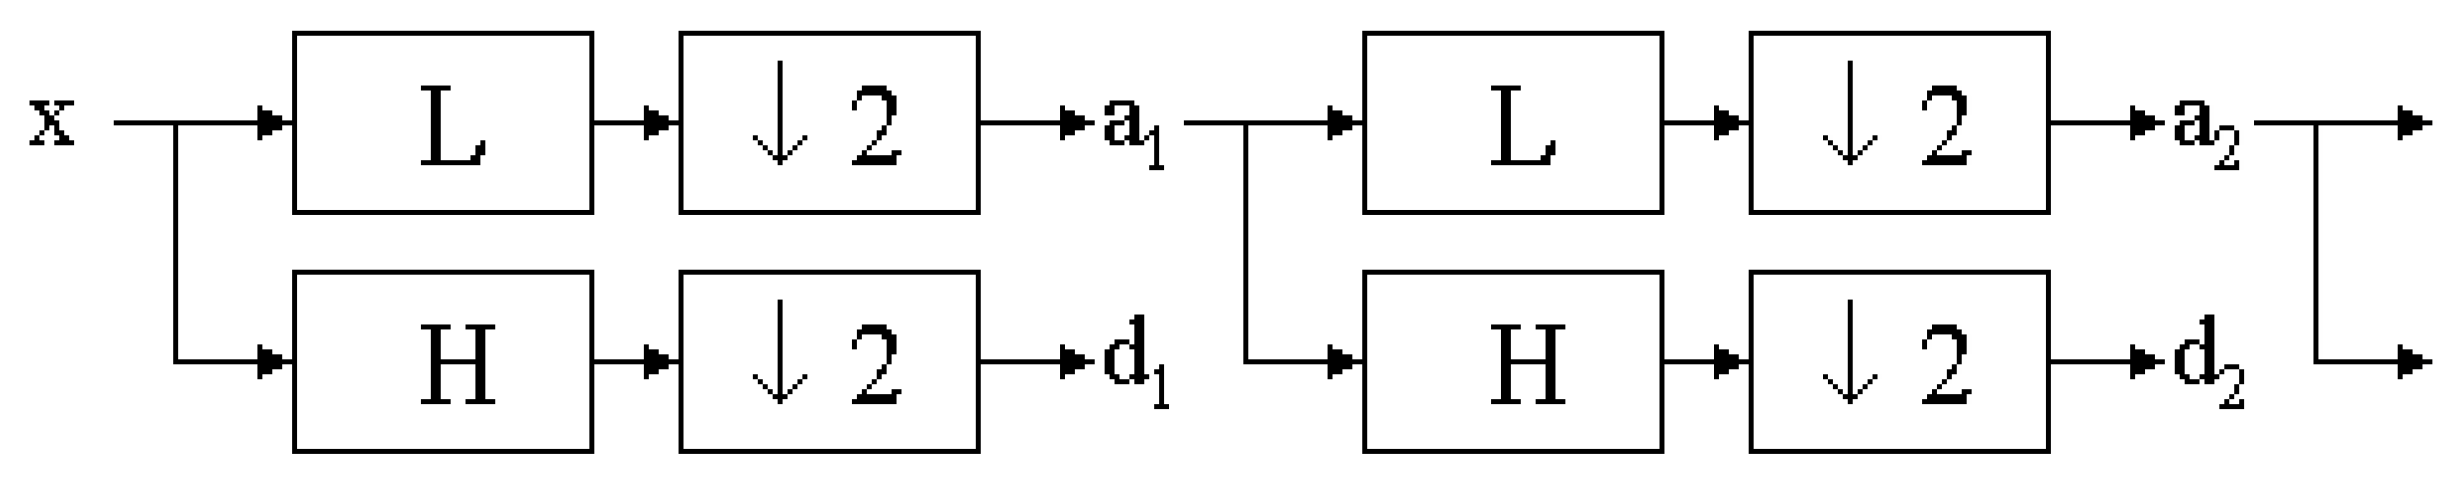
2.7. Fractal Dimension Analysis
2.8. Statistical Analysis
3. Results
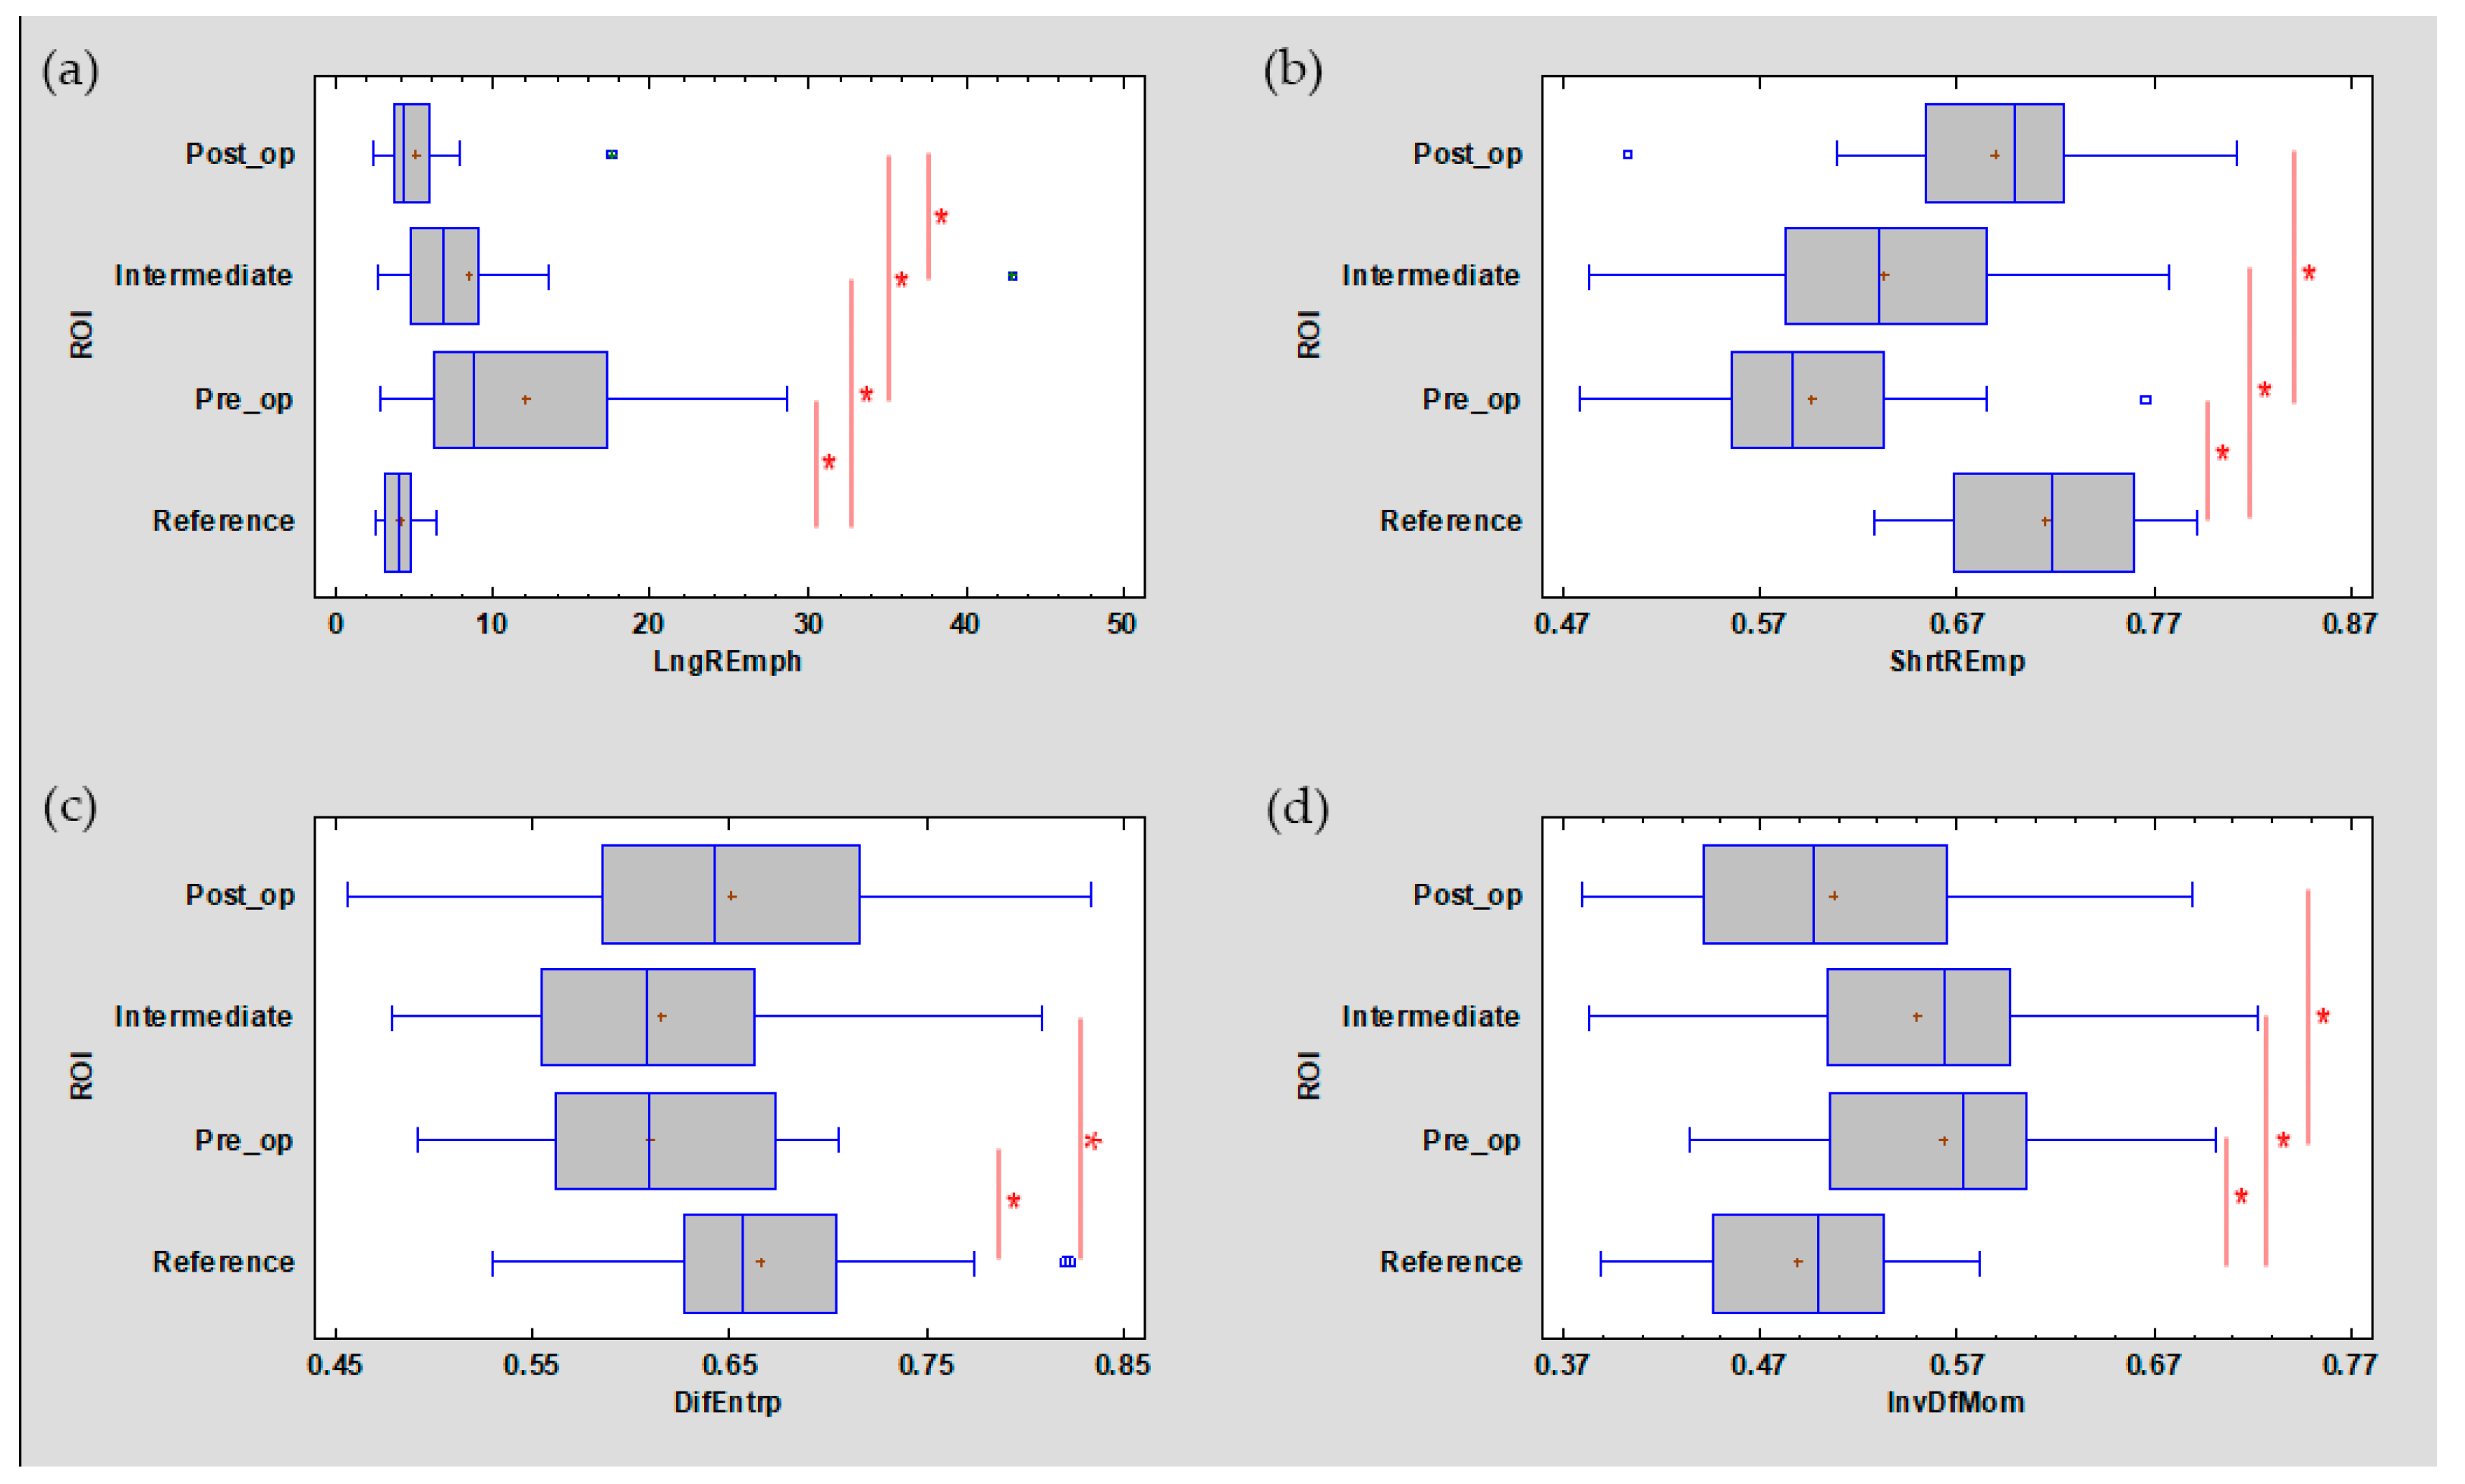
3.1. Texture Analysis
3.2. Fractal Dimension Analysis
3.3. Estimation of Recurrence
0.971237*DifEntr/LngREmph + 0.976915*ShrtREmp
0.190267*DifEntr/LngREmph + 0.152573*ShrtREmp
4. Discussion
5. Conclusions
Author Contributions
Funding
Conflicts of Interest
References
- Suwasini, S.; Chatterjee, K.; Purkait, S.K.; Samaddar, D.; Chatterjee, A.; Kumar, M. Expression of P53 Protein and Ki-67 Antigen in Oral Leukoplakia with Different Histopathological Grades of Epithelial Dysplasia. J. Int. Soc. Prev. Community Dent. 2018, 8, 513–522. [Google Scholar] [CrossRef] [PubMed]
- Arora, K.S.; Nayyar, A.; Kaur, P.; Arora, K.S.; Goel, A.; Singh, S. Evaluation of Collagen in Leukoplakia, Oral Submucous Fibrosis and Oral Squamous Cell Carcinomas Using Polarizing Microscopy and Immunohistochemistry. Asian Pac. J. Cancer Prev. 2018, 27, 1075–1080. [Google Scholar]
- Pinto, A.C.; Caramês, J.; Francisco, H.; Chen, A.; Azul, A.M.; Marques, D. Malignant transformation rate of oral leukoplakia-systematic review. Oral. Surg. Oral. Med. Oral. Pathol. Oral. Radiol. 2020. [Google Scholar] [CrossRef] [PubMed]
- Maymone, M.B.C.; Greer, R.O.; Kesecker, J.; Sahitya, P.C.; Burdine, L.K.; Cheng, A.D.; Maymone, A.C.; Vashi, N.A. Premalignant and malignant oral mucosal lesions: Clinical and pathological findings. J. Am. Acad. Dermatol. 2019, 81, 59–71. [Google Scholar] [CrossRef] [PubMed]
- Khan, N.; Bavle, R.M.; Makarla, S.; Amulya, S.R.; Konda, P.; Sudhakara, M. “SKILL TO KILL”—Oral cancer and potentially premalignant oral epithelial lesions (PPOELs): A survey approach. Emerging of a new system and professionals. J. Oral. Maxillofac. Pathol. 2019, 23, 248–256. [Google Scholar] [CrossRef] [PubMed]
- Fang, J.-Y.; Lee, W.-R.; Shen, S.-C.; Fang, Y.-P.; Hu, C.-H. Enhancement of topical 5-aminolaevulinic acid delivery by erbium: YAG laser and microdermabrasion: A comparison with iontophoresis and electroporation. Br. J. Dermatol. 2004, 151, 132–140. [Google Scholar] [CrossRef]
- Chen, K.H.; Tam, K.W.; Chen, I.F.; Huang, S.K.; Tzeng, P.C.; Wang, H.J.; Chen, C.C. A systematic review of comparative studies of CO2 and erbium: YAG lasers in resurfacing facial rhytides (wrinkles). J. Cosmet. Laser Ther. 2017, 19, 199–204. [Google Scholar] [CrossRef]
- Materka, A. What is the texture? In Texture Analysis for Magnetic Resonance Imaging; Hajek, M., Dezortova, M., Materka, A., Lerski, R., Eds.; EU COST, Action B21; Med4publishing: Prague, Czech Republic, 2006; pp. 7–41. ISBN 80-903660-0-7. [Google Scholar]
- Skoch, A.; Jirák, D.; Vyhnanovská, P.; Dezortová, M.; Fendrych, P.; Rolencová, E.; Hájek, M. Classification of calf muscle MR images by texture analysis. MAGMA 2004, 16, 259–267. [Google Scholar] [CrossRef]
- Jirák, D.; Dezortová, M.; Taimr, P.; Hájek, M. Texture analysis of human liver. J. Magn. Reson. Imaging 2002, 15, 68–74. [Google Scholar] [CrossRef] [PubMed]
- Lubner, M.G.; Smith, A.D.; Sandrasegaran, K.; Sahani, D.V.; Pickhardt, P.J. CT Texture Analysis: Definitions, Applications, Biologic Correlates, and Challenges. Radiographics 2017, 37, 1483–1503. [Google Scholar] [CrossRef] [PubMed]
- Guo, C.; Zhuge, X.; Wang, Q.; Xiao, W.; Wang, Z.; Wang, Z.; Feng, Z.; Chen, X. The differentiation of pancreatic neuroendocrine carcinoma from pancreatic ductal adenocarcinoma: The values of CT imaging features and texture analysis. Cancer Imaging 2018, 18, 37. [Google Scholar] [CrossRef] [PubMed]
- Wu, M.; Krishna, S.; Thornhill, R.E.; Flood, T.A.; McInnes, M.D.F.; Schieda, N. Transition zone prostate cancer: Logistic regression and machine-learning models of quantitative ADC, shape and texture features are highly accurate for diagnosis. J. Magn. Reson. Imaging 2019, 50, 940–950. [Google Scholar] [CrossRef] [PubMed]
- Li, Z.; Yu, L.; Wang, X.; Yu, H.; Gao, Y.; Ren, Y.; Wang, G.; Zhou, X. Diagnostic Performance of Mammographic Texture Analysis in the Differential Diagnosis of Benign and Malignant Breast Tumors. Clin. Breast Cancer 2018, 18, 621–627. [Google Scholar] [CrossRef] [PubMed]
- Jurczyszyn, K.; Kozakiewicz, M. Differential diagnosis of leukoplakia versus lichen planus of the oral mucosa based on digital texture analysis in intraoral photography. Adv. Clin. Exp. Med. 2019, 28, 1469–1476. [Google Scholar] [CrossRef] [PubMed]
- Haralick, R.; Shanmugam, K.; Dinstein, I. Textural Features for Image Classification. IEEE Trans. Syst. Man Cybern. 1973, 3, 610–621. [Google Scholar] [CrossRef]
- Dash, M.; Liu, H. Feature selection for Classification. Intell. Data Anal. 1997, 1, 131–156. [Google Scholar] [CrossRef]
- Strzelecki, M.; Szczypinski, P.; Materka, A.; Klepaczko, A. A software tool for automatic classification and segmentation of 2D/3D medical images. Nucl. Instrum. Methods Phys. Res. A 2013, 702, 137–140. [Google Scholar] [CrossRef]
- Szczypinski, P.; Strzelecki, M.; Materka, A. MaZda-a Software for Texture Analysis. In Proceedings of the ISITC 2007, Seoul, Korea, 23 November 2007; pp. 245–249. [Google Scholar]
- Szczypinski, P.; Strzelecki, M.; Materka, A.; Klepaczko, A. MaZda-A software package for image texture analysis. Comput. Methods Programs Biomed. 2009, 94, 66–76. [Google Scholar] [CrossRef]
- Hadrowicz, J.; Hadrowicz, P.; Gesing, A.; Kozakiewicz, M. Age dependent alteration in bone surrounding dental implants. Dent. Med. Probl. 2014, 51, 27–34. [Google Scholar]
- Kołaciński, M.; Kozakiewicz, M.; Materka, A. Textural entropy as a potential feature for quantitative assessment of jaw bone healing process. Arch. Med. Sci. 2015, 16, 78–84. [Google Scholar] [CrossRef]
- Materka, A.; Strzelecki, M. Texture Analysis Methods—A Review. In COST B11 Report (Presented and Distributed at MC Meeting and Workshop in Brussels, June 1998); Technical University of Lodz: Lodz, Poland, 1998. [Google Scholar]
- Materka, A.; Strzelecki, M.; Lerski, R.; Schad, L. Feature Evaluation of Texture Test Objects for Magnetic Resonance Imaging. In Texture Analysis in Machine Vision; University of Oulu: Oulu, Finland, 1999; pp. 13–19. [Google Scholar]
- Materka, A.; Szypinski, P. MaZda User’s Manual [MaZda 4.6. Download Link]. Available online: http://www.eletel.p.lodz.pl/mazda/download/MaZda.zip (accessed on 17 February 2009).
- Kozakiewicz, M.; Gurzawska, K. Zastosowanie dyskretnej transformacji falkowej do matematycznego opisu radiotekstury kości żuchwy po zabiegach implantologicznych. Mag. Stomat. 2009, 204, 90–93. [Google Scholar]
- Grizzi, F.; Russo, C.; Colombo, P.; Franceschini, B.; Frezza, E.E.; Cobos, E. Chiriva-Internati M: Quantitative evaluation and modeling of two-dimensional neovascular network complexity: The surface fractal dimension. BMC Cancer 2005, 8, 14. [Google Scholar]
- Jurczyszyn, K.; Kubasiewicz-Ross, P.; Nawrot-Hadzik, I.; Gedrange, T.; Dominiak, M.; Jakub, H. Fractal dimension analysis a supplementary mathematical method for bone defect regeneration measurement. J. Ann. Anat. 2018, 219, 83–88. [Google Scholar] [CrossRef] [PubMed]
- Matulić, N.; Bago, I.; Sušić, M.; Gjorgievska, E.; Kotarac Knežević, A.; Gabrić, D. Comparison of Er: YAG and Er, Cr: YSGG Laser in the Treatment of Oral Leukoplakia Lesions Refractory to the Local Retinoid Therapy. Photobiomodul. Photomed. Laser Surg. 2019, 37, 362–368. [Google Scholar] [CrossRef] [PubMed]
- Romeo, U.; Mohsen, M.; Palaia, G.; Bellisario, A.; Del Vecchio, A.; Tenore, G. CO2 laser ablation of oral leukoplakia: With or without extension of margins? Clin. Ter. 2020, 171, e209–e215. [Google Scholar] [CrossRef]
- Galletta, V.; Azevedo, L.; Lodi, G.; Migliari, D. Factors affecting Clinical Outcomes after Treatment of Oral Leukoplakia with CO2 and Diode Laser. J. Contemp. Dent. Pract. 2017, 18, 775–780. [Google Scholar]
- Del Corso, G.; Gissi, D.B.; Tarsitano, A.; Costabile, E.; Marchetti, C.; Montebugnoli, L.; Foschini, M.P. Laser evaporation versus laser excision of oral leukoplakia: A retrospective study with long-term follow-up. J. Craniomaxillofac. Surg. 2015, 43, 763–768. [Google Scholar] [CrossRef]
- Arduino, P.G.; Cafaro, A.; Cabras, M.; Gambino, A.; Broccoletti, R. Treatment Outcome of Oral Leukoplakia with Er:YAG Laser: A 5-Year Follow-Up Prospective Comparative Study. Photomed. Laser Surg. 2018, 36, 631–633. [Google Scholar] [CrossRef]
- Jurczyszyn, K.; Kazubowska, K.; Kubasiewicz-Ross, P.; Ziółkowski, P.; Dominiak, M. Application of fractal dimension analysis and photodynamic diagnosis in the case of differentiation between lichen planus and leukoplakia: A preliminary study. Adv. Clin. Exp. Med. 2018, 27, 1729–1736. [Google Scholar] [CrossRef]
- Han, Y.; Xu, S.; Jin, J.; Wang, X.; Liu, X.; Hua, H.; Wang, X.; Liu, H. Primary Clinical Evaluation of Photodynamic Therapy with Oral Leukoplakia in Chinese Patients. Front. Physiol. 2019, 22, 1911. [Google Scholar] [CrossRef]
- Yao, Y.; Shen, X.; Shi, L.; Tang, G.; Wu, L. The combination of photodynamic therapy and fractional CO2 laser for oral leukoplakia: Case series. Photo Diagn. Photodyn. Ther. 2020, 29, 101597. [Google Scholar] [CrossRef] [PubMed]
- Kothe, C.; Münzenmayer, C.; Wittenberg, T.; Hess, M. Experiences With ‘Optical’ Biopsies of Leukoplakia of the Vocal Folds. Laryngo Rhino Otol. 2005, 84, 92–95. [Google Scholar] [CrossRef] [PubMed]
- Raja, J.V.; Khan, M.; Ramachandra, V.K.; Al-Kadi, O. Texture Analysis of CT Images in the Characterization of Oral Cancers Involving Buccal Mucosa. Dento Maxillofac. Radiol. 2012, 41, 475–480. [Google Scholar] [CrossRef] [PubMed]
- Lucchese, A.; Gentile, E.; Capone, G.; de Vico, G.; Serpico, R.; Landini, G. Fractal Analysis of Mucosal Microvascular Patterns in Oral Lichen Planus: A Preliminary Study. Oral. Surg. Oral. Med. Oral. Pathol. Oral. Radiol. 2015, 120, 609–615. [Google Scholar] [CrossRef]
- Goutzanis, L.P.; Papadogeorgakis, N.; Pavlopoulos, P.M.; Petsinis, V.; Plochoras, I.; Eleftheriadis, E.; Pantelidaki, A.; Patsouris, E.; Alexandridis, C. Vascular Fractal Dimension and Total Vascular Area in the Study of Oral Cancer. Head Neck. 2009, 31, 298–307. [Google Scholar] [CrossRef]
- Eid, R.A.; Landini, G. Quantification of the Global and Local Complexity of the Epithelial-Connective Tissue Interface of Normal, Dysplastic, and Neoplastic Oral Mucosae Using Digital Imaging. Pathol. Res. Pract. 2003, 199, 475–482. [Google Scholar] [CrossRef] [PubMed]
- Yang, X.; Xiao, X.; Wu, W.; Shen, X.; Zhou, Z.; Liu, W.; Shi, L. Cytological study of DNA content and nuclear morphometric analysis for aid in the diagnosis of high-grade dysplasia within oral leukoplakia. Oral. Surg. Oral. Med. Oral. Pathol. Oral. Radiol. 2017, 124, 280–285. [Google Scholar] [CrossRef]
- Skandarajah, A.; Reber, C.D.; Switz, N.A.; Fletcher, D.A. Quantitative imaging with a mobile phone microscope. PLoS ONE 2014, 9, e96906. [Google Scholar] [CrossRef]
- Munkholm, S.; Krøgholt, T.; Ebbesen, F.; Szecsi, P.; Kristensen, S. The smartphone camera as a potential method for transcutaneous bilirubin measurement. PLoS ONE 2018, 13, e0197938. [Google Scholar] [CrossRef]
- Maier, T.; Kulichova, D.; Schotten, K.; Astrid, R.; Ruzicka, T.; Berking, C.; Udrea, A. Accuracy of a smartphone application using fractal image analysis of pigmented moles compared to clinical diagnosis and histological result. J. Eur. Acad. Dermatol. Venereol. 2015, 29, 663–667. [Google Scholar] [CrossRef]
- Breslauer, D.N.; Maamari, R.N.; Switz, N.A.; Lam, W.A.; Fletcher, D.A. Mobile phone based clinical microscopy for global health applications. PLoS ONE 2009, 7, e6320. [Google Scholar] [CrossRef] [PubMed]


| Texture Feature | ROI | KW Test | |||
|---|---|---|---|---|---|
| Reference | Pre-Operational | Intermediate | Post-Operational | ||
| Mucosa | Period | ||||
| LngREmph | 4.038 ± 1.171 | 12.0427 ± 8.503 | 8.431 ± 7.861 | 5.071 ± 2.966 | p < 0.001 |
| ShrtREmp | 0.715 ± 0.051 | 0.596 ± 0.067 | 0.633 ± 0.079 | 0.689 ± 0.062 | p < 0.001 |
| DifEntrp | 0.665 ± 0.075 | 0.610 ± 0.062 | 0.615 ± 0.087 | 0.651 ± 0.089 | p < 0.05 |
| InvDfMom | 0.489 ± 0.056 | 0.563 ± 0.066 | 0.550 ± 0.080 | 0.507 ± 0.076 | p < 0.001 |
| WavEnHL_s-5 | 0.372 ± 0.241 | 0.688 ± 0.285 | 1.077 ± 0.601 | 1.158 ± 0.711 | p < 0.001 |
| ROI | ||||
|---|---|---|---|---|
| Versus | Reference | Pre-op | Intermediate | Post-op |
| reference | - | 0.0001 | 0.3846 | 0.4659 |
| pre-op | 0.0001 | - | 0.1758 | 0.0778 |
| intermediate | 0.3846 | 0.1758 | - | 1.0000 |
| post-op | 0.4659 | 0.0778 | 1.0000 | - |
| Factor | Eigenvalue | Percent of Variance | Cumulative Percentage |
|---|---|---|---|
| Factor 1 | 2.27223 | 56.806 | 56.806 |
| Factor 2 | 1.00342 | 25.085 | 81.891 |
| Factor 3 | 0.684531 | 17.113 | 99.004 |
| Factor 4 | 0.0398214 | 0.996 | 100.000 |
| Feature | Factor 1 | Factor 2 | Estimated | Specific |
|---|---|---|---|---|
| FDT Factor | FDA–WDT Factor | Communality | Variance | |
| FDA | 0.114858 | 0.813578 | 0.675101 | 0.324899 |
| WavEnHL_s-4 | 0.167196 | 0.784505 | 0.643402 | 0.356598 |
| DifEntr/LngREmph | 0.971237 | 0.190267 | 0.979502 | 0.0204976 |
| ShrtREmp | 0.976915 | 0.152573 | 0.977642 | 0.0223583 |
| Estimator | Pre-Operational | Intermediate Period | Post-Operational | KW Test |
|---|---|---|---|---|
| DifEntr/LngREmph | 0.08 ± 0.06 | 0.11 ± 0.07 | 0.16 ± 0.06 | p < 0.001 |
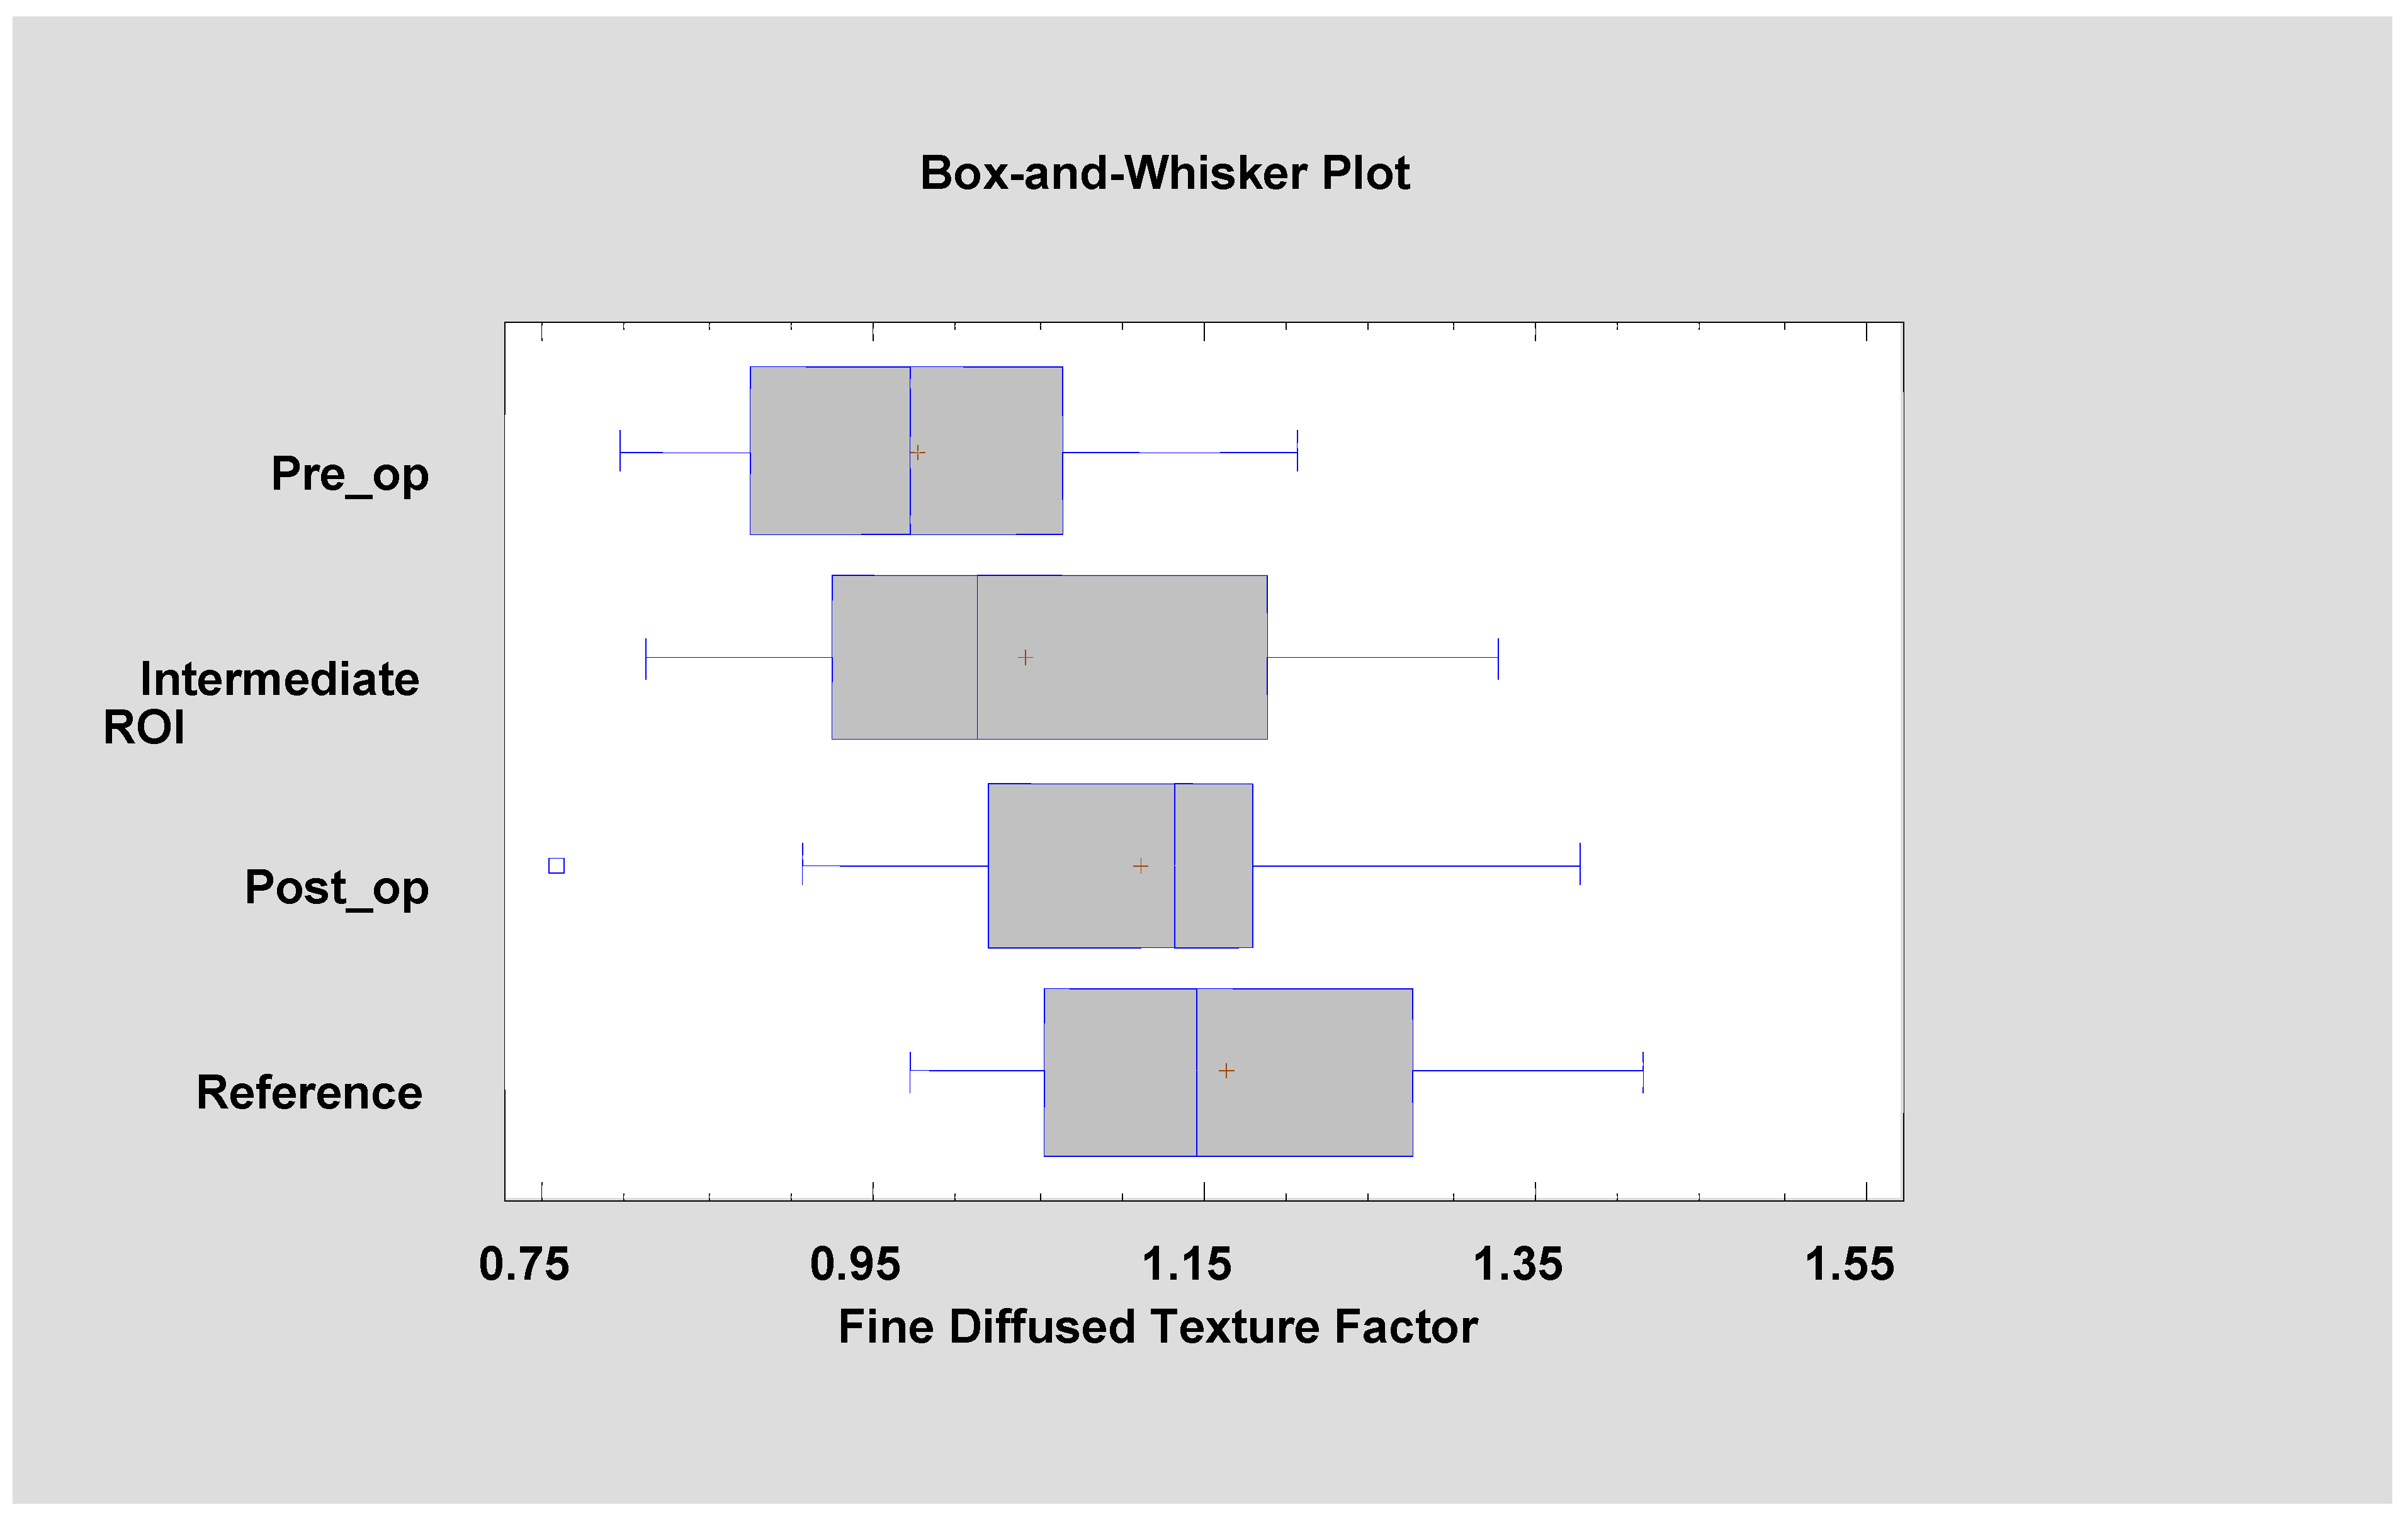
| FDT Factor | 0.98 ± 0.11 | 1.04 ± 0.15 | 1.11 ± 0.13 | p < 0.001 |
| FDA–WDT Factor | 2.08 ± 0.27 | 2.14 ± 0.20 | 2.01 ± 0.15 | n.s. |
© 2020 by the authors. Licensee MDPI, Basel, Switzerland. This article is an open access article distributed under the terms and conditions of the Creative Commons Attribution (CC BY) license (http://creativecommons.org/licenses/by/4.0/).
Share and Cite
Jurczyszyn, K.; Kozakiewicz, M. Application of Texture and Fractal Dimension Analysis to Estimate Effectiveness of Oral Leukoplakia Treatment Using an Er:YAG Laser—A Prospective Study. Materials 2020, 13, 3614. https://doi.org/10.3390/ma13163614
Jurczyszyn K, Kozakiewicz M. Application of Texture and Fractal Dimension Analysis to Estimate Effectiveness of Oral Leukoplakia Treatment Using an Er:YAG Laser—A Prospective Study. Materials. 2020; 13(16):3614. https://doi.org/10.3390/ma13163614
Chicago/Turabian StyleJurczyszyn, Kamil, and Marcin Kozakiewicz. 2020. "Application of Texture and Fractal Dimension Analysis to Estimate Effectiveness of Oral Leukoplakia Treatment Using an Er:YAG Laser—A Prospective Study" Materials 13, no. 16: 3614. https://doi.org/10.3390/ma13163614
APA StyleJurczyszyn, K., & Kozakiewicz, M. (2020). Application of Texture and Fractal Dimension Analysis to Estimate Effectiveness of Oral Leukoplakia Treatment Using an Er:YAG Laser—A Prospective Study. Materials, 13(16), 3614. https://doi.org/10.3390/ma13163614