Application of Elastic Waves and Neural Networks for the Prediction of Forces in Bolts of Flange Connections Subjected to Static Tension Tests


Abstract
1. Introduction
- Anomaly or damage detection;
- Damage type classification;
- Load or internal force prediction;
- Material parameter identification.
2. Materials and Methods
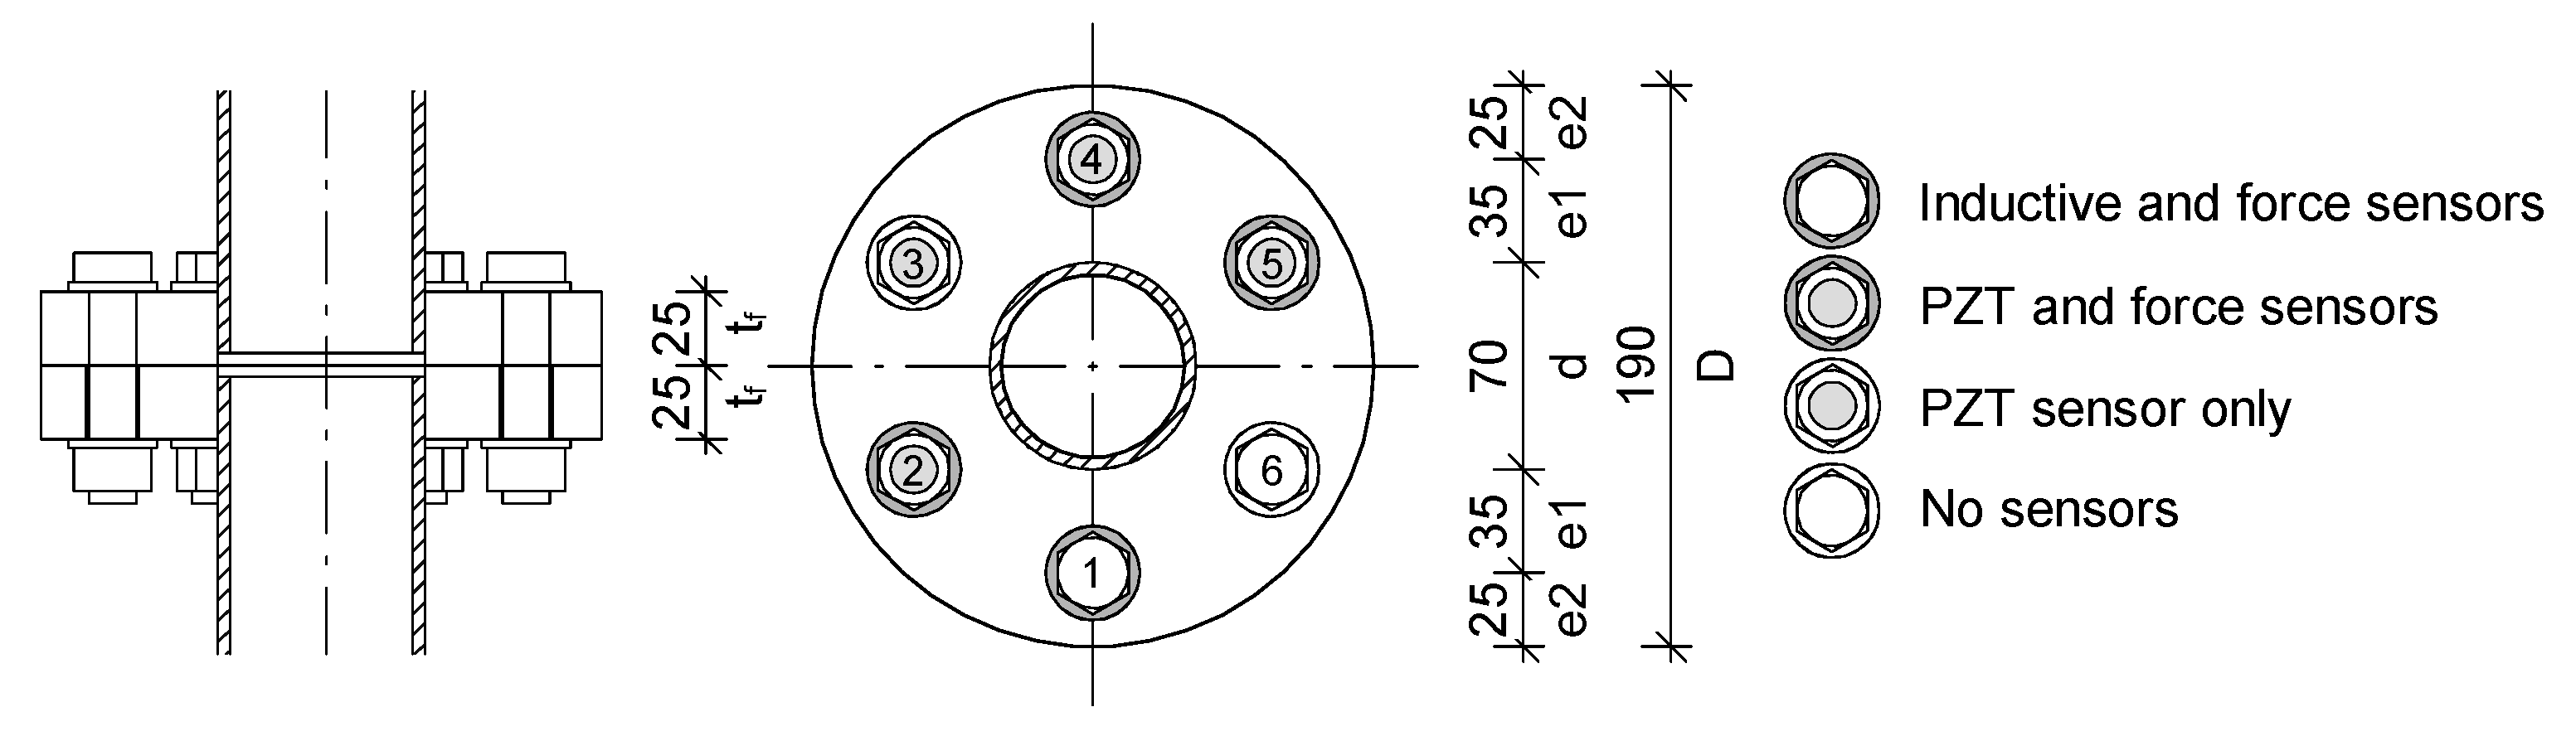
2.1. The Idea of Force Monitoring in Bolts
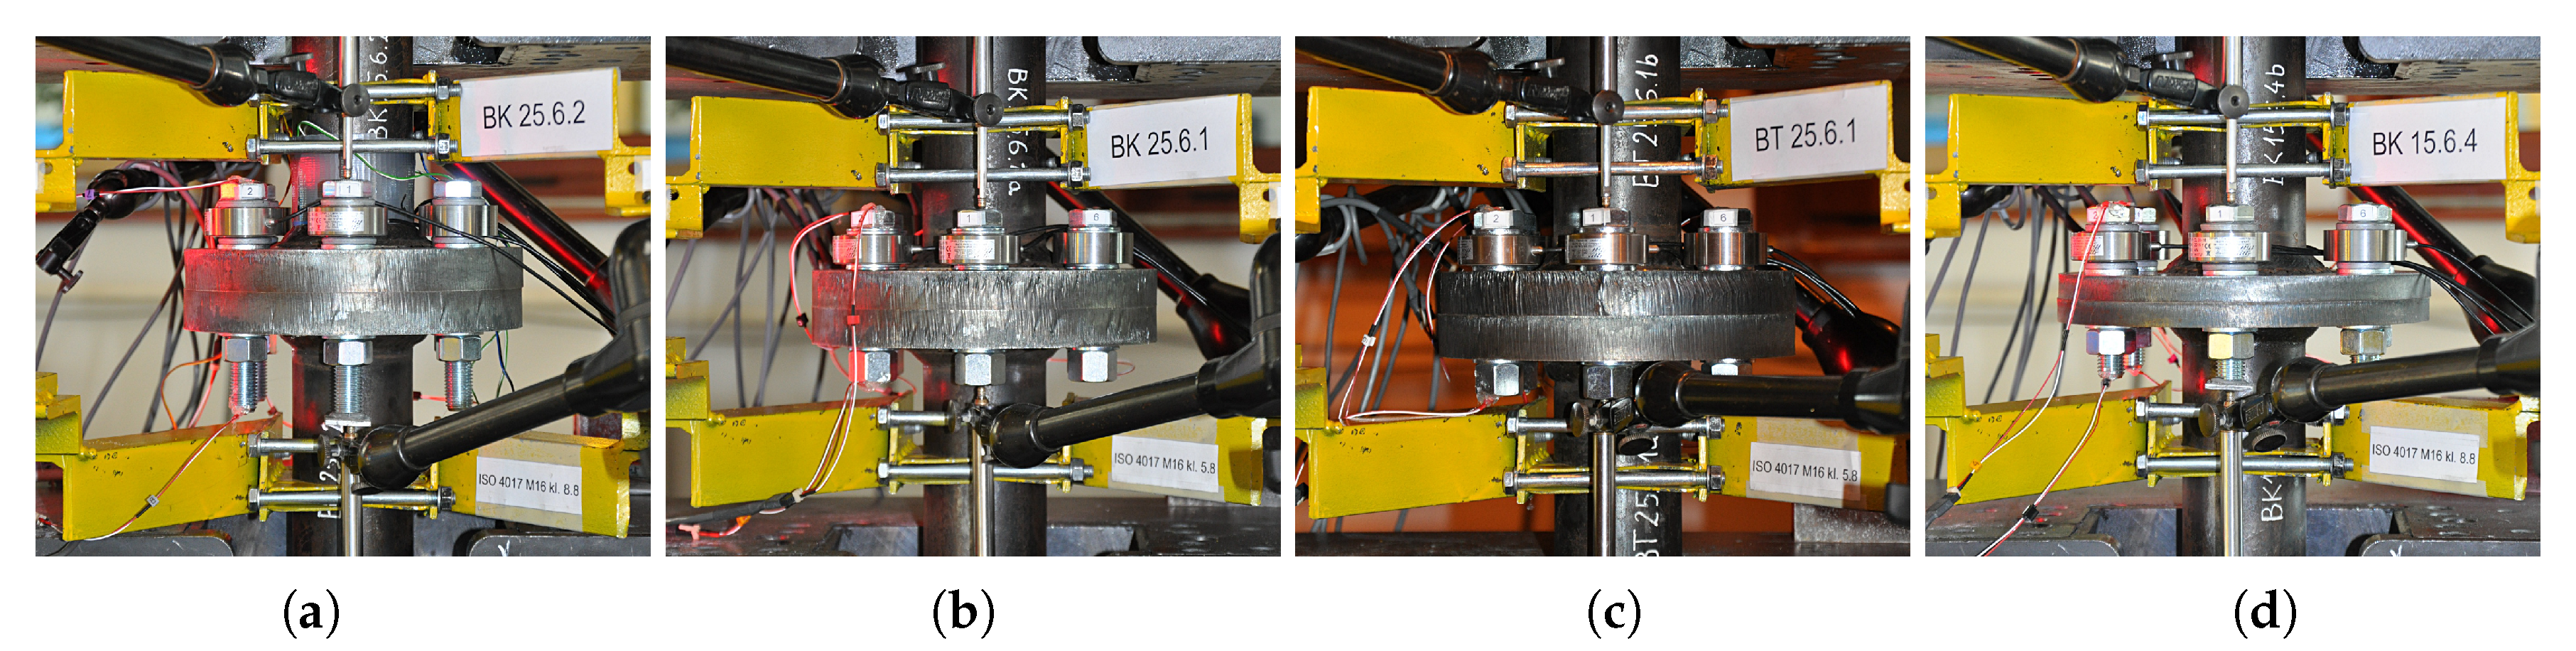
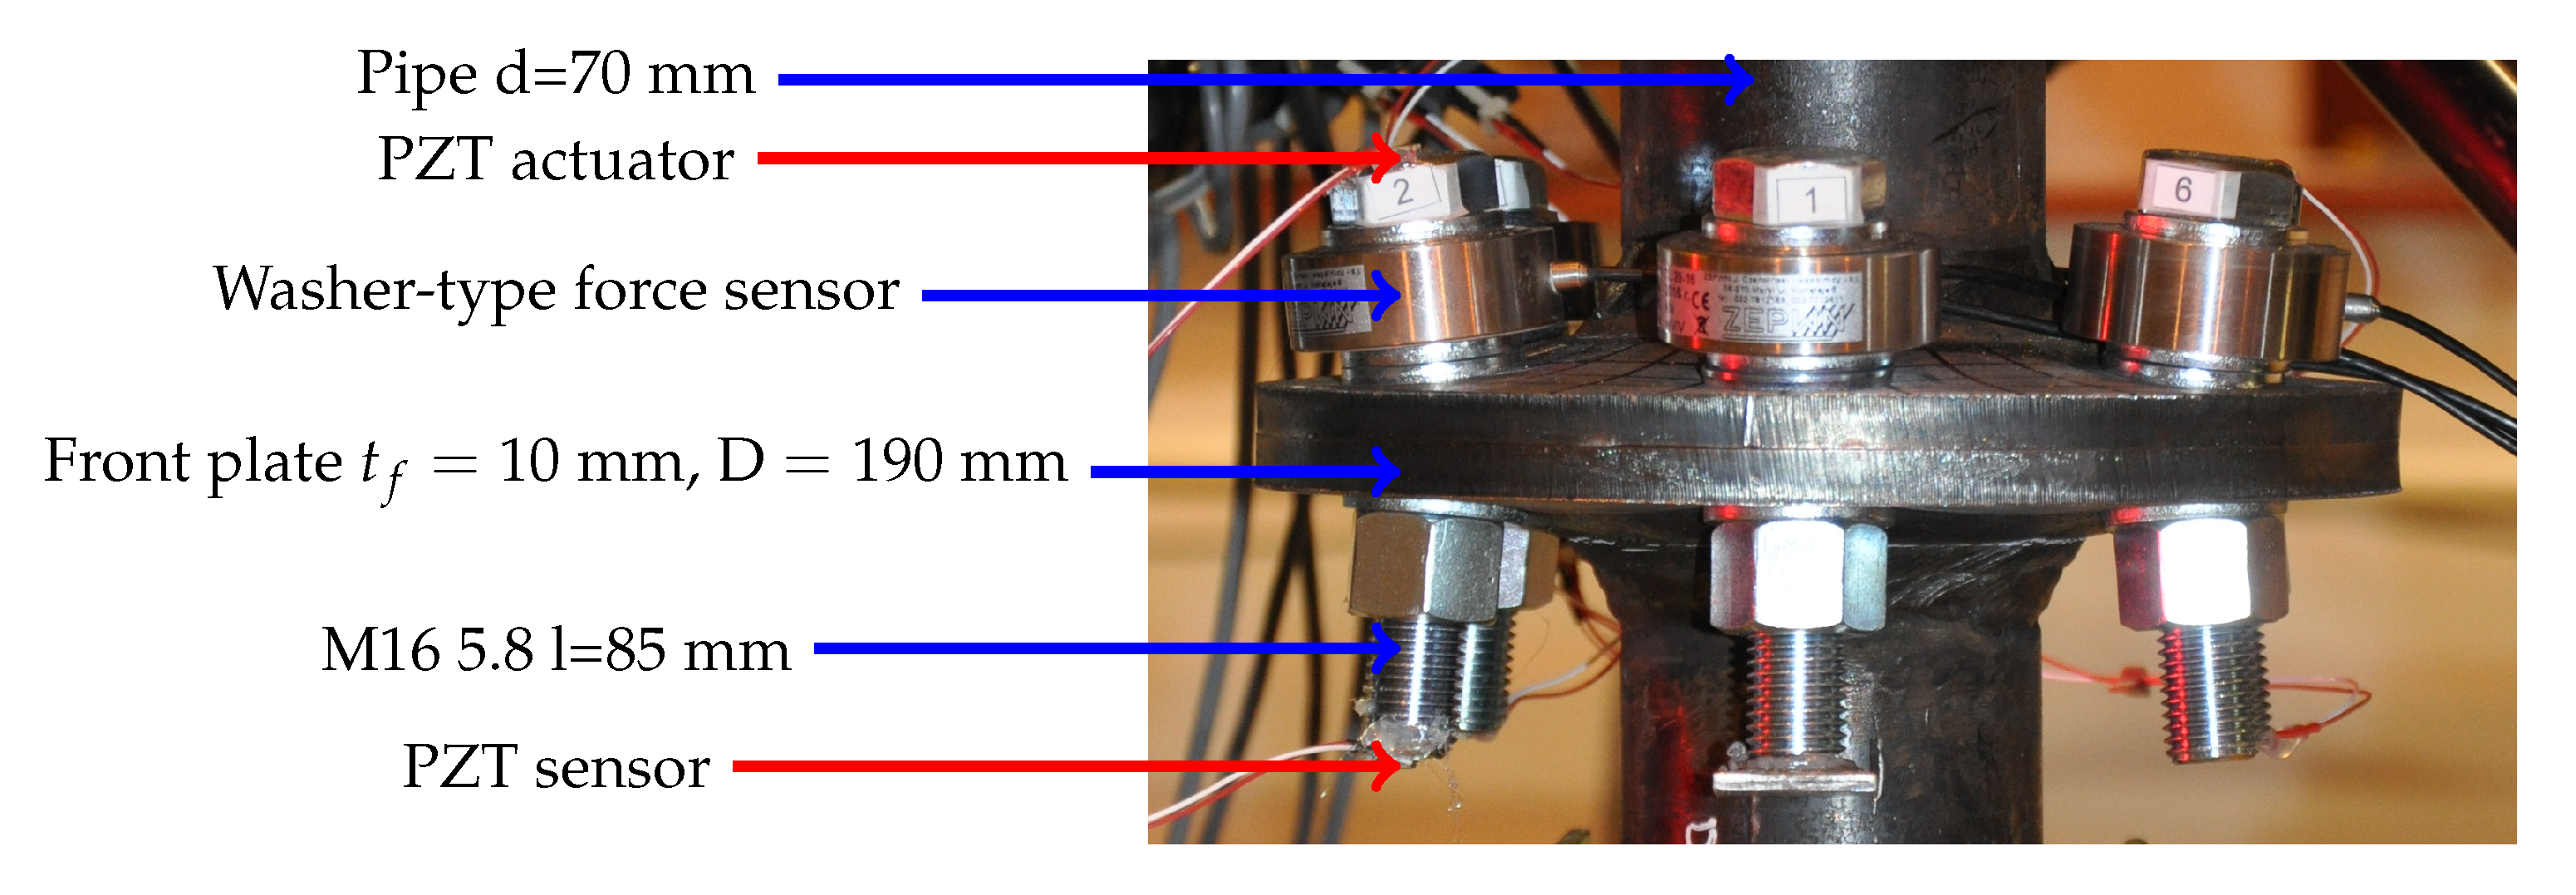
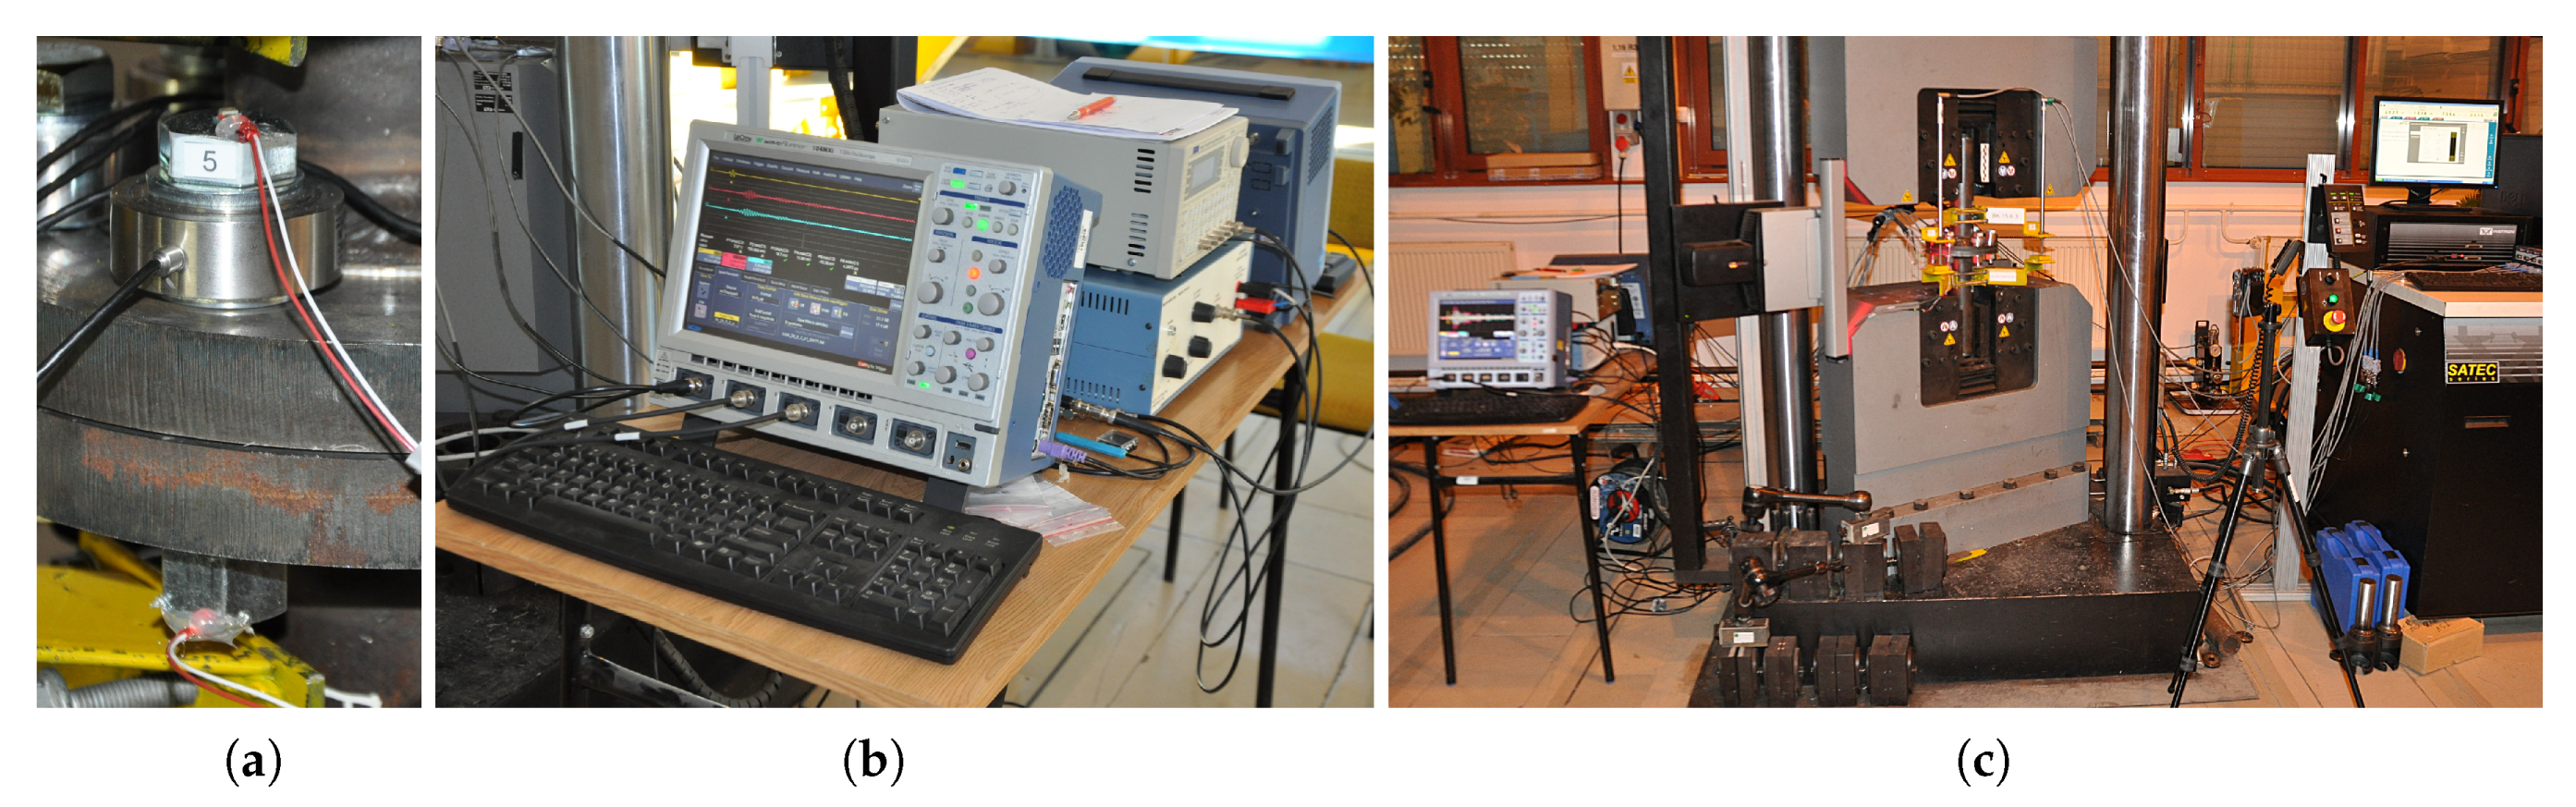
2.2. Laboratory Setup
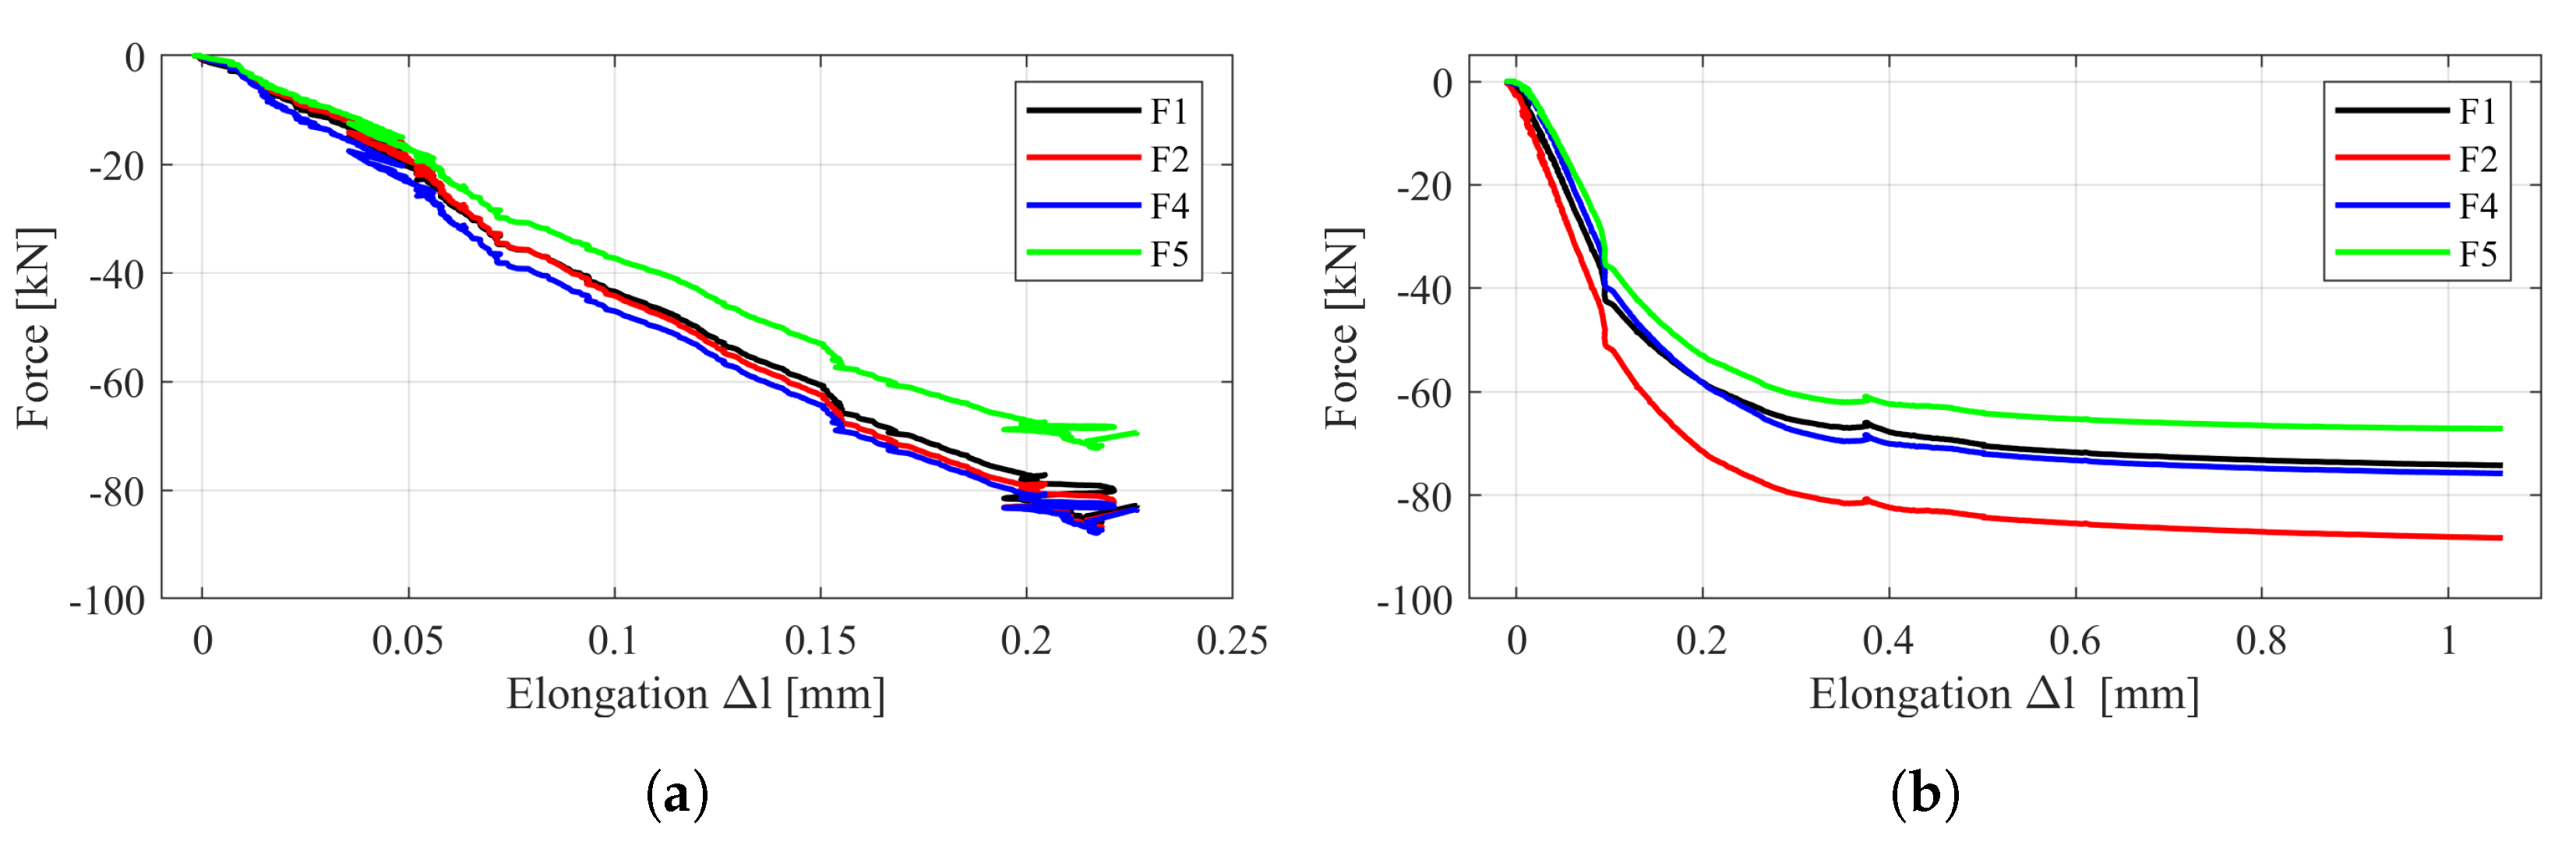
2.3. Flange Connections under Static Tests
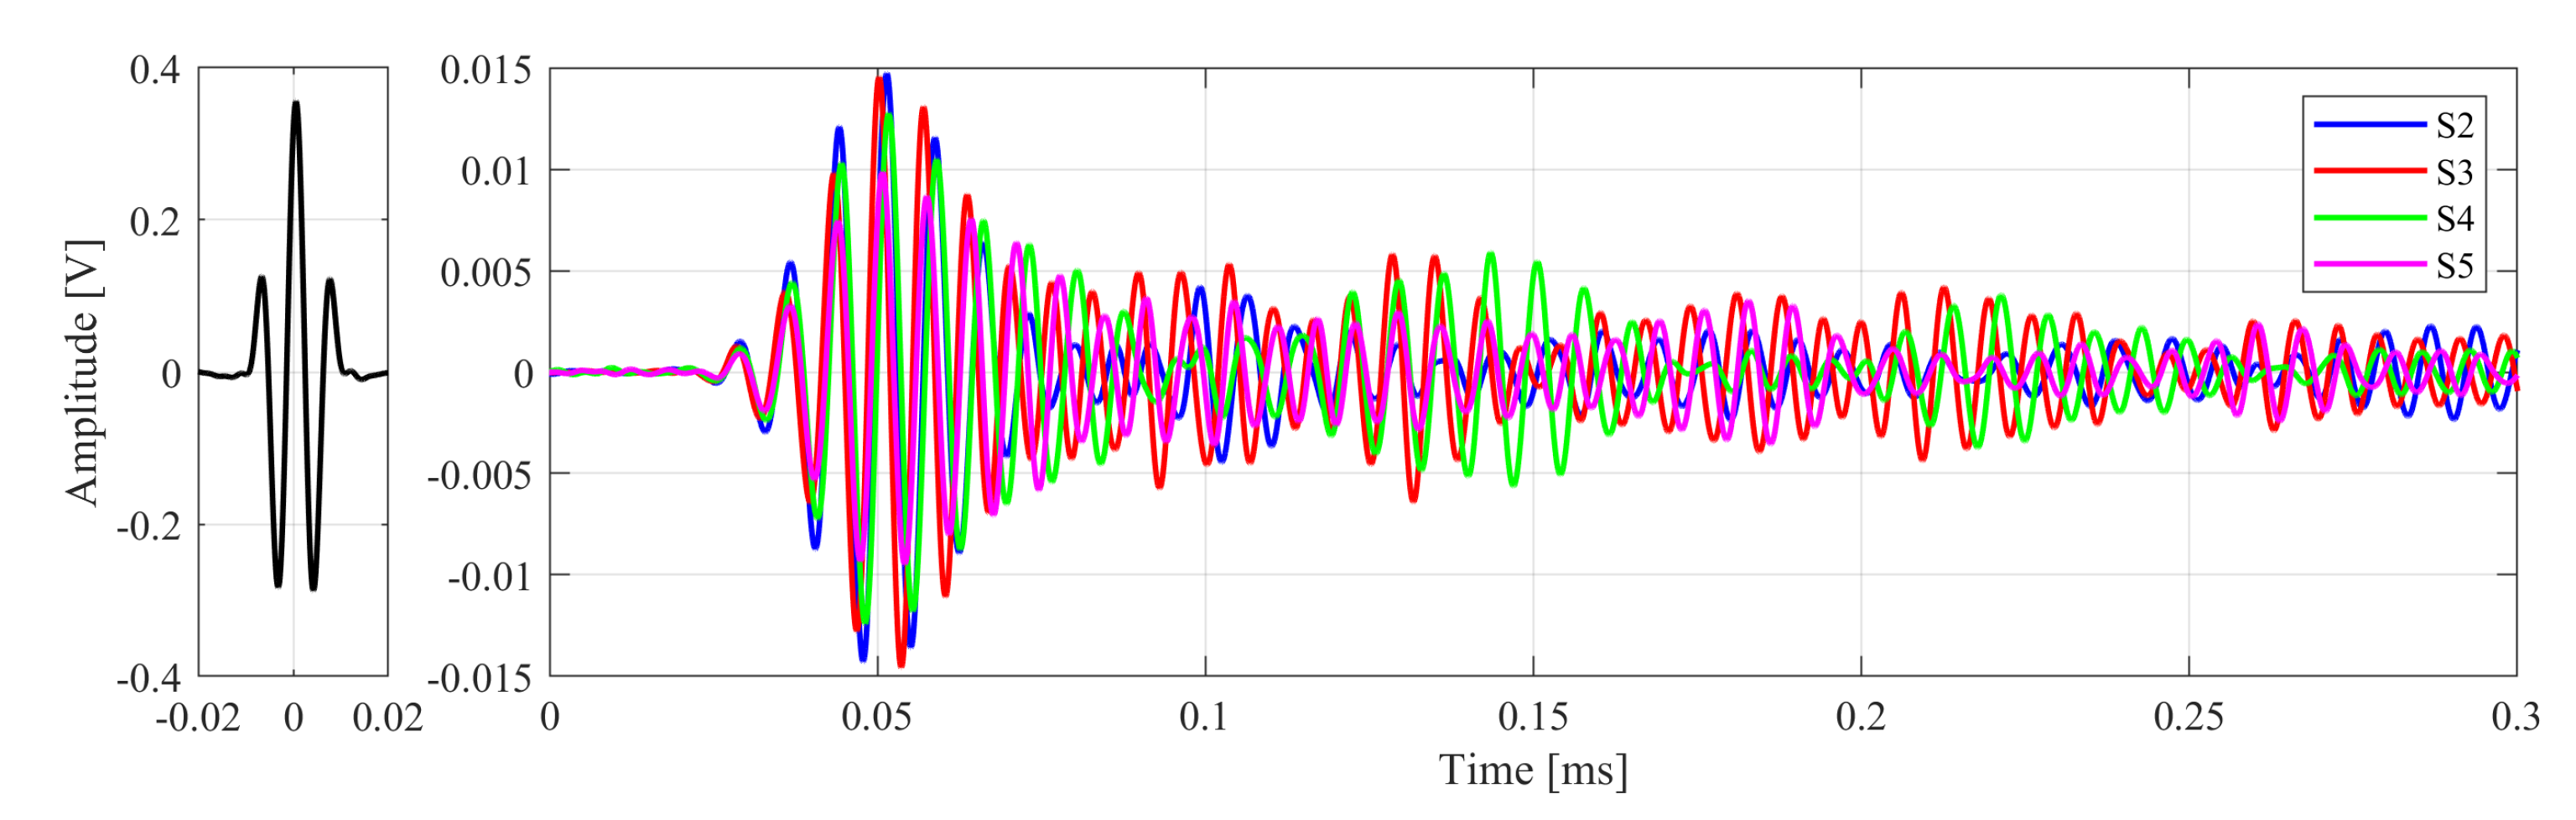
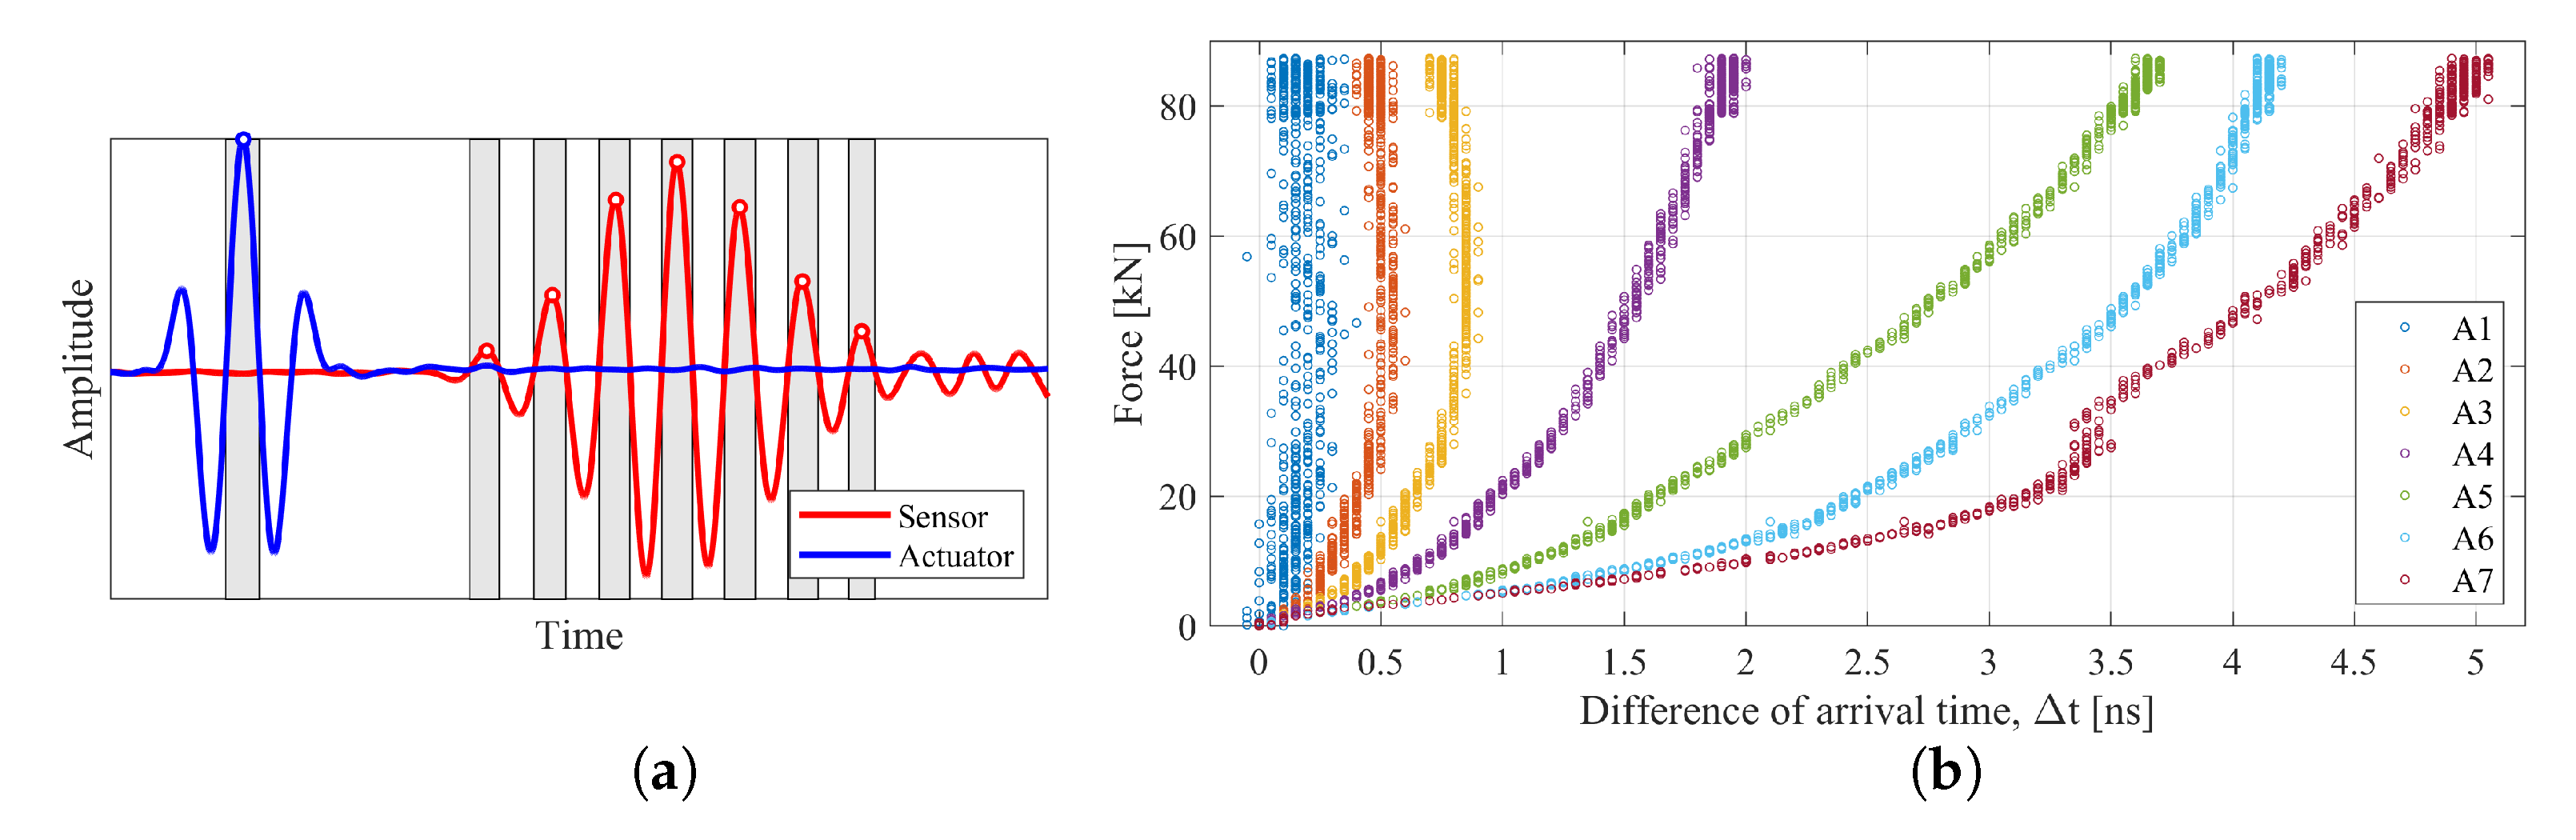
2.4. Signal Analysis
2.5. Artificial Neural Networks
3. Results and Discussion
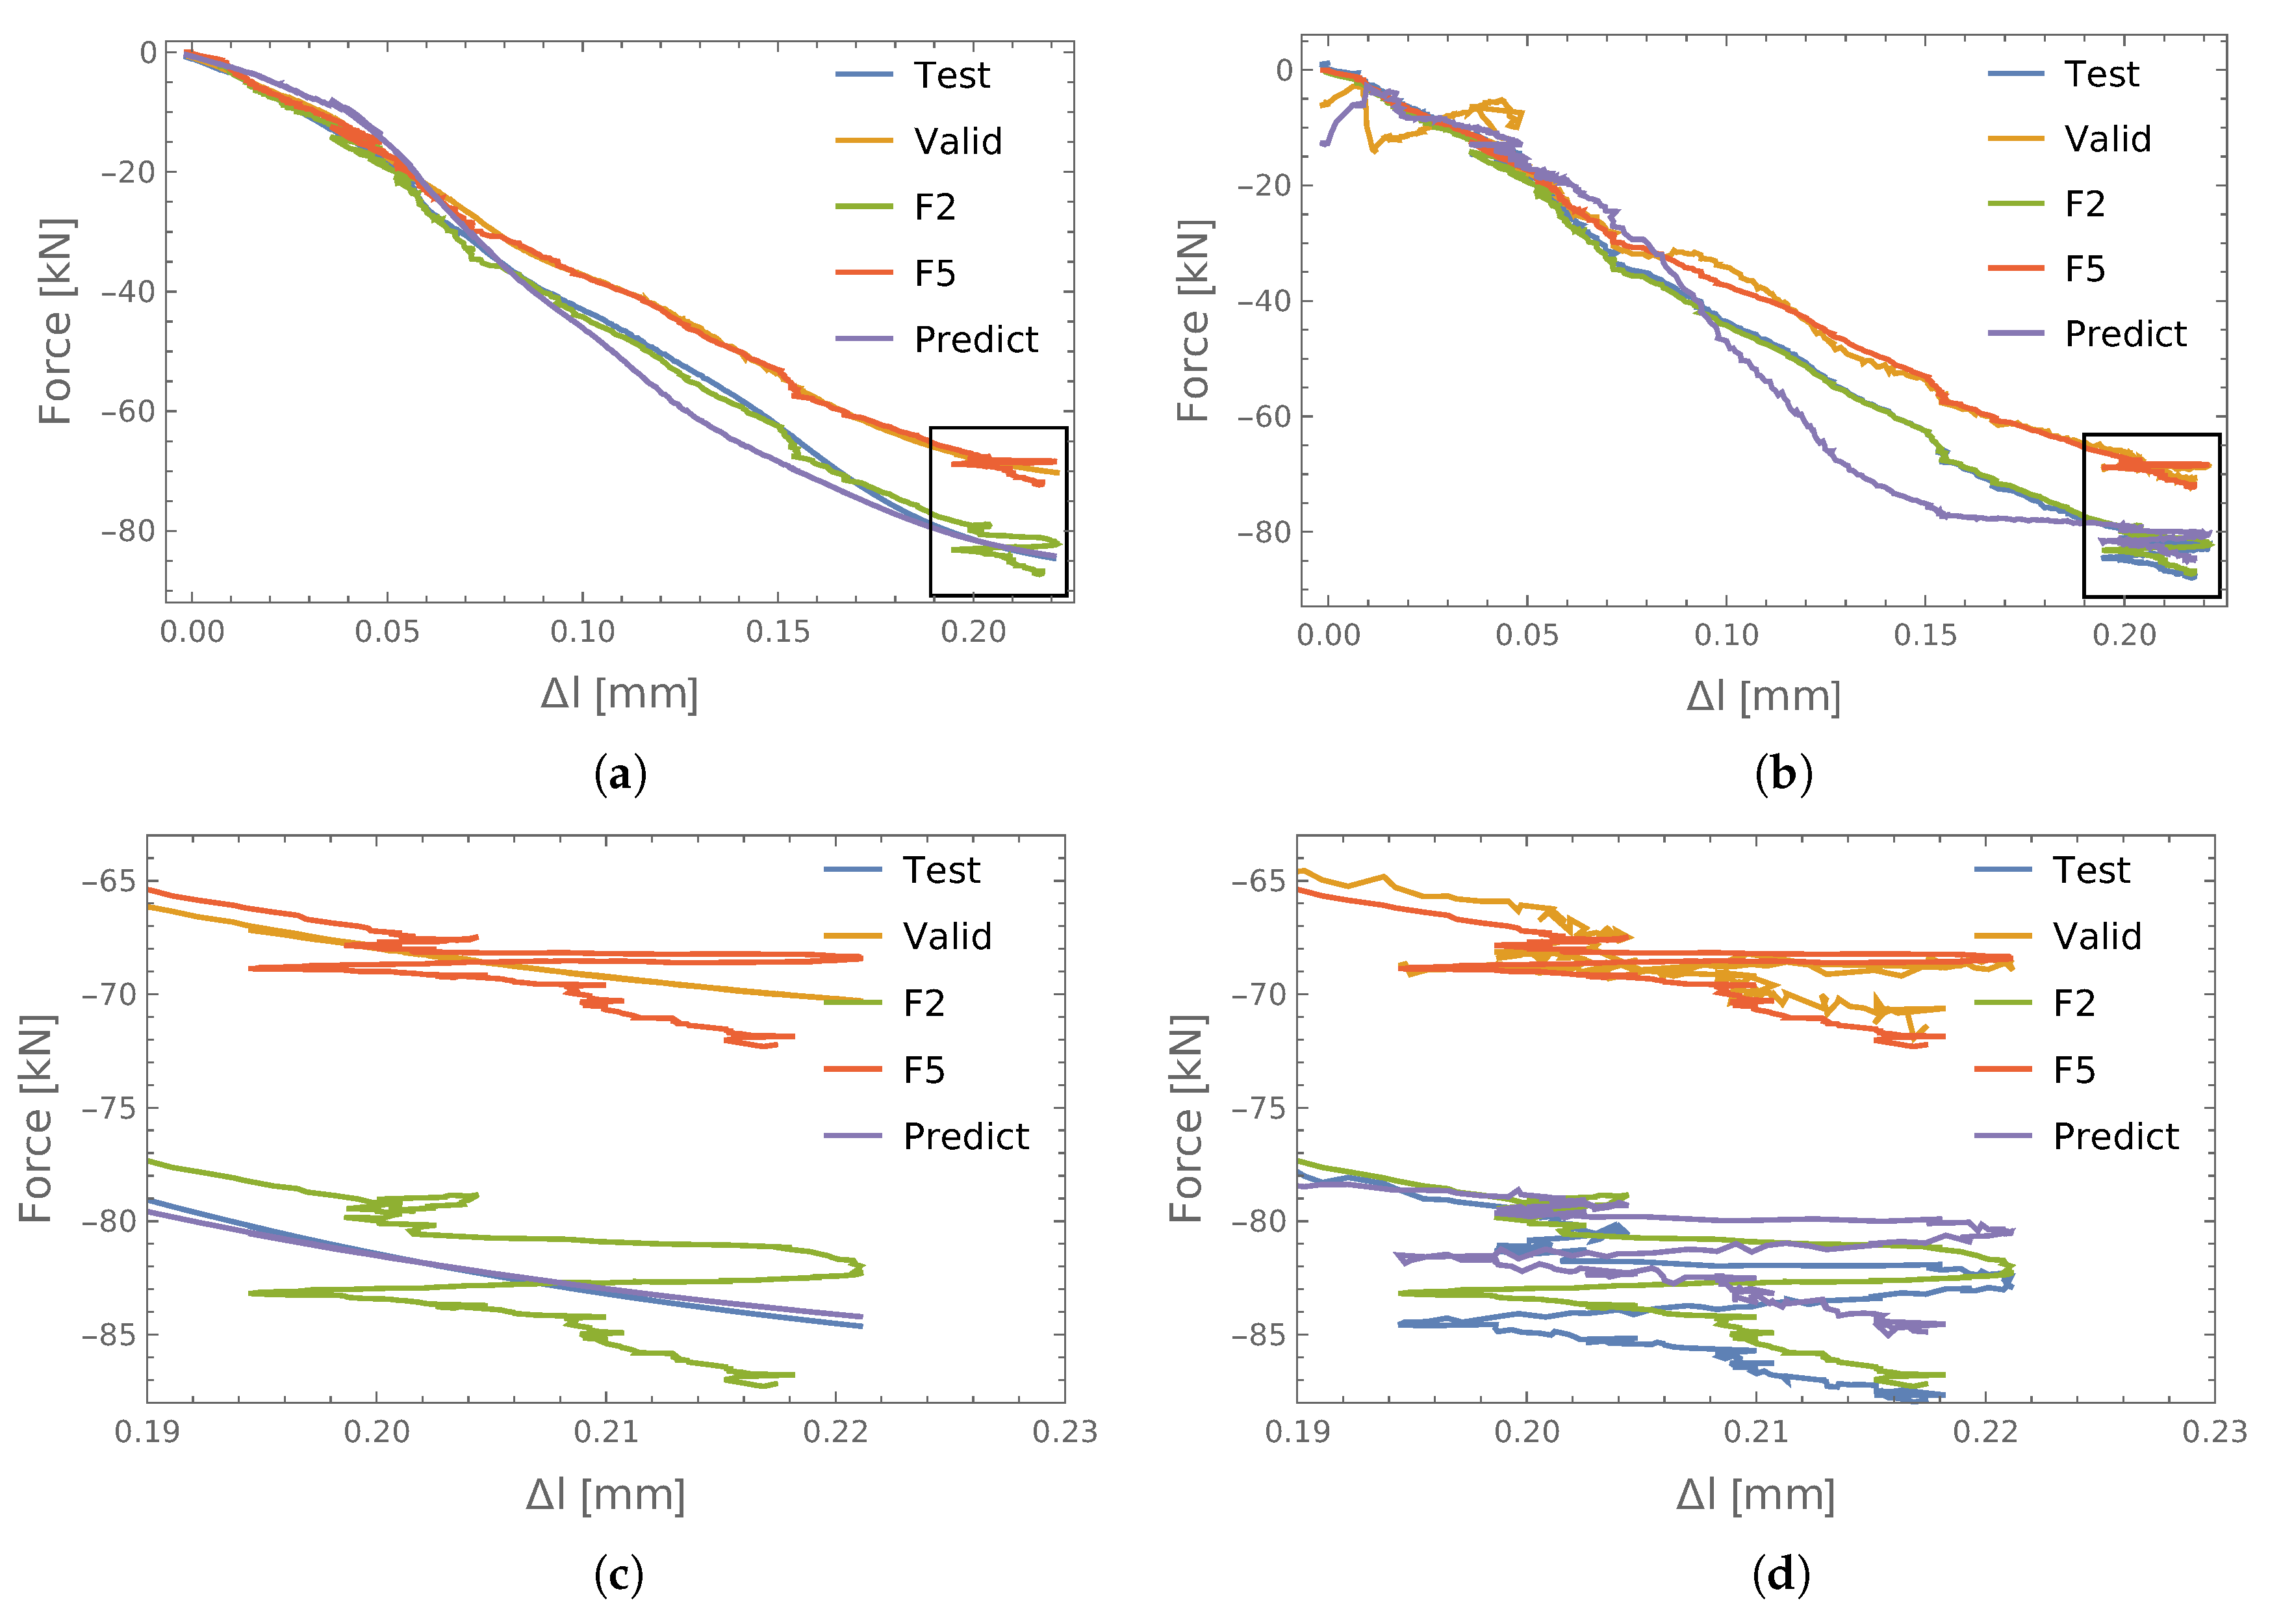
3.1. Force Prediction in Single Connections
- S4 for learning (learn);
- S2 for testing (test);
- S5 for validation (valid);
- S3 for prediction (predict).
- Twelve principal components (PCA);
- Six amplitudes of the response signals and theirs six arrival times (TA);
- Twelve parameters obtained from the encoder.
3.2. Force Prediction in Sets of Connections
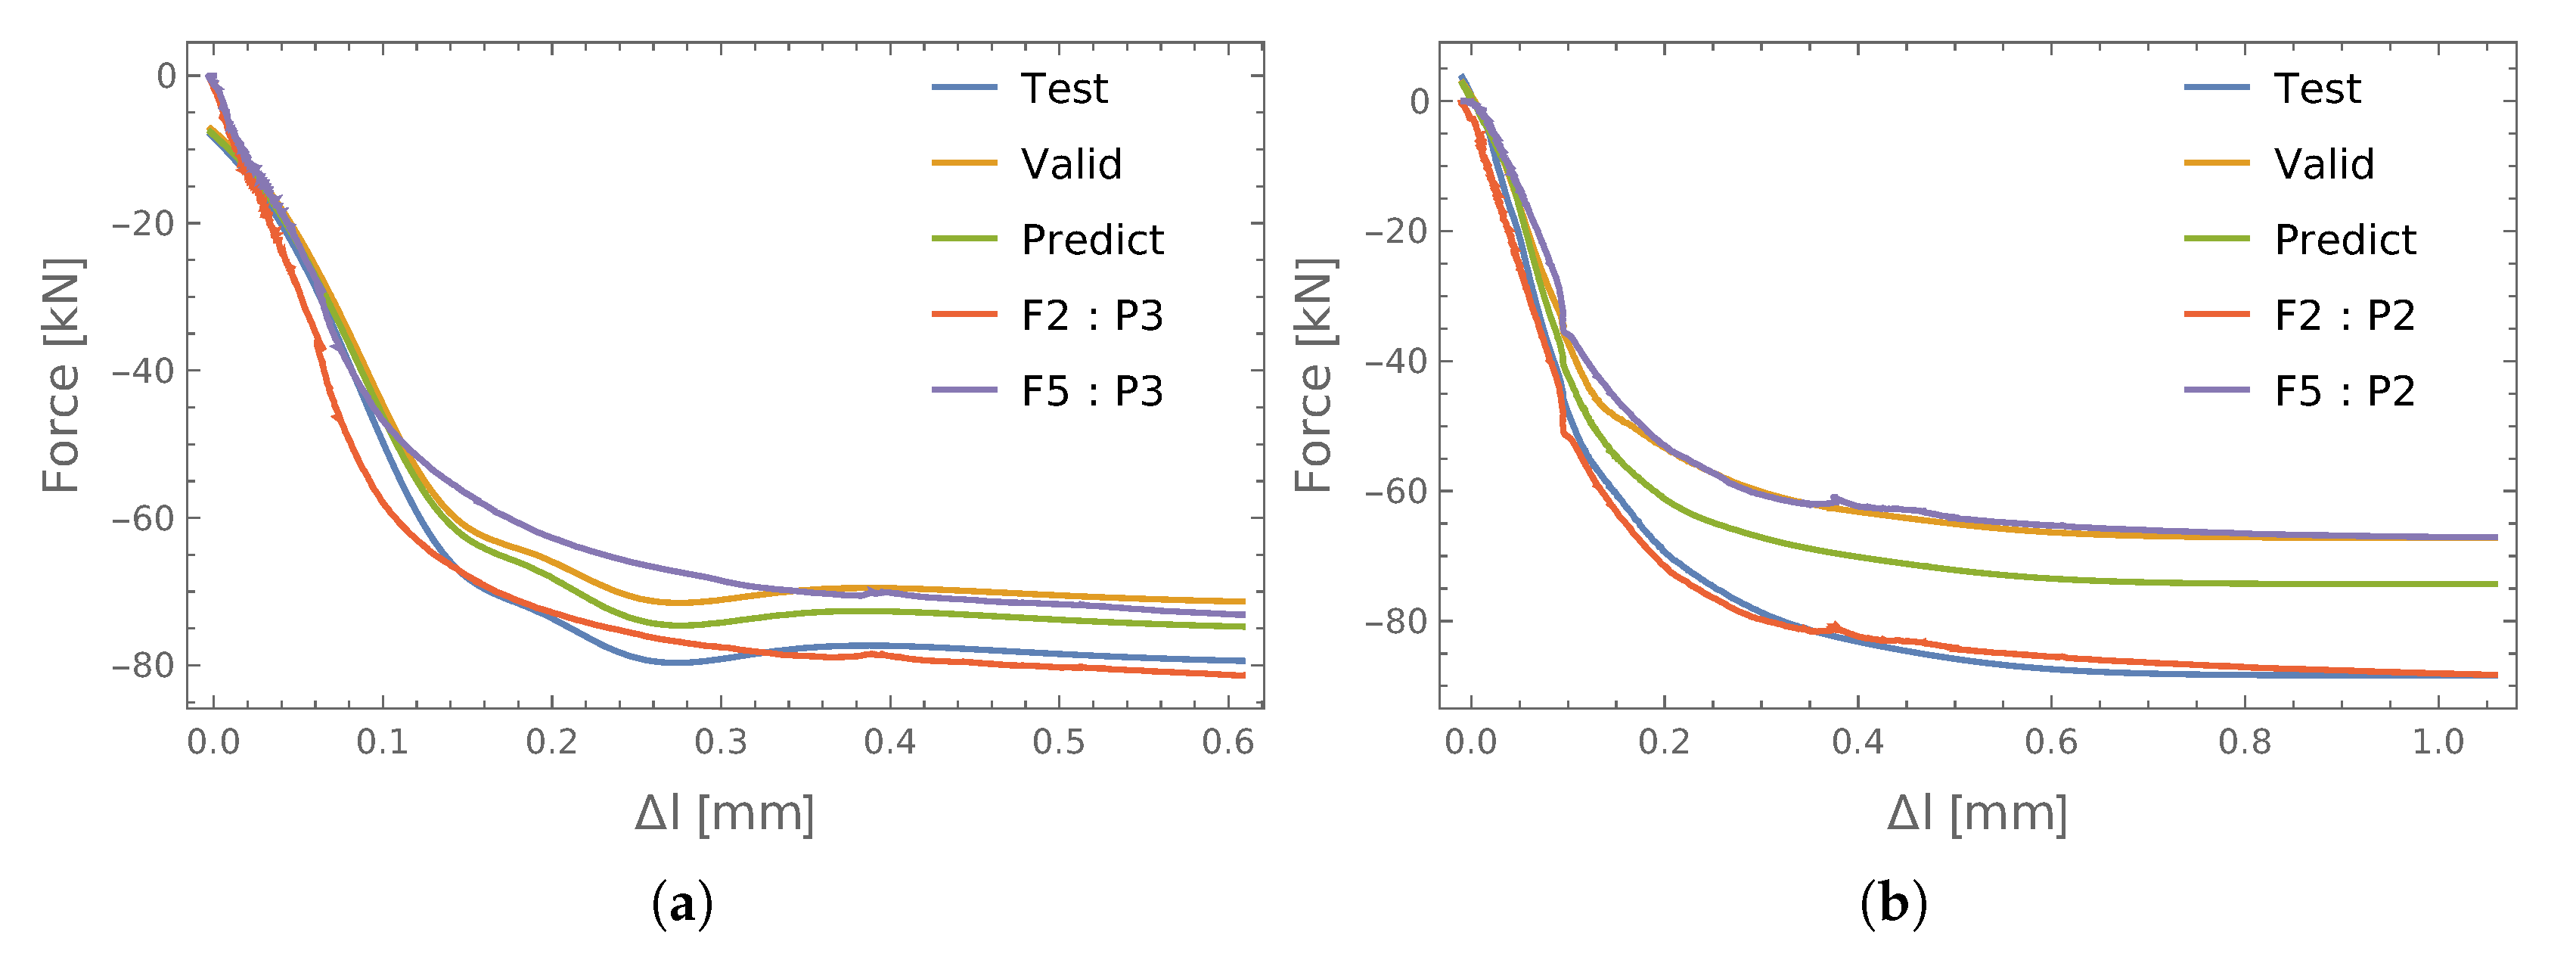
3.2.1. P2P3
- The ANN used data from the P2 = {S2, S4, S5} connection to learn, while data from P3 = {S4, S5} were used for testing and P3 = {S2} for validation;
- The ANN used data from the P3 = {S2, S4, S5} connection to learn, while data from P2 = {S4, S5} were used for testing and P2 = {S2} for validation.
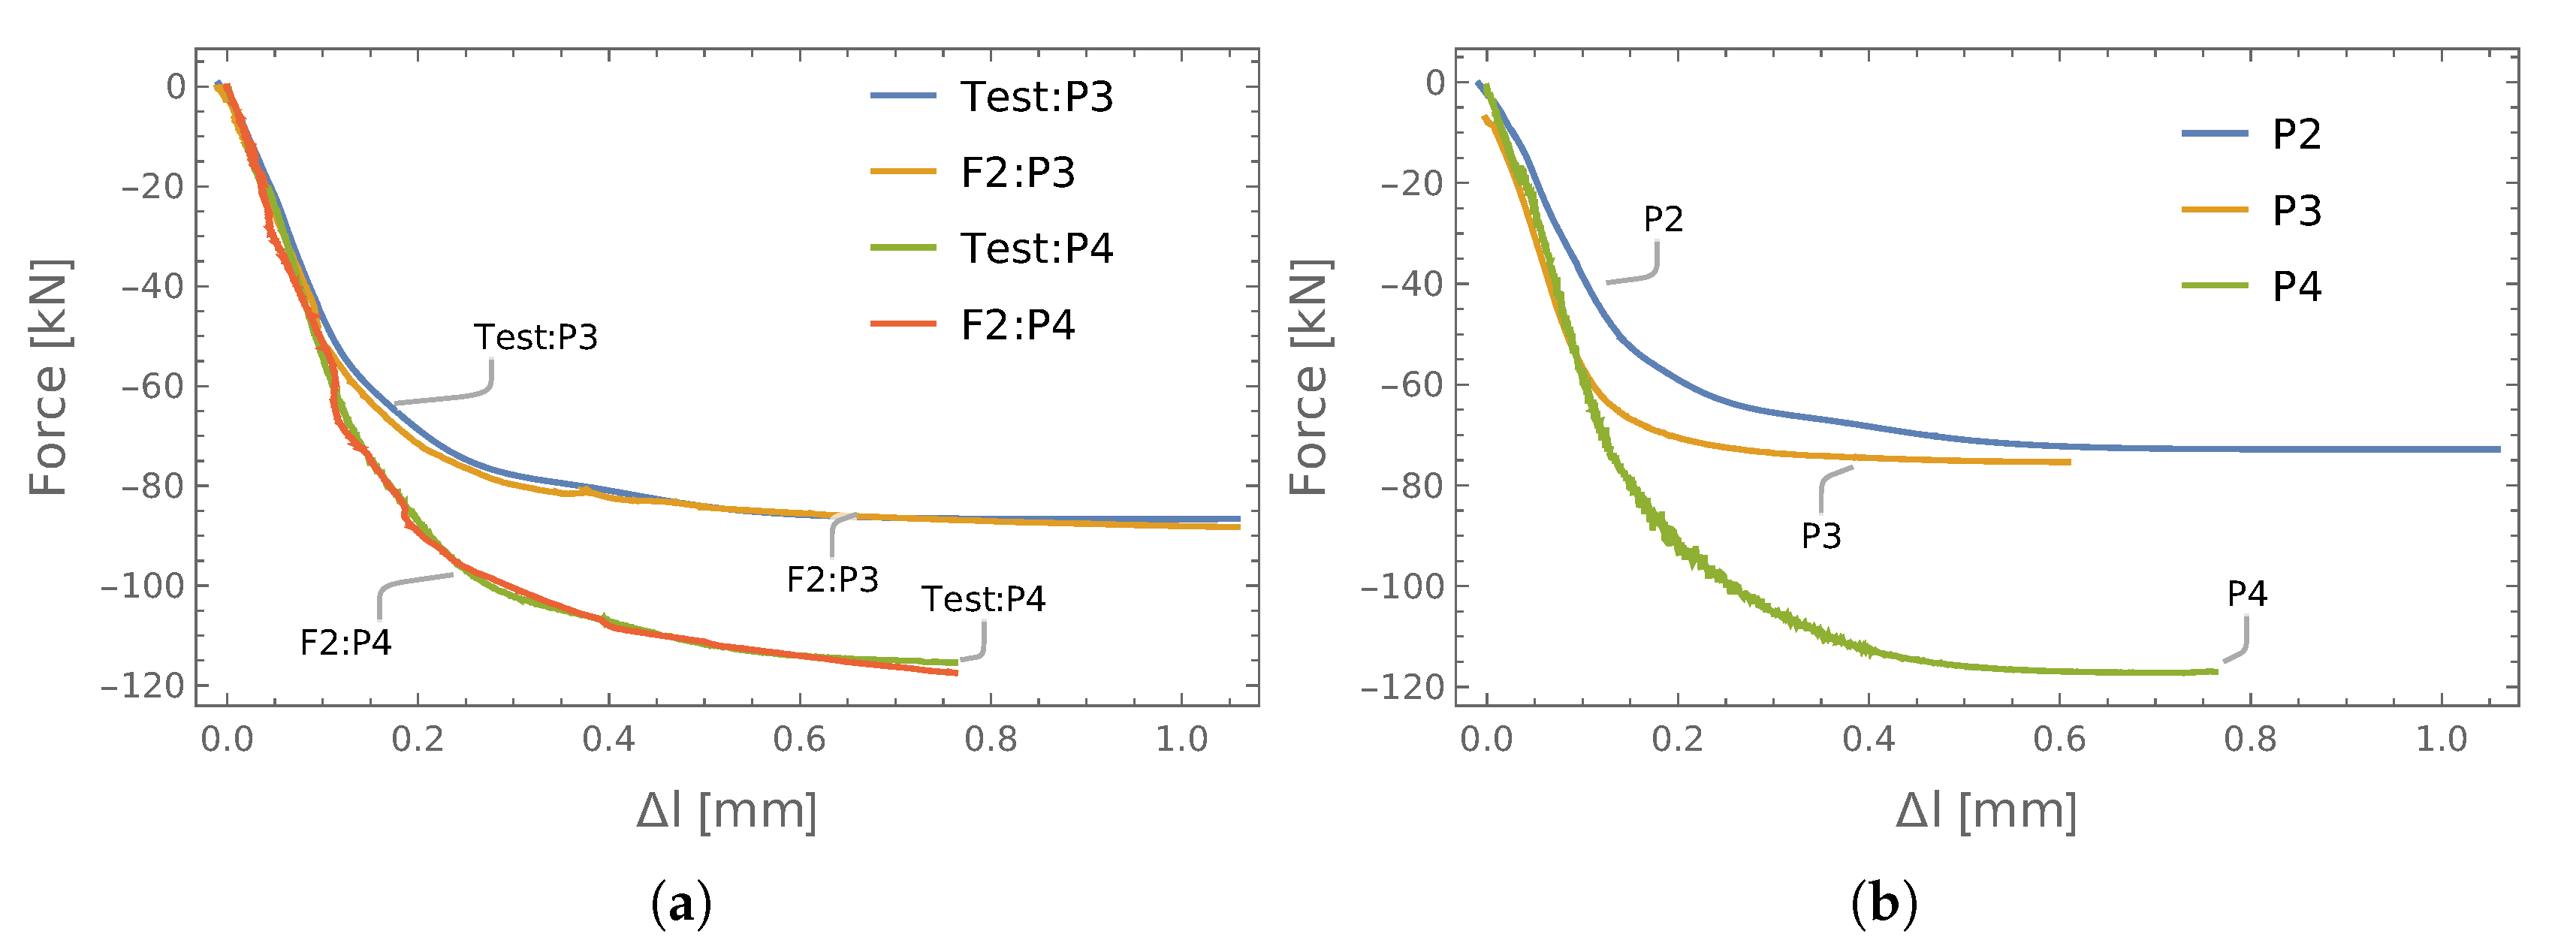
3.2.2. Set of P2P3P4 Connections
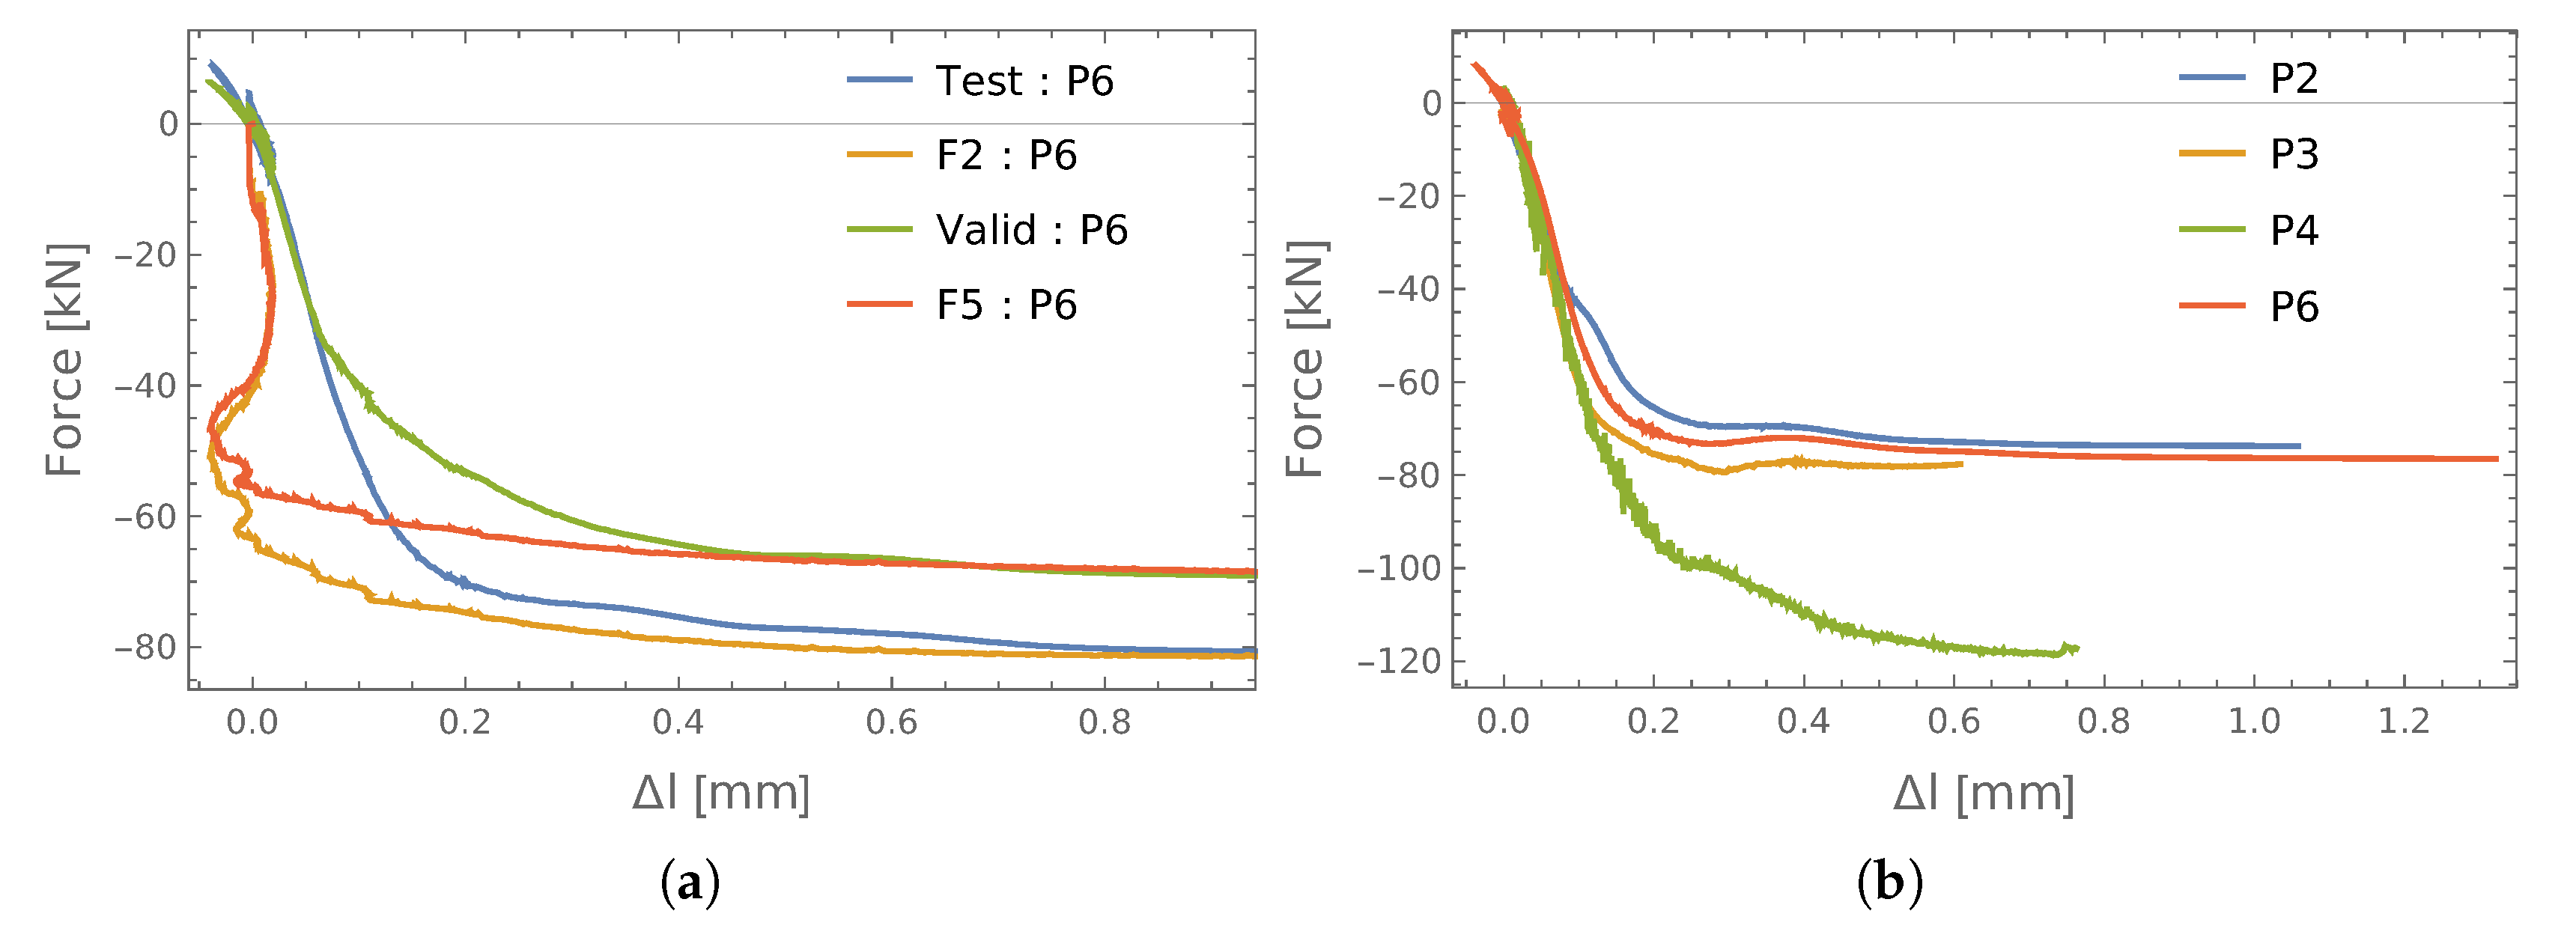
3.2.3. Set of P2P3P4P6 Connections
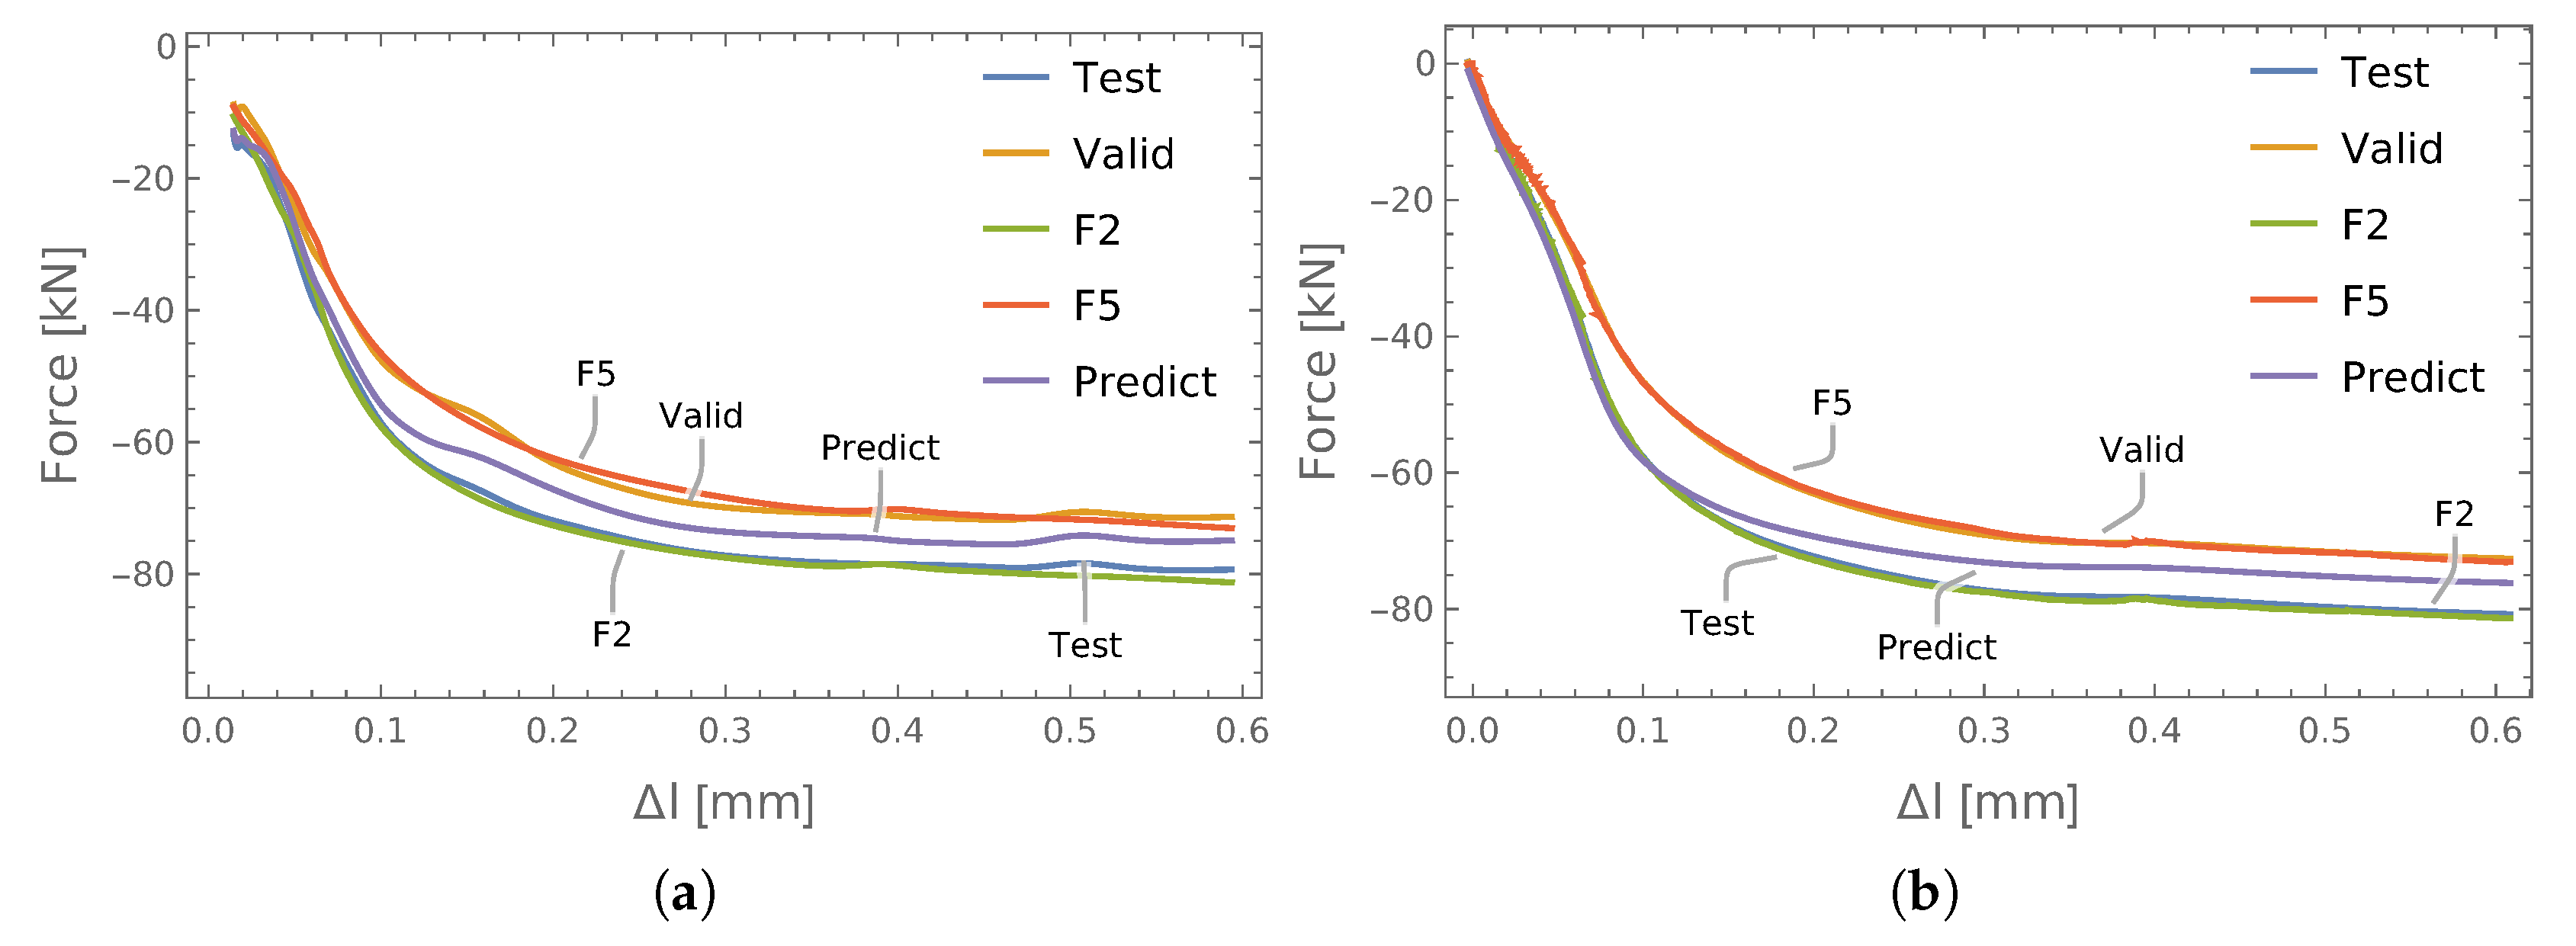
3.3. Force Prediction Using Load/Elongation Increments
4. Conclusions
Author Contributions
Funding
Conflicts of Interest
Abbreviations
| ANN | Artificial neural networks |
| Pj | Connection number, where |
| DL | Deep learning |
| Fi | Force magnitude in the Si screw, where |
| DNN | Deep neural network |
| MLP | Multi-layer perceptron |
| MSE | Mean squared error |
| NDT | Non-destructive test |
| PCA | Principal components analysis |
| PZT | Piezoelectric transducer |
| Si | Screw number, where |
| SHM | Structural health monitoring |
| SNR | Signal-to-noise ratio |
| TA | Arrival time and amplitude |
| ToF | Time of flight |
| A bottleneck layer of the neural network | |
| An input layer of the neural network | |
| Standard deviation |
References
- Rucka, M. Monitoring steel bolted joints during a monotonic tensile test using linear and nonlinear Lamb wave methods. A feasibility study. Metals 2018, 8, 683. [Google Scholar] [CrossRef]
- Sale, M.; Rizzo, P.; Marzani, A. Semi-analytical formulation for the guided waves-based reconstruction of elastic moduli. Mech. Syst. Signal Proc. 2008, 25, 2241–2256. [Google Scholar] [CrossRef]
- Słoński, M. Bayesian Machine Learning in Analysis of Selected Identification Problems in Mechanics of Materials and Structures. In Monografia–Politechnika Krakowska im. Tadeusza Kościuszki: Inżynieria Lądowa; Wydawnictwo PK: Krakow, Poland, 2014. [Google Scholar]
- Yu, L.; Giurgiutiu, V.; Marzan, A. Advanced signal processing for enhanced damage detection with piezoelectric wafer active sensors. Smart Struc. Syst. 2005, 1, 185–215. [Google Scholar] [CrossRef]
- Zima, B.; Rucka, M. Guided waves for monitoring of plate structures with linear cracks of variable length. Arch. Civ. Mech. Eng. 2016, 16, 387–396. [Google Scholar] [CrossRef]
- Żak, A.; Radzieński, M.; Krawczuk, M.; Ostachowicz, W. Damage detection strategies based on propagation of guided elastic waves. Smart Mater. Struct. 2012, 21, 035024. [Google Scholar] [CrossRef]
- Fric, N.; Budjevac, D.; Miskovic, Z.; Veljkovic, M.; Markovic, Z.; Dobric, J. Calibration of the high strenght bolts for measuring of the pretension force. In Proceedings of the Eighth International Conference on Advances in Steel Structures, Lisbon, Portugal, 22–24 July 2015; pp. 1–10. [Google Scholar]
- Nazarko, P.; Ziemiański, L. Damage detection in aluminum and composite elements using neural networks for Lamb waves signal processing. Eng. Fail. Anal. 2016, 69, 97–107. [Google Scholar] [CrossRef]
- Chaki, S.; Bourse, G. Guided ultrasonic waves for non-destructive monitoring of the stress levels in prestressed steel strands. Ultrasonics 2009, 49, 162–171. [Google Scholar] [CrossRef] [PubMed]
- Waszczyszyn, Z.; Ziemiański, L. Neural Networks in the Identification Analysis of Structural Mechanics Problems. In Parameter Identification of Materials and Structures; CISM Courses and Lectures, 469; Mróz, Z., Stavroulakis, G.E., Eds.; Springer: Vienna, Austria, 2005; pp. 265–340. [Google Scholar]
- Nazarko, P.; Ziemiański, L. Force identification in bolts of flange connections for structural health monitoring and failure prevention. Procedia Struct. Integr. 2017, 5, 460–467. [Google Scholar] [CrossRef]
- Nazarko, P. Soft computing methods in the analysis of elastic wave signals and damage identification. Inverse Probl. Sci. Eng. 2013, 21, 945–956. [Google Scholar] [CrossRef]
- Chen, R.; Chen, S.; Yang, L.; Wang, J.; Xu, X.; Luo, T. Looseness diagnosis method for connecting bolt of fan foundation based on sensitive mixed-domain features of excitation-response and manifold learning. Neurocomputing 2017, 219, 376–388. [Google Scholar] [CrossRef]
- Kim, N.; Hong, M. Measurement of axial stress using mode-converted ultrasound. NDT&E Intern. 2009, 42, 164–169. [Google Scholar]
- Ding, X.; Wu, X.; Wang, Y. Bolt axial stress measurement based on a mode-converted ultrasound method using an electromagnetic acoustic transducer. Ultrasonics 2014, 54, 914–920. [Google Scholar] [CrossRef] [PubMed]
- Miao, R.; Shen, R.; Zhang, S.; Xue, S. A Review of Bolt Tightening Force Measurement and Loosening Detection. Sensors 2020, 20, 3165. [Google Scholar] [CrossRef] [PubMed]
- Nazarko, P. Axial force prediction based on signals of the elastic wave propagation and artificial neural networks. MATEC Web Conf. 2019, 262, 10009. [Google Scholar] [CrossRef][Green Version]
- Sun, Q.; Bo, Y.; Mu, X.; Sun, W. Bolt preload measurement based on the acoustoelastic effect using smart piezoelectric bolt. Smart Mater. Struct. 2019, 28, 055005. [Google Scholar] [CrossRef]
- Yasui, H.; Kawashima, K. Acoustoelastic Measurement of Bolt Axial Load with Velocity Ratio Method. In Proceedings of the Proceeding of the 15th World Conference on Nondestructive Testing, Roma, Italy, 15–21 October 2000. [Google Scholar]
- LeCun, Y.; Bengio, G. Hinton, Deep learning. Nature 2018, 521, 436–444. [Google Scholar] [CrossRef] [PubMed]
- Miller, B.; Ziemiański, L. Optimization of dynamic behavior of thin-walled laminated cylindrical shells by genetic algorithms and deep neural networks supported by modal shape identification. Adv. Eng. Softw. 2020, 147, 102830. [Google Scholar] [CrossRef]
- Marsland, S. Machine Learning: An Algorithmic Perspective; Chapman & Hall/CRC: Boca Raton, FL, USA, 2009. [Google Scholar]


| Connection | Symbol | Plate Geometry (///D) (mm) | Screws | |
|---|---|---|---|---|
| Class | Length (mm) | |||
| P1 | BK25.6.2 | 25/35/25/190 | 6M16 8.8 | 125 |
| P2 | BK 25.6.1 | 25/35/25/190 | 6M16 5.8 | 85 |
| P3 | BT25.6.1 | 25/35/25/190 | 6M16 5.8 | 85 |
| P4 | BK 15.6.4 | 15/45/25/210 | 6M16 8.8 | 85 |
| P5 * | BK 15.6.3 | 15/45/25/210 | 6M16 5.8 | 85 |
| P6 | BT 10.6.1 | 10/35/25/190 | 6M16 5.8 | 85 |
| Method | Learn | Test | Valid | |||
|---|---|---|---|---|---|---|
| MSE | MSE | MSE | ||||
| PCA | 14.6 | 12.1 | 41.1 | 20.3 | 134.9 | 36.7 |
| TA | 139.4 | 37.3 | 164.3 | 35.2 | 13.2 | 11.5 |
| Encoder | 27.5 | 16.6 | 32.7 | 18.1 | 16.6 | 12.9 |
| Method | Learn | Test | Valid | |||
|---|---|---|---|---|---|---|
| MSE | MSE | MSE | ||||
| PCA | 2.75 | 5.24 | 4.24 | 7.23 | 36.2 | 19.1 |
| TA | 34.1 | 18.5 | 39.5 | 19.8 | 5.98 | 7.73 |
| Encoder | 3.83 | 6.20 | 4.03 | 3.55 | 3.78 | 6.11 |
| Method | Learn | Test | Valid | |||
|---|---|---|---|---|---|---|
| MSE | MSE | MSE | ||||
| P2-learn, P3-test and valid | 41.6 | 24.2 | 287.4 | 53.6 | 290.1 | 53.8 |
| P3-learn, P2-test and valid | 39.8 | 19.9 | 54.3 | 23.3 | 30.0 | 17.3 |
| Method | Learn | Test | Valid | |||
|---|---|---|---|---|---|---|
| MSE | MSE | MSE | ||||
| P3 | 3.83 | 6.20 | 4.03 | 3.55 | 3.78 | 6.11 |
| P3 increments | 18.8 | 13.7 | 26.8 | 16.4 | 29.7 | 17.2 |
© 2020 by the authors. Licensee MDPI, Basel, Switzerland. This article is an open access article distributed under the terms and conditions of the Creative Commons Attribution (CC BY) license (http://creativecommons.org/licenses/by/4.0/).
Share and Cite
Nazarko, P.; Ziemiański, L. Application of Elastic Waves and Neural Networks for the Prediction of Forces in Bolts of Flange Connections Subjected to Static Tension Tests. Materials 2020, 13, 3607. https://doi.org/10.3390/ma13163607
Nazarko P, Ziemiański L. Application of Elastic Waves and Neural Networks for the Prediction of Forces in Bolts of Flange Connections Subjected to Static Tension Tests. Materials. 2020; 13(16):3607. https://doi.org/10.3390/ma13163607
Chicago/Turabian StyleNazarko, Piotr, and Leonard Ziemiański. 2020. "Application of Elastic Waves and Neural Networks for the Prediction of Forces in Bolts of Flange Connections Subjected to Static Tension Tests" Materials 13, no. 16: 3607. https://doi.org/10.3390/ma13163607
APA StyleNazarko, P., & Ziemiański, L. (2020). Application of Elastic Waves and Neural Networks for the Prediction of Forces in Bolts of Flange Connections Subjected to Static Tension Tests. Materials, 13(16), 3607. https://doi.org/10.3390/ma13163607