Nondestructive Damage Testing of Beam Structure Based on Vibration Response Signal Analysis

Abstract
1. Introduction
2. Design of the Nondestructive Testing Algorithms Based on Vibration Signal Analysis
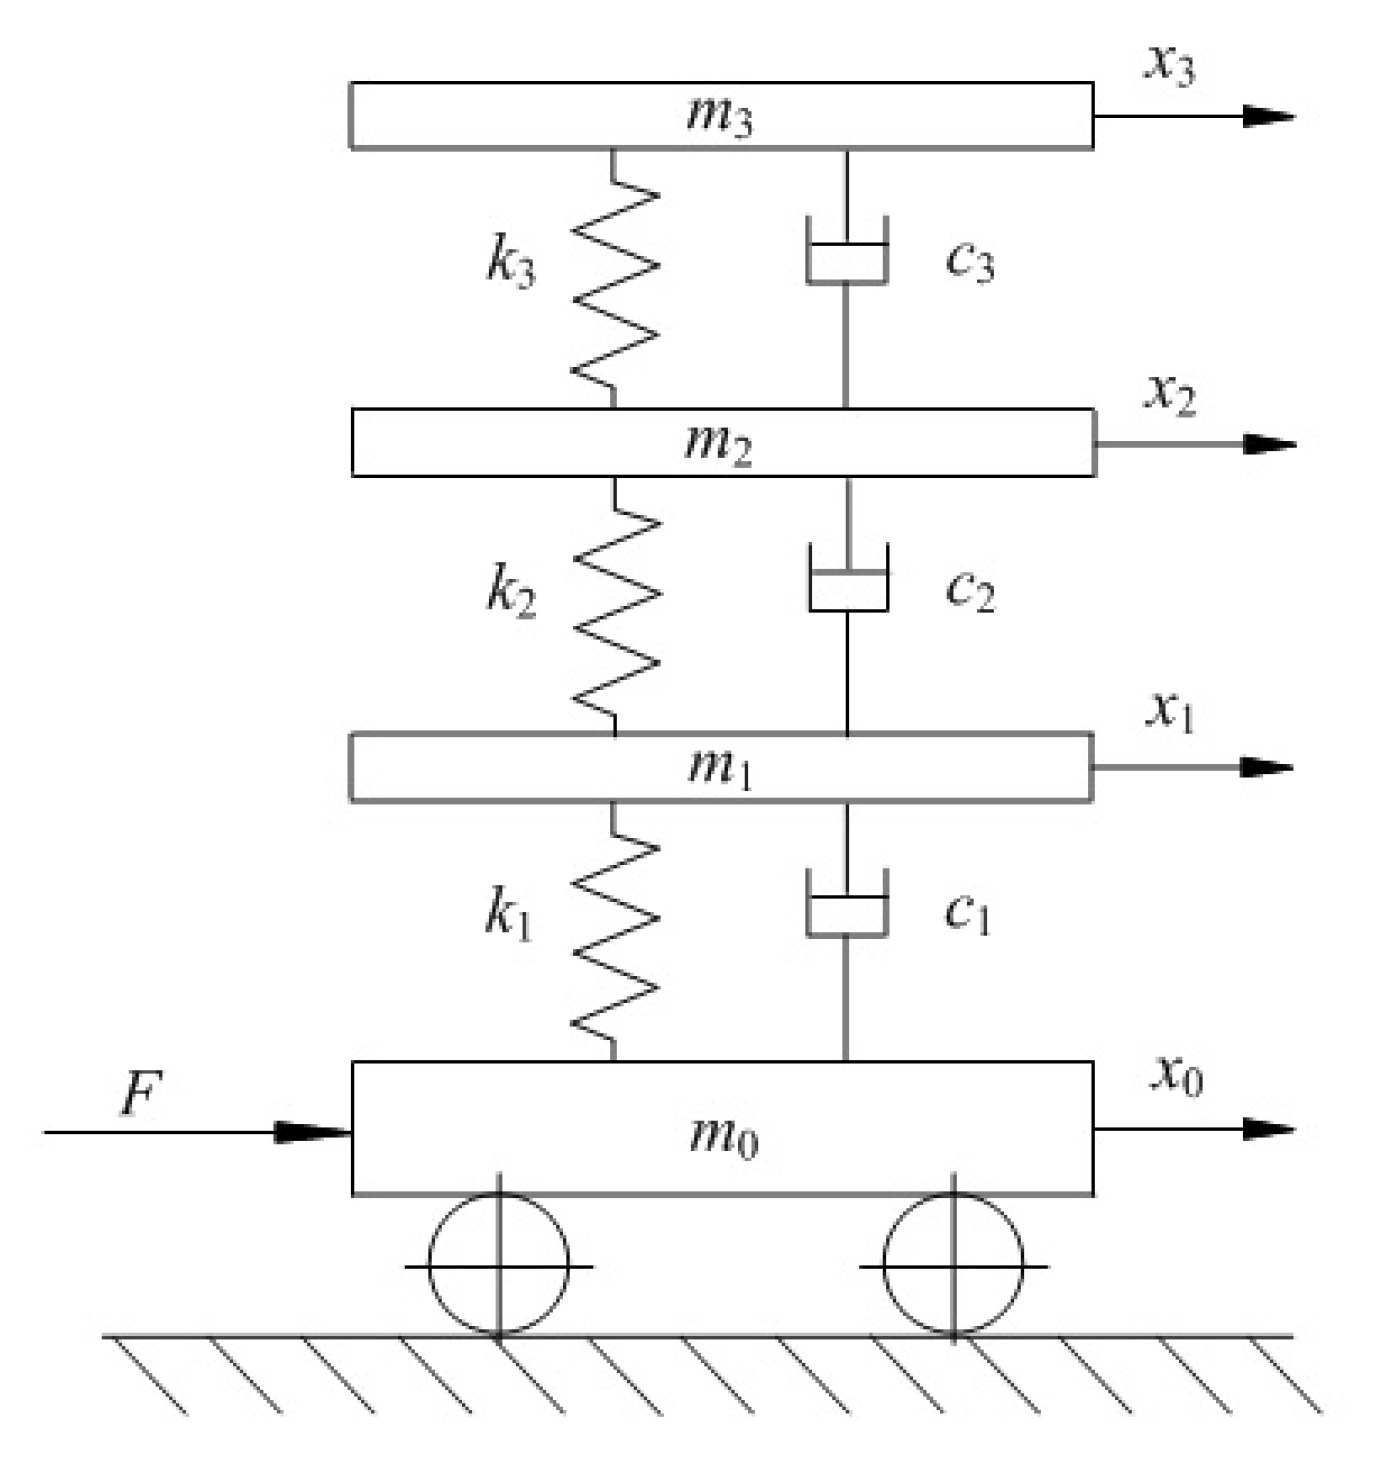
2.1. Assumption of Nondestructive Testing Based on Vibration Signal Analysis
2.2. Design of Algorithms of the Nondestructive Testing Based on Vibration Signal Analysis
- (1)
- Establish augmented state variables according to Equation (4); construct the state equations according to Equations (6)–(8); and construct the observation equation according to Equation (9).
- (2)
- Estimate the initial mean and covariance matrix of the state variables, and estimate the covariance matrix and of process noise and measurement noise.
- (3)
- Identify the parameters of structural stiffness and damping by the UKF filtering algorithm:
- (I)
- Set the initial parameters:where, and represent the mean and covariance matrix of the initial estimated state variables, respectively.
- (II)
- Construct the set of sigma pointsAccording to and of state , the sigma point set can be constructed according to Equation (15), where superscript denotes the order of Point in the set:
- (III)
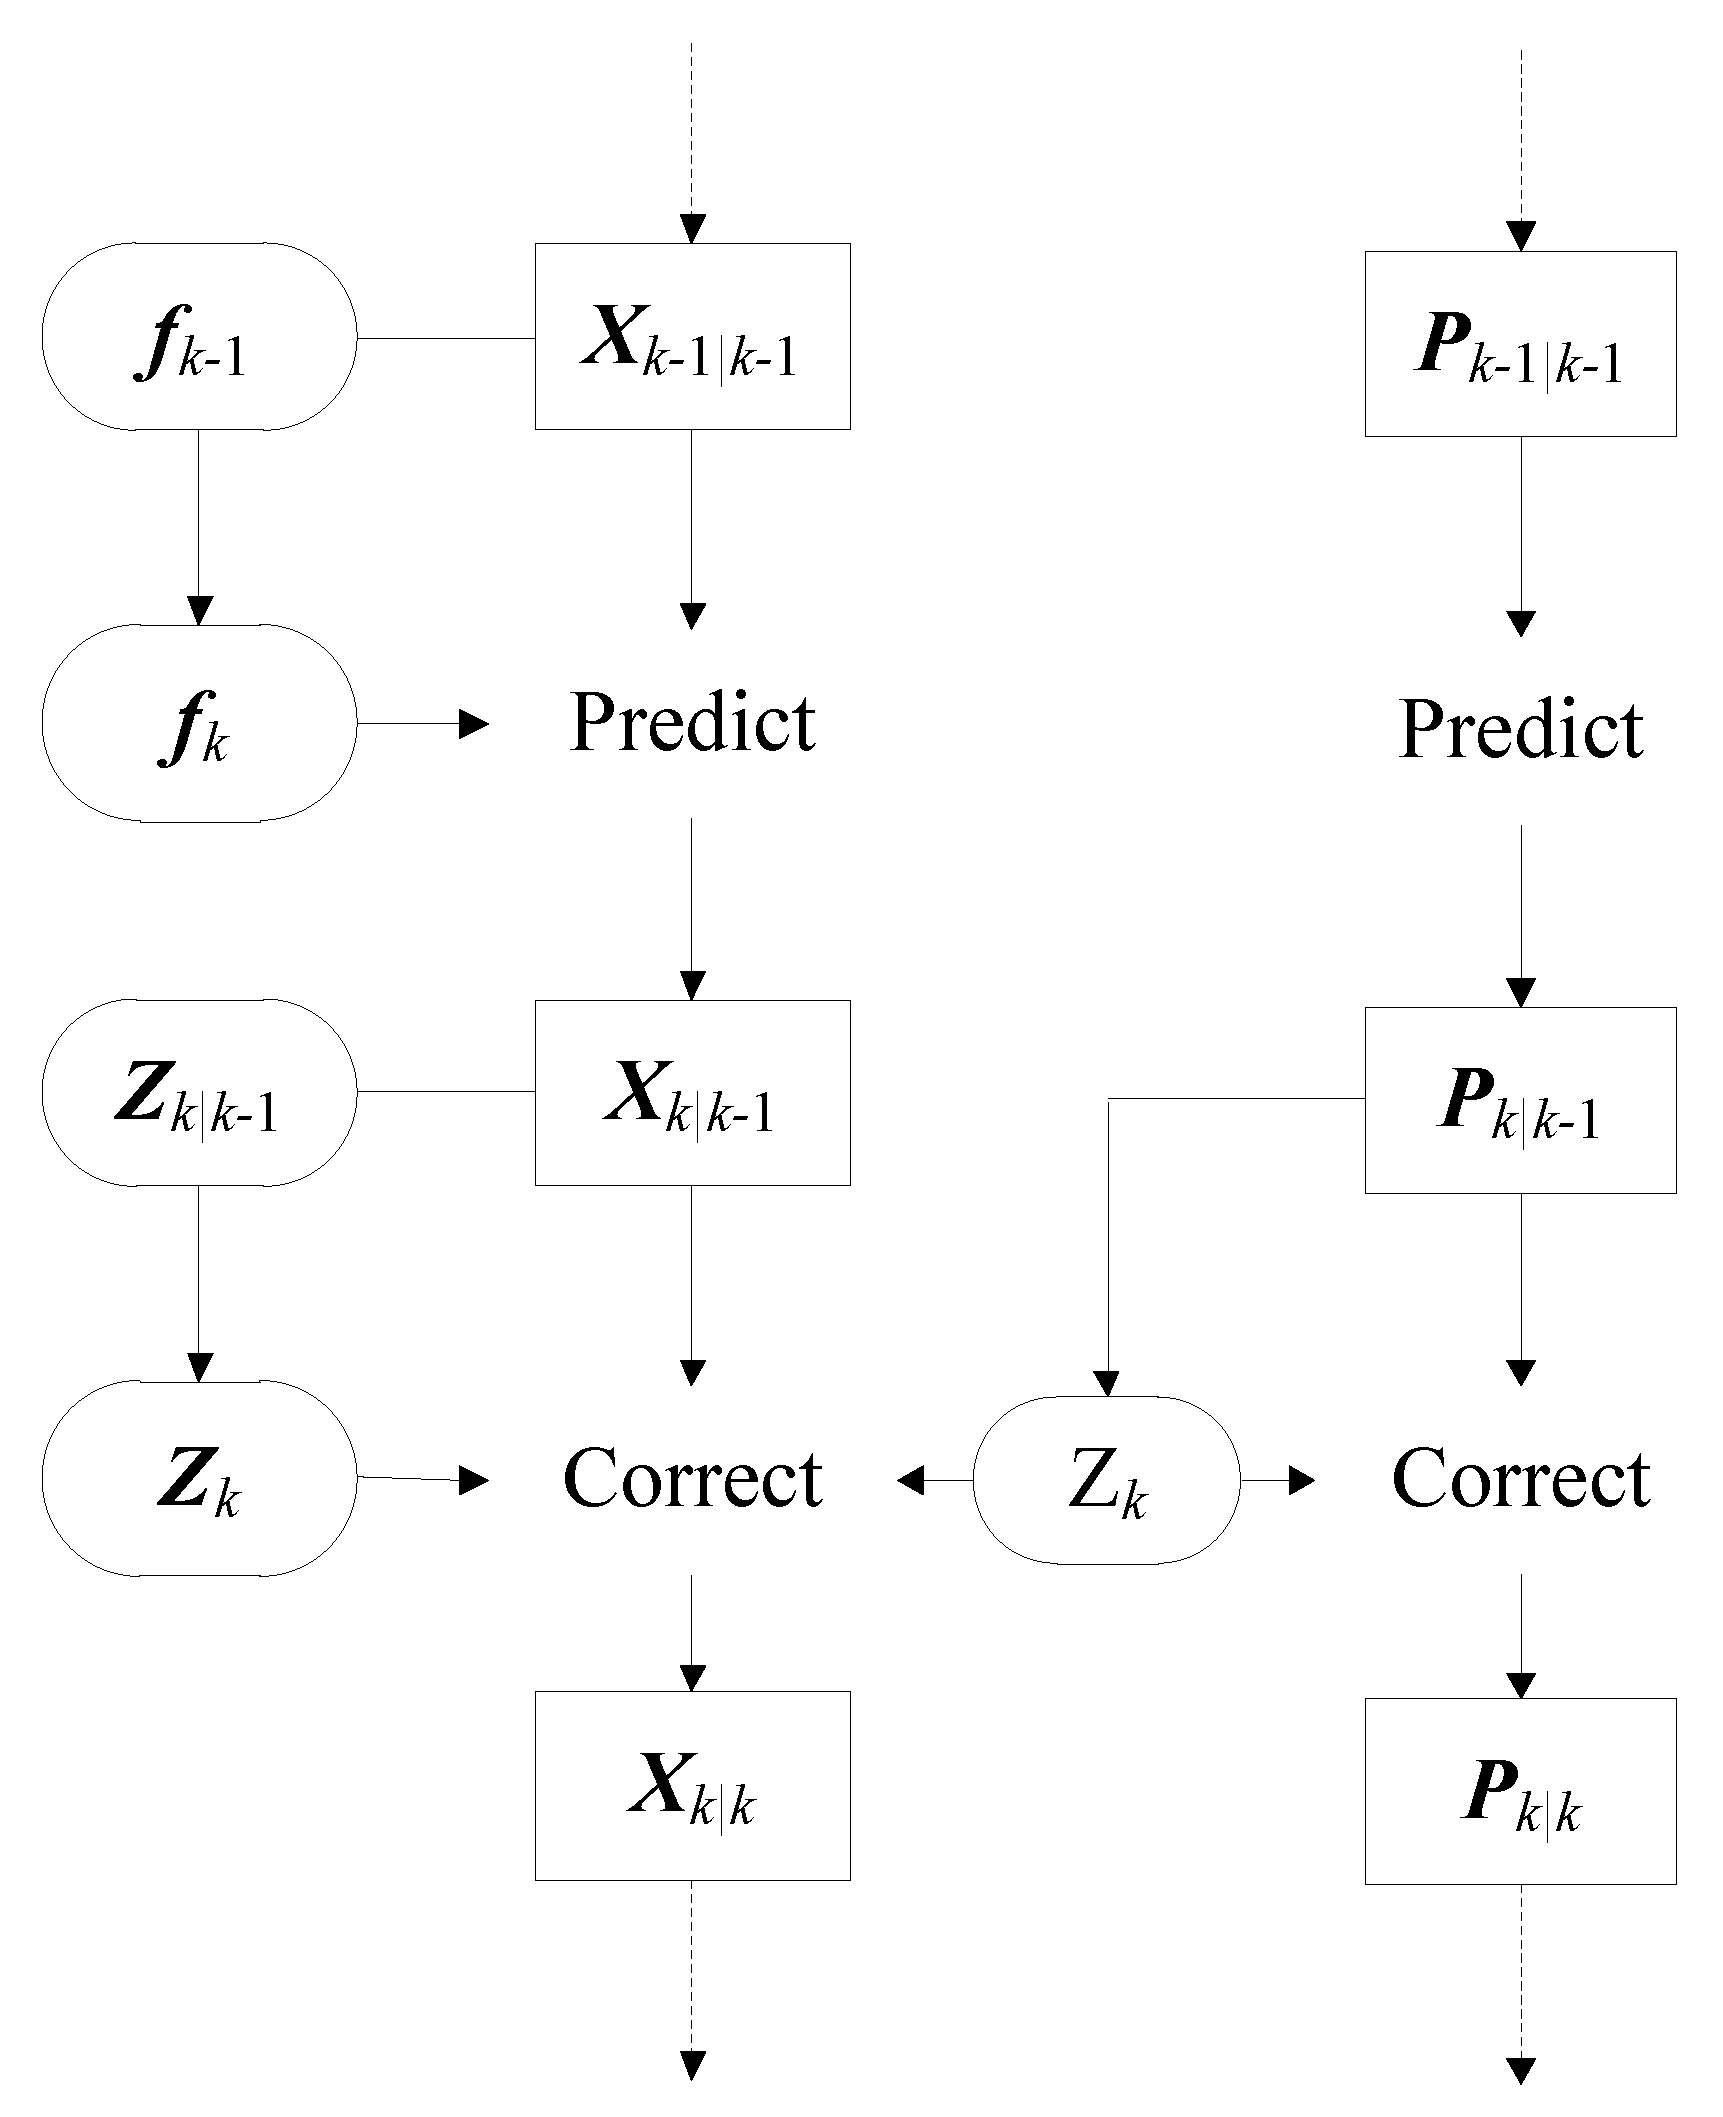
- PredictBy substituting the sigma point set into the Kalman filter [27,28], the nonlinear stochastic difference Equation (16) can be obtained asThen, the transformed sigma point set can be obtained asAccording to , the predicted mean of state variables is shown as Equation (18) and the covariance matrix is shown as Equation (19):where, is the calculated mean weight coefficient and we set as .By substituting into the nonlinear observation equation, Equation (9), we obtain:The mean value of the observation variables is calculated as
- (IV)
- CorrectCompute the covariance matrix of the observation variables:where, is the variance weight coefficient and we set as R.Compute the covariance matrix between the state variables and observation vectors;Then, the Kalman gain matrix can be obtain byUpdate the mean of state variables:Update the covariance matrix of the state variables:From the steps mentioned above, it only needs to calculate the state equation and observation equation in the UKF filtering process, and does not need to calculate the Jacobi matrices. This method has obvious advantages in terms of the ease of use and flexibility when the state equation is complex and non-differentiable.
- (V)
- Judge structural damage status based on the identification results.
3. Application Example Analysis
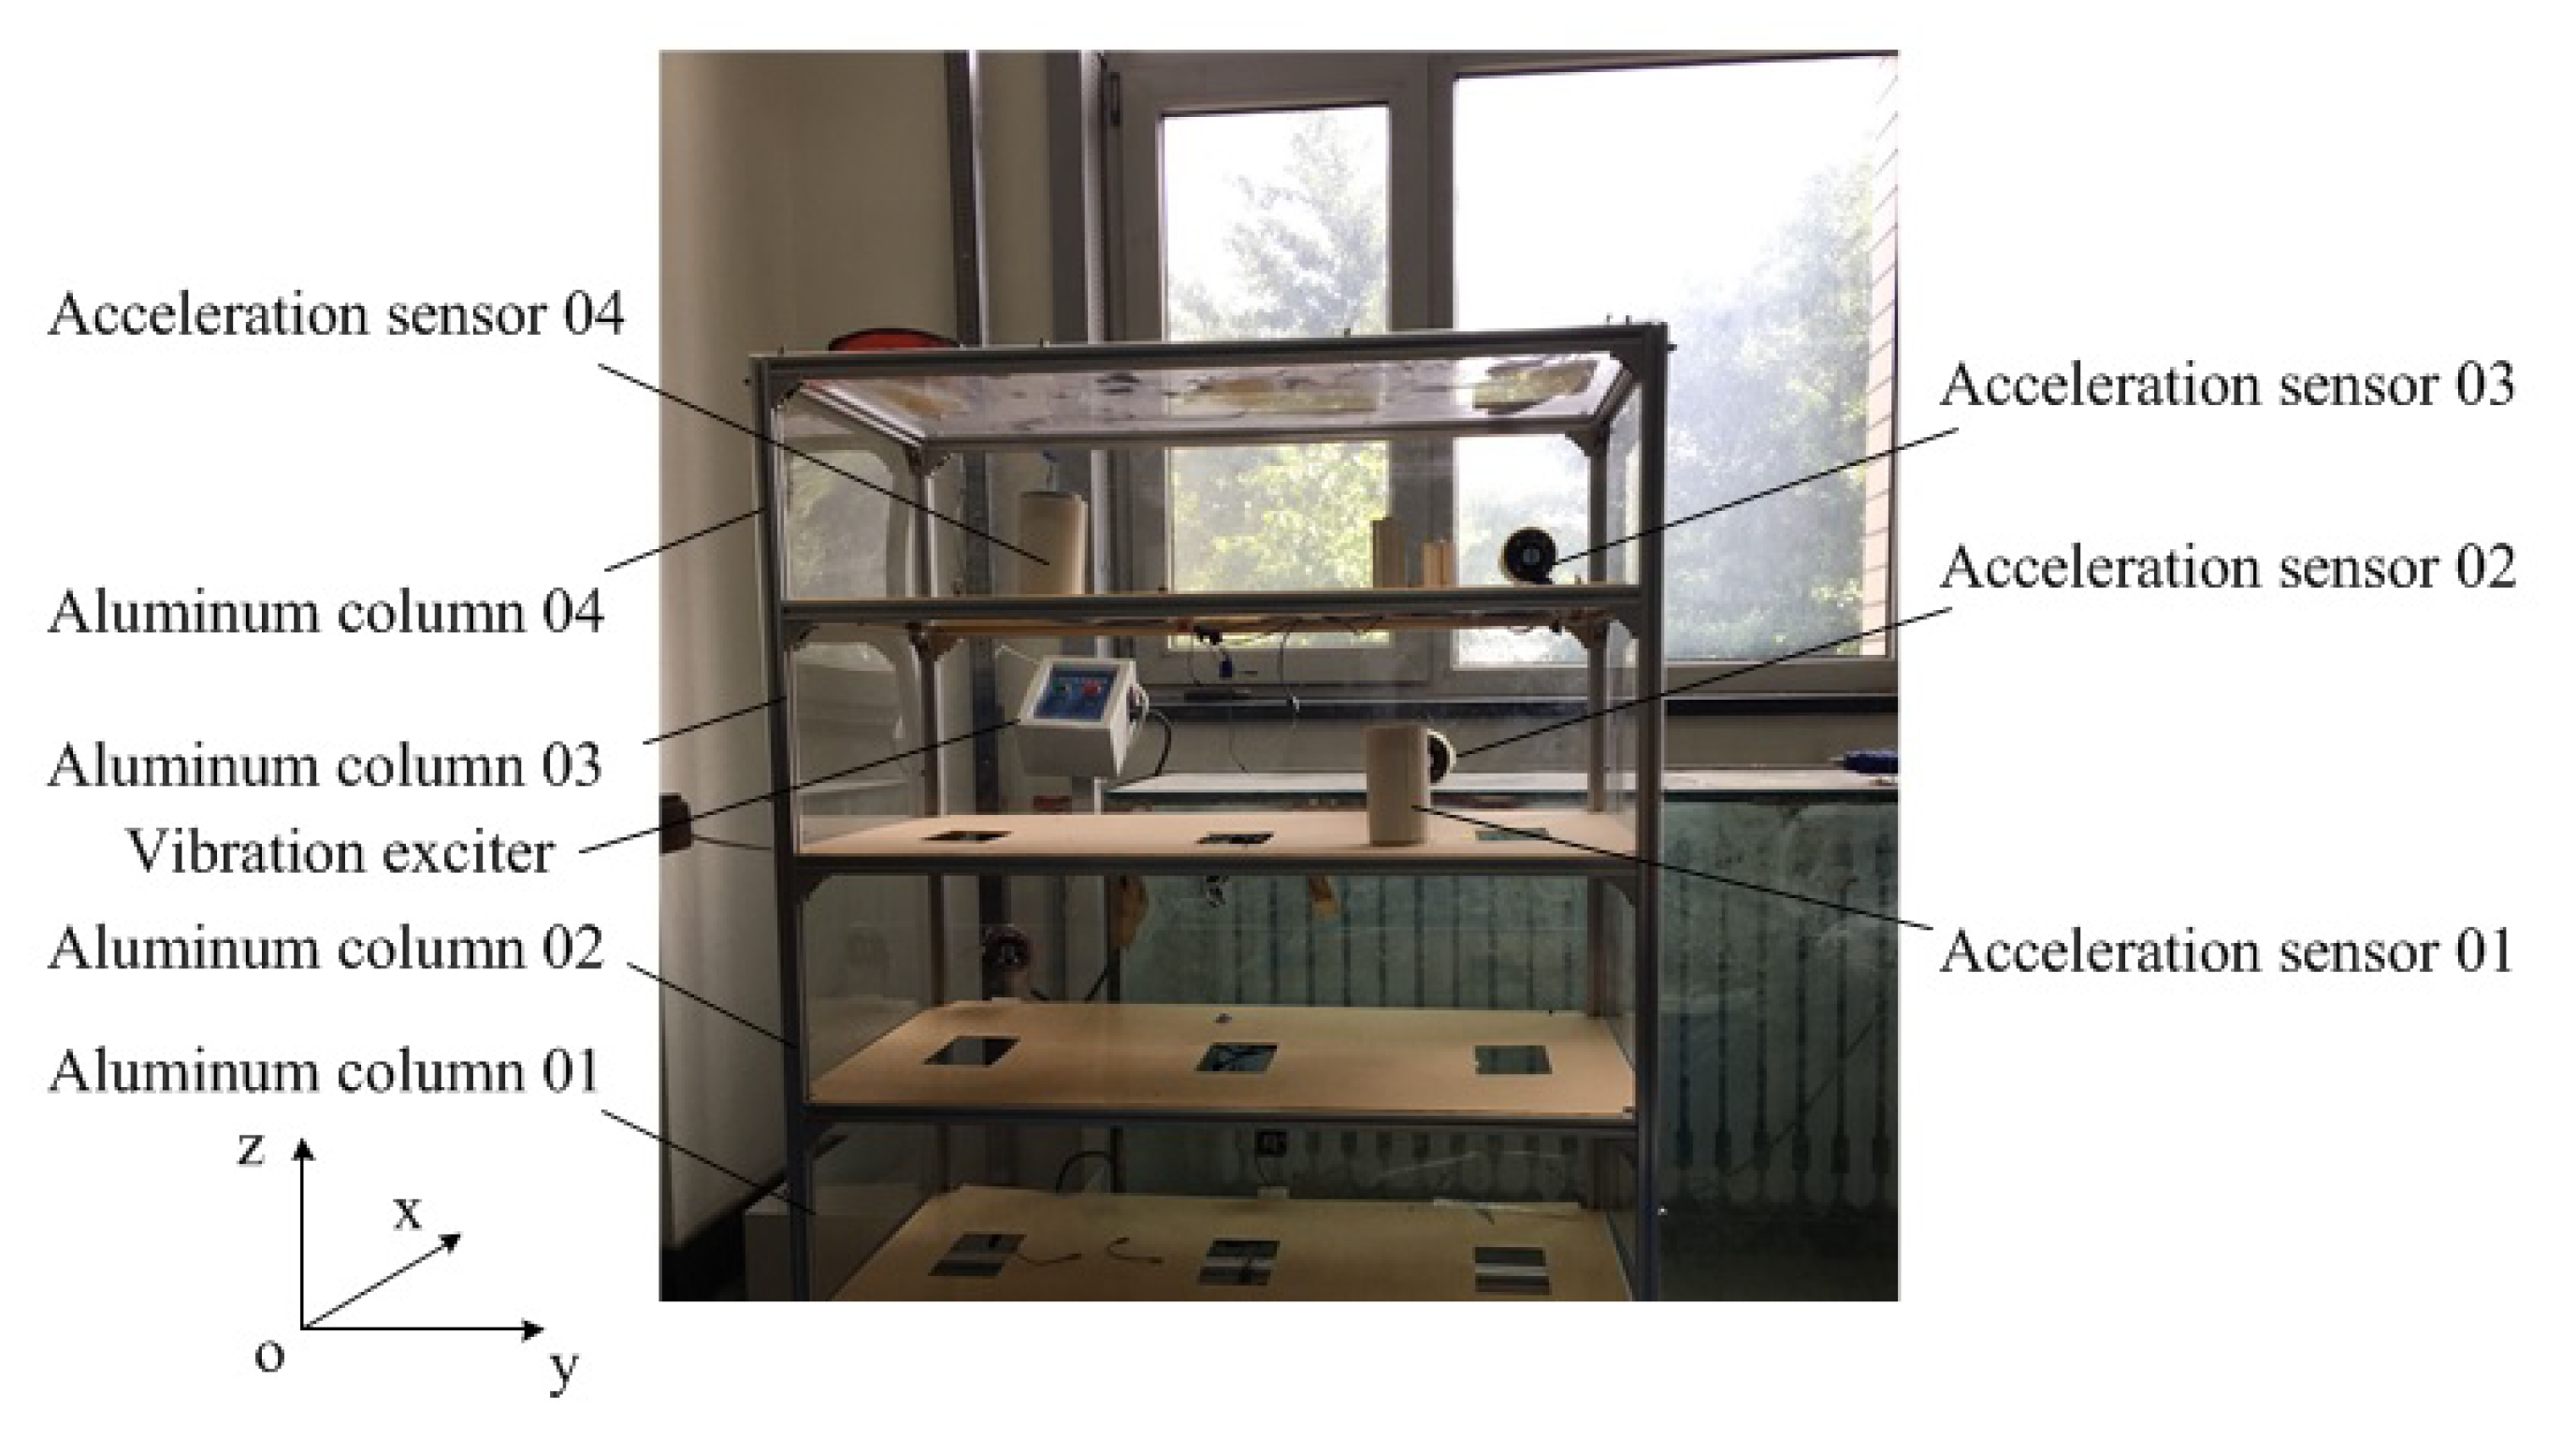
3.1. Experimental Setting
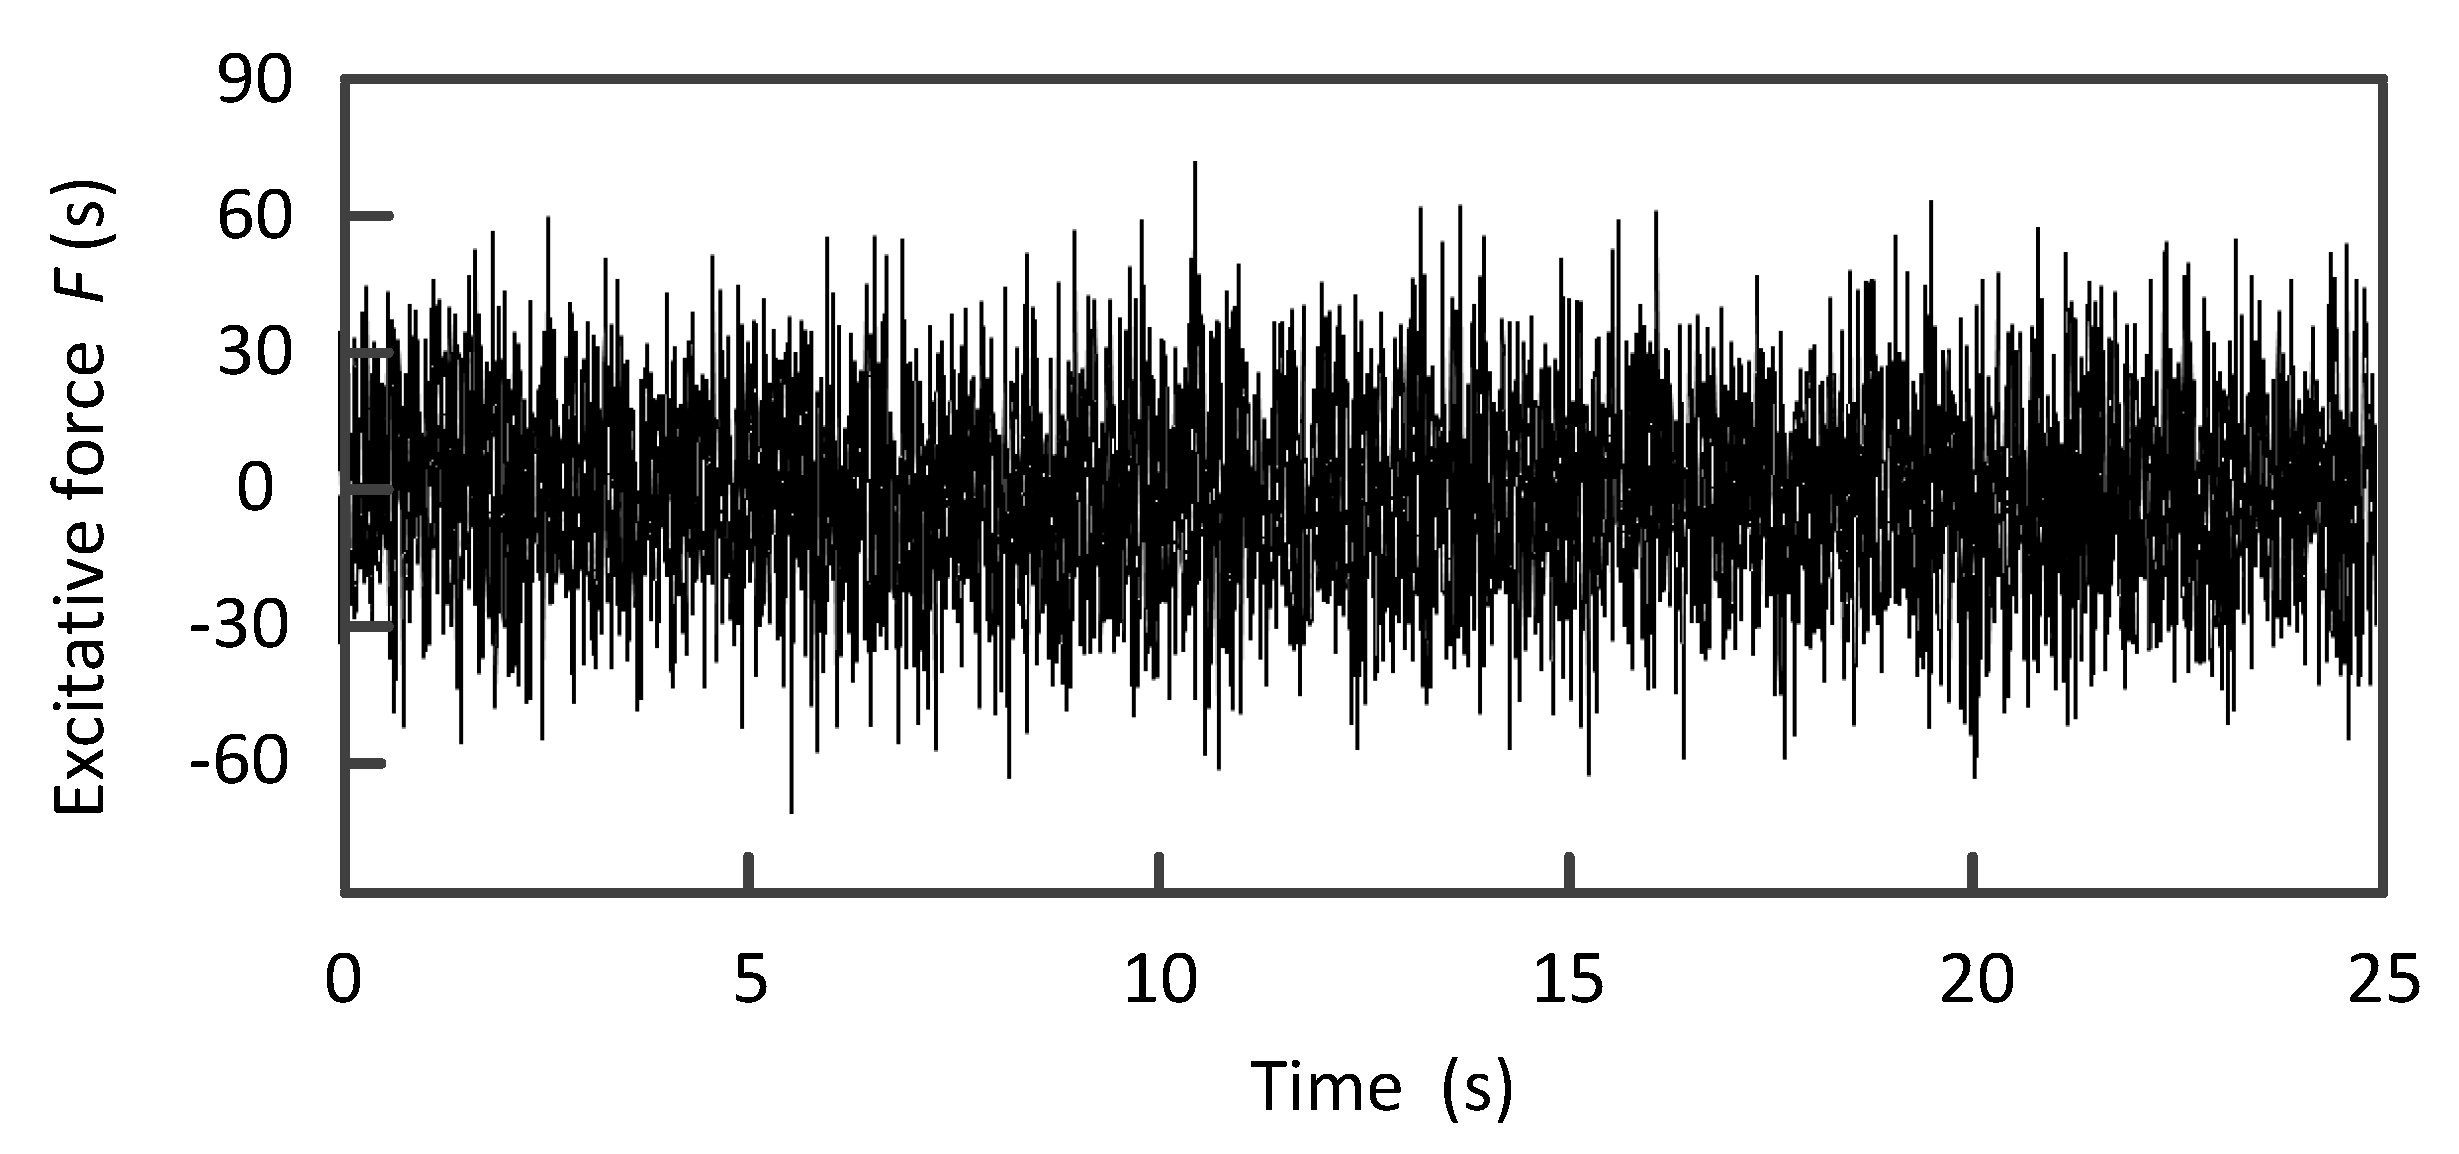
3.2. Nondestructive Testing Based on Vibration Signal
3.3. Analysis of the Nondestructive Testing Results
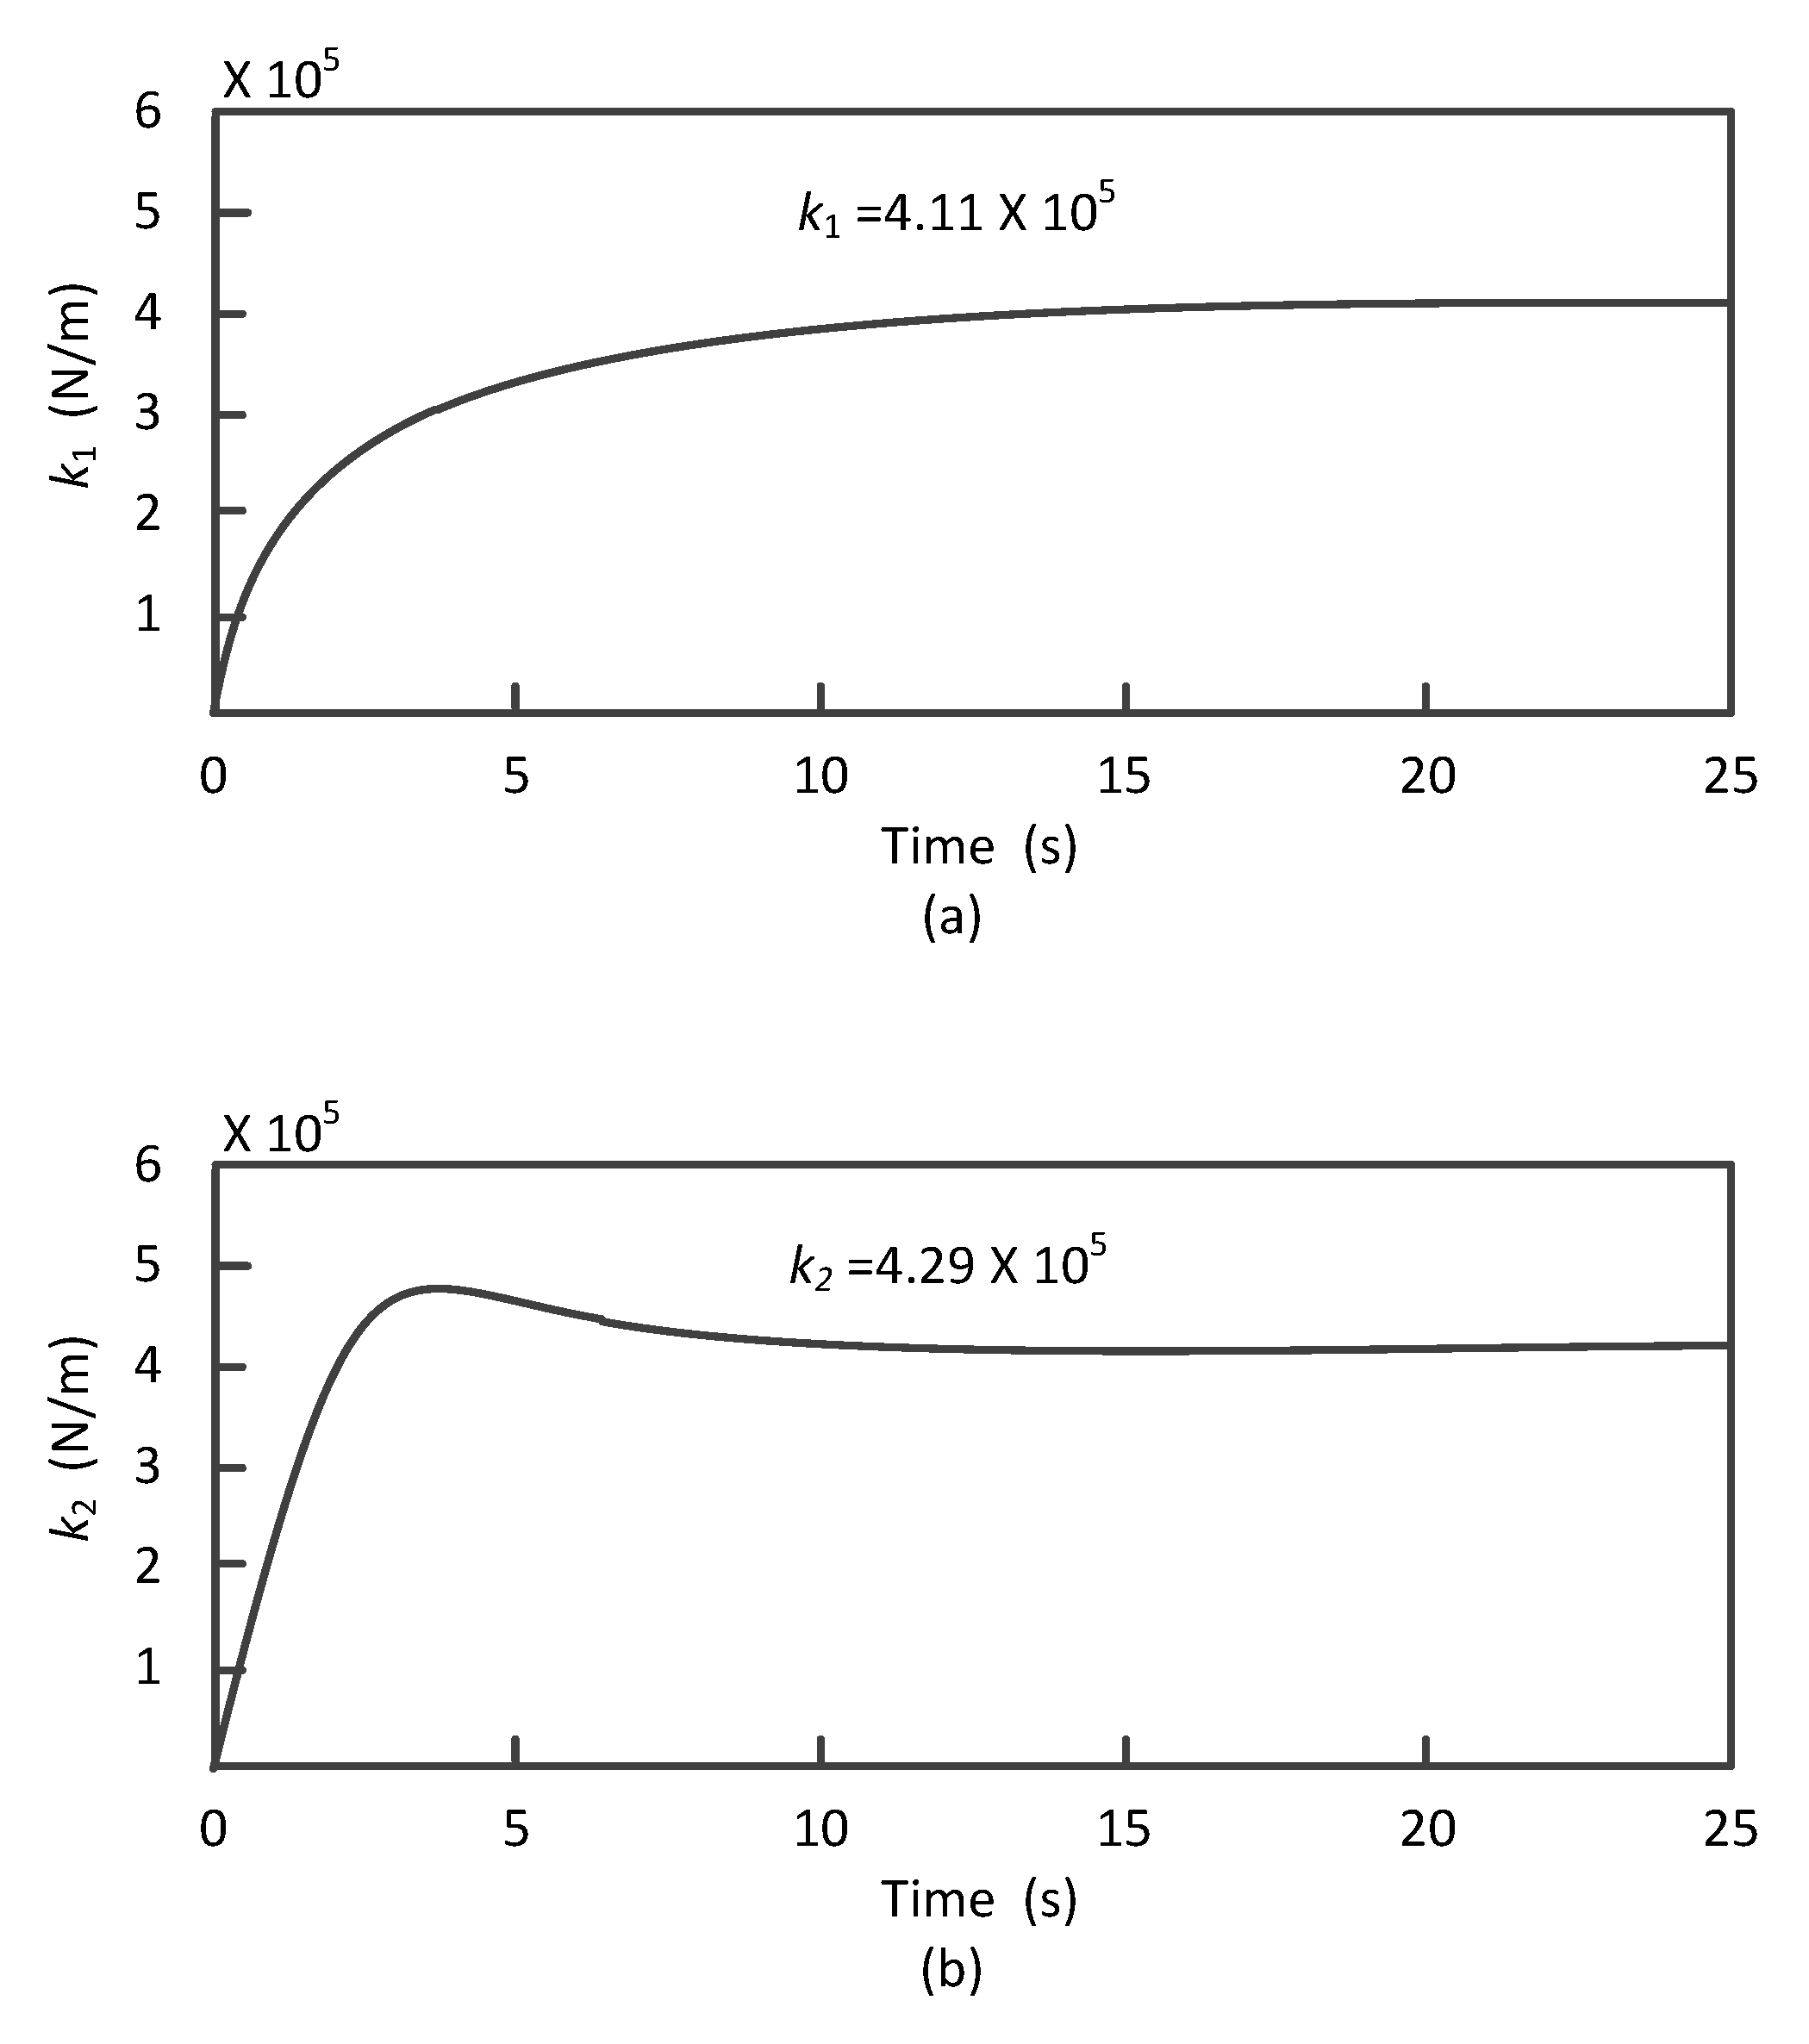
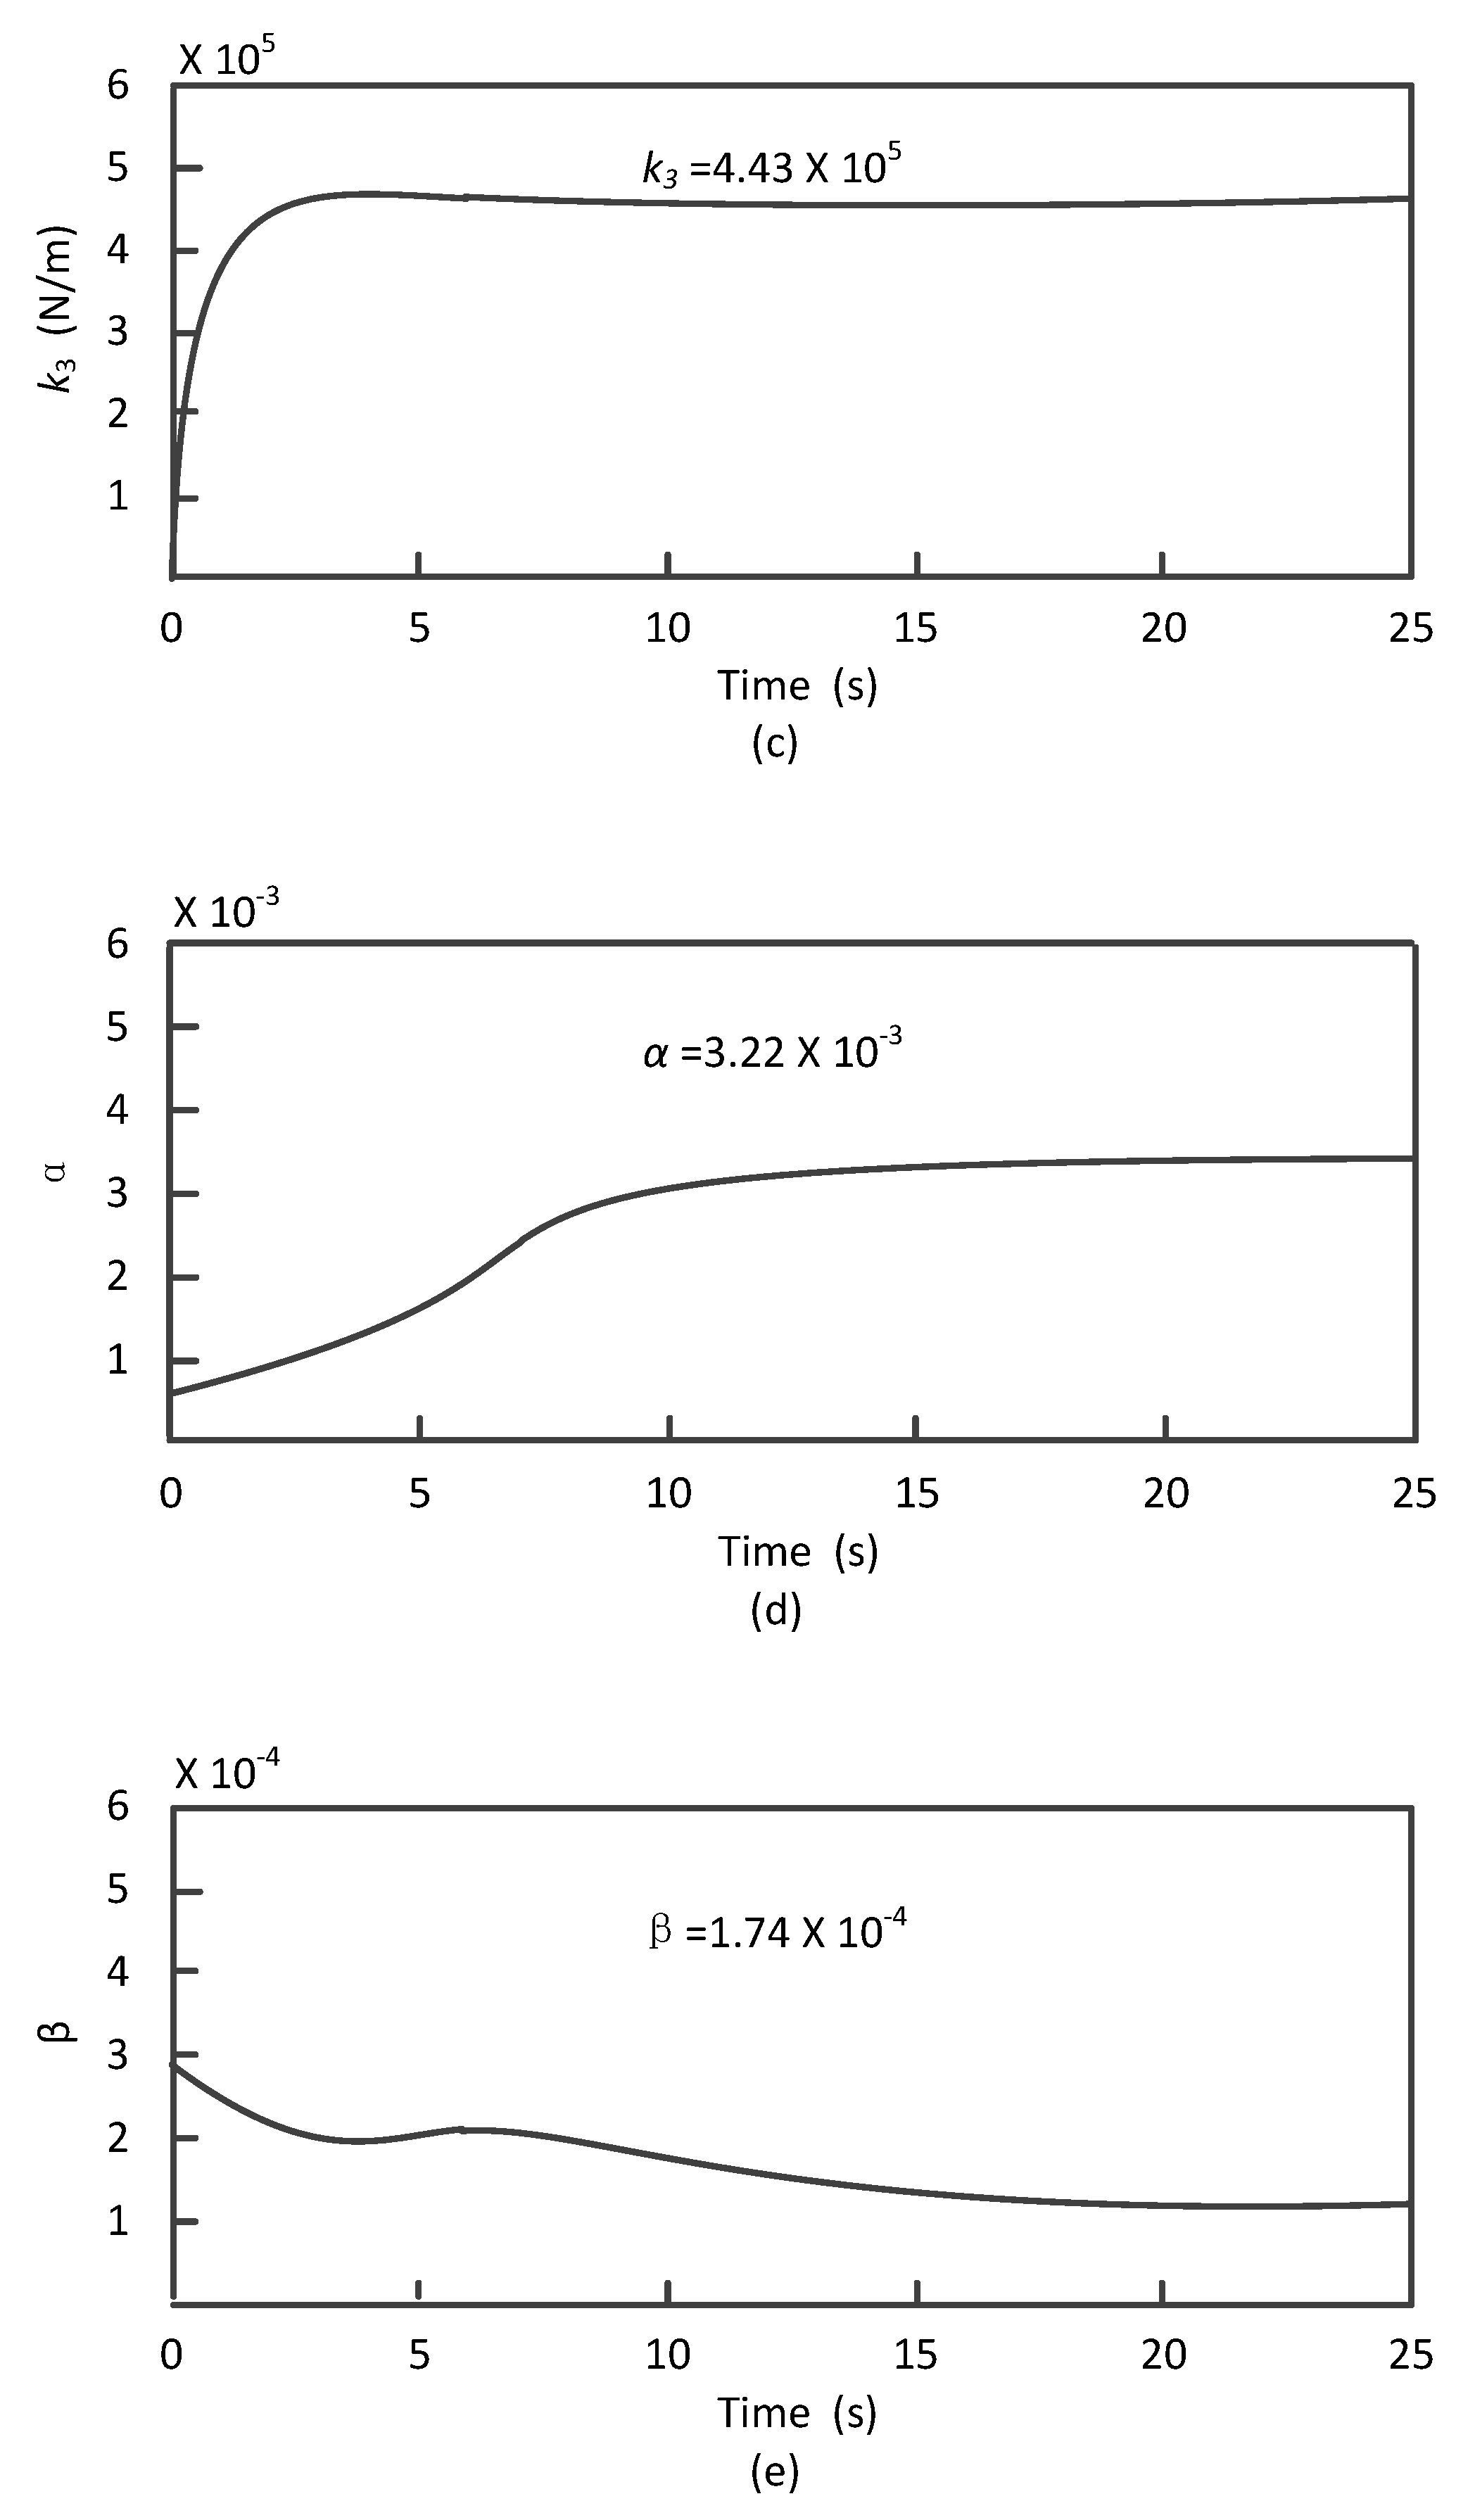
3.3.1. Working Condition without Damage
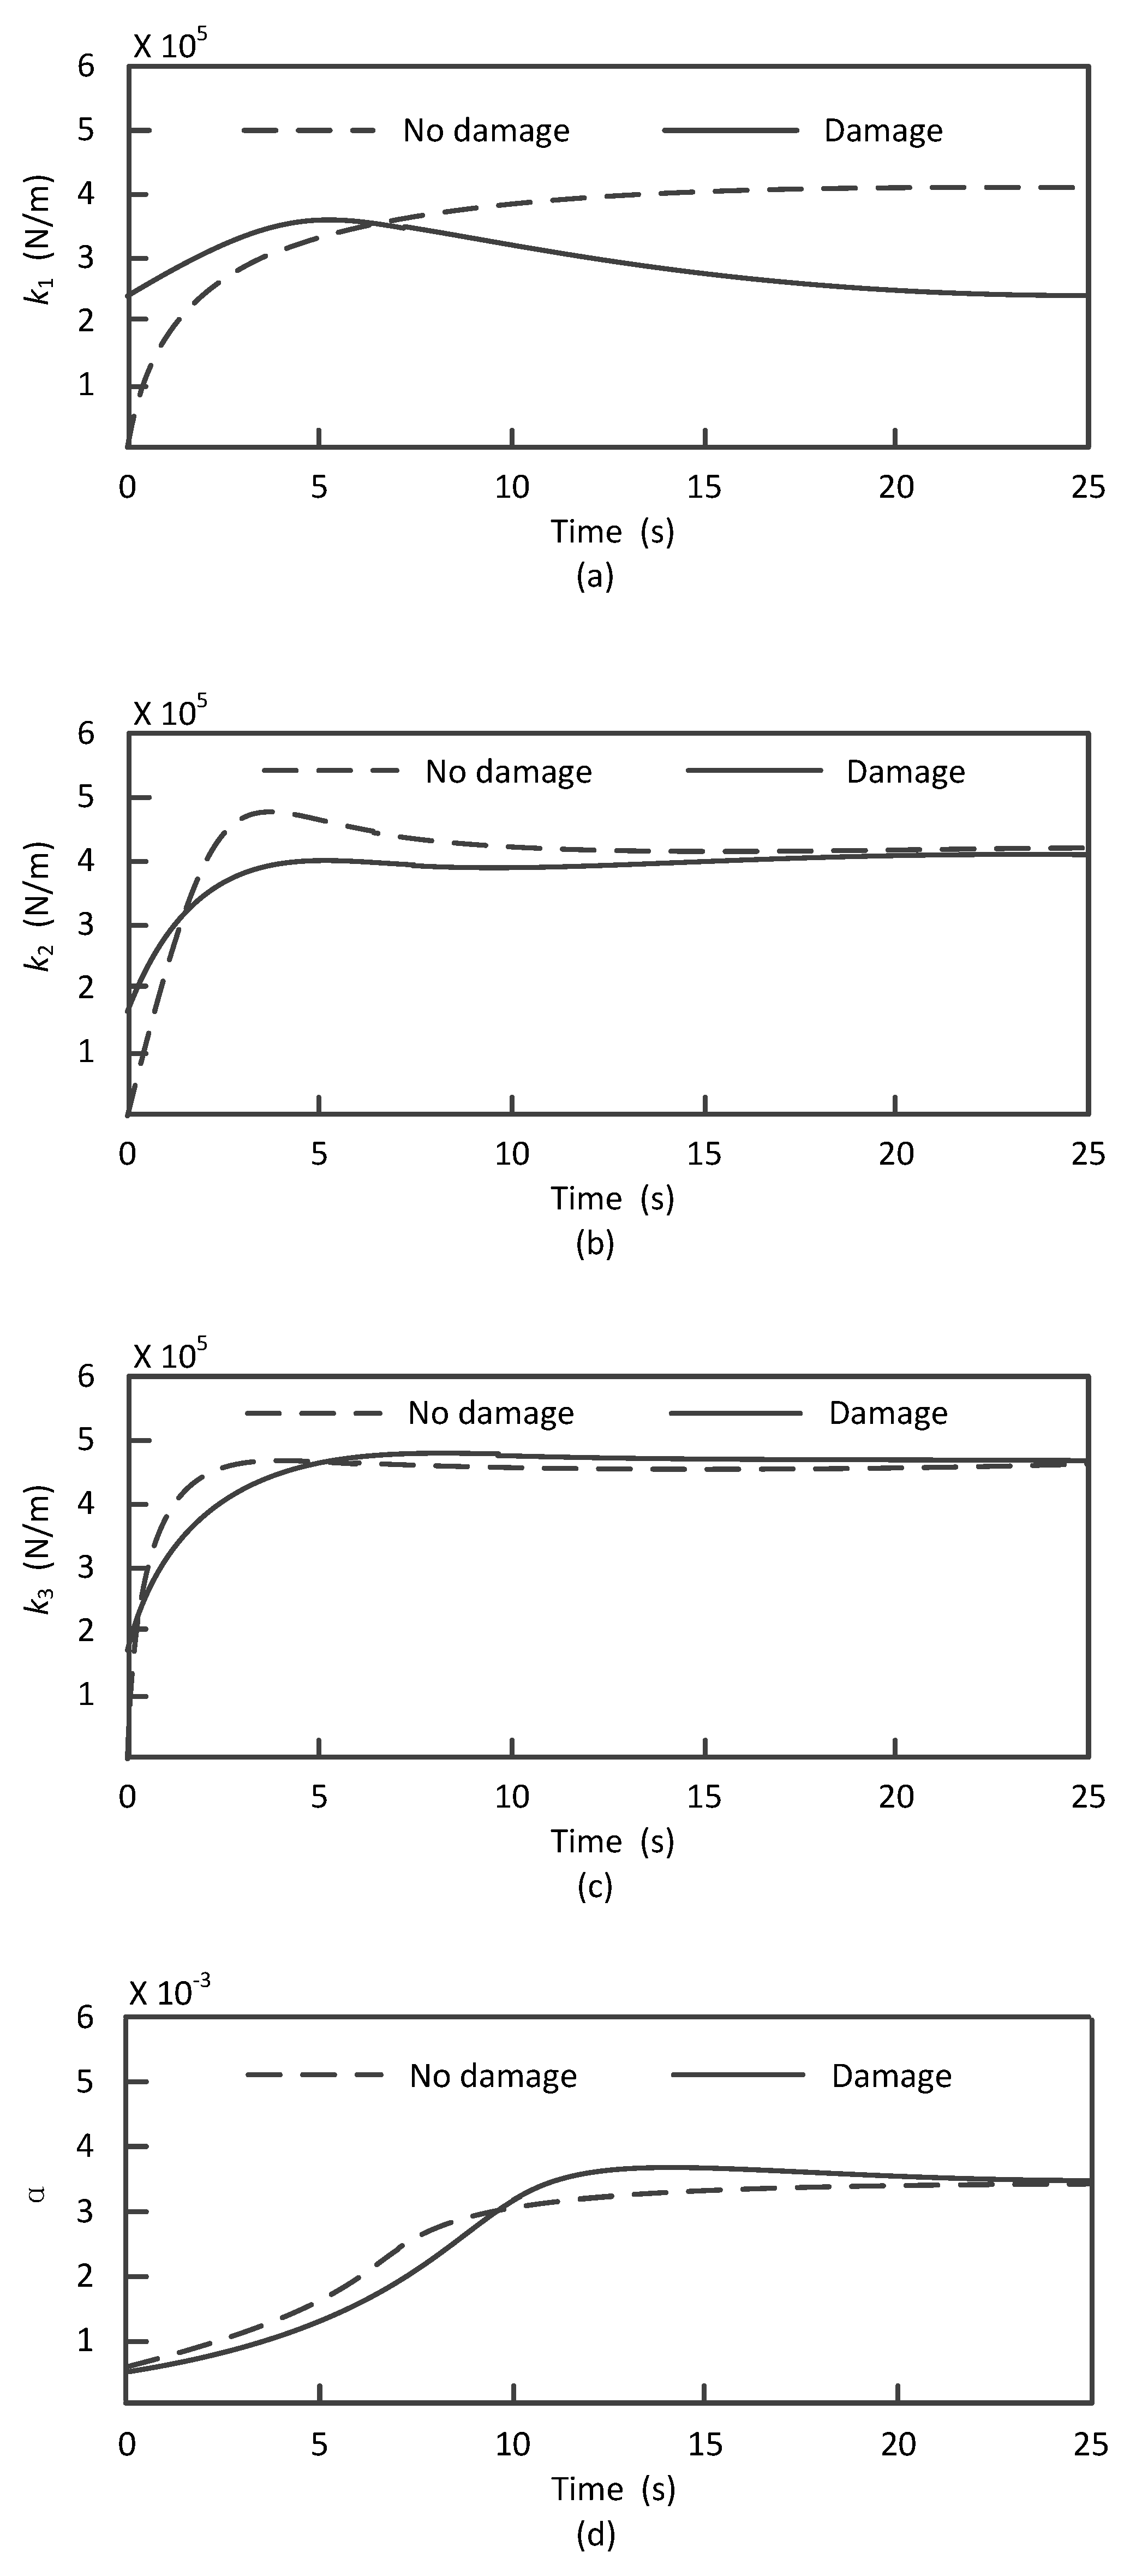
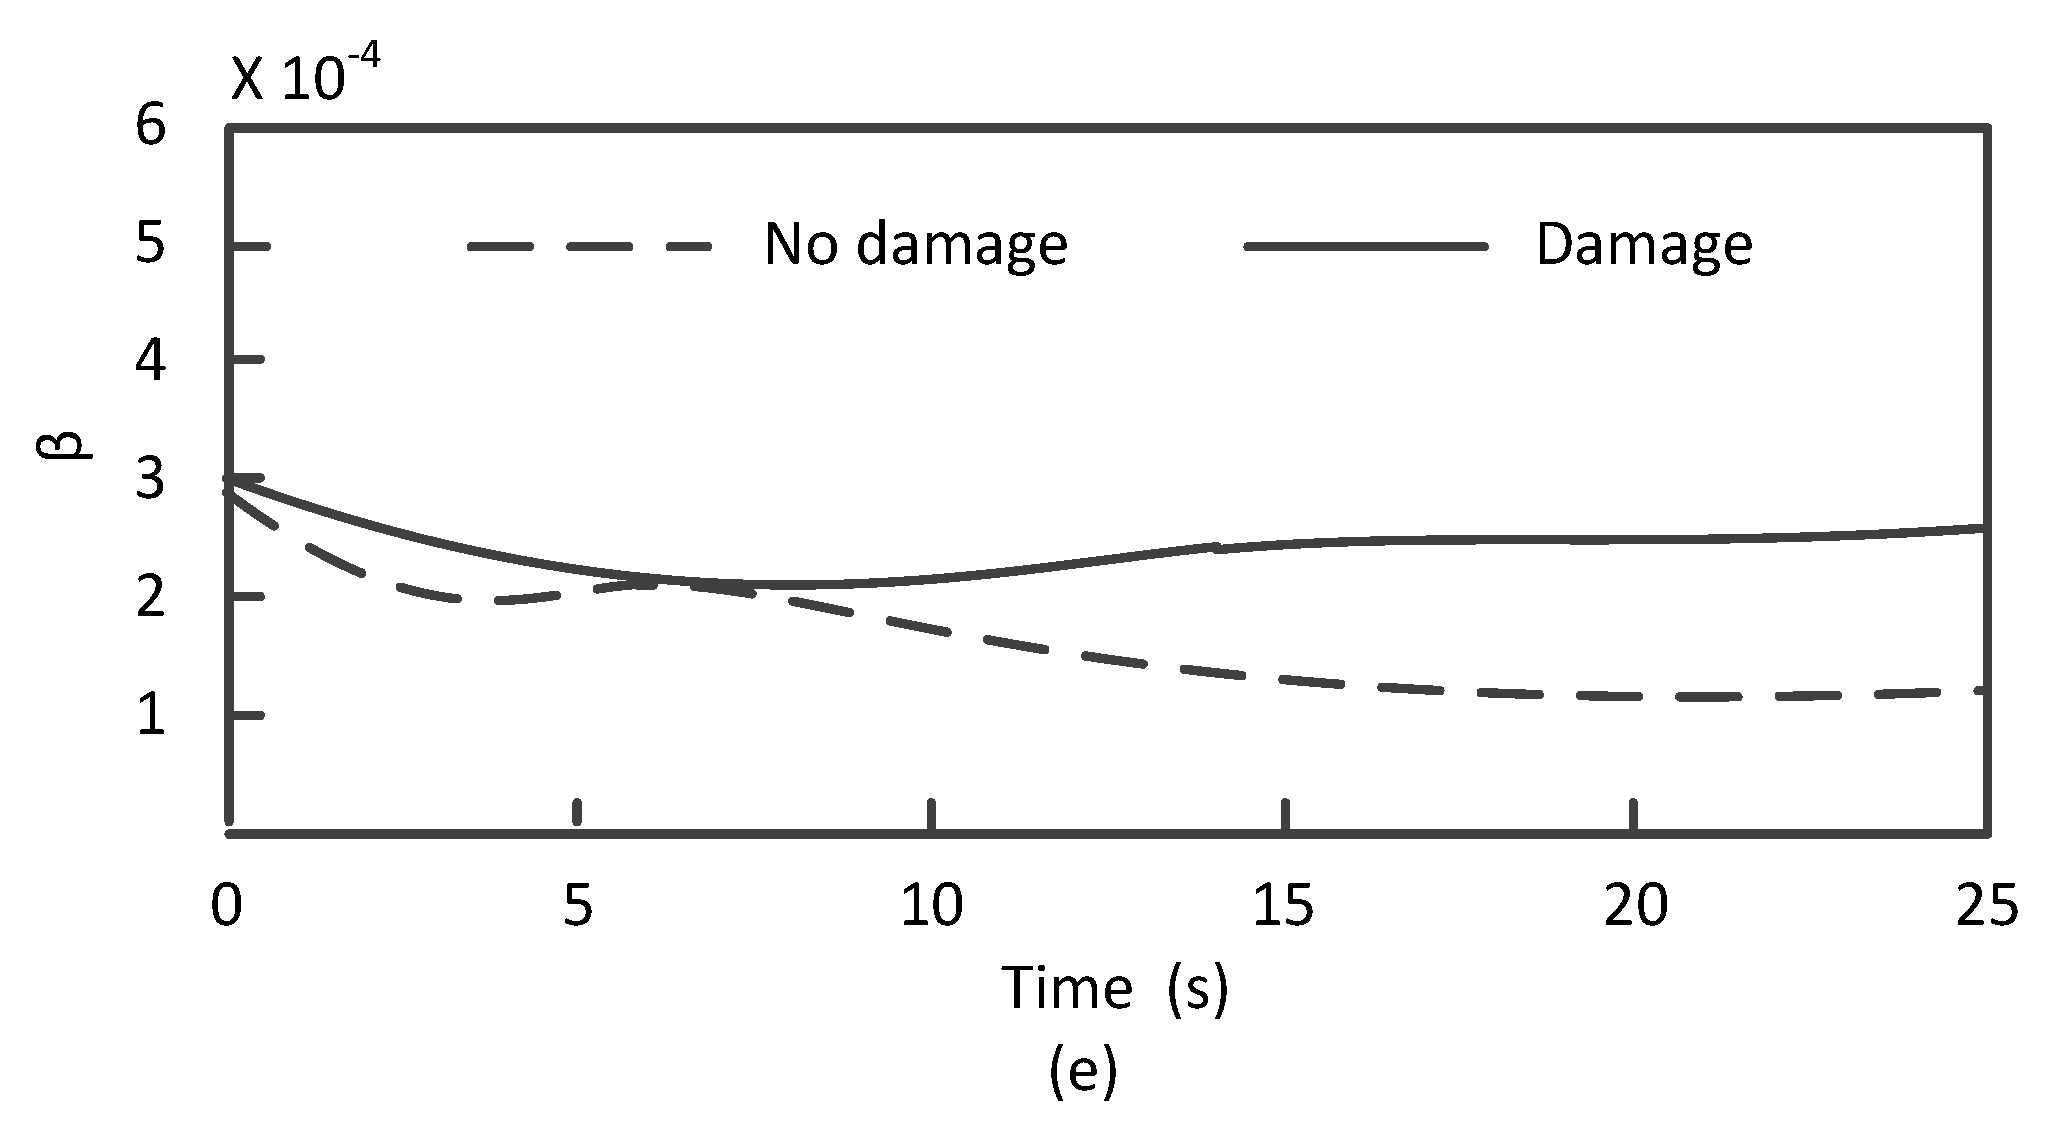
3.3.2. Conditions of Damage on Column 2
4. Conclusions
Author Contributions
Funding
Conflicts of Interest
References
- Yam, L.H.; Li, Y.Y.; Wong, W.O. Sensitivity studies of parameters for damage detection of plate-like structures using static and dynamic approaches. Eng. Struct. 2002, 24, 1465–1475. [Google Scholar] [CrossRef]
- Giridhara, G.; Rathod, V.T.; Naik, S.; Roy Mahapatra, D.; Gopalakrishnan, S. Rapid localization of damage using a circular sensor array and Lamb wave based triangulation. Mech. Syst. Signal Process. 2010, 24, 2929–2946. [Google Scholar] [CrossRef]
- Wang, L.; Yang, Z.C.; Tan, G.H. Improved Structural damage detection method based on natural frequency vector. J. Mech. Strength. 2008, 25, 709–713. [Google Scholar]
- Nie, Z.H.; Hao, H.; Ma, H.W. Structural damage detection based on the reconstructed phase space for reinforced concrete slab: Experimental study. J. Sound Vib. 2013, 332, 1061–1078. [Google Scholar] [CrossRef]
- Liu, W.G.; Yan, L.; Guo, L.Q. Damage classification of elastic thin plate based on modal strain energy method. Noise Vib. Control 2016, 36, 164–168. [Google Scholar]
- Aydin, K.; Kisi, O. Damage detection in Timoshenko beam structures by multilayer perceptron and radial basis function networks. Neural Comput. Appl. 2014, 24, 583–597. [Google Scholar] [CrossRef]
- Jiang, J.T.; Yu, H.L. Study on identification of offshore platform component damage based on strain modal difference. J. Catastr. 2010, 25, 67–69. [Google Scholar]
- Zhang, C.; Cheng, L.; Xu, H.; Qiu, J.H. Structural damage detection based on virtual element boundary measurement. J. Sound Vib. 2016, 372, 133–146. [Google Scholar] [CrossRef]
- Satpal, S.B.; Guha, A.; Banerjee, S. Damage identification in aluminum beams using support vector machine: Numerical and experimental studies. Struct. Control Health Monit. 2016, 23, 446–457. [Google Scholar] [CrossRef]
- Zhao, Y.X.; Xu, Y.G.; Gao, L.X. For fault pattern recognition of rolling bearing acoustic emission technique based on harmonic wavelet packet and BP neural network. J. Vib. Shock 2010, 29, 163–166. [Google Scholar] [CrossRef]
- Kostrzewski, M. Loads Analysing In Pallet Racks Storage Elevation. In Proceedings of the Carpathian Logistics Congress Proceedings (Reviewed Version), Cracow, Poland, 9–11 December 2013. [Google Scholar]
- Friswell, M.; Mottershead, J.E. Finite Element Model Updating in Structural Dynamics; Springer Science and Business Media: Berlin, Germany, 2013; pp. 25–97. [Google Scholar]
- Grip, N.; Sabourova, N.; Tu, Y.M. Sensitivity-based model updating for structural damage identification using total variation regularization. Mech. Syst. Signal Process. 2017, 84, 365–383. [Google Scholar] [CrossRef]
- Yan, A.M.; Kerschen, G.; De Boe, P.; Golinval, J.C. Structural damage diagnosis under varying environmental conditions–part I: A linear analysis. Mech. Syst. Signal Process. 2005, 19, 847–864. [Google Scholar] [CrossRef]
- Cawley, P.; Adams, R.D. The location of defects in structures from measurements of natural frequencies. J. Strain Anal. Eng. Des. 1979, 14, 49–57. [Google Scholar] [CrossRef]
- Salawu, O.S. Detection of structural damage through changes in frequency: A review. Eng. Struct. 1997, 19, 718–723. [Google Scholar] [CrossRef]
- Yang, Q.W.; Liu, J.K. Structural damage identification by adding given masses. Eng. Mech. 2009, 26, 159–163. [Google Scholar]
- Guan, D.Q.; Huang, Y. Damage identification of frame structure by means of wavelet analysis of strain mode. Chin. J. Comput. Mech. 2010, 27, 325–329, 341. [Google Scholar]
- Gu, P.Y.; Deng, C.; Tang, L. Experimental study on damage identification based on operational strain modal shape. J. Vib. Shock 2011, 30, 175–178. [Google Scholar]
- Pandey, A.K.; Biswas, M. Experimental verification of flexibility difference method for locating damage in structure. J. Sound Vib. 1995, 184, 311–328. [Google Scholar] [CrossRef]
- Zhang, Q.W. Statistical damage identification for bridges using ambient vibration data. Comput. Struct. 2007, 85, 476–485. [Google Scholar] [CrossRef]
- Zong, Z.H.; Niu, J.; Wang, H. Research progress of structural Probabilistic Damage Identification Method Based on model validation. China Civ. Eng. J. 2012, 45, 121–130. [Google Scholar] [CrossRef]
- Sajid, H.; Hossam, H.A. A robust method for coupling detection among process variables. Int. J. Process. Syst. Eng. 2012, 2, 93–110. [Google Scholar]
- Widodo, A.; Yang, B.S. Support vector machine in machine condition monitoring and fault diagnosis. Mech. Syst. Signal Process. 2007, 21, 2560–2574. [Google Scholar] [CrossRef]
- Wang, L.; Chan, T.H.T. Review of vibration-based damage detection and condition assessment of bridge structures using structural health monitoring. In Proceedings of the Second Infrastructure Theme Postgraduate Conference: Rethinking Sustainable Development: Planning, Engineering, Design and Managing Urban Infrastructure, Queensland University, Queensland, Australia, 26 March 2009. [Google Scholar]
- Xu, H.; Cheng, L.; Su, Z.Q.; Guyader, J.L. Identification of structural damage based on locally perturbed dynamic equilibrium with an application to beam component. J. Sound Vib. 2011, 330, 5963–5981. [Google Scholar] [CrossRef]
- Challamel, N. Higher-order shear beam theories and enriched continuum. Mech. Res. Commun. 2011, 38, 388–392. [Google Scholar] [CrossRef]
- Yan, Y.J.; Cheng, L.; Wu, Z.Y.; Yam, L.H. Development in vibration-based structural damage detection technique. Mech. Syst. Signal. Process. 2007, 21, 2198–2211. [Google Scholar] [CrossRef]
- Kostrzewski, M. Securing of safety by monitoring of technical parameters in warehouse racks, in high-bay warehouses and high storage warehouses–literature review of the problem. LogForum, 2017, 13, 125–134. [Google Scholar] [CrossRef]


| Working Condition Serial Number | Damage Condition |
|---|---|
| 1 | Nondestructive |
| 2 | The stiffness of No. 2 aluminum column decreases by 64.9% |
| 3 | The stiffness of No. 3 aluminum column decreases by 64.9% |
| 4 | The stiffness of No. 4 aluminum column decreases by 64.9% |
| ... | ... |
© 2020 by the authors. Licensee MDPI, Basel, Switzerland. This article is an open access article distributed under the terms and conditions of the Creative Commons Attribution (CC BY) license (http://creativecommons.org/licenses/by/4.0/).
Share and Cite
Li, X.; Shi, D.; Yu, Z. Nondestructive Damage Testing of Beam Structure Based on Vibration Response Signal Analysis. Materials 2020, 13, 3301. https://doi.org/10.3390/ma13153301
Li X, Shi D, Yu Z. Nondestructive Damage Testing of Beam Structure Based on Vibration Response Signal Analysis. Materials. 2020; 13(15):3301. https://doi.org/10.3390/ma13153301
Chicago/Turabian StyleLi, Xiaohao, Deyu Shi, and Zihang Yu. 2020. "Nondestructive Damage Testing of Beam Structure Based on Vibration Response Signal Analysis" Materials 13, no. 15: 3301. https://doi.org/10.3390/ma13153301
APA StyleLi, X., Shi, D., & Yu, Z. (2020). Nondestructive Damage Testing of Beam Structure Based on Vibration Response Signal Analysis. Materials, 13(15), 3301. https://doi.org/10.3390/ma13153301