Article

Durability and Strength Characteristics of Casein-Cemented Sand with Slag

1
Department of Civil Engineering, Kyungpook National University, 80 Daehakro, Bukgu, Daegu 41566, Korea
2
Korea Institute of Geoscience and Mineral Resources, Daejeon 34132, Korea
3
Department of Architectural Engineering, Kyungpook National University, 80 Daehakro, Bukgu, Daegu 41566, Korea
*
Author to whom correspondence should be addressed.
Materials 2020, 13(14), 3182; https://doi.org/10.3390/ma13143182
Submission received: 19 June 2020 / Revised: 8 July 2020 / Accepted: 13 July 2020 / Published: 16 July 2020
(This article belongs to the Special Issue Microstructures and Durability of Cement-Based Materials)

Abstract

:
Casein is often used as an eco-friendly wood adhesive. In this study, we used casein for soil cementation by mixing it with Jumunjin sand, sodium hydroxide (SH), and calcium hydroxide (CH) as a standard casein formula. The modified casein binder with different proportions of SH and CH was applied to improve water resistance. Furthermore, a blast furnace slag (BFS) was additionally mixed and reacted with alkalinity of modified casein binder. Thus, three types (standard, modified, and modified + BFS, referred to as STD, MOD, and MBS, hereafter) of casein binders were tested for durability and strength of casein-cemented sand. A piezoelectric sensor was installed within each sample to determine the curing time of the casein-cemented samples. The samples were air-cured at room temperature for seven days and some were repeatedly immersed in water thrice. Unconfined compression and jar slake tests were carried out to evaluate the strength and durability of the casein-cemented sand. Also, the microstructure was analyzed using a scanning electron microscope (SEM). We observed variations of peak conductance and corresponding frequency converged as the curing time increased. It was most significant for the MBS samples, which developed strength early. The unconfined compressive strength (UCS) of the air-cured samples was higher than those repeatedly immersed in water due to wash-off of the casein binder. The UCS of the dry MBS sample was 9900 kPa while that of the immersed sample was 430 kPa, which gradually decreased to 60 kPa upon repeated immersion. The samples with STD and MOD had no resistance to durability and showed cracks on the surface, while the MBS sample exhibited significantly improved durability and no cracks. We found that the MBS binder had a positively significant effect on the durability and strength of casein-cemented sand.

1. Introduction

In general, soil cementation, using various binders, is one of the ground improvement techniques to control or enhance the strength, durability, permeability, and other engineering properties of soil [1]. Cement is the most common binding agent for cementation that induces hardening behavior for various types of soil [2]. Besides, cement is cheaper than other binding agents for construction [3]. Despite having many benefits of improving the engineering properties of soil, cement causes environmental problems such as CO2 emission and natural environmental damage. Therefore, several new soil binders (including biopolymer, gum, and resin) have been developed to improve soil strength and reduce environmental problems [4,5,6,7,8].
Chang et al. [9] investigated soil cementation using casein protein from waste bovine milk. Casein is a predominant protein in milk and can be obtained from milk treatment [10]. When casein is mixed with an alkaline substance, it exhibits an adhesive property [11]. Some casein adhesives have been used in wood furniture and for glass bottle labels due to the adhesive’s excellent efficiency at low temperatures [12]. On the other hand, blast furnace slag (BFS) is a residual material produced from the rapid water quenching of a furnace. In general, BFS has a relatively high chemical reactivity due to its unstable crystal structure [13]. It undergoes hydration slowly with slag and water. However, when in contact with an alkaline solution, cementation occurs at once [14]. A lot of chemical agents that activate the curing reaction of slag have been reported [15,16,17]. A casein binder shows weak durability and low strength with water. Having a reaction of hydration in the alkaline condition, BFS, made of some alkaline ingredients, can be added to overcome such a weakness of a casein adhesive.
Because cemented soils usually have lower strength than concretes or rocks, the evaluation of the durability of the cemented soils is hindered. Therefore, a jar slake test can be used to evaluate the durability of weakly cemented soils. Also, for low-strength materials, it is important to predict the curing time for field applications. Lee et al. [18] used piezoelectric materials (PZT, i.e., lead zirconate titanate) to analyze the setting of cement mortar. Elsewhere, Park et al. [19] applied PZT to a predicting unit weight of sand. Such piezoelectric elements can be used to evaluate the physical and mechanical properties of cementitious materials.
In this study, three types of casein binders (standard, modified, and modified + BFS, referred to as STD, MOD, and MBS, hereafter) were prepared to enhance the durability and strength of sand samples at different (dry or wet) curing condition for seven days. Some samples were repeatedly immersed thrice in water. A PZT sensor was embedded in the Jumunjin sand to measure the conductance and frequency of the PZT during curing. The curing time and corresponding strength were investigated based on the peak conductance and corresponding frequency. The unconfined compression and durability tests were conducted to evaluate the casein binder in terms of strength and water resistance. The strength loss from repeated wetting was also estimated on each water immersion. The microstructure of the samples was examined through scanning electron microscope (SEM) analysis for each binder.

2. Materials and Testing Methods

2.1. Materials

2.1.1. Jumunjin Sand and Blast Furnace Slag

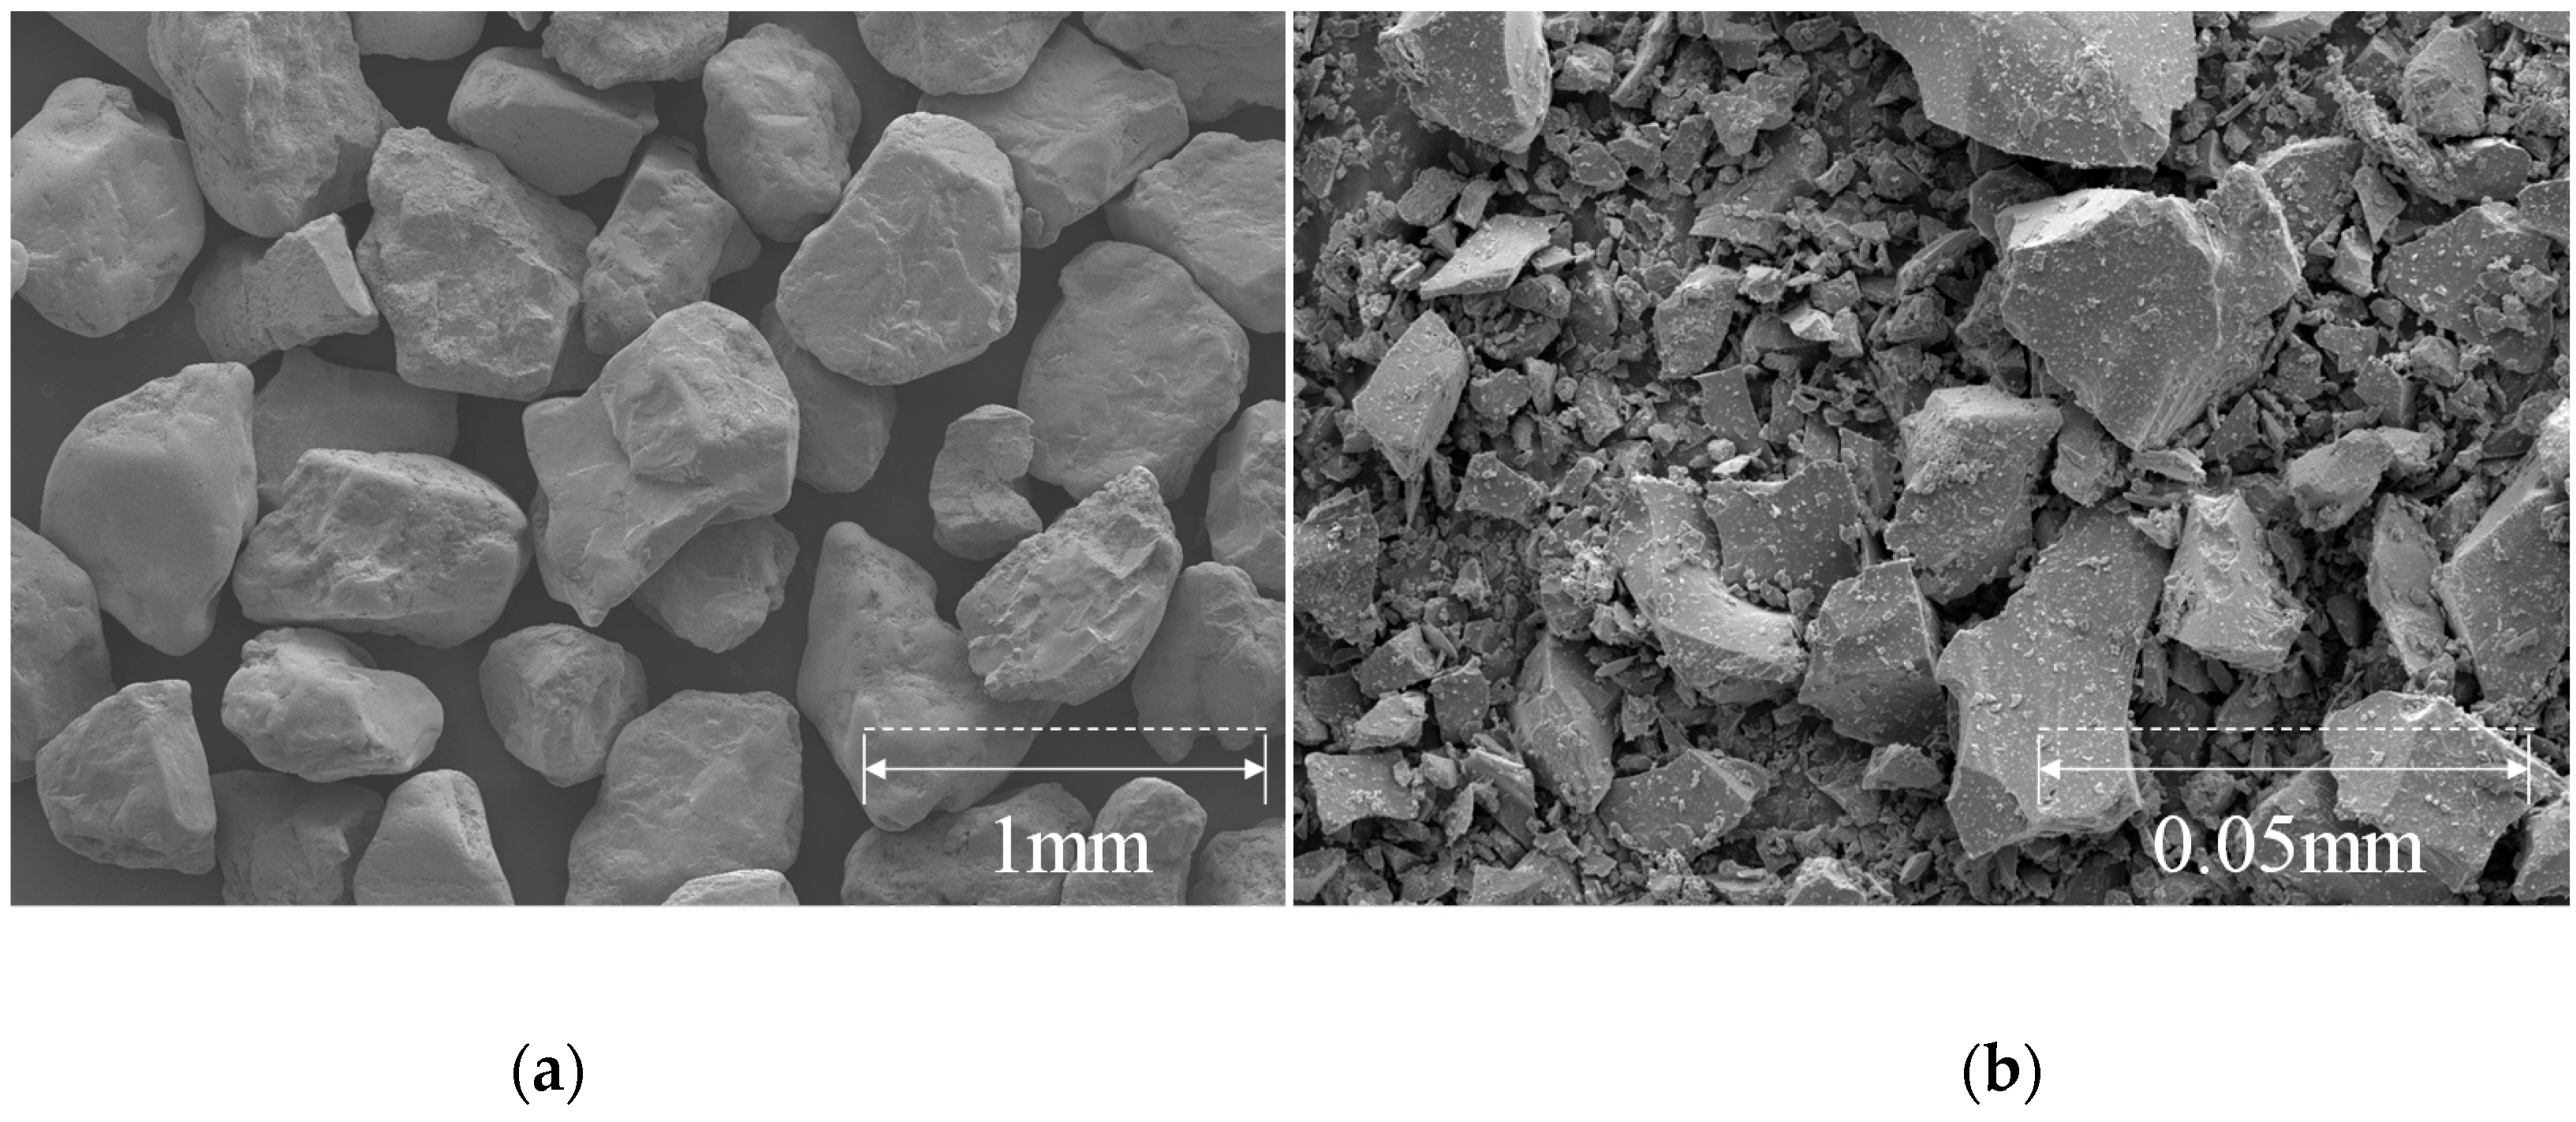
Jumunjin sand was used for cementing a soil with casein adhesive. The sand is a standard in Korea, classified as a poorly graded sand (SP) in the Unified Soil Classification System (USCS). The sand contains >87% of silica (SiO2) and 64% of the particles are in the size range of 0.425–0.85 mm. The uniformity coefficient (Cu) and coefficient of gradation (Cc) of the soil are 1.61 and 1.03, respectively. We also obtained blast furnace slag (BFS) which was composed of 52.62% of CaO, 34.32% of SiO2, and 15.29% of Al2O3. The composition of the BFS was similar to that of Monshi (1999) [20]. The particle size distribution curve and material properties of Jumunjin sand and BFS are shown in Figure 1 and listed in Table 1. Figure 2 shows particle images of Jumunjin sand and BFS. Furthermore, X-ray fluorescence (XRF) analysis was performed to obtain the chemical composition of Jumunjin sand and BFS. The results are summarized in Table 2 and Table 3, respectively.

2.1.2. Casein Binders

The three types of binder (STD, MOD, and MBS) were prepared with different ingredient proportions, listed in Table 4. Because pure casein is poorly soluble in water, it requires the addition of an alkaline solution to solubilize. When basified, several ions in the aqueous solution evinced the binding properties of casein. The performance of the casein binder changes depending on the presence (type and magnitude) of cations and the OH ions. In this study, the ingredient composition proposed by the Wisconsin Wood Research Institute was adopted as standard [21]. On the other hand, Lay et al. [22] mentioned that water resistance would increase when the calcium hydroxide is 30% composition. Although the standard binder was presented by numerous case studies, the modified casein binder was proposed to improve the water resistance of the standard casein binder. Furthermore, to enhance the water resistance, the BFS was added to the modified casein binder in 0.5×, 1.0×, and 1.5× of other constituents in the materials, except distilled water. Therefore, the ratio of blast furnace slag to casein (SCR) was 0.5, 1.0, and 1.5.

2.1.3. Sample Preparation

Three types of casein-cemented sand were tested and noted as STD, MOD, and MBS in this study. The binder content and blast furnace slag–casein ratio (SCR) are listed in Table 5. The diameter and height of the cemented sample are 5 and 10 cm for the unconfined compression, water content, and piezoelectricity response tests. The height of the samples for jar slake test was 3 cm. A cubic sample with a 1 cm side length was used for the SEM analysis. The dry unit weight of all cemented samples was designed between 15–16 kN/m3. The samples were cured in the air and water at 20 °C. A piezoelectric element was installed at the center of each sample to examine the solidity process of the samples at different curing periods. All samples were kept in the mold for 24 h, then they were demolded and cured before further testing.

2.2. Testing Methods

2.2.1. Lead Zirconate Titanate (PZT) Sensor

The PZT sensor is 0.3 mm thick and 20 mm in diameter (Figure 3a). The sensor, connected to an impedance analyzer, was installed in the middle of the STD, MOD, and MBS samples strengthened with casein (Figure 3b). The binder content of the samples used was 4% and the SCR of the MBS binder was 1.0. The impedance analyzer collected the PZT sensor measurements (Hioki, Nagano, Japan). These measurements can reveal changes in the strength of the material at an early stage. The conductance-frequency response was recorded to analyze the solidity of the sand samples at the initial state, and at the curing ages at 12 h intervals for 7 days. The measured frequencies from the electrical impedance of PZT were in the range of 100–300 kHz. The water content of the samples was measured after the 3rd day of curing and was used as an additional parameter of sample solidity analysis.

2.2.2. Scanning Electron Microscope (SEM) Analysis

The SEM image analysis (Hitachi, Tokyo, Japan) was carried out to examine the microstructure and the interactions between casein and sand samples. The cemented sand was visualized by magnifying the image successively at 100× and 400× to visualize the bonds among the casein, slag, and sand particles. A 4% binder content was used for each sample and SCR of the MBS binder was 1.0.

2.2.3. Unconfined Compression Test

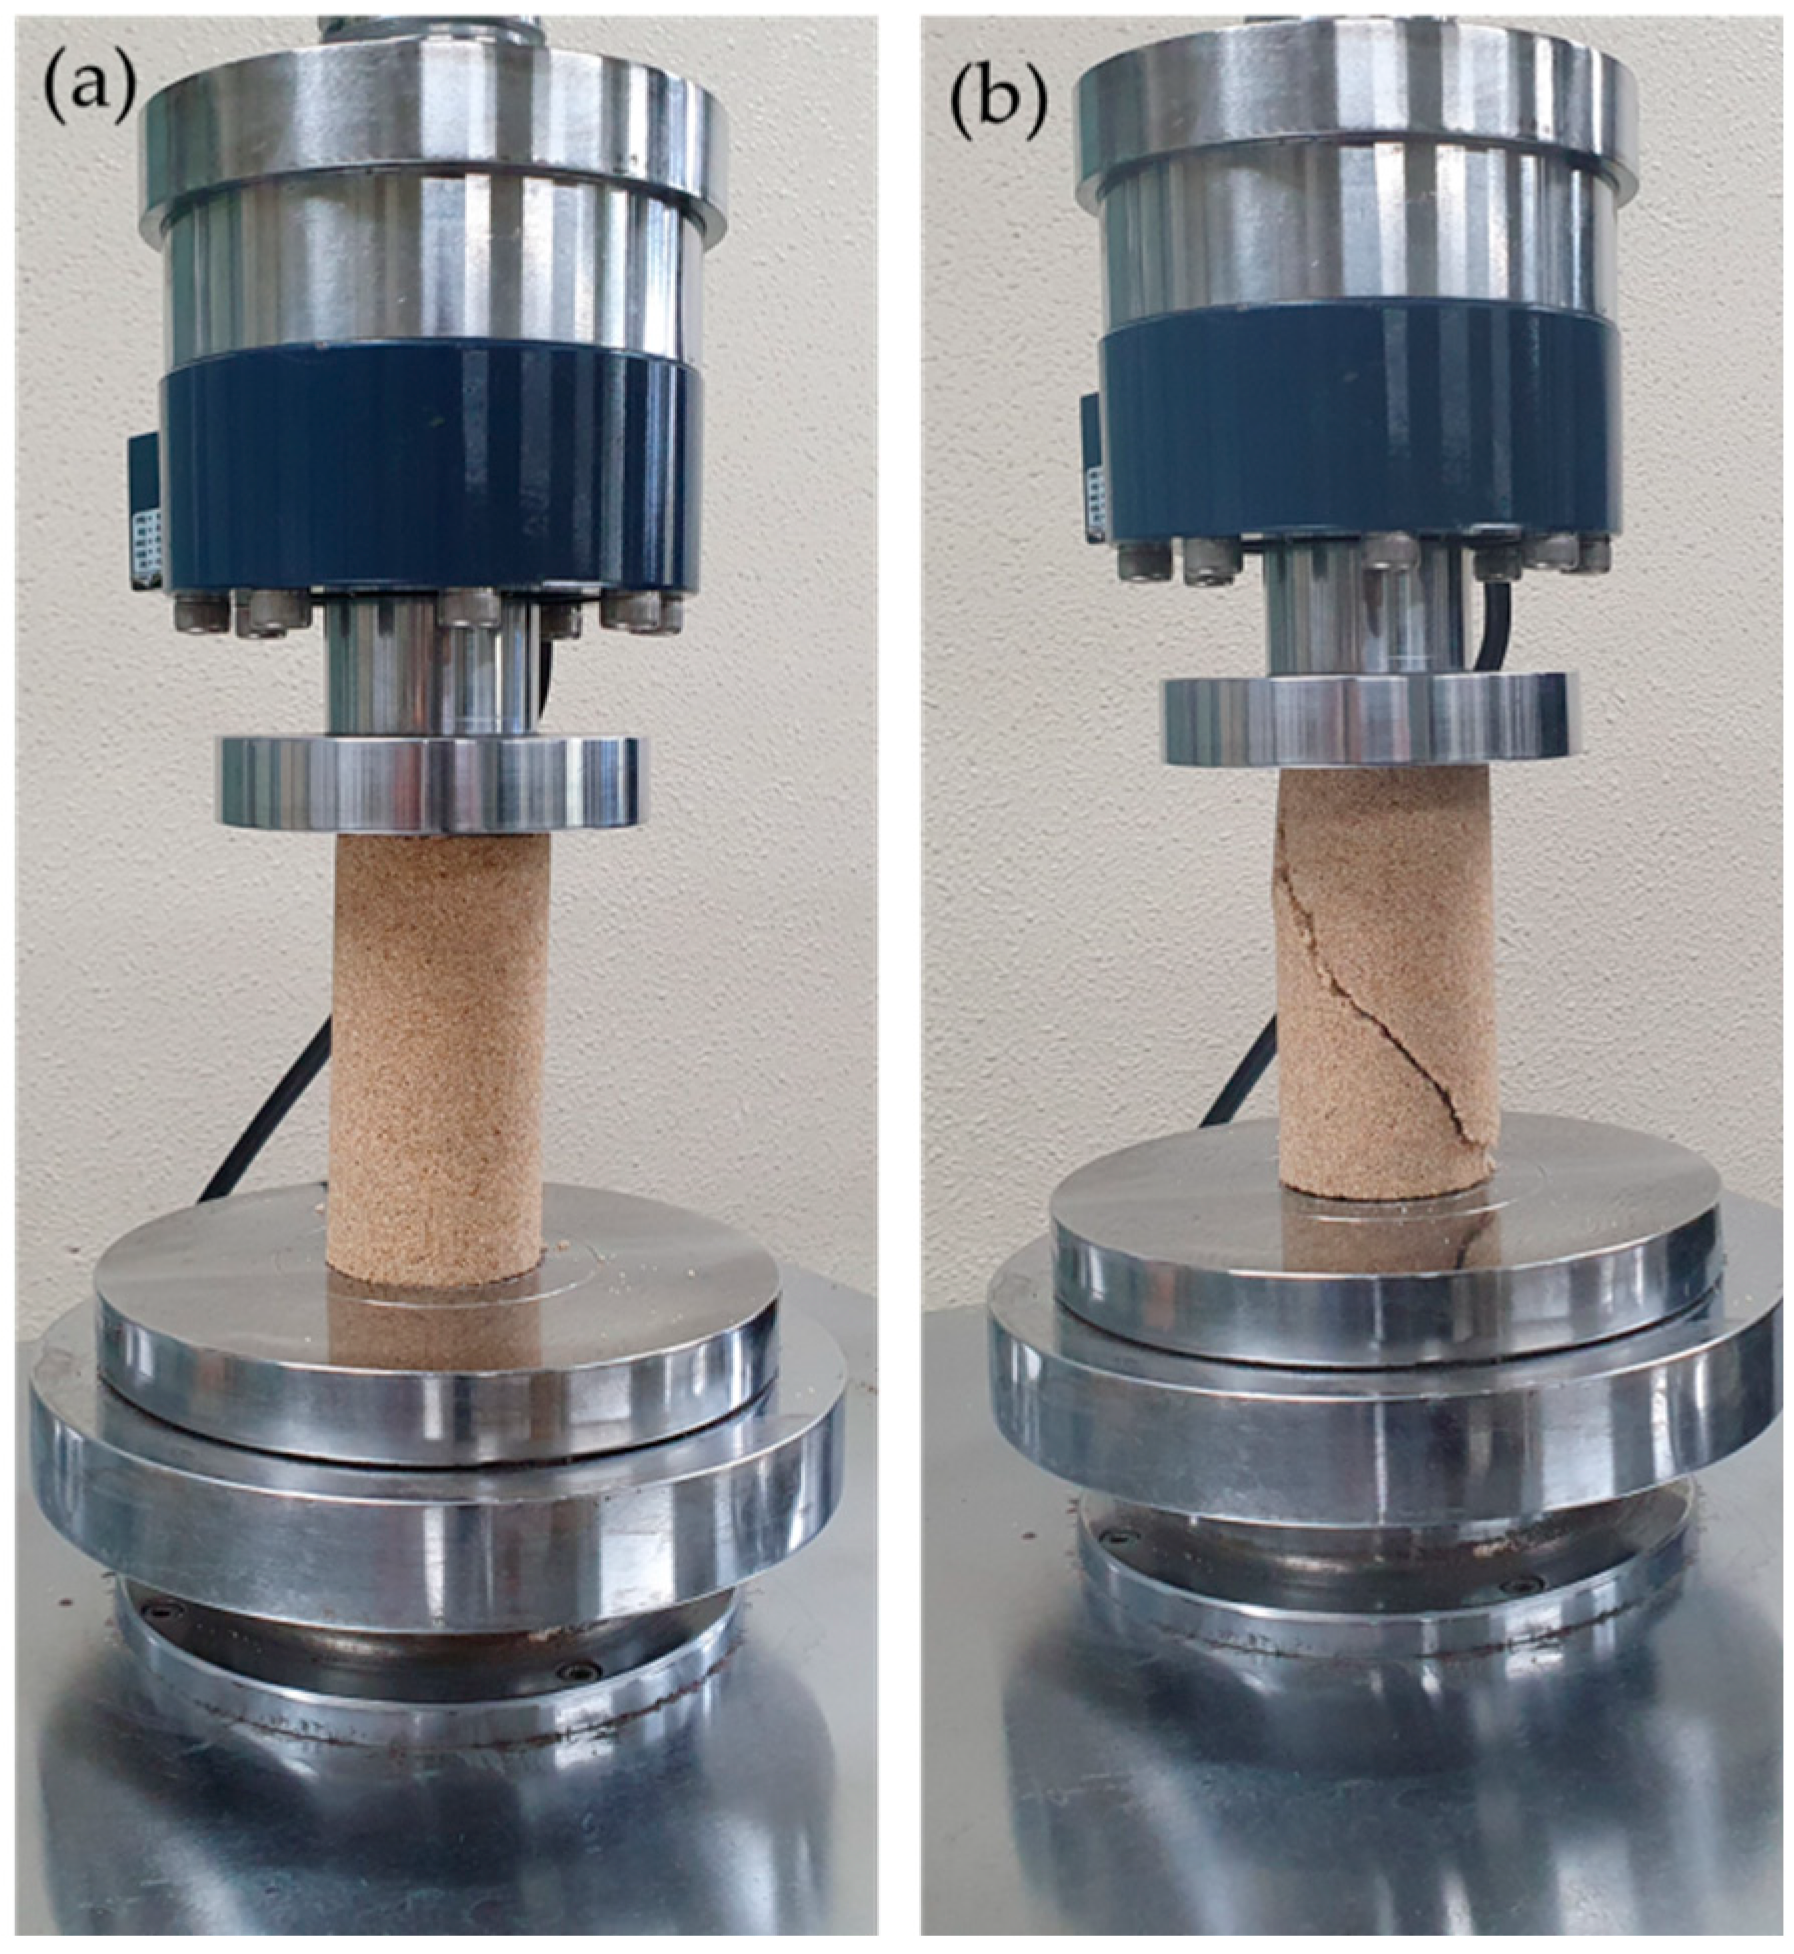
The unconfined compression test on casein-cemented sand was performed according to the American society for Testing and Materials (ASTM) D 2166 [23]. The load cell, with a capacity of 5 t, was attached to the actuator to perform the test at dry and wet conditions (Figure 4). The load was applied at a rate of 1.0 mm/min. The wet condition was achieved by immersing the samples in water before the experiment. For each sample type, an average of three measurements was obtained for UCS and axial strain. The elastic modulus was computed as the tangent slope of half the stress point from the compressive stress-strain curves.

2.2.4. Jar Slake Test

The casein binder resists water. However, when in contact with water for a long time, the binding structure becomes weak progressively. Thus, the STD, MOD and MBS samples cured for 7 days were immersed in water and the degree of degradation from the Jar slake test was measured. All samples were cemented with 4% binder content and SCR of MBS was 1.0. Details of the jar slake test have been documented [24,25,26]. This method expresses the degree of degradation of a sample in water over time. The samples were classified into Categories 1–6, depending on the degree of decomposition that is recorded every 30 min for about 24 h. Samples in Category 1 degraded to a uniform mud-like structure, Category 2 reduced completely to flakes, Category 3 broke slowly and develop few chips, Category 4 broke rapidly with many fractures, Category 5 broke slowly and with many fractures, and Category 6 showed no observable change.

3. Results and Discussions

3.1. Results of Lead Zirconate Titanate (PZT) Sensor Analysis

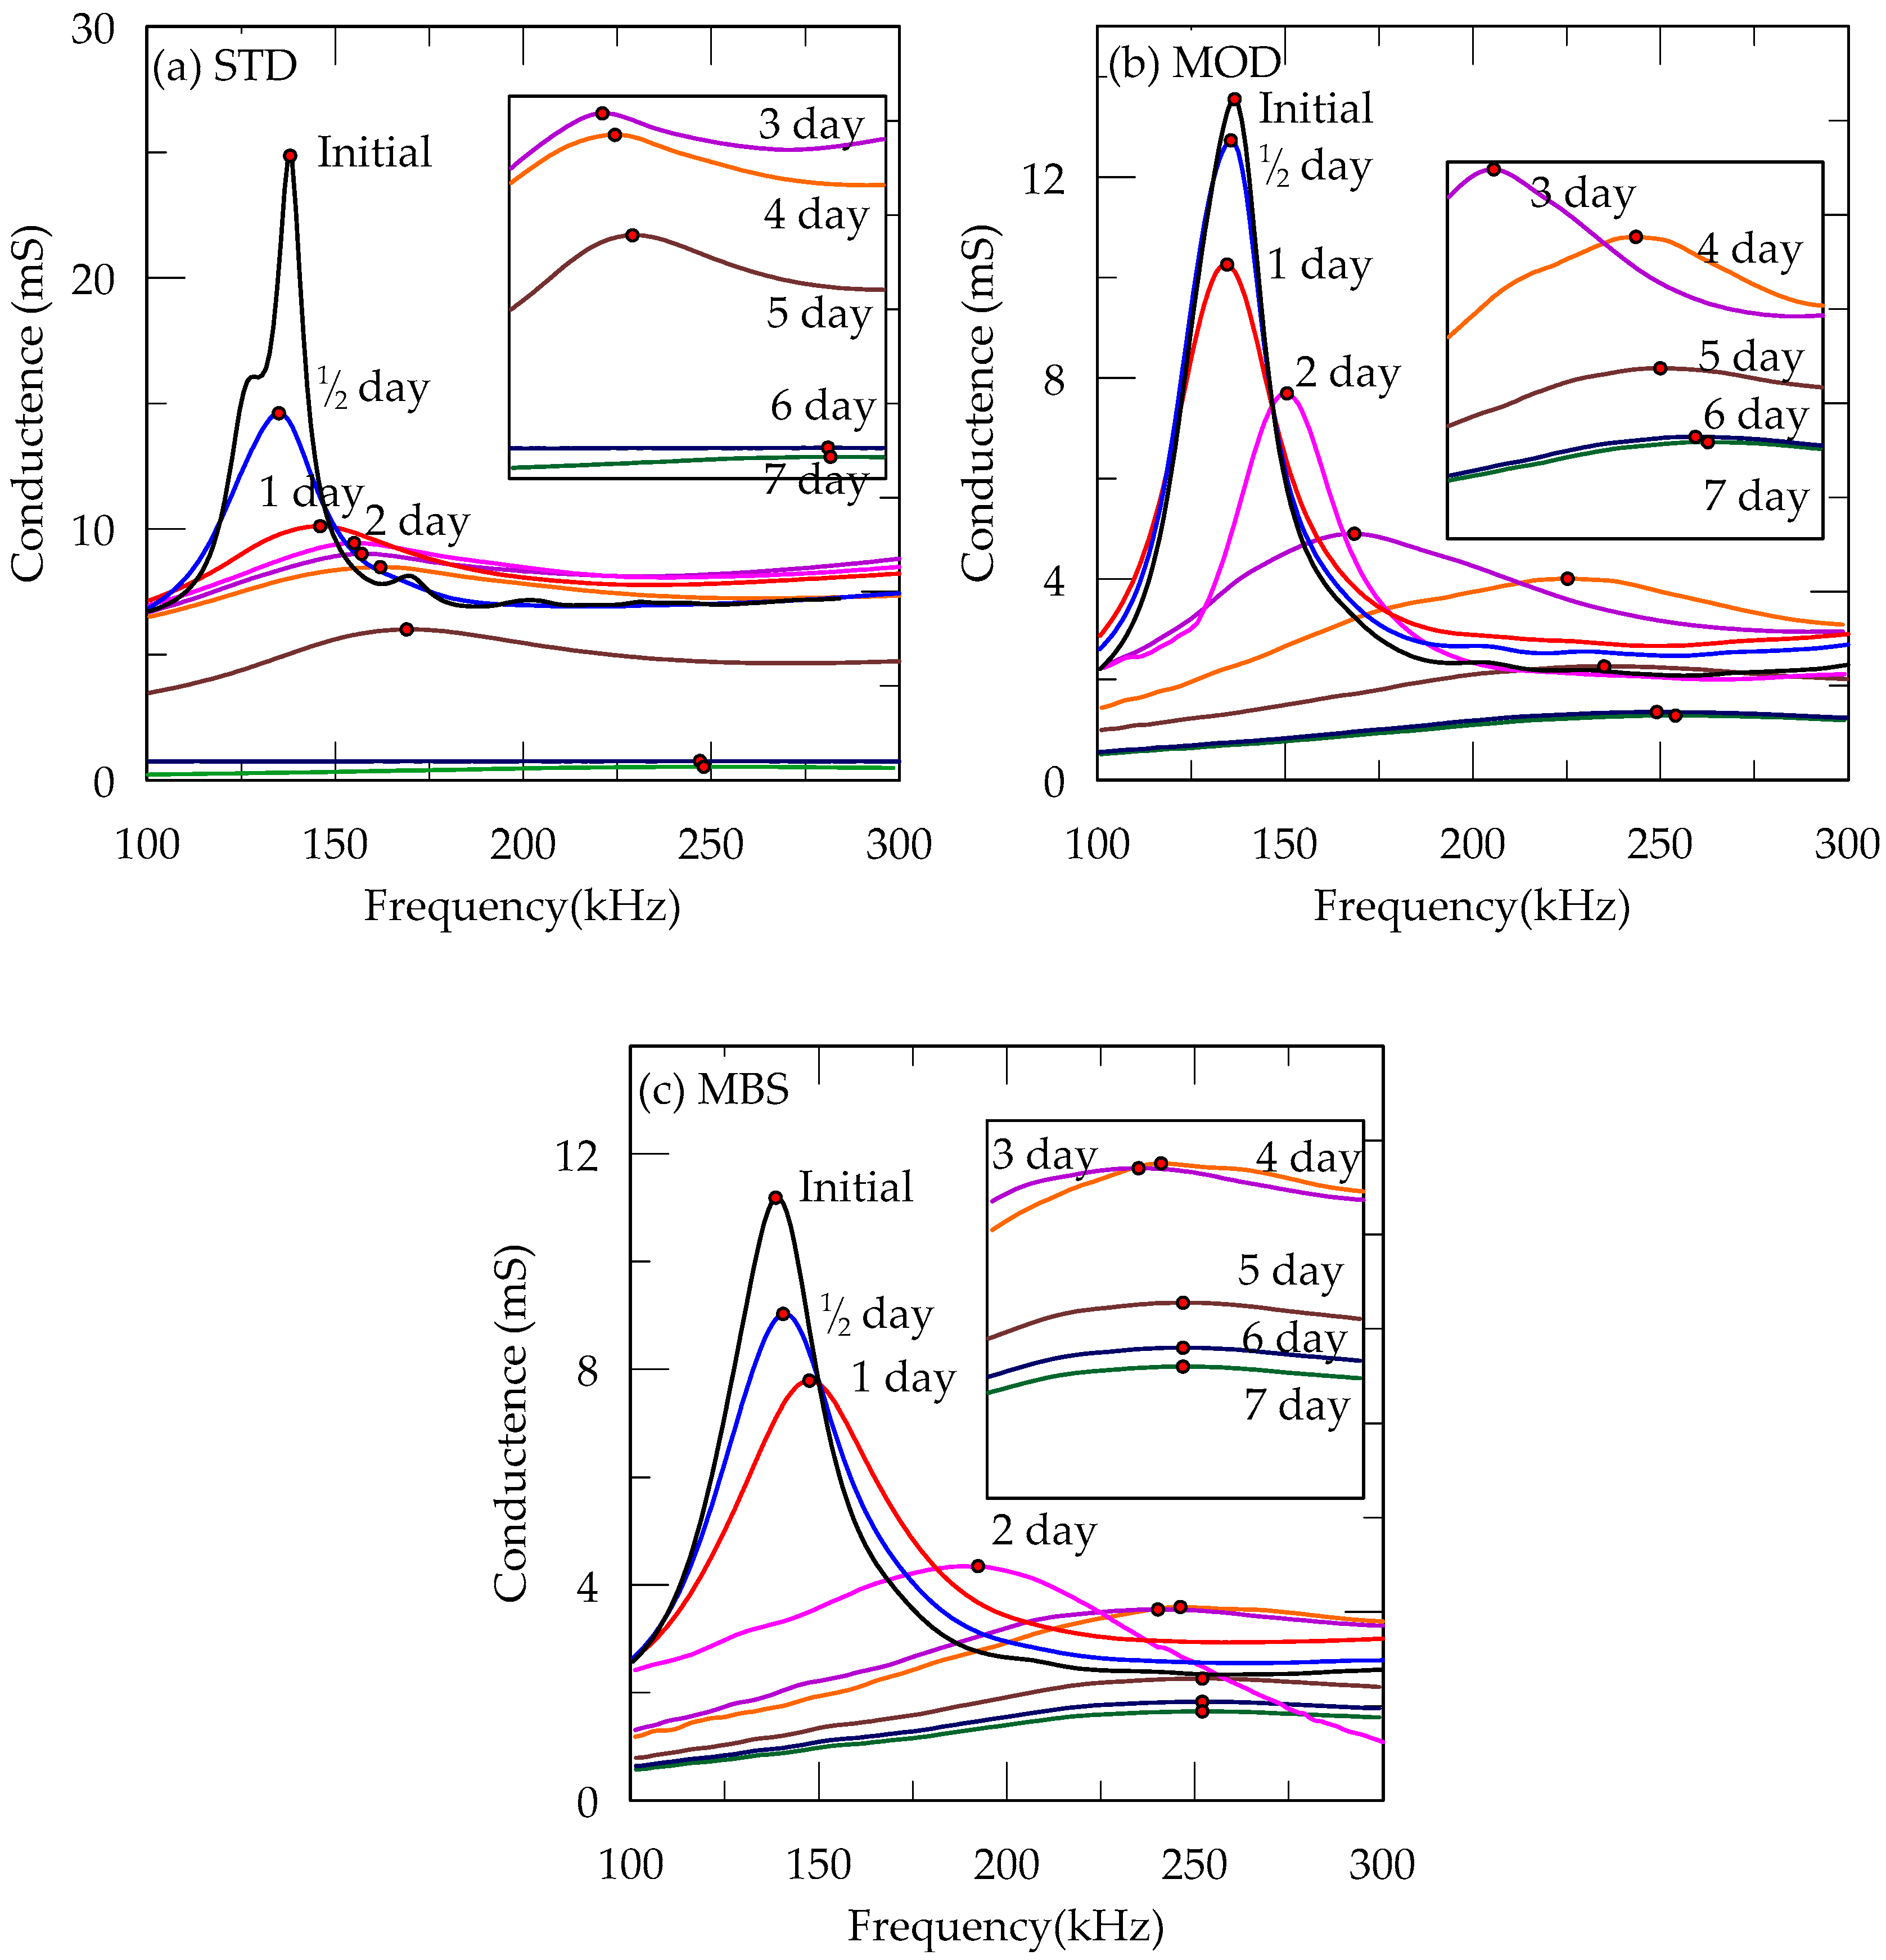
Figure 5 shows the conductance spectral response of the embedded PZT sensor of STD, MOD, and MBS samples with curing time. The initial state of the sample when placing the mixture in the mold was defined as a reference point. The peak conductance occurred due to resonance by alternating current flow. It was shown that a peak point of conductance disappeared and flattened with the curing period. Such flat-shaped responding spectra were observed from all three binder samples with the curing time. The disappearance of peak means that the confining condition around the sensor has been hardened. Thus, we noticed that the internal solidity progress of the sample sufficiently occurred around the PZT sensor.
In Figure 6, the variations of peak conductance, corresponding frequencies, and water content over a curing period of seven days are shown. In Table 6, the peak conductance at the initial state of STD, MOD, and MBS samples were 24.86, 13.55, and 11.19 mS, respectively, with corresponding frequencies of 138, 136, and 138 kHz. As the samples cured for 1/2, 1, 2, 3, 4, 5, 6, and 7 days, their peak conductance gradually decreased and converged approximately at 0.53, 1.28, and 1.65 mS, respectively. On the other hand, their corresponding frequencies gradually increased and converged approximately at 248, 254, and 253 kHz, respectively.
From Figure 6a,b, the variation of conductance and frequency can be separated into 3 stages: (I) 0–24 h, (II) 24–144 h, and (III) 144–168 h. From our observation, the cementation process was of three stages: exterior cementation, interior cementation, and sand-binder stabilization. At the first stage, peak conductance decreased but the corresponding frequency changed slightly, and the interior sand surrounding the sensor was soft, whereas the exterior sand was hard. Although the vibration of freedom and resonant frequency were maintained due to the soft surroundings, the peak conductance decreased gradually. However, at the second stage, the cementation of the interior sand occurred, and both the peak conductance and corresponding frequency moved significantly. Finally, the motions started to converge like that of the III stage. The time difference between the external hardening and internal hardening was due to the extent of moisture reduction. Because the moisture of the sample evaporated from the exterior to the interior, the water content decreased gradually till the 5th day, becoming lower than 1% in the 6th and 7th days.
The variation of the water content was separated with the same time section with other results as shown in Figure 6c. During curing, the water content of MBS samples was lower than those of STD and MOD samples and converged earlier. We observed that both the water evaporation and hydration of the blast furnace slag occurred. Therefore, the 7-day period was enough for curing and adding BFS in the binder contributed to achieving a rapid hardness and sufficient strength development.

3.2. Results of Scanning Electron Microscope (SEM) Analysis

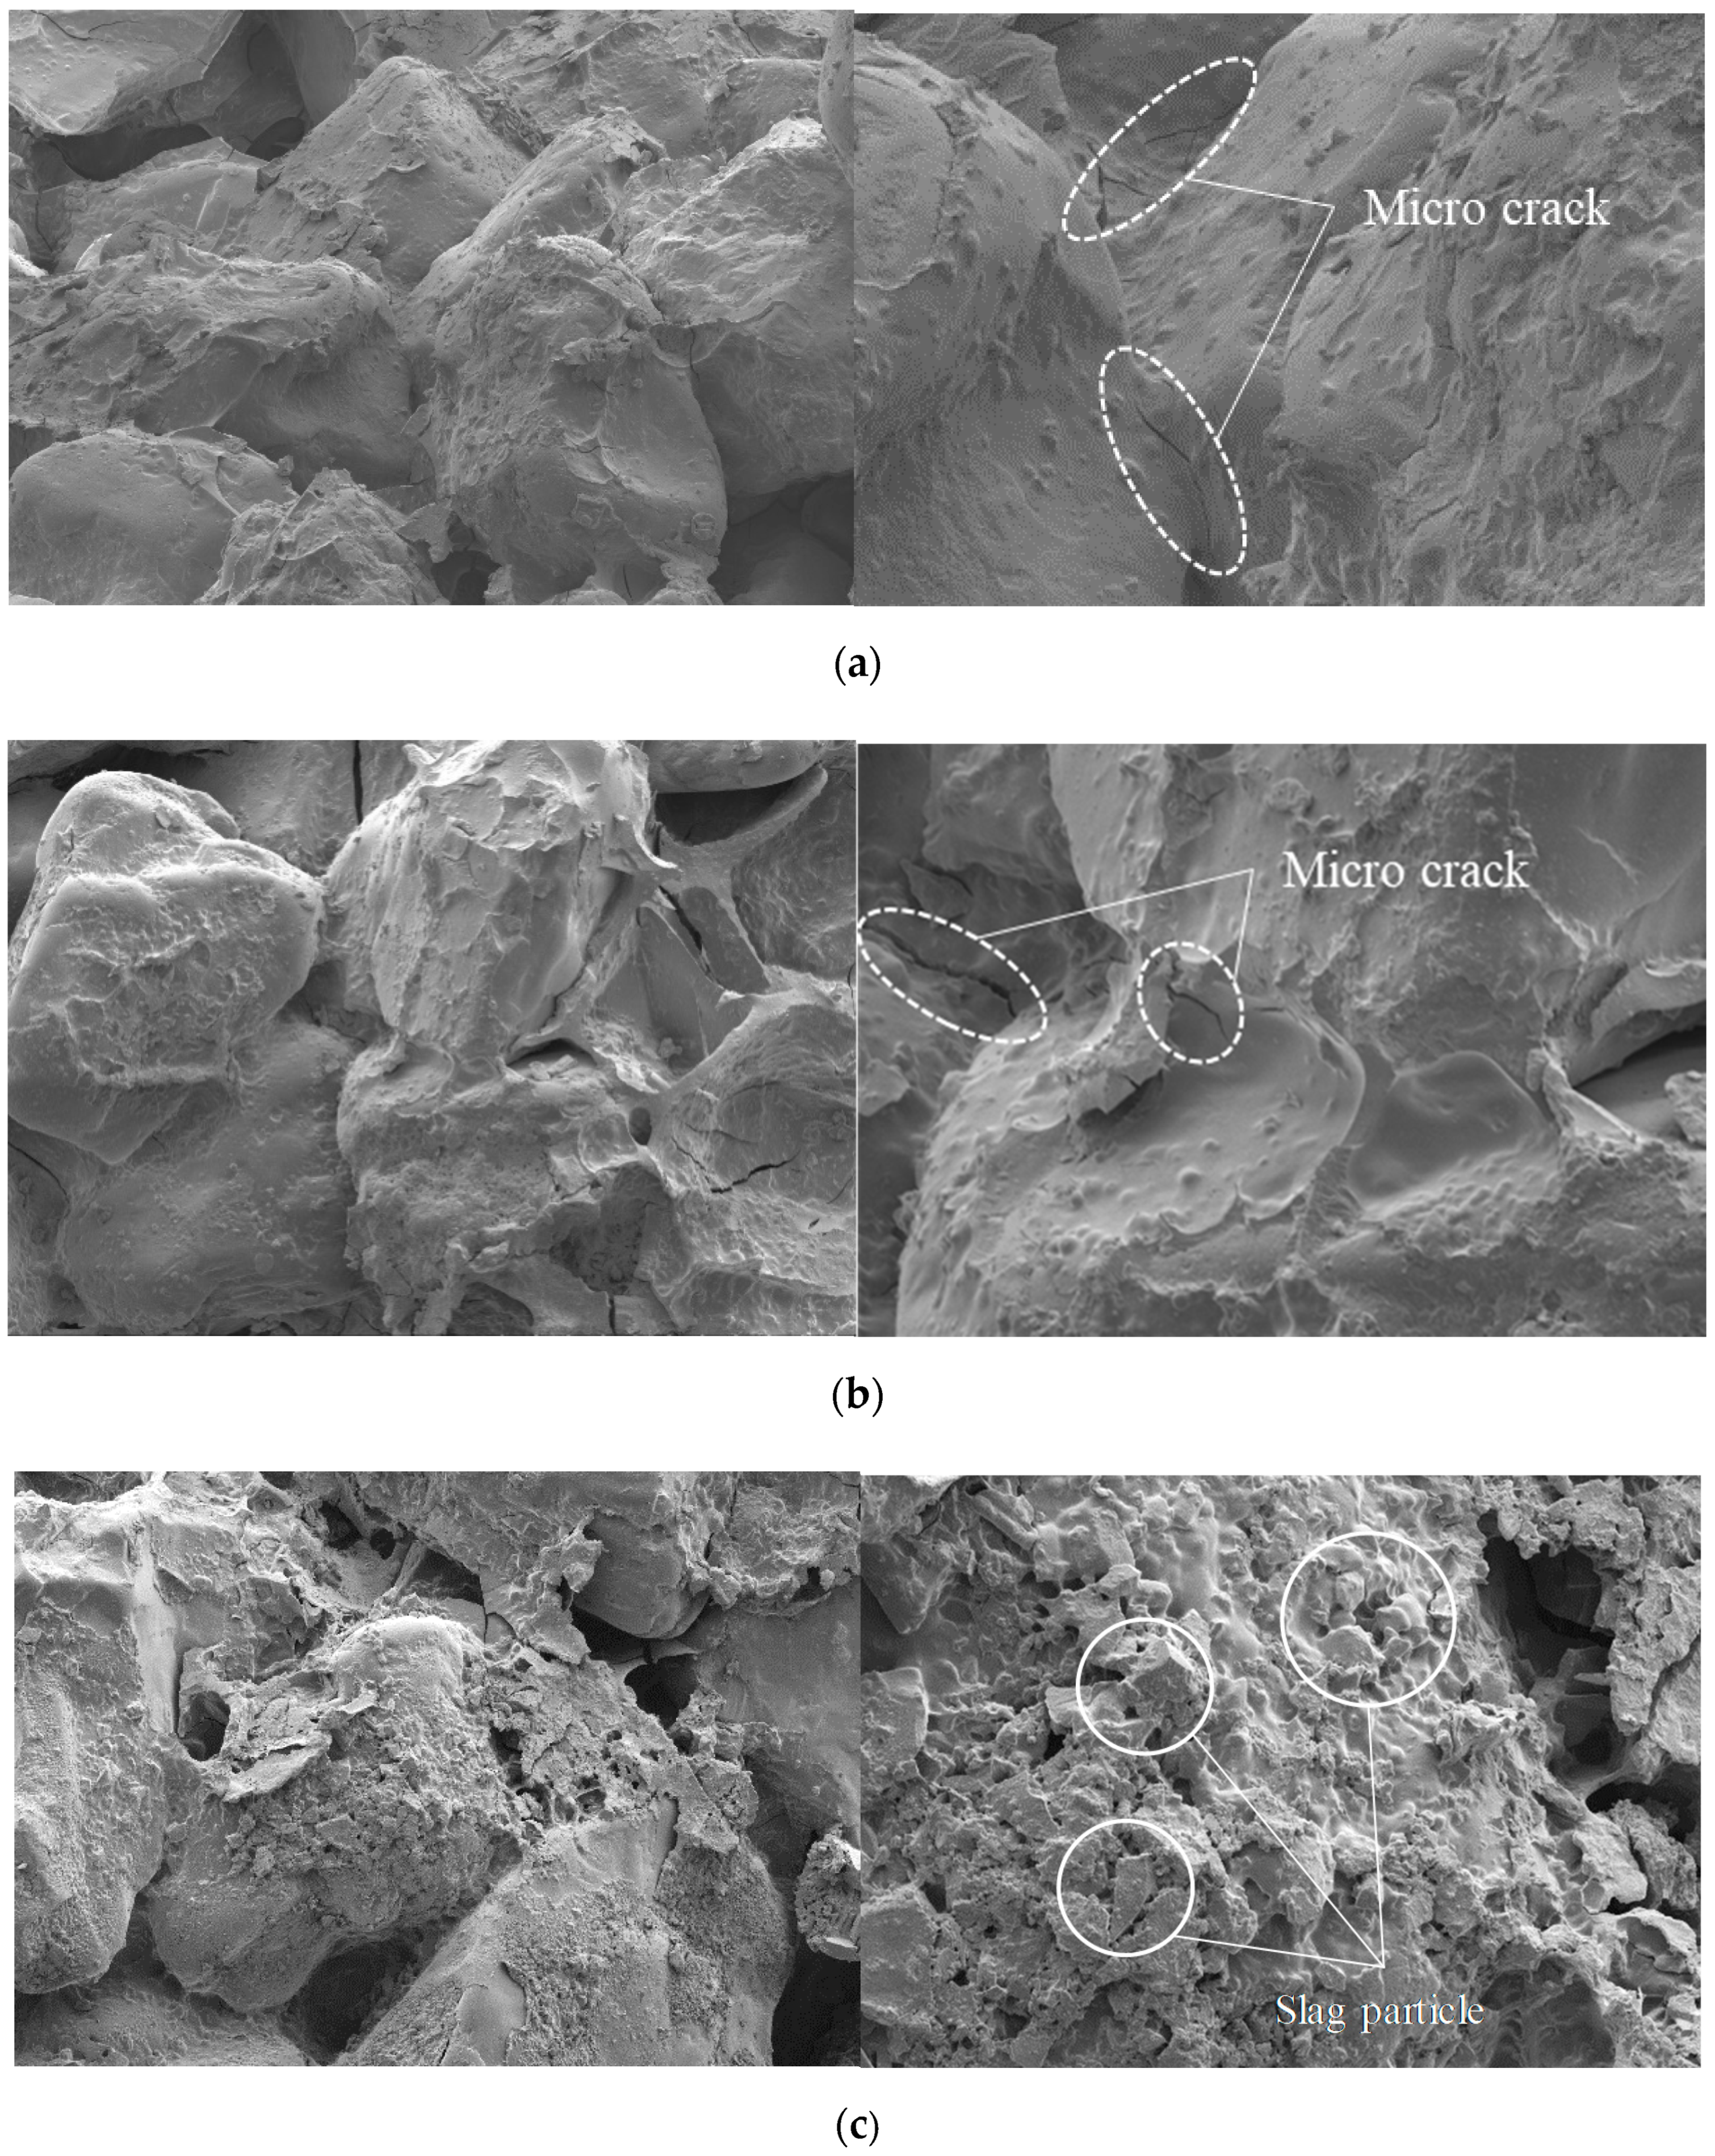
The SEM analysis was performed to visualize the microstructure and bonds between particles of casein, slag, and sand samples as shown in Figure 7. We observed that casein enveloped the sand and enhanced the bond between sand particles. Figure 7a–c present the interaction of particles for STD, MOD, and MBS samples, respectively. The casein bonded the sand particles effectively without voids on the contact surface. The micrographs of STD and MOD showed some microcracks on the surface of the casein bond, attributed to water evaporation. The volume of the binder bond reduced during moisture evaporation of the casein binder, causing the inner crack of the structure. However, the MBS sample did not exhibit any crack on the binder structure, probably due to the presence of both the blast furnace slag and casein bonders in the mixture. Unlike STD and MOD samples, the slag contained in the MBS samples reacted with moisture and removed the micro-cracks caused by moisture evaporation.

3.3. Results of Unconfined Compression Test

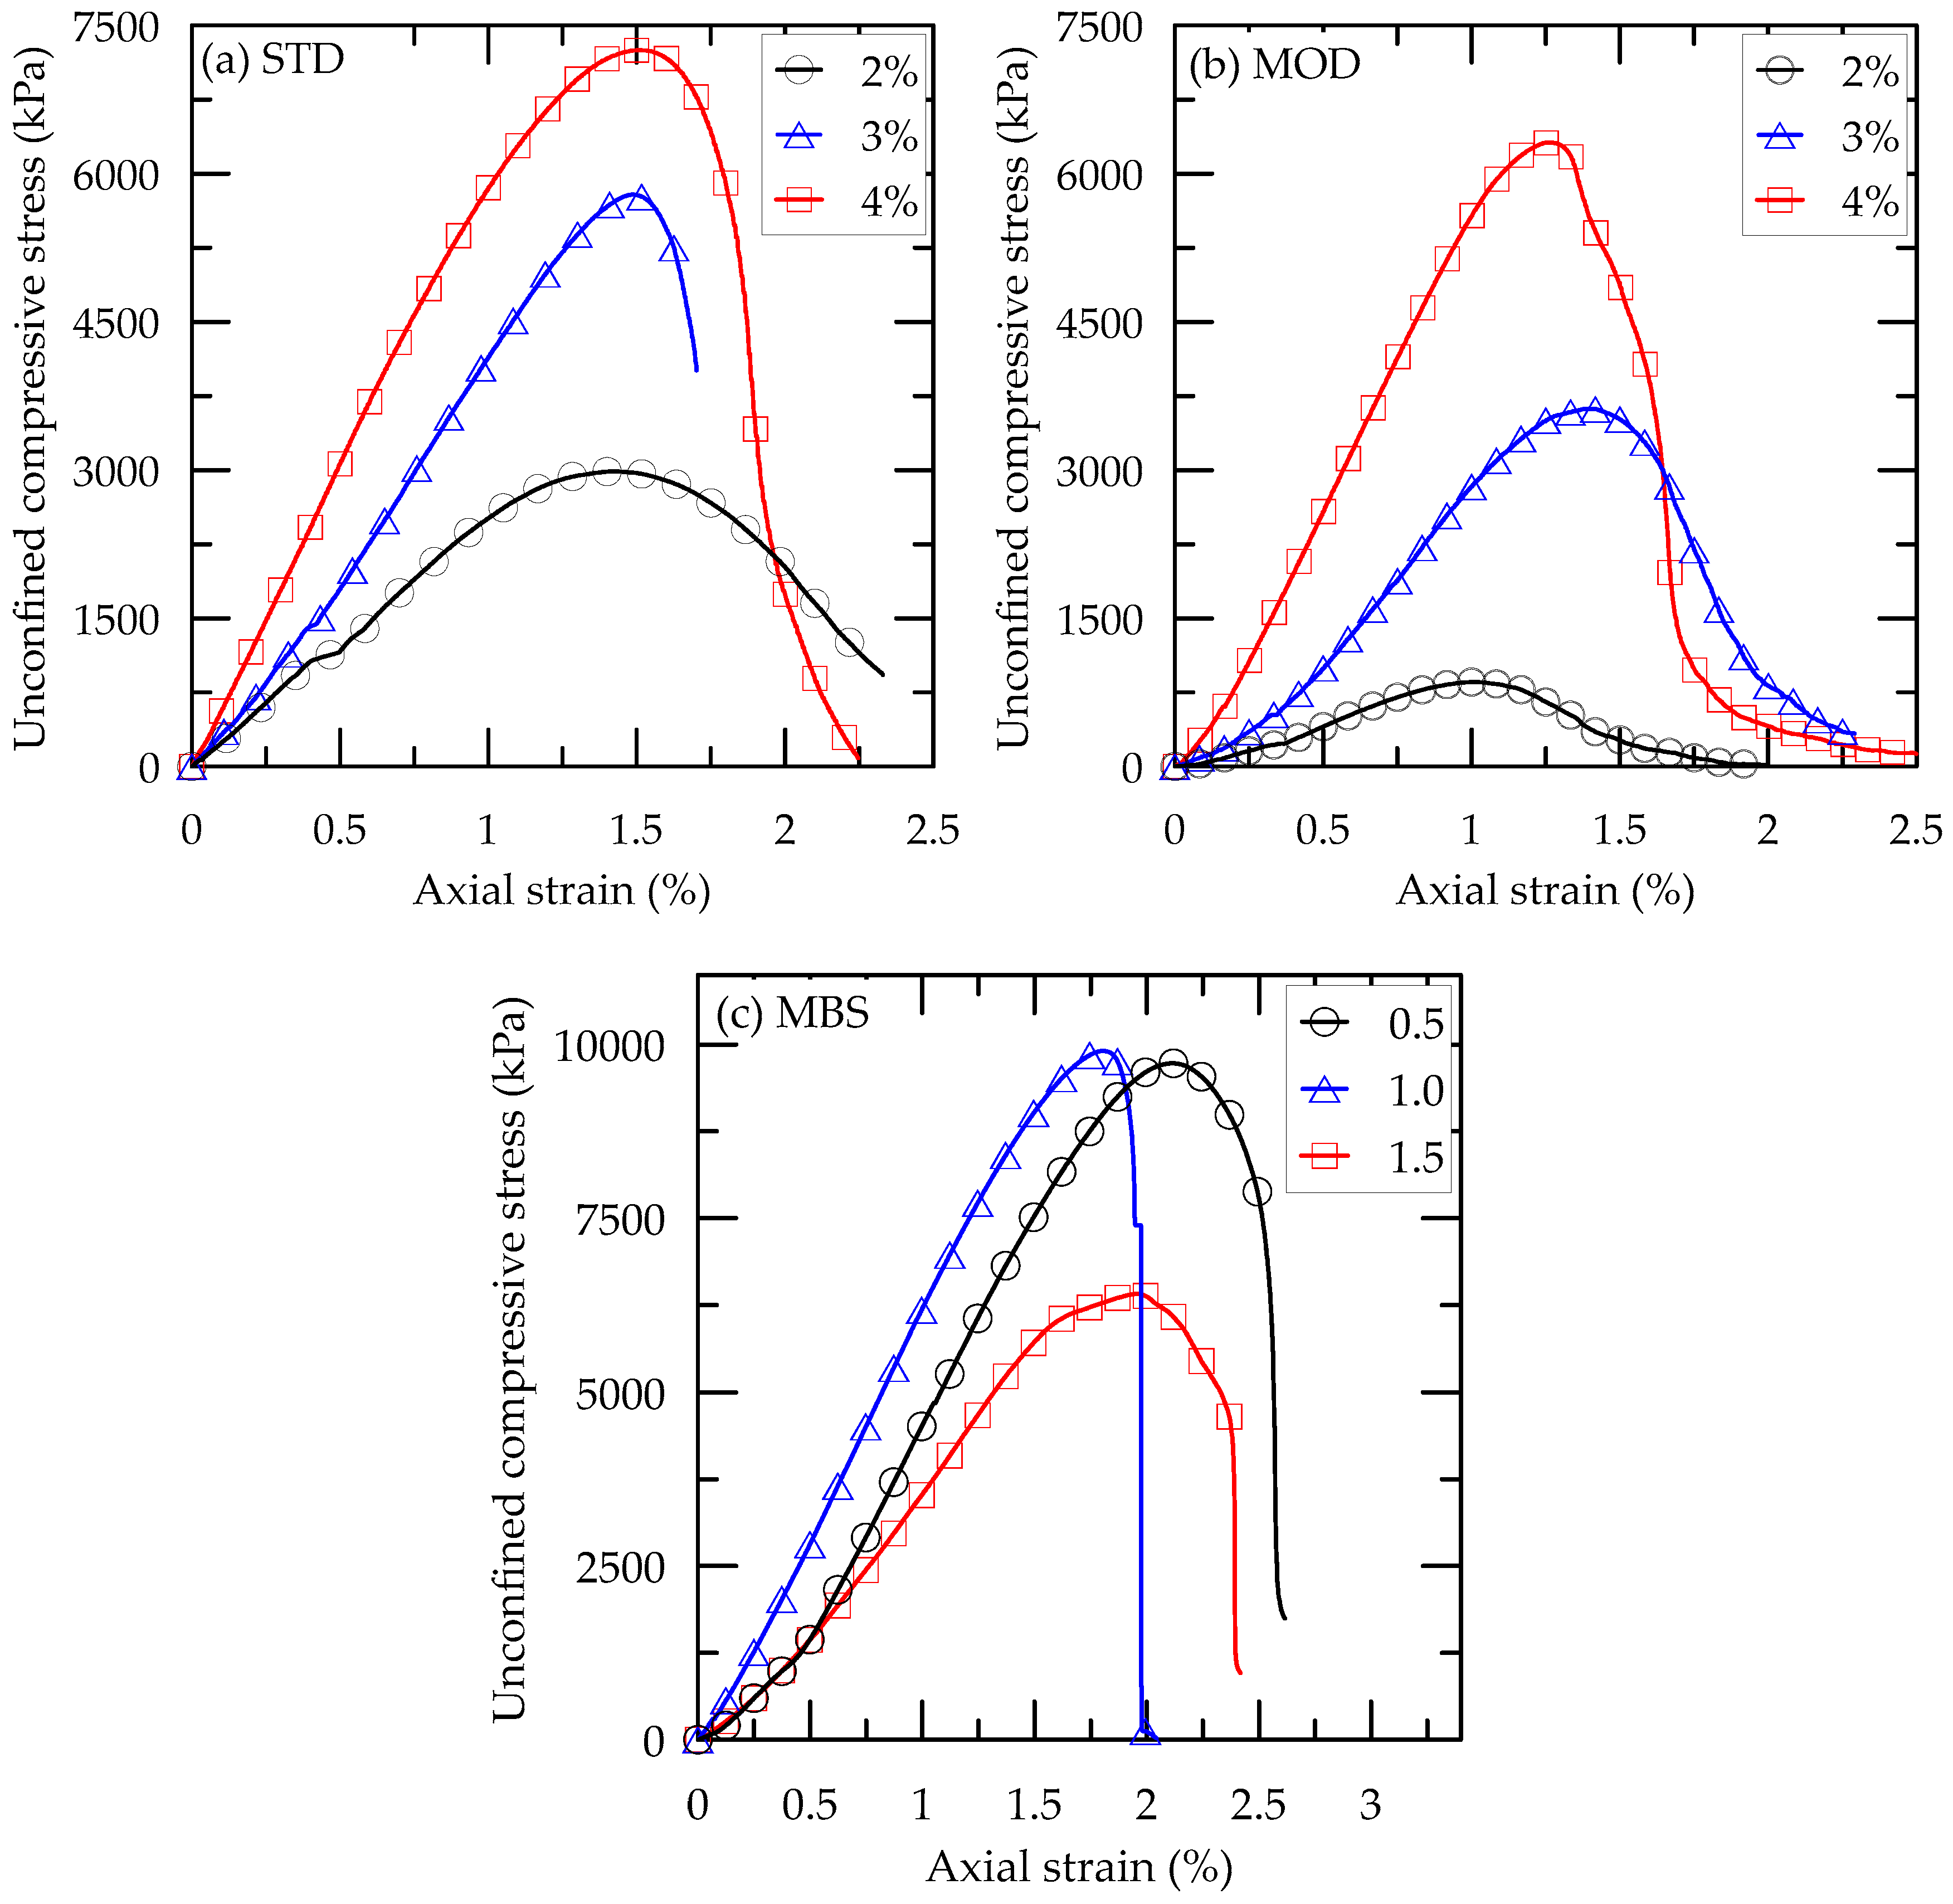
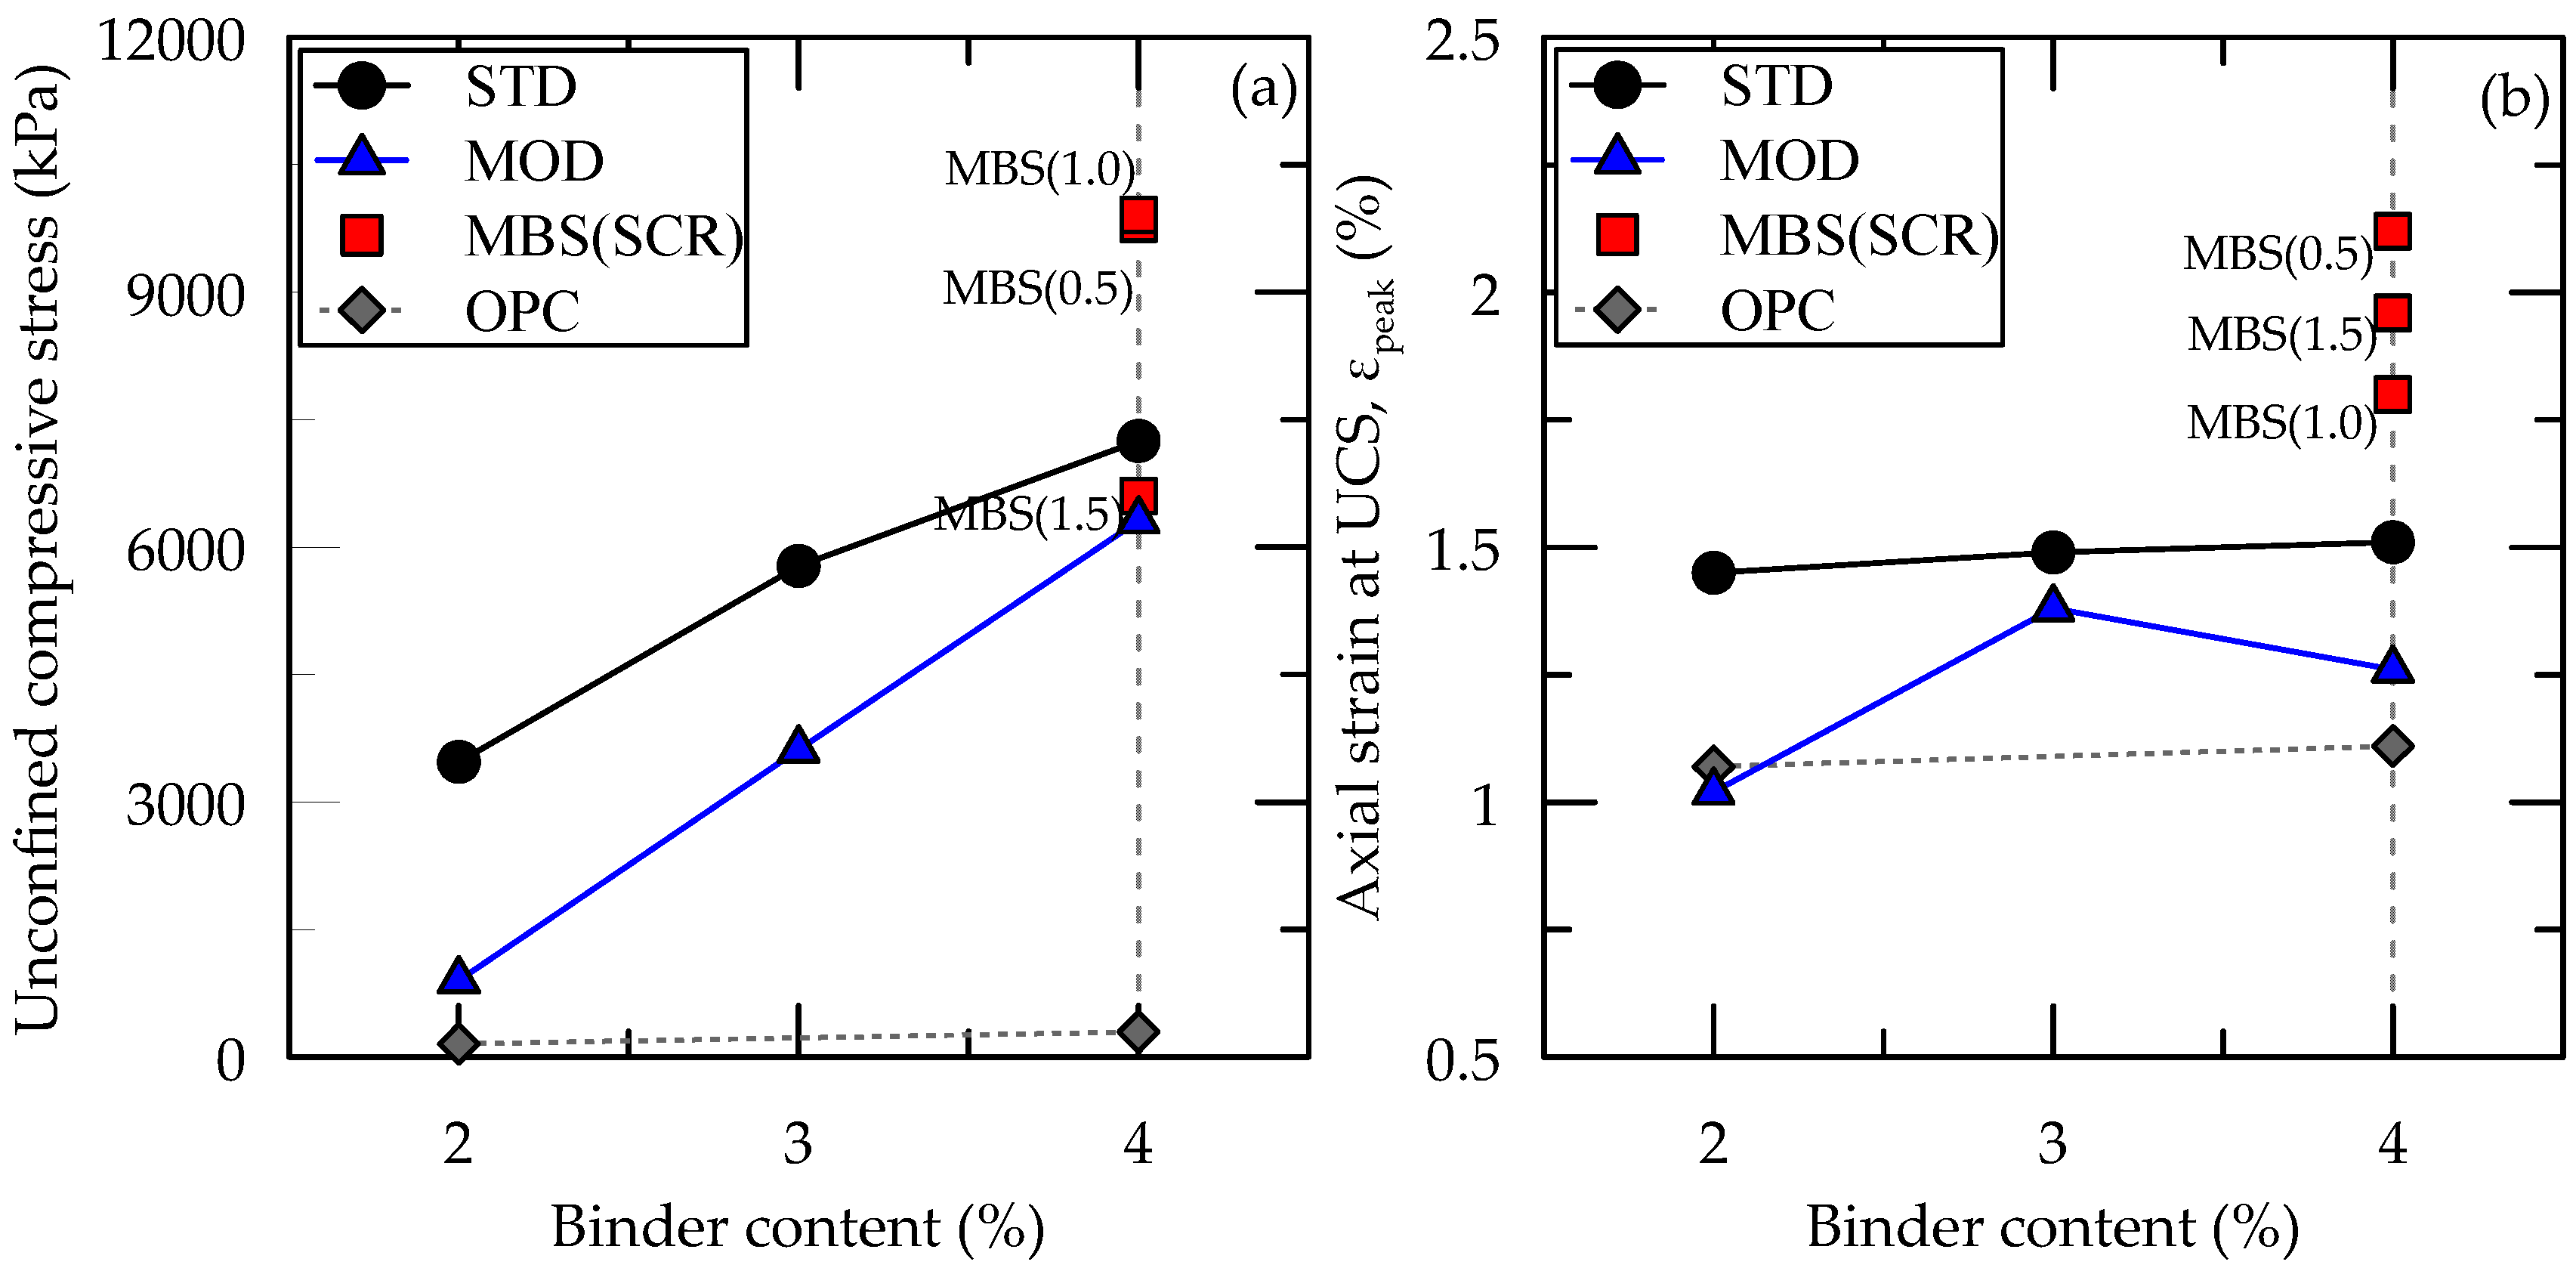
The relationship between unconfined compressive stress and axial strain of the casein-cemented samples (STD, MOD, and MBS) is shown in Figure 8, while the results are summarized in Table 7, with those of ordinary Portland cement (OPC) [27]. The maximum UCS values were 7249, 6313, and 9908 kPa for STD, MOD, and MBS, respectively. Each of STD, MOD, and MBS samples showed a UCS value higher than that of OPC. The UCS of STD samples was significantly higher than that of MOD samples, irrespective of the binder content. The adjustment of calcium hydroxide and sodium hydroxide ratio in the STD binder lowered the strength of MOD samples. On the other hand, the addition of slag into MOD samples caused a significant increase in the UCS with SCR of 0.5 and 1.0. When a SCR increased to 1.5, the increase in the UCS of the MBS sample was not noticeable because the slag supplied was in excess, therefore, it could not react with water. Moreover, the slag was not hydrated inside the sample, which resulted in strength reduction. Therefore, the slag and casein ratio of 1:1 was a suitable mixing ratio for developing high-strength cement.
Furthermore, the dry unit weights were similar to the designed values. The weights increased slightly and proportionately with the binder content and SCR. The axial strains at the maximum stress (εpeak) of all samples ranged from 1% to 2% (Figure 8). These values, compared in Figure 9b, are generally higher than that cemented with OPC. As shown in Figure 9b, the εpeak of STD samples slightly increased as the binder content increased. Generally, the εpeak of MOD and MBS samples showed no distinct pattern with increasing binder content. This was because the maximum binder content was relatively small and the developed strength was also low. Similar behavior was also observed with the OPC-cemented sand. On the other hand, the εpeak, usually, decreased with an increased binder content as a concrete, cement mortar, and cement paste. These materials have much higher strength and brittle behavior compared to cemented sands.
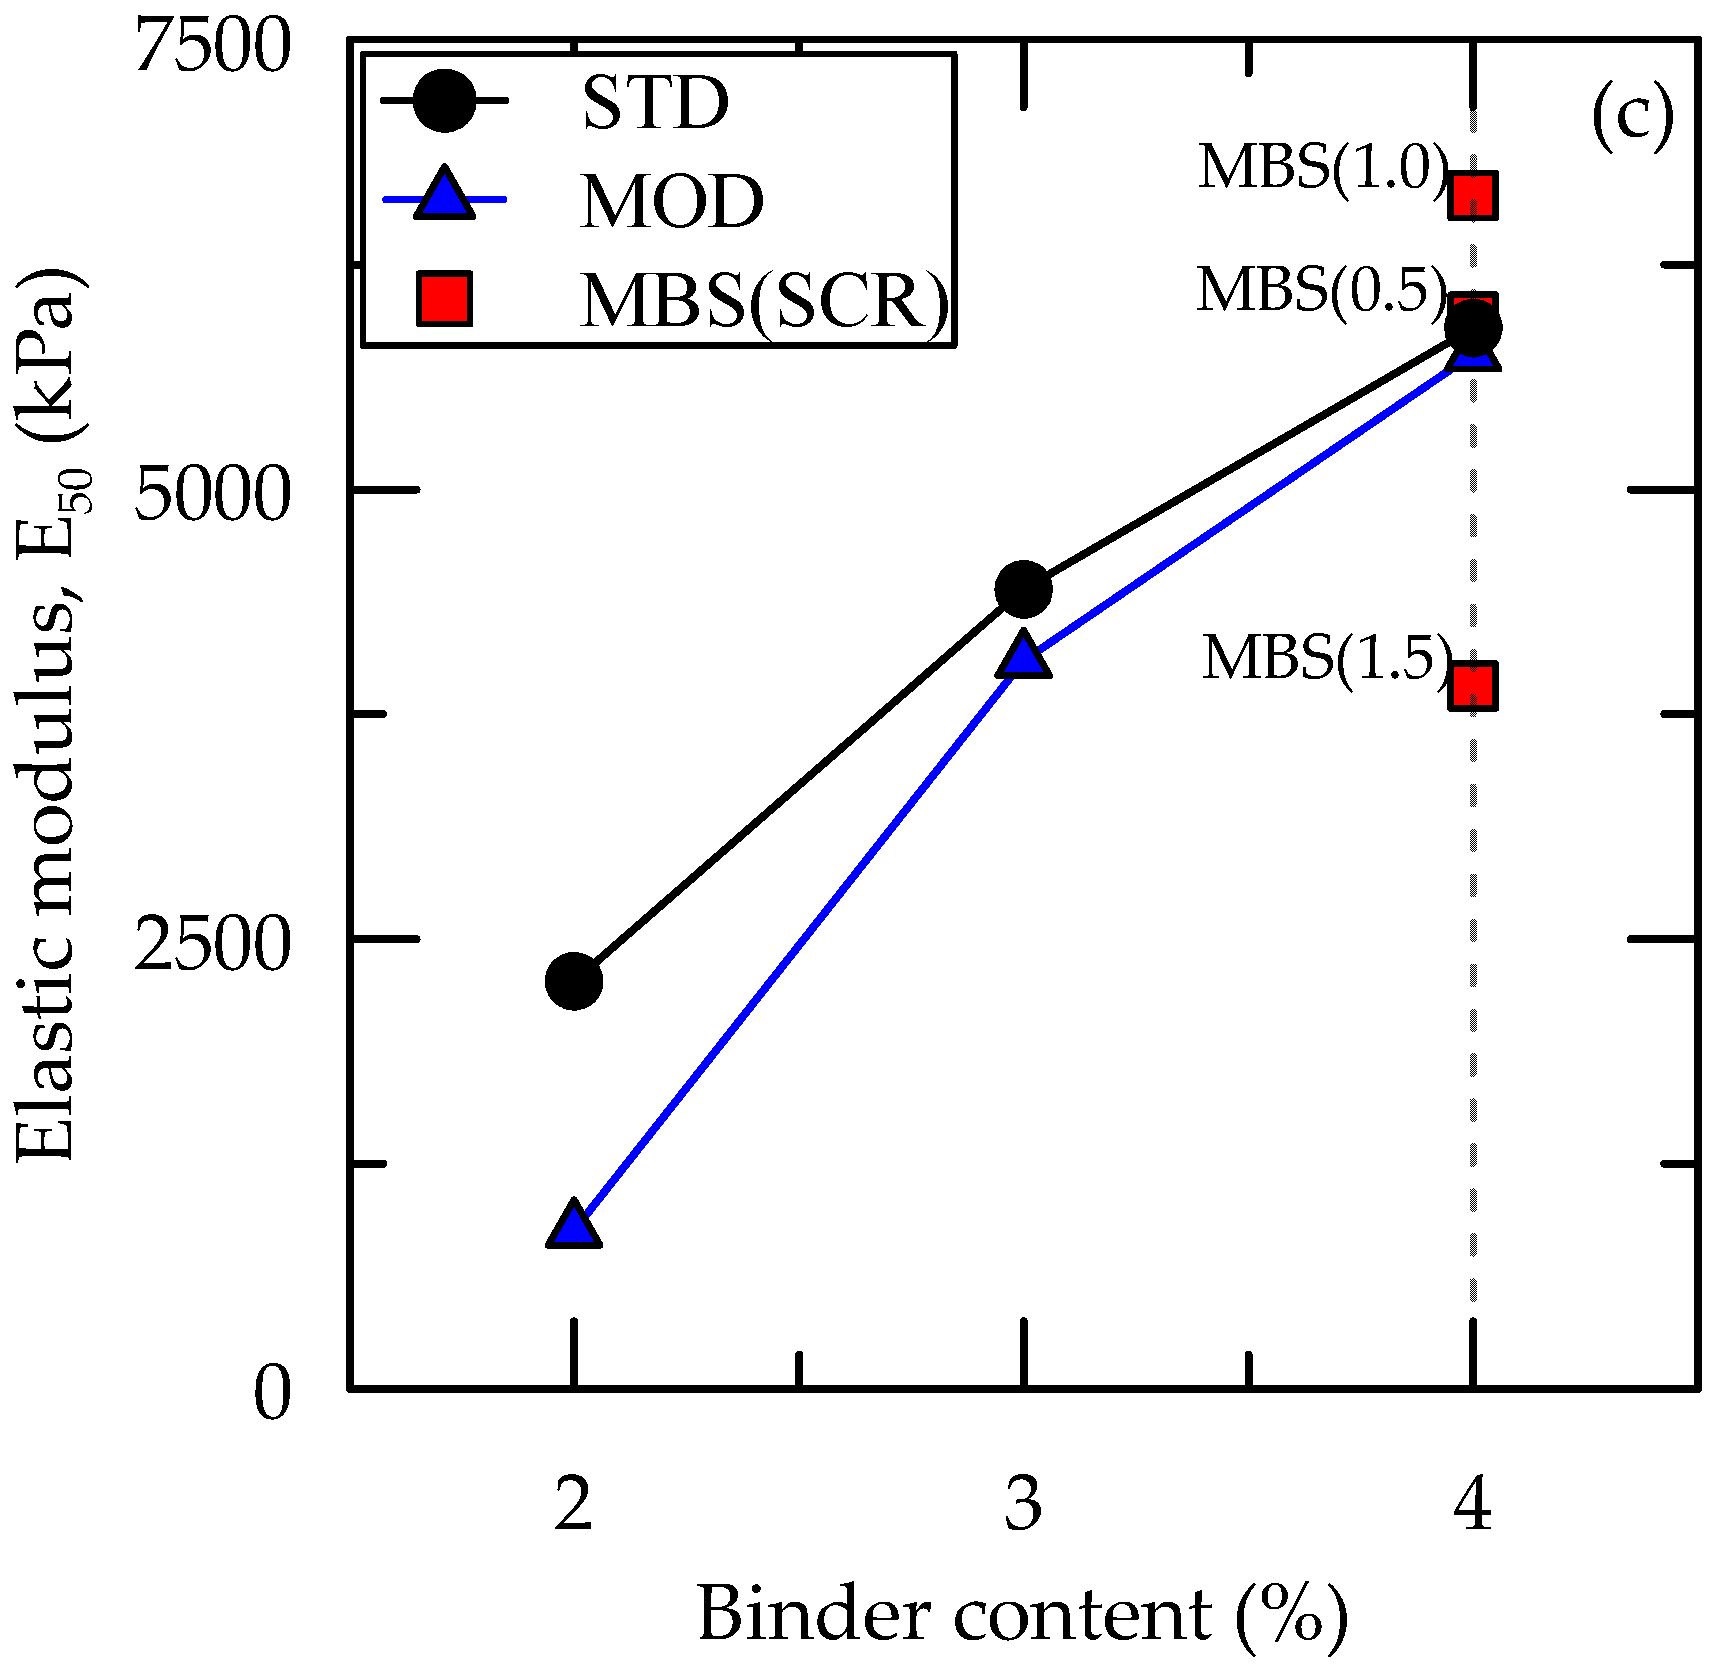
Generally, the elastic modulus (E50) was between 2 and 6 MPa as shown in Figure 9 and compiled in Table 7. The STD, MOD, and MBS samples showed higher E50 to that of OPC. The value increased with the binder content. The maximum UCS was obtained at lower strain, leading to the increased elastic modulus. However, this behavior was not clearly shown in this study, in which the εpeak was an insignificant difference. A similar result was obtained in a previous study as a result of mobilizing the shearing resistance at the interaction between sand particles after breaking of cemented bonds [28]. Therefore, εpeak does not decrease with an increase in UCS and E50, because the friction among the sand particle sustains the shearing resistance, losing the resistance of the cementing bonds.

3.4. Results of Durability Test

3.4.1. Jar Slake Test

Jar slake test was carried out to assess the durability of casein-cemented sand. The results were summarized in Table 8 as Category 1 to 6 (C1–C6). For the STD samples, degradation or separation of particles started after 1 h of soaking. When the soaking time reached 3 h, the particles were completely decomposed and disintegrated (C1). This indicated that the cemented sand with standard casein binder was weak in water. Similarly, the MOD samples were completely disintegrated after 20 h, whereas, the MBS samples withstand the immersion in water for 24 h (C6). Therefore, the MBS binder evinced an excellent hydrophobic characteristic, without any cracks or separation within its structure.

3.4.2. Repeated Soaking Test

Because the MBS samples did not disintegrate during the jar slake test, they were selected for further strength evaluation by repeated soaking in distilled water. The wetting and drying cycle was repeated up to 3 times. The curing conditions of all the samples are summarized in Table 9. The influence of water on the UCS was achieved by comparing the UCS after immersion to that of the air-dried samples. A decrease in UCS of the repeatedly wetted samples was described by Park (2010). Table 10 summarizes the results of the unconfined compression test of the repeatedly soaked samples.
Compared to the sample submerged once, the UCS decreased approximately 4 and 6 times after the 2nd and 3rd immersions, respectively. This weakening behavior is attributed to the progressive weakening of the bond between casein, slag, and sand particles. In Figure 10a through Figure 10d, the SEM micrographs of the air-dried samples and the soaked samples are depicted. As the immersion was repeated, the binder and sand particles were disjointed. Figure 10d illustrates the dissolution of the binder in water as it melted in the solution. Based on the difference in particle behavior at both dry and after repeated immersion, the process of dissolution of the binding materials is described in Figure 10e through Figure 10i. The moisture was absorbed by the connecting binder, causing its expansion and decomposition (Figure 10f). During drying, binder volume gradually decreased as the moisture evaporated (Figure 10g), with no evidence of binder separation. Consequently, the binder begins to dissolve at the third immersion (Figure 10h), resulting in the lowest compressive strength after the third soaking, due to the voids and weak bond between the casein, slag, and sand particles.

4. Conclusions

This study investigated the engineering properties of cemented sands with standard (STD), modified (MOD), modified + BFS (MBS) casein binders. The strength development was analyzed as well as the unconfined compressive strength (UCS) and durability of cemented sand with the binders. The following conclusions were drawn:
  • In the solidity performance test using a PZT sensor, there was a continuous decrease in the peak conductance in all samples as the curing time increased until the 6th day, after which it plateaued. Also, the water content was lower than 1% from the 5th day. The curing period of 7 days was enough to harden the casein-cemented sand.
  • The UCS and elastic modulus increased proportionately with the binder content for all STD, MOD, and MBS samples. The hydrate reaction of the blast furnace slag added in the binder appeared, and the UCS of the MBS sample (9806 kPa) was the highest, 1.35, 1.55, and 22 times higher than those of STD, MOD, and 6% ordinary Portland cement (OPC), respectively. Also, the UCS improved most when the same amount of casein binder and blast furnace slag was used.
  • MBS binder was the most effective in enhancing the hydrophobicity and durability of the cement. The samples with MBS resisted in water even for 24 h without any separation and surface cracks. On the other hand, the STD and MOD samples collapsed in water in 3 and 20 h respectively.
  • Although MBS samples showed great durability compared with other samples, their UCS decreased approximately 4 times, and 6 times whenever it was immersed twice, and 3 times, respectively. The bond between casein, slag, and sand particles becomes weaker with repeated submersion in water.
  • The sands cemented with the casein revealed higher UCS than those of OPC sand when they were cured for seven days. However, their UCS decreased as the time of contact with water increased, and it was lower than the UCS of OPC when it contacted with water over than 24 h. We suggest the use of casein binder where high strength is required for a short time.

Author Contributions

Conceptualization, S.-S.P. and S.-W.W.; methodology, S.-S.P., S.-W.W., and S.-W.J.; software, S.-W.W. and S.-W.J.; validation, S.-S.P., S.-W.W., and S.-W.J.; formal analysis, S.-W.W., S.-S.P., and D.-E.L.; investigation, S.-W.W. and S.-S.P.; resources, S.-S.P. and S.-W.O.; data curation, S.-S.P. and S.-W.W.; writing—original draft preparation, S.-S.P. and S.-W.W.; writing—review and editing, S.-S.P. and S.-W.W.; visualization, S.-W.W. and S.-W.J.; supervision, S.-S.P.; project administration, S.-S.P. and D.-E.L.; funding acquisition, S.-S.P. and D.-E.L. All authors have read and agreed to the published version of the manuscript.

Funding

This work was supported by a National Research Foundation of Korea (NRF) grant funded by the Korean government (MSIT) (No. NRF-2018R1A5A1025137).

Conflicts of Interest

The authors declare no conflict of interest.

Acronyms

SHSodium Hydroxide
CHCalcium Hydroxide
BFSBlast Furnace Slag
STDStandard Casein Binder
MODModified Casein Binder
MBSModified + Blast Furnace Slag Casein Binder
UCSUnconfined Compressive Strength
PZTLead Zirconate Titanate
SEMScanning Electron Microscope
USCSUnified Soil Classification System
CuUniformity Coefficient
CcCoefficient of Gradation
XRFX-Ray Fluorescence
SCRRatio of Blast Furnace Slag to Casein
P.C.Peak Conductance
C.F.Corresponding Frequency
OPCOrdinary Portland Cement
εpeakAxial Strains at the Maximum Stress
E50Elastic modulus
C1-C6Jar slake Test Category

References

  1. Shooshpasha, I.; Shirvani, R.A. Effect of cement stabilization on geotechnical properties of sandy soils. Géoméch. Eng. 2015, 8, 17–31. [Google Scholar] [CrossRef]
  2. Makusa, G.P. Soil Stabilization Methods and Materials; Lulea University of Technology: Lulea, Sweden, 2012. [Google Scholar]
  3. Ramaji, A.E. A review on the soil stabilization using low-cost methods. J. Appl. Sci. Res. 2012, 8, 2193–2196. [Google Scholar]
  4. Chang, I.; Im, J.; Prasidhi, A.K.; Cho, G.-C. Effects of Xanthan gum biopolymer on soil strengthening. Constr. Build. Mater. 2015, 74, 65–72. [Google Scholar] [CrossRef]
  5. Ayeldeen, M.; Negm, A.; el Sawwaf, M.A. Evaluating the physical characteristics of biopolymer/soil mixtures. Arab. J. Geosci. 2016, 9, 371. [Google Scholar] [CrossRef]
  6. Choi, S.-G.; Park, S.-S.; Wu, S.; Chu, J. Methods for Calcium Carbonate Content Measurement of Biocemented Soils. J. Mater. Civ. Eng. 2017, 29, 06017015. [Google Scholar] [CrossRef]
  7. Anagnostopoulos, C.A. Strength properties of an epoxy resin and cement-stabilized silty clay soil. Appl. Clay Sci. 2015, 114, 517–529. [Google Scholar] [CrossRef]
  8. Park, S.-S.; Choi, S.-G.; Nam, I.-H. Effect of Plant-Induced Calcite Precipitation on the Strength of Sand. J. Mater. Civ. Eng. 2014, 26, 06014017. [Google Scholar] [CrossRef]
  9. Chang, I.; Im, J.; Chung, M.-K.; Cho, G.-C. Bovine casein as a new soil strengthening binder from diary wastes. Constr. Build. Mater. 2018, 160, 1–9. [Google Scholar] [CrossRef]
  10. Jenness, R. Comparative aspects of milk proteins. J. Dairy Res. 1979, 46, 197–210. [Google Scholar] [CrossRef]
  11. Vick, C.B. Adhesive bonding of wood materials. Wood Handbook: Wood as an Engineering Material; General Technical Report FPL for Forest Service; Forest Products Laboratory: Madison, WI, USA, 1999; pp. 9.1–9.24. [Google Scholar]
  12. Skeist, I. Handbook of Adhesives, 3rd ed.; Chapman & Hall: New York, NY, USA, 2012. [Google Scholar]
  13. Choi, S.-G.; Park, S.-S.; Wang, K. Early-Age Strength of Alkali-Activated Slag Mortar Based on Burned Oyster Shell and Other Chemical Activators. J. Mater. Civ. Eng. 2019, 31, 04019186. [Google Scholar] [CrossRef]
  14. Song, S.; Sohn, D.; Jennings, H.M.; Mason, T.O. Hydration of alkali-activated ground granulated blast furnace slag. J. Mater. Sci. 2000, 35, 249–257. [Google Scholar] [CrossRef]
  15. Bellmann, F.; Stark, J. Activation of blast furnace slag by a new method. Cem. Concr. Res. 2009, 39, 644–650. [Google Scholar] [CrossRef]
  16. García, J.I.E.; Fuentes, A.F.; Gorokhovsky, A.; Fraire-Luna, P.E.; Mendoza-Suarez, G. Hydration Products and Reactivity of Blast-Furnace Slag Activated by Various Alkalis. J. Am. Ceram. Soc. 2003, 86, 2148–2153. [Google Scholar] [CrossRef]
  17. Allahverdi, A.; Mahinroosta, M. Mechanical activation of chemically activated high phosphorous slag content cement. Powder Technol. 2013, 245, 182–188. [Google Scholar] [CrossRef]
  18. Monshi, A.; Asgarani, M.K. Producing Portland cement from iron and steel slags and limestone. Cem. Concr. Res. 1999, 29, 1373–1377. [Google Scholar] [CrossRef]
  19. Lee, C.J.; Lee, J.C.; Shin, S.W.; Kim, W.J. Setting Characteristic Assessment of Cementitious Materials using Piezoelectric Sensor. J. Korea Inst. Build. Constr. 2016, 16, 389–395. [Google Scholar] [CrossRef] [Green Version]
  20. Park, S.S.; Woo, S.W.; Lee, J.S.; Lee, S.B.; Lee, J.C. Evaluation of Unit Weight and Strength of Sand Using Electro-Mechanical Impedance. J. Korean Geotech. Soc. 2018, 34, 33–42. [Google Scholar] [CrossRef]
  21. Forest products laboratory. Casein Glues Their Manufacture, Preparation, and Application; University of Wisconsin: Madison, WI, USA, 1967. [Google Scholar]
  22. Pizzi, A.; Mittal, K. Handbook of Adhesive Technology, Revised and Expanded; Informa UK Limited: London, UK, 2003. [Google Scholar]
  23. ASTM D2166. In Standard Test Method for Unconfined Compressive Strength of Cohesive Soil; Annual Book of ASTM Standards: West Conshohocken, PA, USA, 2000.
  24. Wood, L.E.; Deo, P. A Suggested System for Classifying Shals Materials for Embankments. Bull. Assoc. Eng. Geol. 1975, 12, 39–54. [Google Scholar]
  25. Santi, P.M. Improving the Jar Slake, Slake Index, and Slake Durability Tests for Shales. Environ. Eng. Geosci. 1998, 4, 385–396. [Google Scholar] [CrossRef]
  26. Landslides: Investigation and Mitigation. Chapter 21-Shales and Other Degradable Materials. Available online: https://trid.trb.org/view/462519 (accessed on 16 July 2020).
  27. Park, S.-S. Unconfined compressive strength, and ductility of fiber-reinforced cemented sand. Constr. Build. Mater. 2011, 25, 1134–1138. [Google Scholar] [CrossRef]
  28. Park, S.S.; Le, T.T.; Nong, Z.Z.; Moon, H.D.; Lee, D.E. Chemically induced calcium carbonate precipitation for improving strength of sand. J. Mater. Civil Eng. 2020. [Google Scholar] [CrossRef]
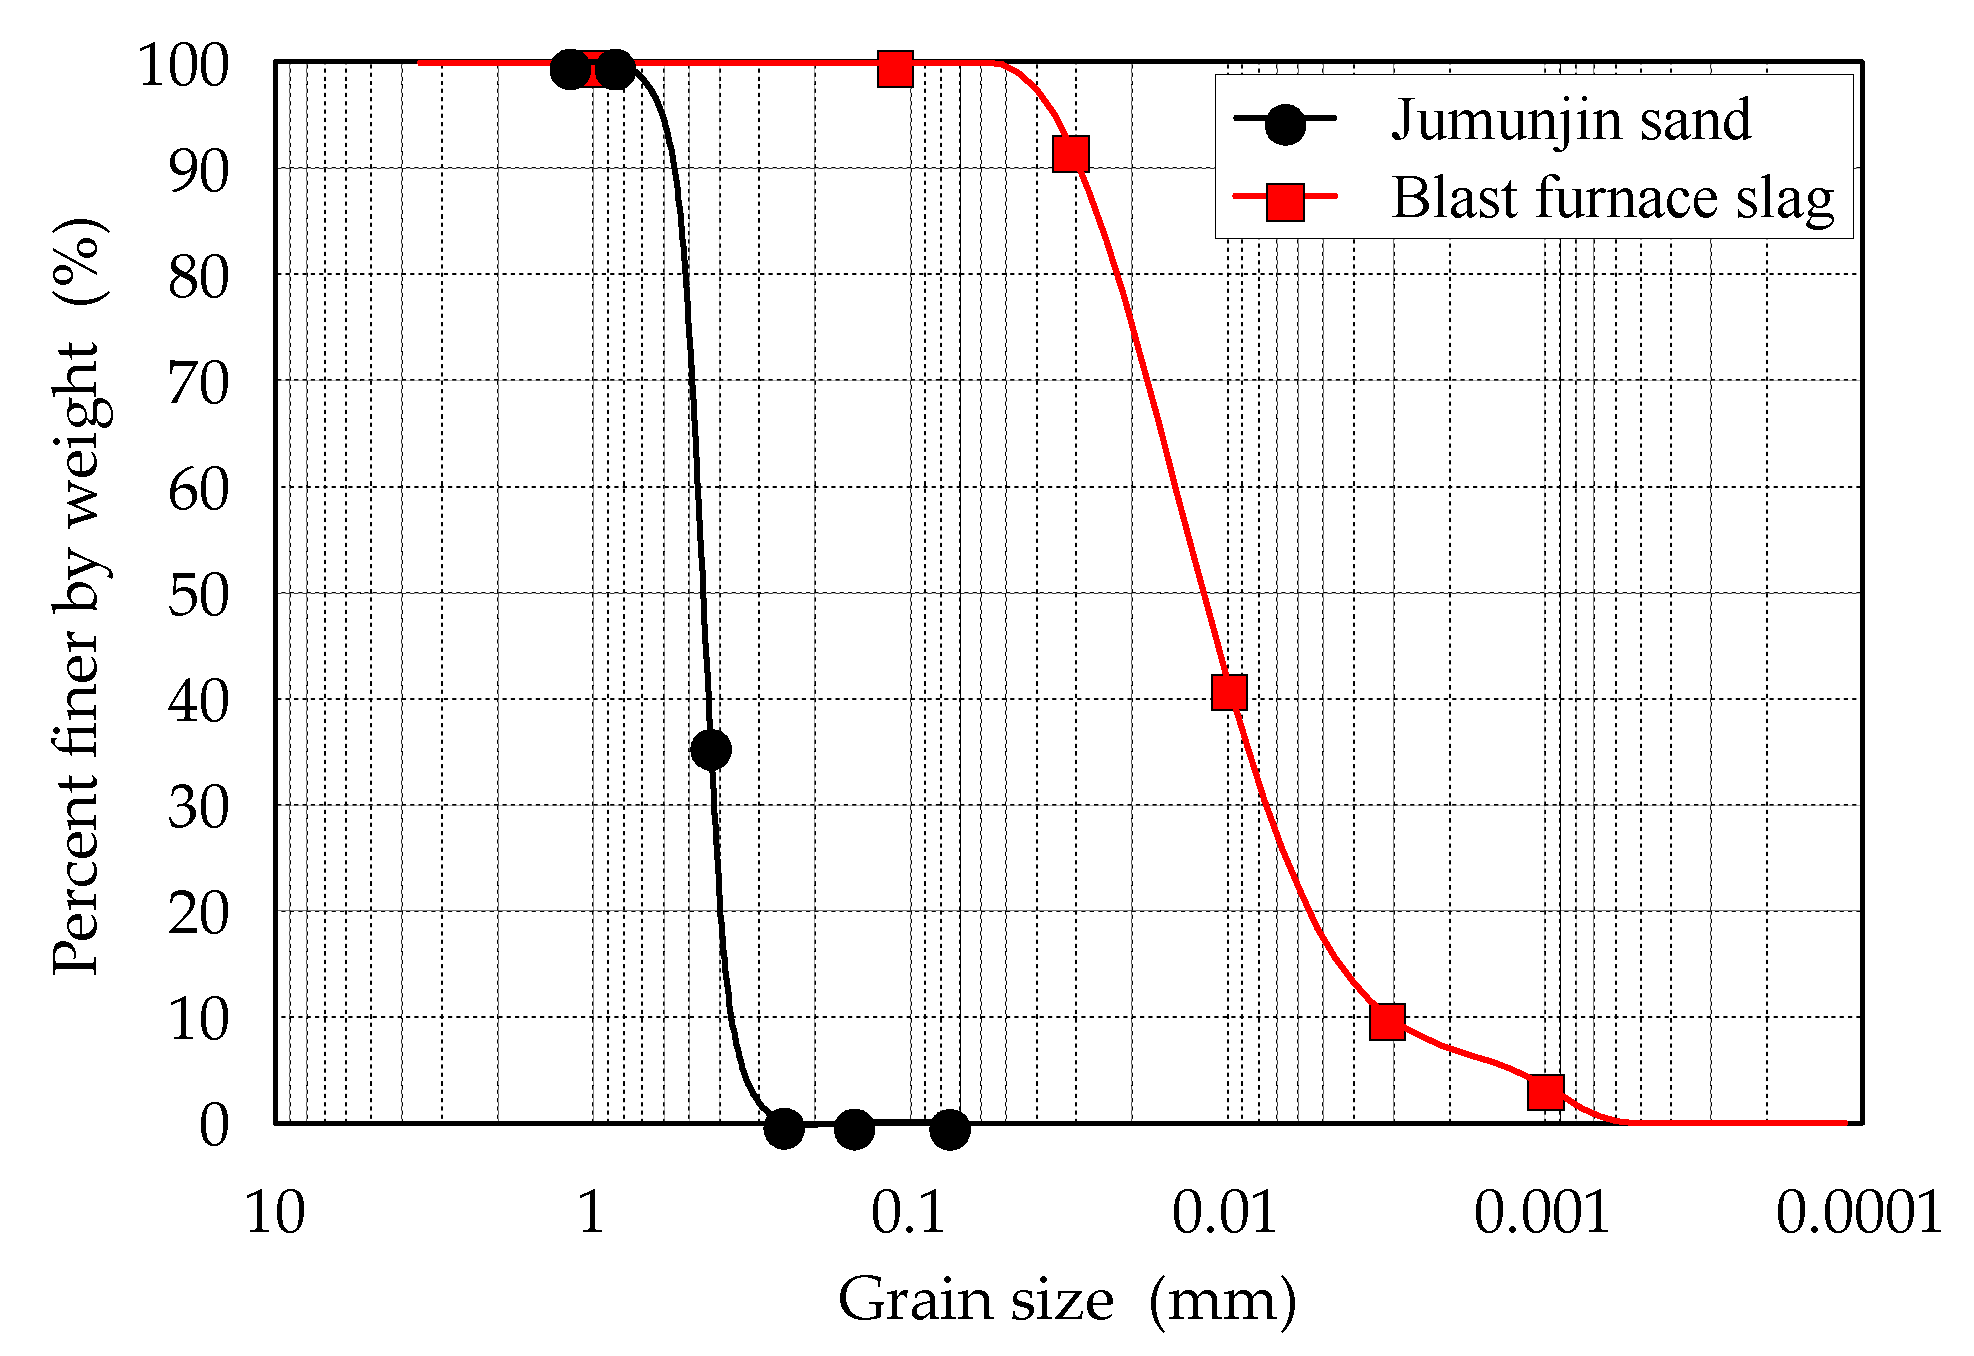
Figure 1. Grain size distribution curves of Jumunjin sand and blast furnace slag (BFS).
Materials 13 03182 g001
Figure 2. Particle shape of the used materials. (a) Particle shape of Jumunjin sand, (b) Particle shape of blast furnace slag.
Materials 13 03182 g002
Figure 3. Images of (a) the lead zirconate titanate (PZT) sensor and (b) the measuring system with the PZT-embedded sample connected to an impedance analyzer.
Materials 13 03182 g003
Figure 4. (a) Sample under unconfined compression and (b) sample failure mode.
Materials 13 03182 g004
Figure 5. Conductance spectral responses from the PZT sensor placed in (a) standard STD, (b) modified (MOD), and (c) modified + BFS (MBS) binder-strengthened sand.
Materials 13 03182 g005
Figure 6. Variations of (a) peak conductance, (b) corresponding frequency, and (c) water content over 7 days.
Materials 13 03182 g006
Figure 7. Results of SEM image analysis (Left: x100, Right: x400). (a) Scanning electron microscope (SEM) images of STD samples, (b) SEM images of MOD samples, (c) SEM images of MBS samples.
Materials 13 03182 g007
Figure 8. Stress-Strain relationship of casein and/or slag cemented (a) STD, (b) MOD, and (c) MBS samples.
Materials 13 03182 g008
Figure 9. (a) The UCS, (b) axial strain at UCS, (c) E50 of the cemented samples.
Materials 13 03182 g009aMaterials 13 03182 g009b
Figure 10. SEM micrographs of repeatedly soaked samples (ad), and the diagrams of particle behavior (ei).
Materials 13 03182 g010
Table 1. Physical properties of Jumunjin sand and BFS.
MaterialD60
(mm)
D30
(mm)
D10
(mm)
Coeff. of Uniformity, CuCoeff. of Gradation, CcUnified Soil Classification System
Jumunjin sand0.500.400.311.611.03Poorly graded sand (SP)
Blast furnace slag0.0150.0070.00351.09-
Table 2. Chemical components of Jumunjin sand.
SiO2Al2O3K2ONa2OFe2O3CaOBaOClL.O.I
Component (%)87.706.614.030.760.250.110.090.070.38
Table 3. Chemical components of BFS.
CaOSiO2Al2O3MgOSO3TiO2K2OFe2O3MnOL.O.I
Component (%)42.6234.3215.293.251.990.730.450.430.400.52
Table 4. Composition of three casein binders.
Binder IngredientStandard Casein
(g)
Modified Casein
(g)
Modified Casein + BFS
(g)
Casein100100100
Distilled water250250250
Calcium hydroxide202626
Sodium hydroxide1155
Blast furnace slag--65.5, 131, 196.5
Table 5. Types of binder and binder content.
IDBinder TypeBinder Content (%)Blast Furnace Slag/Casein
(SCR)
STDStandard2, 3, 40
MODModified2, 3, 40
MBSModified
+ BFS
40.5, 1.0, 1.5
Table 6. Result of the PZT signal measurement.
IDInitial½
Day
1
Day
2
Day
3
Day
4
Day
5
Day
6
Day
7
Day
STDP. C. * (mS)24.8614.6110.119.449.018.486.000.760.53
C. F. ** (kHz)138135146155157162169247248
Water content (%)----8.523.071.080.510.47
MODP. C. (mS)13.5512.7310.267.694.904.002.261.351.28
C. F. (kHz)137136135151168225235249254
Water content (%)----7.522.851.530.7630.65
MBSP. C. (mS)11.199.037.794.353.553.592.261.831.65
C. F. (kHz)139141148192240246252252252
Water content (%)----3.891.320.850.640.34
* P. C.: Peak conductance; ** C. F.: Corresponding frequency.
Table 7. Summary of the unconfined compression test results after 7 days of curing in air.
IDBinder TypeCuring ConditionSCRBinder Content
(%)
Dry Unit Weight, γd (kN/m3)Unconfined
Compressive
Strength (kPa)
Axial Strain at UCS, εpeak (%)Elastic
Modulus, E50 (kPa)
STDStandard7 days in air0215.5134721.452265
315.8457781.494444
415.9272491.515898
MODModified7 days in air0215.499021.02882
315.8136161.384049
415.8963131.265752
MBSModified
+
BFS
7 days in air0.5416.0598062.125959
1 16.1799081.806635
1.5 16.3066001.963906
OPCOrdinary
Portland
cement
7 days in air02-1551.07117
4-2961.11322
6-4441.10436
Table 8. Result of the jar slake test.
IDBinder TypeBinder
Content (%)
SCRJar Slake Category at Soaking Time
3 h6 h9 h12 h15 h18 h21 h24 h
STDStandard4-C1C1C1C1C1C1C1C1
MODModified4-C6C6C4C3C3C3C1C1
MBSModified + BFS41.0C6C6C6C6C6C6C6C6
Table 9. The curing condition of the repeated soaking test.
Binder TypeCase1 Day2 Day3 Day4 Day5 Day6 Day7 Day
Modified
+
BFS
Wet-1MoldWaterUCS test
Wet-2MoldWaterAirWaterUCS test
Wet-3MoldWaterAirWaterAirWaterUCS test
Table 10. Results of unconfined compression test of the repeatedly soaked samples.
IDBinder TypeSCRBinder Content
(%)
CaseUnconfined
Compressive
Strength (kPa)
Axial Strain at UCS, εpeak (%)Elastic
Modulus, E50 (kPa)
MBSModified
+
BFS
1.04Wet-14362.99229
Wet-21204.0639
Wet-3683.5124