Article

Theoretical and Experimental Studies on Thermal Properties of Polyester Nonwoven Fibrous Material

1
Institute for Nanomaterials, Advanced Technologies and Innovation, Technical University of Liberec, 461 17 Liberec, Czech Republic
2
Department of Material Engineering, Faculty of Textile Engineering, Technical University of Liberec, 46117 Liberec, Czech Republic
3
Department of Advanced Fibro-Science, Kyoto Institute of Technology, Matsugasaki, Sakyo-ku, Kyoto 606-8585, Japan
*
Author to whom correspondence should be addressed.
Materials 2020, 13(12), 2882; https://doi.org/10.3390/ma13122882
Submission received: 28 May 2020 / Revised: 15 June 2020 / Accepted: 22 June 2020 / Published: 26 June 2020

Abstract

:
Polyester nonwoven fibrous material is widely used in construction and automobile industries for thermal insulation purposes. It is worthy and meaningful to understand the effect of structural parameters on the thermal property. Fiber orientation, as one of the most vital parameters, has a significant effect on thermal property. However, there has been little quantitative analysis focusing on this aspect. This paper theoretically and experimentally analyzes the thermal conductivity of samples with varying fiber orientation. Existing models were selected to predict the thermal conductivity of polyester nonwoven samples. Two different apparatus were applied to carry out the experimental measurements. The relative differences between the predicted and measured results were compared. One commonly used model was modified for accurate prediction. It was shown that some existing models under- or overestimate the thermal conductivity compared to the measured values. The results indicate that the modified model can accurately predict the thermal conductivity of polyester nonwoven materials within a 0.2% relative difference.

1. Introduction

Recently, nonwoven fibrous materials have been extensively used in construction and automobile industries due to their high porosity, economical price, lightweight, a large thickness range, good sound absorption, etc. The most common application of nonwoven materials in industries is as a dual insulator (thermal and sound) in buildings [1,2,3]. The thermal property of nonwoven fibrous material has attracted considerable attention. The application in thermal insulation of some bast-fibrous materials such as flax and hemp have been verified due to their suitable insulation properties [4]. However, bast-fibrous materials have a risk for microbial and other contaminants, and their quality should be monitored regularly because of the aging effect. The thermal properties of recycled waste clothing textiles for building application have been reported [5]. The inverse method was adopted to study the thermal properties of a fibrous insulator due to the arbitrary distribution of fiber size in waste clothing textiles. Cerkez et al. [6] presented the thermal insulation property of a multi-component air-laid nonwoven and stated that an increase in the amount of glass fiber resulted in lower thermal insulation. A novel approach used to apply silica aerogel into nonwoven fibrous materials for thermal insulation purpose has also been reported [7]. It was found that an aerogel encapsulated nonwoven composite has a remarkable rise on thermal resistance compared to the sample without aerogel.
Aside from the influence of material on the thermal properties of a nonwoven fibrous material, the effect of producing technology and structural characteristics needs to be considered. Thickness and porosity have been confirmed as the most important factors to determine the thermal properties of nonwoven fibrous materials [8]. The thermal insulation property of perpendicular-laid and cross-laid high-loft nonwoven materials has been studied [9]. According to the thermal conductivity results, cross-laid nonwoven has better thermal insulation than perpendicular-laid nonwoven. It was also found that the thermal conductivity decreased when the density increased in these two high-loft nonwoven structures. In addition, nonwoven fibrous materials made from coarse fibers have higher thermal resistance when the compression load is applied.
A number of studies have reported on the effect of material type, structural parameter, and manufacturing technology on the thermal property of nonwoven fibrous materials. However, one important factor that researchers have not treated in much detail is fiber orientation. It has been reported that fiber orientation has a significant influence on thermal properties [10,11,12]. If the fibrous materials have the same fiber components, fiber orientation should be primarily considered. Some existing models can be used to estimate the thermal conductivity of nonwoven material when fibers are randomly, perpendicularly, and parallelly orientated to the direction of heat flow [13]. However, these models do not involve the accurate effect of fiber orientation.
The main objective of this paper was to study the thermal properties of a polyester nonwoven fibrous material, especially for materials with different through-plane fiber orientations. The rest of this paper is organized as follows. Thermal conductivity models for fibrous material are recalled in Section 2. Section 3 outlines the materials, methods of theoretical study, and experimental study. The results from the theoretical and experimental studies are presented and analyzed, along with modifications on an existing model in Section 4, followed by a brief conclusion.

2. Review of Thermal Conductivity Models

Theoretically, thermal conduction always occurs if a temperature gradient exists between a material system and the environment or inside a material system [14]. It is considered that no natural convection occurs in fibrous material with a density larger than 20 kg/m3 because the fibers subdivide the gas into sufficiently small pores [15,16]. Additionally, it has been stated that the convection can be eradicated due to the significant friction that is caused by constituent fibers against natural convection [17]. Sun and Pan [14] stated that heat transfer via radiation can be ignored when the temperature gradient is small. The heat transfer through radiation will be considered when the temperature is higher than 500 K [18]. Furthermore, it has been stated that heat transfer modes are generally dependent on the ambient temperature and fibrous material porosity [19]. Thus, thermal conduction is the dominant mechanism in most situations when heat is transferred through a nonwoven fibrous material.
Most of the models used to analyze the heat transfer behavior of fibrous materials have been developed based on electrical network analysis, which is called thermal-electrical analogy [20,21]. Some models based on thermal-electrical analogy will be introduced, and several semiempirical models are included in this section.

2.1. Semi-Empirical Models

Semi-empirical models are proposed for the quick assessment of the thermal conductivity of fibrous materials. Schuhmeister [22] presented an empirical equation to simply calculate the thermal conductivity of a homogeneous and isotropic nonwoven material in 1877. Baxter [23] modified Schuhmeister’s Equation to estimate the conductivity of a wool fibrous material. A semi-empirical model that applied an empirical coefficient for a different type of fiber was developed by Verschoor and Greebler [24]. Some semi-empirical models for thermal conductivity estimation are summarized in Table 1.

2.2. Models Based on Thermal-Electrical Analogy

Electronic components are connected in parallel or series arrangement in an electrical network. Similarly, fibers in a fibrous material are assumed to be perpendicularly (serially), parallelly, or randomly distributed in the direction of heat flow [26]. The sketches of fibers orientated parallel and perpendicular to the direction of heat flow are shown in Figure 1. In parallel arrangement ((b) in Figure 1), the relatively high conductivity of the fibers contributes their maximum effect on the overall conductivity of the fibrous material. In contrast, the fibers contribute a minimum effect to the overall thermal conductivity of the fibrous material because of the air layer between each fiber element in a perpendicular arrangement.
Bogaty et al. [27] proposed models for fibrous material with different fiber arrangements. Bhattacharyya [16] presented two models to predict the thermal conductivity of samples with fibers perpendicularly and randomly to the heat flow based on Fricke’s [21] method for electrical conductivity. Some models used to simply calculate the thermal property of fibrous material with parallel, perpendicular, and random fiber orientations are summarized in Table 2.
These models have been adopted to predict the thermal properties of woven, knitted, and nonwoven fibrous materials [27,28,29]. Militký et al. [28] accurately predicted the thermal resistivity of wool/polyester plain woven fabric by computing the average value of models 5 and 6 in Table 2. Bogaty [27] obtained the relative specific thermal conductivity of wool, cotton, nylon, and orlon fibrous materials by using the calculated values of the effective fraction of fibers orientated parallel and perpendicular to the heat flow via model 8. Nevertheless, these models provide a rough estimation of the thermal resistivity of fibrous material. It has been proven that fiber orientation has a significant influence on thermal conductivity [10,30]. Thus, a more precise prediction that takes into account the specific fiber orientation angle should be considered. The mechanistic assumption that the thermal conductivity in fiber oriented to an arbitrary angle from the heat flow direction is simply the sum of the contributions of conductivities in the fiber axis direction and radial direction used. This assumption is supported by the Debye equation for the prediction of the thermal conductivity [31].
The fiber orientation in nonwoven fibrous materials refers to the fiber orientation angle, as shown in Figure 2. Angles θ and δ represent the through-plane and in-plane orientation angles, respectively. When θ is zero, the fibers are parallel to the direction of heat flow. If θ is 90°, the fibers are perpendicular to the direction of heat flow. Fibers in the through-plane orientation have a significant effect on thermal properties while the in-plane orientation has less effect [30]. Thus, the angle θ is a critical value in the demonstrated situation where the direction of heat flow is parallel to the Z-axis.
One series of model that can be used to predict the thermal conductivity of fibrous material with varying fiber orientation based on Bhattacharyya’s [16] research was developed by Stark and Fricke [15] in 1993. They stated that it is necessary to pay attention to the effect of contact between fibers on conductivity. The basic model of thermal conductivity of fibrous material based on Bhattacharyya’s assumptions is represented as:
k B M = k f [ 1 + v f v a 1 1 + k a k f ( 1 + Z ( v f v a 1 ) / ( v f v a + 1 ) ) ]
The term Z is the fraction of fiber orientation to the macroscopic heat flow (Z = 1 when fibers are aligned perpendicular to the heat flux, Z = 0.66 when randomly arranged, and Z = 0.83 when arranged parallel to the heat flux). One critical orientation angle, ψ = cos 1 2 / 3     48.19 ° , was suggested in Stark and Fricke’s work [15]. Fibers with an orientation θ < ψ are considered parallel to the direction of heat flow, and fibers with θ > ψ are perpendicular. The final Stark-Fricke model is represented as:
k = ( i + 1 ) [ i k B M + j + 1 j 1 k a + 4 k f C d j π a c t ] 1
where a c t is the contact radius, and the i and j given as a function of the fiber orientation, are
i = 1 2 s cos θ 1
j = s 2 / 3 ( 0.5 sin θ ) 1 / 3 π ( 1.5 ( 1 μ 0 2 ) p e x t / E ) 2 / 3 1
where s, the geometrical parameter, is
s = ( π ρ f / ρ 0.5 s i n 2 θ cos θ ) 1 / 2
where C is the connection parameter with a suggested value of 0.611; d is the fiber diameter; a c t is the contact radius; μ 0 is the Poisson’s number of the fibrous material; p e x t is the external pressure; E is the Young’s modulus; ρ f is the bulk density of fiber; and ρ is the bulk density of fibrous material.

3. Materials and Methods

3.1. Materials

The polyester nonwoven fibrous material was made of 45 wt.% staple polyester, 30 wt.% hollow polyester, and 25 wt.% bi-component polyester. Low-melting polyester fiber consists of the sheath part of a bi-component fiber, which is used to thermally bond the nonwoven structure. The preparation procedure of polyester nonwoven samples was reported in our previous work [32]. The longitudinal images of three types of polyester fibers are shown in Figure 3. The longitudinal images were captured at the Technical University of Liberec using the JENAPOL microscope (Jena, Germany) and NIS-elements software (AR 4.30.02 64-bit). Later, fifty fibers were measured for each type of fiber to ensure an accurate value. The mean diameters of the staple, hollow, and bi-component fibers were 13.19 ± 0.57, 24.45 ± 2.56, and 17.94 ± 0.82 µm, respectively.
The polyester nonwoven samples and their cross-sectional macroscopic images are illustrated in Figure 4. It can be seen that the decrease in thickness resulted in an increase in the fiber orientation angle. One tomography image of sample TK7 is presented in Figure 5. The x-ray micro computerized tomography was performed at the Technical University of Liberec, Czech Republic on a Bruker SKYSCAN 1272 (Billerica, MA, USA). Software CTVOX 3.3 was used to reconstruct the tomography image.
The characterization of polyester nonwoven fibrous samples has been reported in our previous work, as listed in Table 3 [32]. From Figure 5, it can be seen that the fibers were orientated in the same direction and had a similar orientation angle. Thus, it was assumed that the fibers were generally orientated to the same direction with the same orientation angle. The mean fiber orientation angle was estimated via ImageJ software (version 1.51). The mean fiber diameter of the polyester fibers was calculated by the length-weighted average method, as defined in Equation (6).
d = d i l i i = 1 3 l i
where d i is the i-th fiber type diameter obtained from the average value of 50 fibers, and l i is the corresponding total fiber length in a unit volume of nonwoven fibrous material:
l i = W i π ( d i / 2 ) 2 ρ i
where W i is the i-th fiber type total weight in a unit volume of nonwoven fibrous material and ρ i is the corresponding fiber density.

3.2. Theoretical Study

The thermal conductivity of fibers is a critical parameter in the listed models. It is obliged to figure out the value of polyester fibers to carry out the theoretical study. However, it is complicated and difficult to measure single fiber thermal properties, so referring to values from the literature is a reasonable approach. Baxter [23] estimated the thermal conductivity of polyester fiber in 1946 by measuring the thermal conductivity of pads of packed fibers with the same density. Kawabata [33] developed a specific apparatus to measure the thermal properties of 14 types of fibers in the longitudinal and transverse directions [34]. Militký et. al. [26] proposed the thermal conductivity of a typical polyester fiber with 40% crystallinity. Some values of the thermal conductivity of polyester fibers are listed in Table 4.
The procedure for the theoretical study on thermal conductivity is illustrated in Figure 6. The fiber unity was defined as the entire solid phase (fibers) in the nonwoven fibrous material in the current study. Fiber thermal conductivities were used to estimate the values of three fiber constituents in the nonwoven samples. The conductivity of fiber unity was obtained via Botagy’s model for parallel arranged fibrous materials. Then, the thermal conductivity of the nonwoven samples was obtained by using the Schuhmeister, Bogaty, Bhattacharyya, and Stark-Fricke models.
Thermal conductivity of the hollow fiber should be evaluated since there was a 30 wt. % hollow fiber component in the samples. Heat transfer through the hollow fiber in the longitudinal direction is illustrated in Figure 7. The gas phase and solid phase were parallel arranged when heat transfer occurred in the longitudinal direction. The thermal conductivity under this situation can be simply estimated via model 5, as shown in Equations (8) and (9):
k h f = v 1 v t k 1 + v 2 v t k 2
where v 1 , v 2 , and v t are volumes of the gas phase (air), the solid phase, and the hollow fiber, respectively. It was assumed that the hollow continued in the hollow fiber. Then, the thermal conductivities of the hollow fiber can be represented as:
k h f = ( r 1 r t ) 2 k 1 + ( 1 ( r 1 r t ) 2 ) k 2
where r 1 and r t are the radius of the gas phase (air) and the hollow fiber, respectively; and r 2 is the thickness of the solid-phase wall in hollow fiber. The ratio between r 1 and r t was calculated based on the measured values via ImageJ software on the cross-sectional images of the hollow fiber (see in Figure 7). The ratio ( r 1 / r t ) was 0.433 with a standard deviation of 0.0345 by measuring 50 fibers.
The thermal conductivity of the fiber unity in the nonwoven fibrous materials was estimated from the thermal conductivities of the three fiber constituents by using a series arrangement model based on fiber volume fractions of each constituent when the solid and gas phases were in a parallel arrangement [35]. Then, the thermal conductivity of the fiber unity can be obtained as:
k = v s f k s f + v h f k h f + v b f k b f
where v s f , v h f , and v b f are the volume fractions of staple, hollow, and bi-component polyester fiber, respectively, and k s f , k h f , and k b f are the thermal conductivities of staple, hollow, and bi-component polyester fibers, respectively. The thermal conductivity of the bi-component polyester fiber was assumed to be the same as the staple polyester fiber. In another situation where the two phases are perpendicularly arranged, the thermal conductivity of the fiber unity can be estimated by:
k = ( v s f k s f + v h f k h f + v b f k b f ) 1
The thermal conductivities of the three fiber constituents and fiber unity are listed in Table 5. Some of the models require the fractions of fibers that are parallel or perpendicular to the heat flow direction. The values of fractions can be easily calculated via the trigonometric function (see Equations (12) and (13). The volume fractions of air and fiber and the fractions of fiber orientation are listed in Table 6. Next, the final results of nonwoven samples are calculated via the methods demonstrated in Figure 6.
x = 1 tan θ + 1
y = tan θ tan θ + 1

3.3. Experimental Study

Two different measurement methods were utilized to test the thermal conductivities of nonwoven fibrous samples. First, the samples were tested on an Alambeta device (SENSORA, Liberec, Czech Republic) at the Technical University of Liberec, Czech Republic. The measuring head of the Alambeta contains a copper block that is electrically heated to approximately 32 °C to simulate the temperature of human skin. The lower part of the heated block is equipped with a direct heat flow sensor that measures the thermal drop between the surfaces of a very thin, non-metallic plate using a multiple differential micro-thermocouple [36,37].
Furthermore, a new custom-built apparatus was used to measure the thermal conductivities at the Kyoto Institute of Technology [38]. The theory and procedure of thermal conductivity determination were adopted from the previous study (see [38]). As illustrated in Figure 8, the apparatus was composed of a hot plate (JUJI Field Inc. LABOPAD H, Tokyo, Japan), wind tunnel, a blower (SANYO DENKI Co. Ltd., 9SG 5724P5H61, Tokyo, Japan), a hot-wire anemometer (HARIO SCIENCE Co. Ltd., WGT-10, Tokyo, Japan), and a digital radiation temperature sensor (KEYENCE Corp. FT-H10, Osaka, Japan). Constant airflow was supplied to the wind tunnel by a blower, a specimen was placed on the heating portion of the hot plate, and the surface temperature of the specimen was measured by detecting the quantity of the infrared ray by using a digital radiation temperature sensor. Moreover, the temperature of the hot plate was set at 30, 50, and 70 °C, and the emissivity set for using the digital radiation sensor was unified to 1.0.

4. Results and Discussion

In this section, the predicted thermal conductivities of nonwoven fibrous materials were first compared and analyzed. Then, the comparison between two different test methods was carried out. The validation of the models based on the measured values will be studied at the end, followed by one modified model.

4.1. Predictions of Thermal Conductivity of Nonwoven Samples

All of the modeling computations were processed in MATLAB_R2018b and the results are listed in Table 7. According to the four different values of fiber thermal conductivities, the values of nonwoven samples were listed in two groups. It can be seen that all of the predicted conductivities were less than 0.2 W m−1 K−1.
The predicted thermal conductivities are shown in Figure 9. It is obvious that the results from Stark and Fricke exhibited much higher thermal conductivities when compared to other models. Meanwhile, results based on the Stark-Fricke model had a clear trend, which first slightly decreased, then reached the highest value, followed by a decrease. Results among the seven nonwoven samples based on the Schuhmeister and Bhattacharyya models had very small differences. When the fiber thermal conductivity was higher (i.e., 0.272 W m−1 K−1), the results based on the Bogaty model exhibited a clear increase. Generally, the increase in fiber thermal conductivity resulted in an increase in the thermal conductivity of the fibrous material. This can be confirmed in Figure 9. However, the increases in some predicted values (i.e., Schuhmeister and Bhattacharyya models) of nonwoven samples were relatively small, although the fiber thermal conductivity was nearly doubled. The reason behind this phenomenon can be the low fiber volume fraction (i.e., <0.06) when compared to the air volume fraction. Additionally, it is not easy to observe the effect of fiber orientation fractions on predicted thermal conductivity from Figure 9. Therefore, the effect of fiber volume fraction and fiber orientation fraction on thermal conductivity will be analyzed.
The Bogaty model was selected since it involved both the fiber volume fraction and fiber orientation fraction and is widely used for theoretical study in literature. The influences of fiber volume and orientation fractions on the predicted thermal conductivity is shown in Figure 10. Thermal conductivities of conventional textile fibers are usually 5–20 times to the value of steady dry air [29]. The thermal conductivities of fibers with the values of 10 times and 20 times to air were adopted. The x-axis and fiber parallel orientation fraction represent the percentage of fibers parallel to the direction of heat flow. The fiber parallel orientation fraction ranged from 0 to 1, which shows that when the value is close to 1, the fibers are parallel to heat flux. In contrast, when it is low, the fibers are toward perpendicular to the direction of heat flow. It can be observed that the effect of fiber orientation on thermal conductivity was trivial when the fiber volume fraction was lower than 0.4. For fibers with higher thermal conductivity, fiber orientation had less influence when the fiber volume fraction was lower than 0.7. Meanwhile, the effect of fiber thermal conductivity on the fibrous material with a low fiber volume fraction was insignificant. For the nonwoven material with fiber thermal conductivity 10 times to air, the fiber orientation fraction exhibited significant influence when fiber volume fraction was around 0.7–0.9. Thus, it can be concluded that fiber volume fraction in the Bogaty model plays a more important role on the thermal conductivity of nonwoven samples compared to the fiber orientation. As shown in Table 3, the nonwoven samples had low fiber volume fractions with values from 0.0165 to 0.0533. Thus, it can explain why some models exhibited similar results although the fiber thermal conductivity increased to nearly 200%.

4.2. Measured Thermal Conductivity of Nonwoven Samples

Measurements of the thermal conductivity of nonwoven samples were carried out on an Alambeta device and a custom-built device. The results of the thermal conductivities and their standard deviations are listed in Table 8. The Alambeta can rapidly test the thermal properties of fibrous materials by simulating the temperature of human skin [37]. However, since the upper and lower heat flow sensors are open and free during test, free convection and heat dissipation could occur at the edge of the specimen, especially for thick samples. The custom-built device was well designed. Based on the evaluation theory and procedure of the custom-built device [38], it only needed to measure the temperature of the specimen surface at three different given temperatures (30°, 50°, and 70°). Then, the least-squares method was used to obtain the thermal conductivity of the measured sample.
In order to compare these two measurement methods a formula, Equation (14), was applied to calculate the relative difference. The comparison and relative difference are shown in Figure 11. It can be found that as density increased, the results from the Alambeta slightly decreased, while the results from the custom-built device did not show a clear trend. Furthermore, the results from the Alambeta device exhibited relatively low standard deviation. Theoretically, the increase in density results in an increase in the fiber volume fraction, then the path of heat flow involves more fibers. Consequently, the thermal conductivity of fibrous materials will increase. Nevertheless, the measured thermal conductivities of nonwoven samples exhibited a contradictory or different phenomenon. This is due to the different fiber orientation among the nonwoven samples, as shown in Figure 4 and Figure 5. It has been stated that the fiber in the through-plane orientation has a critical effect on the thermal conductivity of fibrous material.
Δ = k A l a m k C u s t k A l a m   100 %
where Δ is the relative difference and k A l a m and k C u s t are the results measured by Alambeta and the custom-built device, respectively.
In a comparison with the custom-built device, the Alambeta device showed higher results on samples with lower density (i.e., < 30 kg/m3), while the results were lower when the sample density was higher. The relative difference ranged from −18.50% to 15.92%. The biggest difference occurred for sample TK7 with a value of −18.5%. The most similar result was from sample TK4 with a 2.50% relative difference. Due to the uncertainties during measurement on the custom-build device, the effect of a different testing environment and operation procedure, a relative difference less than ± 20% was considered reasonable.

4.3. Validation of Thermal Conductivity Models

Measured results from the Alambeta were selected to validate the thermal conductivity models. Since the Schuhmeister model is considered one empirical version of the Bogaty model and the Bhattacharyya model does not include the fiber orientation fraction, the results based on the Bogaty and Stark-Fricke models will be further compared with the measured values. The comparison between the predicted and measured thermal conductivities are shown in Figure 12. When the fiber thermal conductivity increased, the results based on the Stark-Fricke models exhibited a significant increase in samples TK4, TK5, TK6, and TK7. It can be seen that two models proposed by Stark et. al. overestimated the thermal conductivities of the nonwoven samples. The Stark-Fricke model exhibited the closest results to the measured values when the fiber thermal conductivity was 0.140 W m−1 K−1, while the Bogaty model showed the most similar results when the fiber thermal conductivity was 0.272 W m−1 K−1. An upsurge occurred in the predicted values based on the Stark-Fricke models. This can be explained by the fraction of fiber orientation, Z, changing from 0.83 to 1 in the Stark–Fricke models. By comparing all of the results, it is hard to conclude which model is the most suitable for polyester nonwoven fibrous materials.

4.4. Modification on Stark-Fricke Basic Model

As stated above, fiber thermal conductivity has an insignificant effect on the prediction of the Bogaty model when the fiber volume fraction is low (i.e., < 0.10), while it has a critical effect on the prediction based on the Stark-Fricke models. Thus, it is more reasonable to modify Stark-Fricke models for fibrous materials with different through-plane orientation and low fiber volume fraction. However, it is first necessary to confirm the fiber thermal conductivity. However, only one method was proposed by Kawabata to directly measure the fiber thermal conductivity [33,34]. Kawabata specifically measured thermal conductivities in both longitude and transverse directions. When heat flow transfers in fibrous material, it can transfer in varying directions instead of only in the longitude and transverse directions. Thus, the value of 0.140 W m−1 K−1 obtained by the estimation method was adopted for model modification [23]. Since the prediction process of the Stark-Fricke model is more complicated, only the Stark-Fricke BM (basic model) was modified. Moreover, Stark et. al. did not precisely describe the method to obtain fiber orientation factor (Z). The modification of the Stark-Fricke basic model was carried out via optimization on Z. The parameter inversion process was applied to optimize the fiber orientation factor. Assuming that the fiber and air thermal conductivities and their volume fractions are known, and Z is the independent variable, the thermal conductivity based on the Stark-Fricke basic model can be represented as k ( Z ) . Consequently, the Z can be inverted by finding the minimum of the following equation:
f ( Z ) = | k ( Z ) k m e a s | m i n
where k m e a s is the measured thermal conductivity. In this work, the minimization problem was solved via a Nelder–Mead optimization method [39]. The original and optimized Z are listed in Table 9.
It is necessary to figure out the relation between fiber orientation angle ( θ ) and factor (Z). Two-degree polynomial fitting was applied to find this relation. The determination coefficient was 0.966, which means that sin θ and Z are strongly related based on the two-degree polynomial in Figure 13 Then, the fiber orientation factor Z can be represented as:
Z = 0.656   s i n 2 θ + 0.403   s i n   θ + 0.697
In order to verify the modified Stark-Fricke basic model, the relative difference in the thermal conductivity of nonwoven samples was compared in Figure 14. The relative differences were computed as:
Δ = | k p r e d k A l a m | k A l a m   100 %
where k p r e d is the predicted thermal conductivity.
The Bogaty model exhibited a relatively low difference with a value less than 60%. The modified Stark-Fricke model presented a reasonable relative difference with a value ranging from 2% to 13.30%. Compared to the original Stark-Fricke basic model, the modified model showed a significant improvement in prediction accuracy. The maximum difference of the original Stark-Fricke basic model was nearly 140%, while the maximum value of the modified model was around 0.1%. For all of the samples, the relative differences of the modified Stark-Fricke basic model were 0.08%, 0, 0, 0.05%, 0.09%, 0.10%, and 0.05%, respectively. Thus, it can be concluded that the modified model can accurately predict the thermal conductivity of high-loft polyester nonwoven materials with different through-plane fiber orientation.

5. Conclusions

Estimations on the fiber unity of polyester in nonwoven fibrous materials were carried out based on referred fiber thermal conductivities. Several models such as the Schuhmeister, Bogaty, and Stark-Fricke models were selected to theoretically study the thermal conductivity of nonwoven samples with different fiber through-plane orientations and fiber volume fractions. The experimental investigations were completed on an Alambeta device and a custom-built device. Results of the theoretical and experimental studies were compared. A modification of the Stark-Fricke models was proposed. The following conclusions can be obtained from this work:
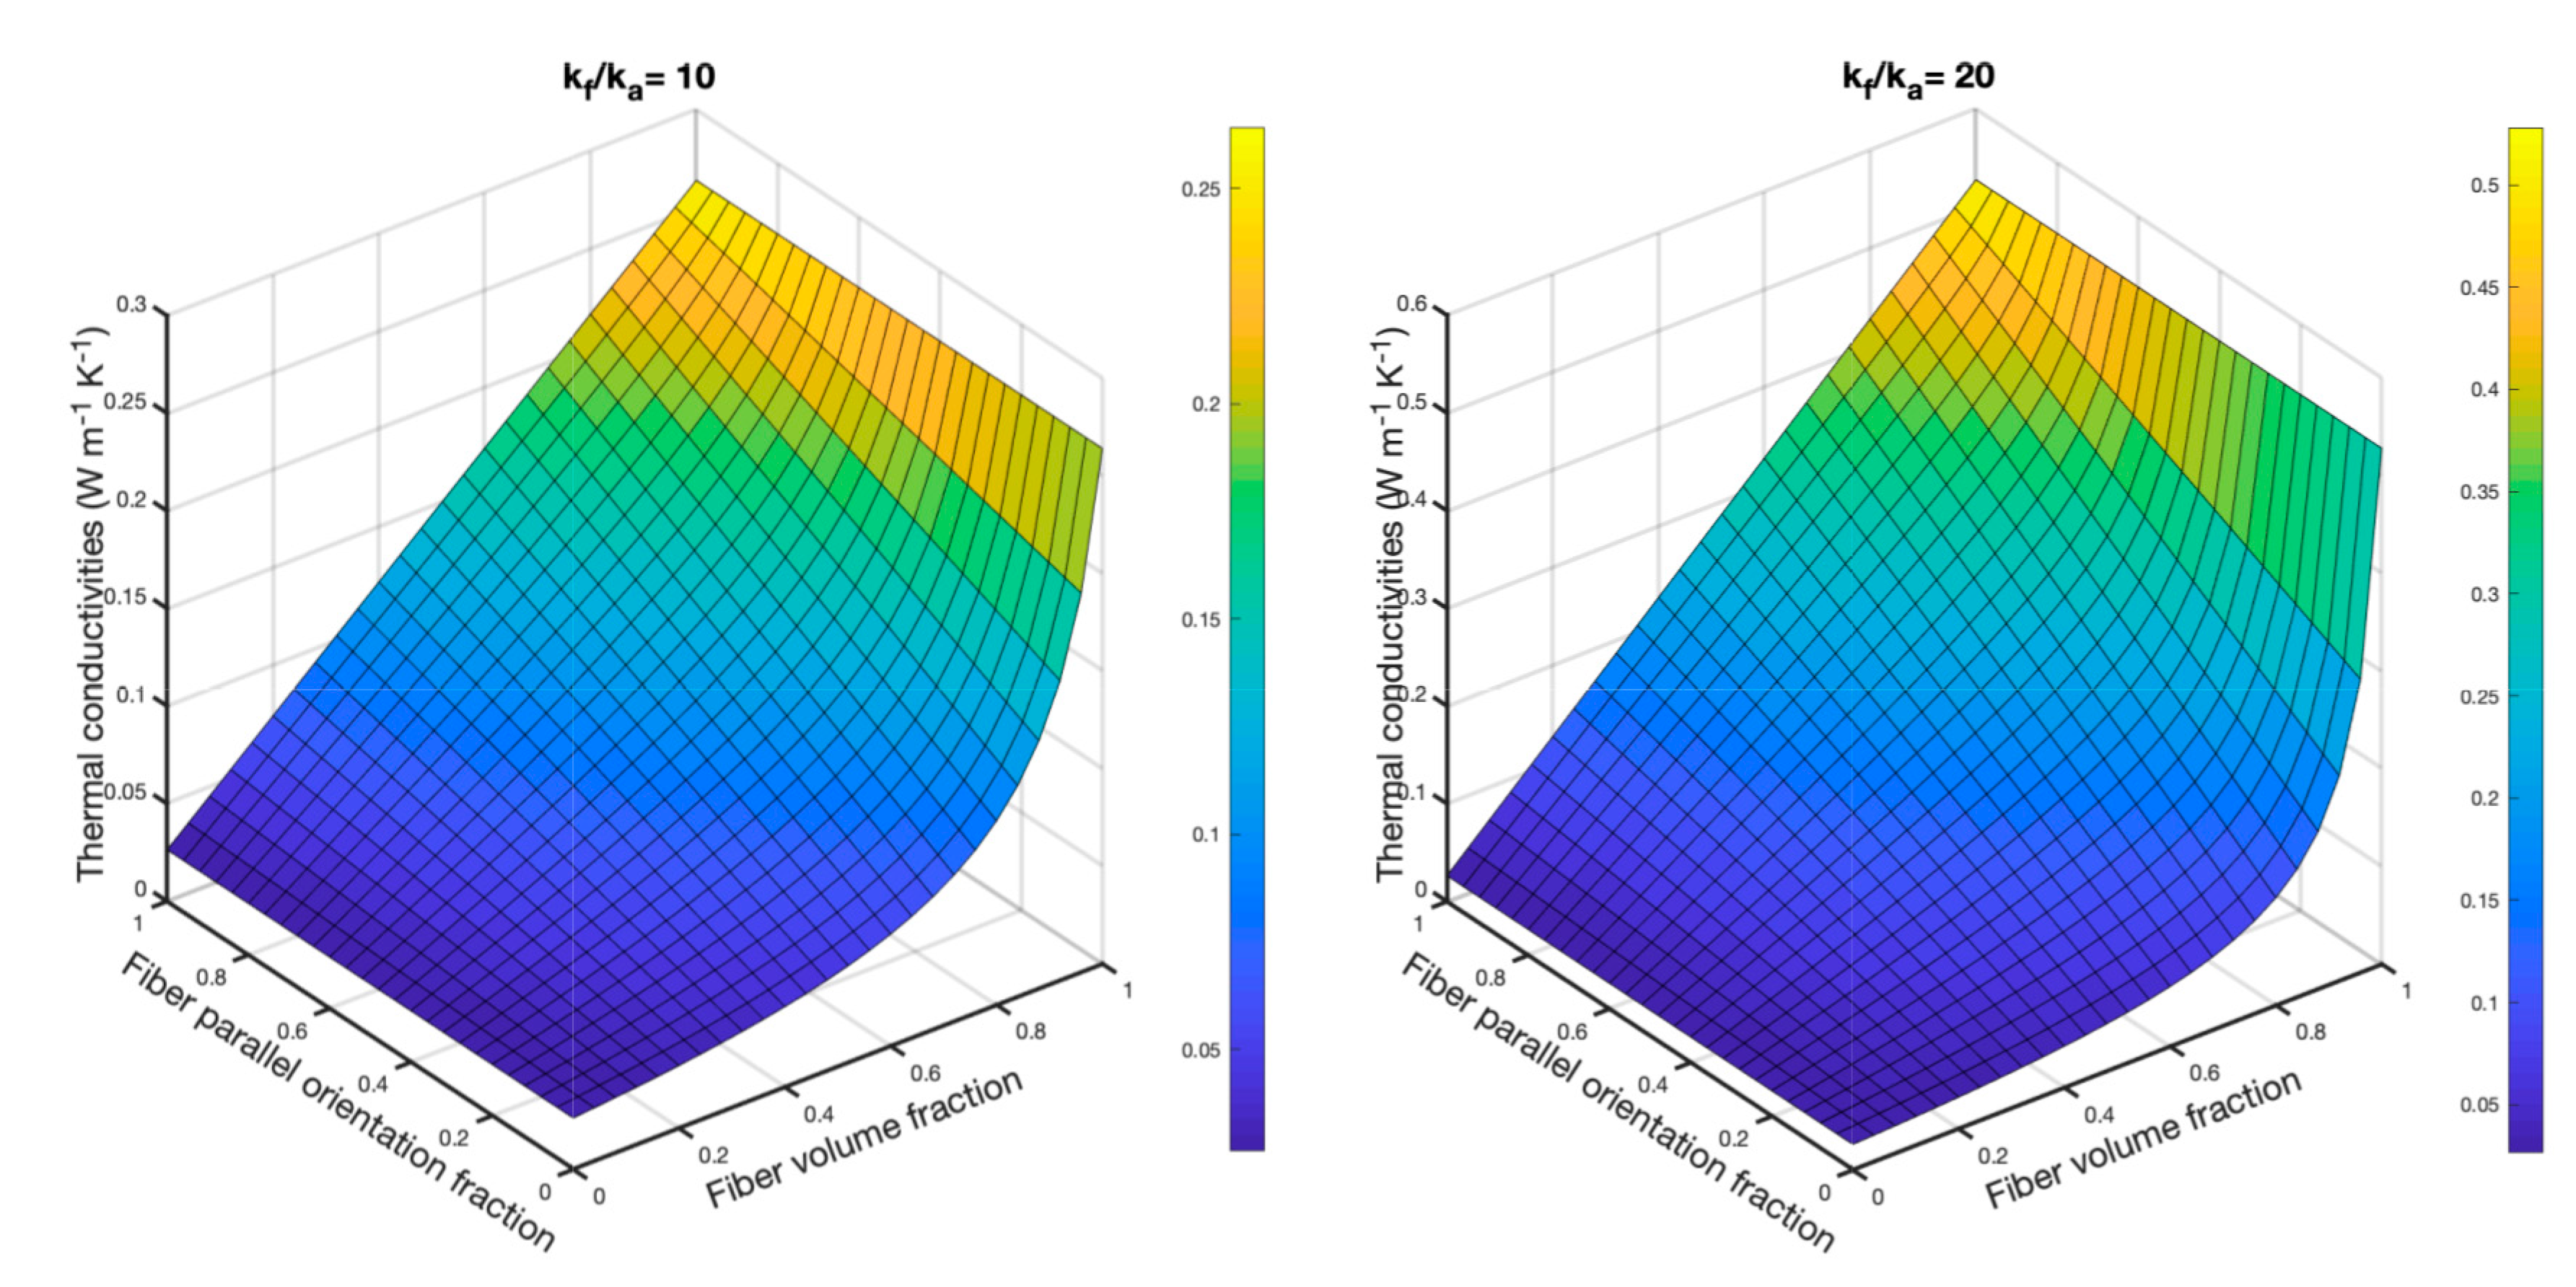
  • Predicted thermal conductivities of nonwoven samples exhibited big differences among the models. Changing of fiber thermal conductivity had a small effect on the results from the Schuhmeister and Bhattacharyya models. The Bogaty model was not suitable for nonwoven materials with a low fiber volume fraction (i.e., <0.1). The two models proposed by Stark et. al. showed much higher predictions compared to the other models.
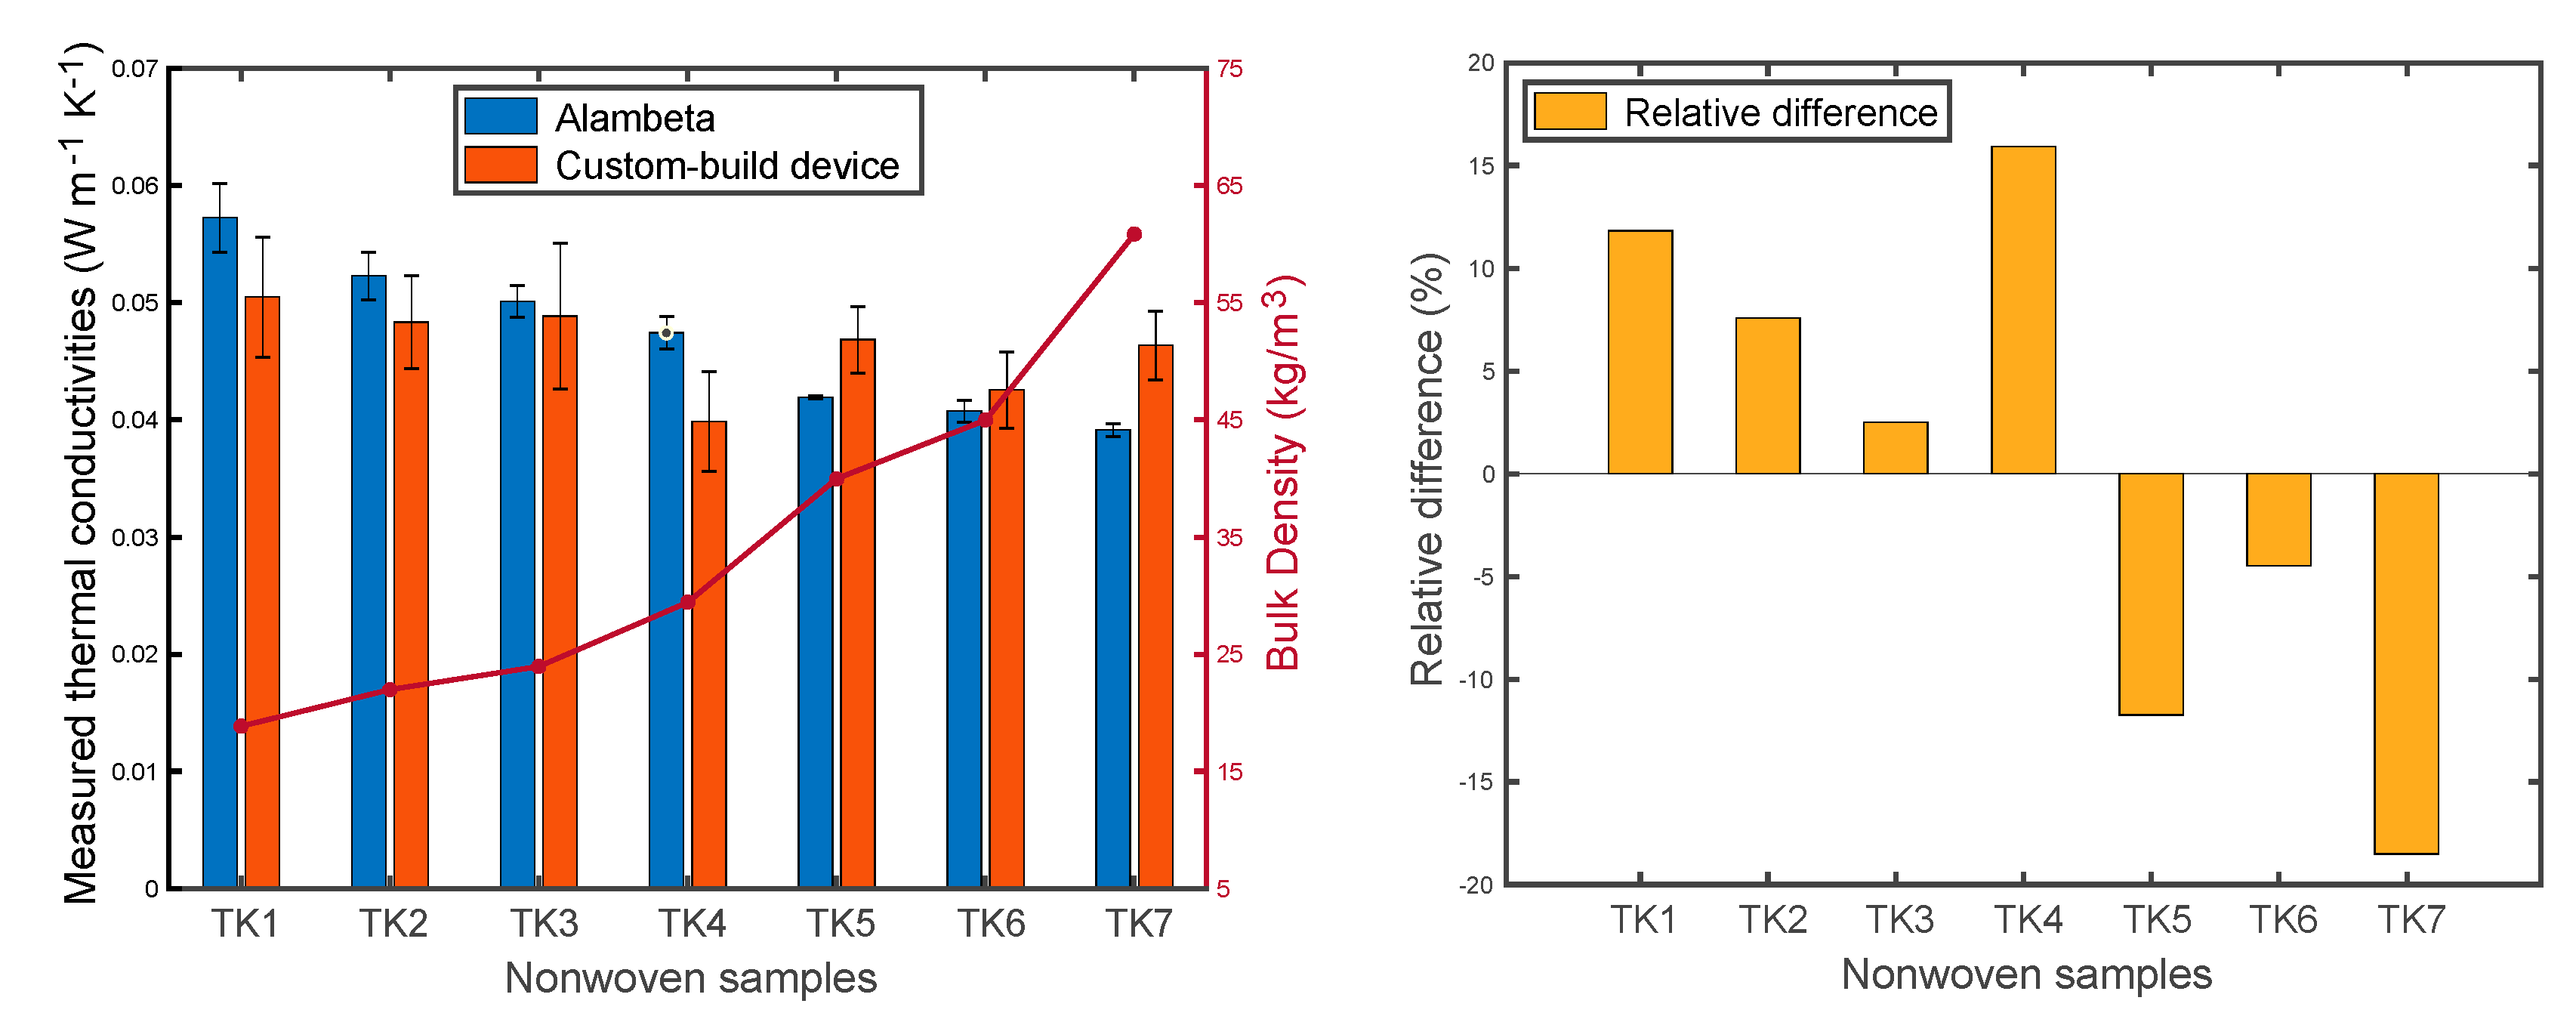
  • Measured thermal conductivities from the Alambeta device and the custom-built device had varying relative differences between the samples. The value was between −18.50% and 15.92%, which is reasonable due to the measurement uncertainties, different environments, and other factors. Although sample density increased the thermal conductivity decreased. This is because the fiber orientation turns more perpendicular to the direction of heat flow when the sample density increased.
  • Two Stark-Fricke models overestimated the thermal conductivities of the nonwoven samples. The Bogaty model exhibited a relatively low difference with the values ranging from 26.73% to 51.21%. The original Stark-Fricke basic model showed a big relative difference (i.e., 18.13–127.18%). The modified model could accurately predict the thermal conductivities with a very small relative difference and can provide a reliable prediction of the thermal conductivity of polyester nonwoven fibrous materials.

Author Contributions

Conceptualization, T.Y.; Methodology, T.Y., H.K., and A.S.; Software, T.Y., and H.K.; Validation, T.Y., X.X., X.T., and J.M.; Formal analysis, T.Y., X.X., and J.M.; Investigation, T.Y., X.X, and H.K.; Resources, T.Y., and M.P.; Data curation, T.Y., and H.K.; Writing of the original draft preparation, T.Y.; Writing of review and editing, T.Y., and J.M.; Visualization, T.Y., and H.K.; Supervision, J.M., A.S., and M.P.; Project administration, M.P.; Funding acquisition, M.P., and X.X. All authors have read and agreed to the published version of the manuscript.

Funding

This article is based upon work from the European Union (European Structural and Investment Funds—Operational Program Research, Development and Education) in the framework of the project “Modular platform for autonomous chassis of specialized electric vehicles for freight and equipment transportation”, Reg. No. CZ.02.1.01/0.0/0.0/16_025/0007293.

Acknowledgments

Tao Yang gratefully acknowledges the support of the International Credit Mobilities Erasmus + traineeship program. The authors would like to thank Jana Salačová and Jana Stránská for their help in the microscopy of fibers. Tao Yang would like to thank Na Liu and Diandian Si for their help through part of the thermal conductivity measurements on the custom-built device.

Conflicts of Interest

The authors declare no conflict of interes.

Nomenclature

hMaterial thickness (m)
kThermal conductivity (W m−1 K−1)
kaThermal conductivity of air (W m−1 K−1)
kfThermal conductivity of fiber (W m−1 K−1)
ks−fThermal conductivity of staple PET fiber (W m−1 K−1)
kh−fThermal conductivity of hollow PET fiber (W m−1 K−1)
kb−fThermal conductivity of bi-component PET fiber (W m−1 K−1)
kalamMeasured thermal conductivity on an Alambeta device (W m−1 K−1)
kCustMeasured thermal conductivity on a custom-build device (W m−1 K−1)
kmeasMeasured thermal conductivity (W m−1 K−1)
kpredPredicted thermal conductivity (W m−1 K−1)
lFiber length (m)
mEmpirical coefficient
RThermal resistance (W m−1 K)
vaVolume fraction of air
vfVolume fraction of fiber
xFraction of fibers parallel to heat flow direction ( x + y = 1 )
yFraction of fibers perpendicular to heat flow direction
zFactor of fibers orientation to the heat flow direction
δFiber in-plane orientation angle (°)
θFiber through-plane orientation angle (°)
ψCritical fiber orientation angle (°)
ΔRelative difference

References

  1. Patnaik, A.; Mvubu, M.; Muniyasamy, S.; Botha, A.; Anandjiwala, R.D. Thermal and sound insulation materials from waste wool and recycled polyester fibers and their biodegradation studies. Energy Build. 2015, 92, 161–169. [Google Scholar] [CrossRef]
  2. Yang, T.; Xiong, X.; Mishra, R.; Novák, J.; Militký, J. Acoustic evaluation of Struto nonwovens and their relationship with thermal properties. Text. Res. J. 2018, 88, 426–437. [Google Scholar] [CrossRef]
  3. Papadopoulos, A.M. State of the art in thermal insulation materials and aims for future developments. Energy Build. 2005, 37, 77–86. [Google Scholar] [CrossRef]
  4. Kymäläinen, H.R.; Sjöberg, A.M. Flax and hemp fibres as raw materials for thermal insulations. Build. Environ. 2008, 43, 1261–1269. [Google Scholar] [CrossRef]
  5. Tilioua, A.; Libessart, L.; Lassue, S. Characterization of the thermal properties of fibrous insulation materials made from recycled textile fibers for building applications: Theoretical and experimental analyses. Appl. Therm. Eng. 2018, 142, 56–67. [Google Scholar] [CrossRef]
  6. Cerkez, I.; Kocer, H.B.; Broughton, R.M. Airlaid nonwoven panels for use as structural thermal insulation. J. Text. Inst. 2018, 109, 17–23. [Google Scholar] [CrossRef]
  7. Xiong, X.; Yang, T.; Mishra, R.; Kanai, H.; Militky, J. Thermal and compression characteristics of aerogel-encapsulated textiles. J. Ind. Text. 2018, 47, 1998–2013. [Google Scholar] [CrossRef]
  8. Shabaridharan, M.; Das, A. Study on heat and moisture vapour transmission characteristics through multilayered fabric ensembles. Fibers Polym. 2012, 13, 522–528. [Google Scholar] [CrossRef]
  9. Jirsak, O.; Sadikoglu, T.G.; Ozipek, B.; Pan, N. Thermo-Insulating Properties of Perpendicular-Laid Versus Cross-Laid Lofty Nonwoven Fabrics. Text. Res. J. 2000, 70, 121–128. [Google Scholar] [CrossRef]
  10. Wang, M.; He, J.; Yu, J.; Pan, N. Lattice Boltzmann modeling of the effective thermal conductivity for fibrous materials. Int. J. Therm. Sci. 2007, 46, 848–855. [Google Scholar] [CrossRef] [Green Version]
  11. Křemenáková, D. Selected Properties of Functional Materials; Fakulta textilní, Technická univerzita v Liberci: Liberec, Czech Republic, 2013; pp. 294–300. [Google Scholar]
  12. Van Krevelen, D.W. Properties of Polymers; Elsevier: Amsterdam, The Netherlands, 1997; pp. 645–653. [Google Scholar]
  13. Carvajal, S.A.; Garboczi, E.J.; Zarr, R.R. Comparison of Models for Heat Transfer in High-Density Fibrous Insulation. J. Res. Natl. Inst. Stand. Technol. 2019, 124, 1–21. [Google Scholar] [CrossRef]
  14. Sun, Z.; Pan, N. Thermal conduction and moisture diffusion in fibrous materials. In Thermal and Moisture Transport in Fibrous Materials; Pan, N., Gibson, P., Eds.; Woodhead Publishing Ltd: Sawston, UK, 2006; p. 225. [Google Scholar]
  15. Stark, C.; Fricke, J. Improved heat-transfer models for fibrous insulations. Int. J. Heat Mass Transf. 1993, 36, 617–625. [Google Scholar] [CrossRef]
  16. Bhattacharyya, R.K. Heat-Transfer Model for Fibrous Insulations. In Thermal Insulation Performance, ASTM STP 718; MeElroy, D.L., Tye, R.P., Eds.; American Society for Testing and Materials: West Conshohocken, PA, USA, 1980; pp. 272–286. [Google Scholar]
  17. Arambakam, R.; Tafreshi, H.V.; Pourdeyhimi, B. Modeling performance of multi-component fibrous insulations against conductive and radiative heat transfer. Int. J. Heat Mass Transf. 2014, 71, 341–348. [Google Scholar] [CrossRef]
  18. Xiong, X.; Yang, T.; Mishra, R.; Huang, J.; Kotresh, T.M.; Militký, J. Heat Transfer through Thermal Insulation Materials Part I—Nonwoven Fabrics. In Recent Developments in Fibrous Material Science; Ops Publishing: Kenosha, WI, USA, 2015; ISBN 978-80-87269-45-9. [Google Scholar]
  19. Nouri, N. Radiative Conductivity Analysis of Low-Density Fibrous Materials. Master’s Thesis, University of Kentucky, Lexington, KY, USA, 2015. [Google Scholar]
  20. Lawson, D.I.; Mcguire, J.H. The Solution of Transient Heat-flow Problems by Analogous Electrical Networks. Proc. Inst. Mech. Eng. 1953, 167, 275–290. [Google Scholar] [CrossRef]
  21. Fricke, H.I.J. A Mathematical Treatment of the Electrical conductivity and Capacity of Disperse Systems. Phys. Rev. 1924, 24, 678–681. [Google Scholar] [CrossRef]
  22. Schuhmeister, J. Ber. K Akad Wien (Math-Naturw Klasse) 1877, 76, 283. [Google Scholar]
  23. Baxter, S. The Thermal Conductivity of Textiles. Proc. Phys. Soc. 1946, 58, 105–118. [Google Scholar] [CrossRef]
  24. Verschoor, J.D.; Greebler, P. Heat transfer by gas conduction and radiation in fibrous insulation. Trans. Am. Soc. Mech. Eng. 1952, 74, 961–968. [Google Scholar]
  25. Tavman, I.H. Effective thermal conductivity of polymer composites. Int. Comm. Heat Mass Transf. 1998, 25, 723–732. [Google Scholar] [CrossRef]
  26. Militký, J.; Křemenáková, D. A Simple Methods for Prediction of Textile Fabrics Thermal Conductivity. In Proceedings of the 5th International Conference on Heat Transfer, Fluid Mechanics and Thermodynamics, Sun City, South Africa, 1–4 July 2007; p. PJ4. [Google Scholar]
  27. Bogaty, H.; Hollies, N.R.S.; Harris, M. Some Thermal Properties of Fabrics: Part I: The Effect of Fiber Arrangement. Text. Res. J. 1957, 27, 445–449. [Google Scholar] [CrossRef]
  28. Militký, J.; Křemenáková, D. Prediction of fabrics thermal conductivity. In Proceedings of the 5th International Textile, Clothing & Design Conference—Magic World of Textiles, Dubrovnik, Croatia, 3–6 October 2010; pp. 1–6. [Google Scholar]
  29. Mao, N.; Russell, S.J. The thermal insulation properties of spacer fabrics with a mechanically integrated wool fiber surface. Text. Res. J. 2007, 77, 914–922. [Google Scholar] [CrossRef]
  30. Arambakam, R.; Vahedi Tafreshi, H.; Pourdeyhimi, B. A simple simulation method for designing fibrous insulation materials. Mater. Des. 2013, 44, 99–106. [Google Scholar] [CrossRef]
  31. Bicerano, J. Prediction of Polymer Properties; CRC Press: London, UK, 2002. [Google Scholar]
  32. Yang, T.; Saati, F.; Horoshenkov, K.V.; Xiong, X.; Yang, K.; Mishra, R.; Marburg, S.; Militký, J. Study on the sound absorption behavior of multi-component polyester nonwovens: Experimental and numerical methods. Text. Res. J. 2019, 89, 3342–3361. [Google Scholar] [CrossRef]
  33. Kawabata, S. Measurement of Anisotropic Thermal Conductivity of Single Fiber. J. Text. Mach. Soc. Jpn. 1986, 39, T184–T186. [Google Scholar] [CrossRef] [Green Version]
  34. Morton, W.E.; Hearle, J.W.S. Physical Properties of Textile Fibers; The Textile Institute: Manchester, UK, 1986; pp. 174–175. [Google Scholar]
  35. Daryabeigi, K.; Cunnington, G.R.; Knutson, J.R. Heat transfer modeling for rigid high-temperature fibrous insulation. J. Thermophys. Heat Transf. 2013, 27, 414–421. [Google Scholar] [CrossRef] [Green Version]
  36. Hes, L.; de Araujo, M.; Djulay, V.V. Effect of Mutual Bonding of Textile Layers on Thermal Insulation and Thermal Contact Properties of Fabric Assemblies. Text. Res. J. 1996, 66, 245–250. [Google Scholar] [CrossRef]
  37. Hes, L.; Dolezal, I. New method and equipment for measuring thermal properties of textiles. Sen’i Kikai Gakkaishi J. Text. Mach. Soc. Jpn. 1989, 42, 124–128. [Google Scholar] [CrossRef]
  38. Kaneko, H.; Sakuma, A. Evaluation of heat transfer kinetics on layers of air-rich soft materials in their natural state. In Proceedings of the ASME International Mechanical Engineering Congress and Exposition, Pittsburgh, PA, USA, 9–15 November 2018; pp. 1–6. [Google Scholar]
  39. Nelder, J.A.; Mead, R. A simplex method for function minimization. Comput. J. 1965, 7, 308–313. [Google Scholar] [CrossRef]
Figure 1. Fibers orientated perpendicular (a) or parallel (b) to the direction of heat flow.
Materials 13 02882 g001
Figure 2. Fiber orientation angle in three-dimensional nonwoven fibrous material.
Materials 13 02882 g002
Figure 3. Longitudinal images of fibers: (a) staple fiber; (b) hollow fiber; (c) bi-component fiber.
Materials 13 02882 g003
Figure 4. Polyester nonwoven samples (a) and cross-sectional macroscopic images (b).
Materials 13 02882 g004
Figure 5. Tomography image of polyester nonwoven sample TK7.
Materials 13 02882 g005
Figure 6. Theoretical study procedures according to fiber thermal conductivity.
Materials 13 02882 g006
Figure 7. Heat transfer through the hollow fiber in the longitudinal (a) direction, and cross-sectional image of the hollow fiber (b).
Materials 13 02882 g007
Figure 8. Sketch of the custom-built apparatus.
Materials 13 02882 g008
Figure 9. Predicted thermal conductivities of nonwoven samples based on different models.
Materials 13 02882 g009
Figure 10. The effect of fiber orientation and fiber volume fractions on the thermal conductivity of nonwoven samples based on the Bogaty model.
Materials 13 02882 g010
Figure 11. Comparison of the results from two different devices.
Materials 13 02882 g011
Figure 12. Predicted and measured thermal conductivities of the nonwoven samples.
Materials 13 02882 g012
Figure 13. Predicted and measured thermal conductivities of nonwoven samples.
Materials 13 02882 g013
Figure 14. Predicted and measured thermal conductivities of the nonwoven samples.
Materials 13 02882 g014
Table 1. Some semi-empirical models for thermal conductivity estimation.
No.Thermal ConductivityReference
1 k = 1 3 ( v f k f + v a k a ) + 2 3 ( k f k a / ( v a k f + v f k a ) ) Schuhmeister [22]
2 k = 0.21 ( v f k f + v a k a ) + 0.79 ( k f k a / ( v a k f + v f k a ) ) Baxter [23]
3 k = v f m k f + k a Verschoor and Greebler [24]
4 k = k f v f k a v a Tavman [25]
Table 2. Some models for fibrous material with parallel, perpendicular, and random fiber orientations.
No.Thermal ConductivityFiber Orientation to the Direction of Heat FlowReference
5 k = v f k f + v a k a ParallelBogaty et al. [27]
6 k =   k f k a   k a v f   + k f v a PerpendicularBogaty et al. [27]
7 k = [ 1 1 k a / k f 1 + 2 ( k a / k f ) ( v f / v a ) ( 1 + k a / k f ) ] k f Bhattacharyya [16]
8 k = x ( v f k f + v a k a ) + y ( v f k f + v a k a ) 1 RandomBogaty et al. [27]
9 k = [ 1 1 k a / k f 1 + ( 1 + 5 ( k a / k f ) ) ( v f / v a ) 3 ( 1 + k a / k f ) ] k f Bhattacharyya [16]
Table 3. Basic characteristics of the polyester nonwoven fibrous samples.
Samples CodeThickness
(mm)
Bulk Density
(kg/m3)
Porosity
(%)
Mean Fiber Orientation Angle
(°)
TK126.9318.8598.35010.09
TK223.0821.9998.07432.46
TK321.1823.9697.90139.26
TK417.2329.4697.42050.96
TK512.739.9696.50062.36
TK611.2844.9996.06065.65
TK78.3460.8594.67172.25
Table 4. Thermal conductivity of polyester fibers in the literature.
k f   ( W   m 1   K 1 ) Reference
0.140Baxter [23]
0.272Militký et.al. [26]
0.260Stark et.al. [15]
Table 5. Thermal conductivities of three fiber constituents and fiber unity.
Referred Values [23,26]
(W m−1 K−1)
Staple and Bi-Component Fibers
(W m−1 K−1)
Hollow Fiber
(W m−1 K−1)
Fiber Unity
(W m−1 K−1)
Bogaty Models [27]
0.1400.1400.11870.1324Parallel
0.2720.2720.22610.2556Parallel
Table 6. Volume fractions of air and fiber, and the fractions of fiber orientation to the heat flow.
TK1TK2TK3TK4TK5TK6TK7
v a 0.98350.98070.97900.97420.96500.96060.9467
v f 0.01650.01930.02100.02580.03500.03940.0533
x 0.8489 0.6112 0.5503 0.4478 0.3439 0.3116 0.2425
y 0.1511 0.3888 0.4497 0.5522 0.6561 0.6884 0.7575
Table 7. Predicted thermal conductivities of nonwoven samples based on different k f .
Referred   k f ( W   m 1   K 1 ) ModelsPredicted Thermal Conductivity of Nonwovens (W m−1 K−1)
TK1TK2TK3TK4TK5TK6TK7
k f :0.140Schuhmeister0.02720.02740.02740.02770.02810.02840.0291
Bogaty0.02790.02780.02780.02790.02820.02830.0287
Bhattacharyya0.02780.02800.02820.02860.02940.02980.0310
Stark & Fricke BM0.06760.06710.06670.10590.09920.09640.0889
Stark & Fricke0.06580.06100.05920.07690.06460.06040.0507
k f :0.272Schuhmeister0.02790.02820.02830.02880.02960.03010.0314
Bogaty0.03340.03900.04050.04320.04620.04730.0497
Bhattacharyya0.02850.02890.02910.02970.03090.03150.0334
Stark & Fricke BM0.09060.08980.08930.17270.15610.14950.1331
Stark & Fricke0.08680.07770.07450.10190.07990.07300.0583
Table 8. Measured thermal conductivities of the nonwoven samples.
MethodsMeasured Thermal Conductivity of Nonwoven Samples (W m−1 K−1)
TK1TK2TK3TK4TK5TK6TK7
Alambeta0.057260.05230.05010.047420.041940.040740.03912
SD0.002930.002040.001350.001390.000130.000920.00053
Custom-build device0.050490.048340.048850.039870.046860.042560.04636
SD0.005120.003980.006230.004260.002840.003260.00294
Table 9. The original and optimized fiber orientation factor (Z).
TK1TK2TK3TK4TK5TK6TK7
Fiber orientation angle (°)10.0932.4939.2650.9662.3462.3472.25
Original Z0.830.830.831111
Optimized Z0.75300.70590.68140.64730.55230.52280.4613

