The Influence of Hybrid Surface Modification on the Selected Properties of CP Titanium Grade II Manufactured by Selective Laser Melting

 ,
,  ,
,  ,
,  , and
, and 
Abstract
1. Introduction
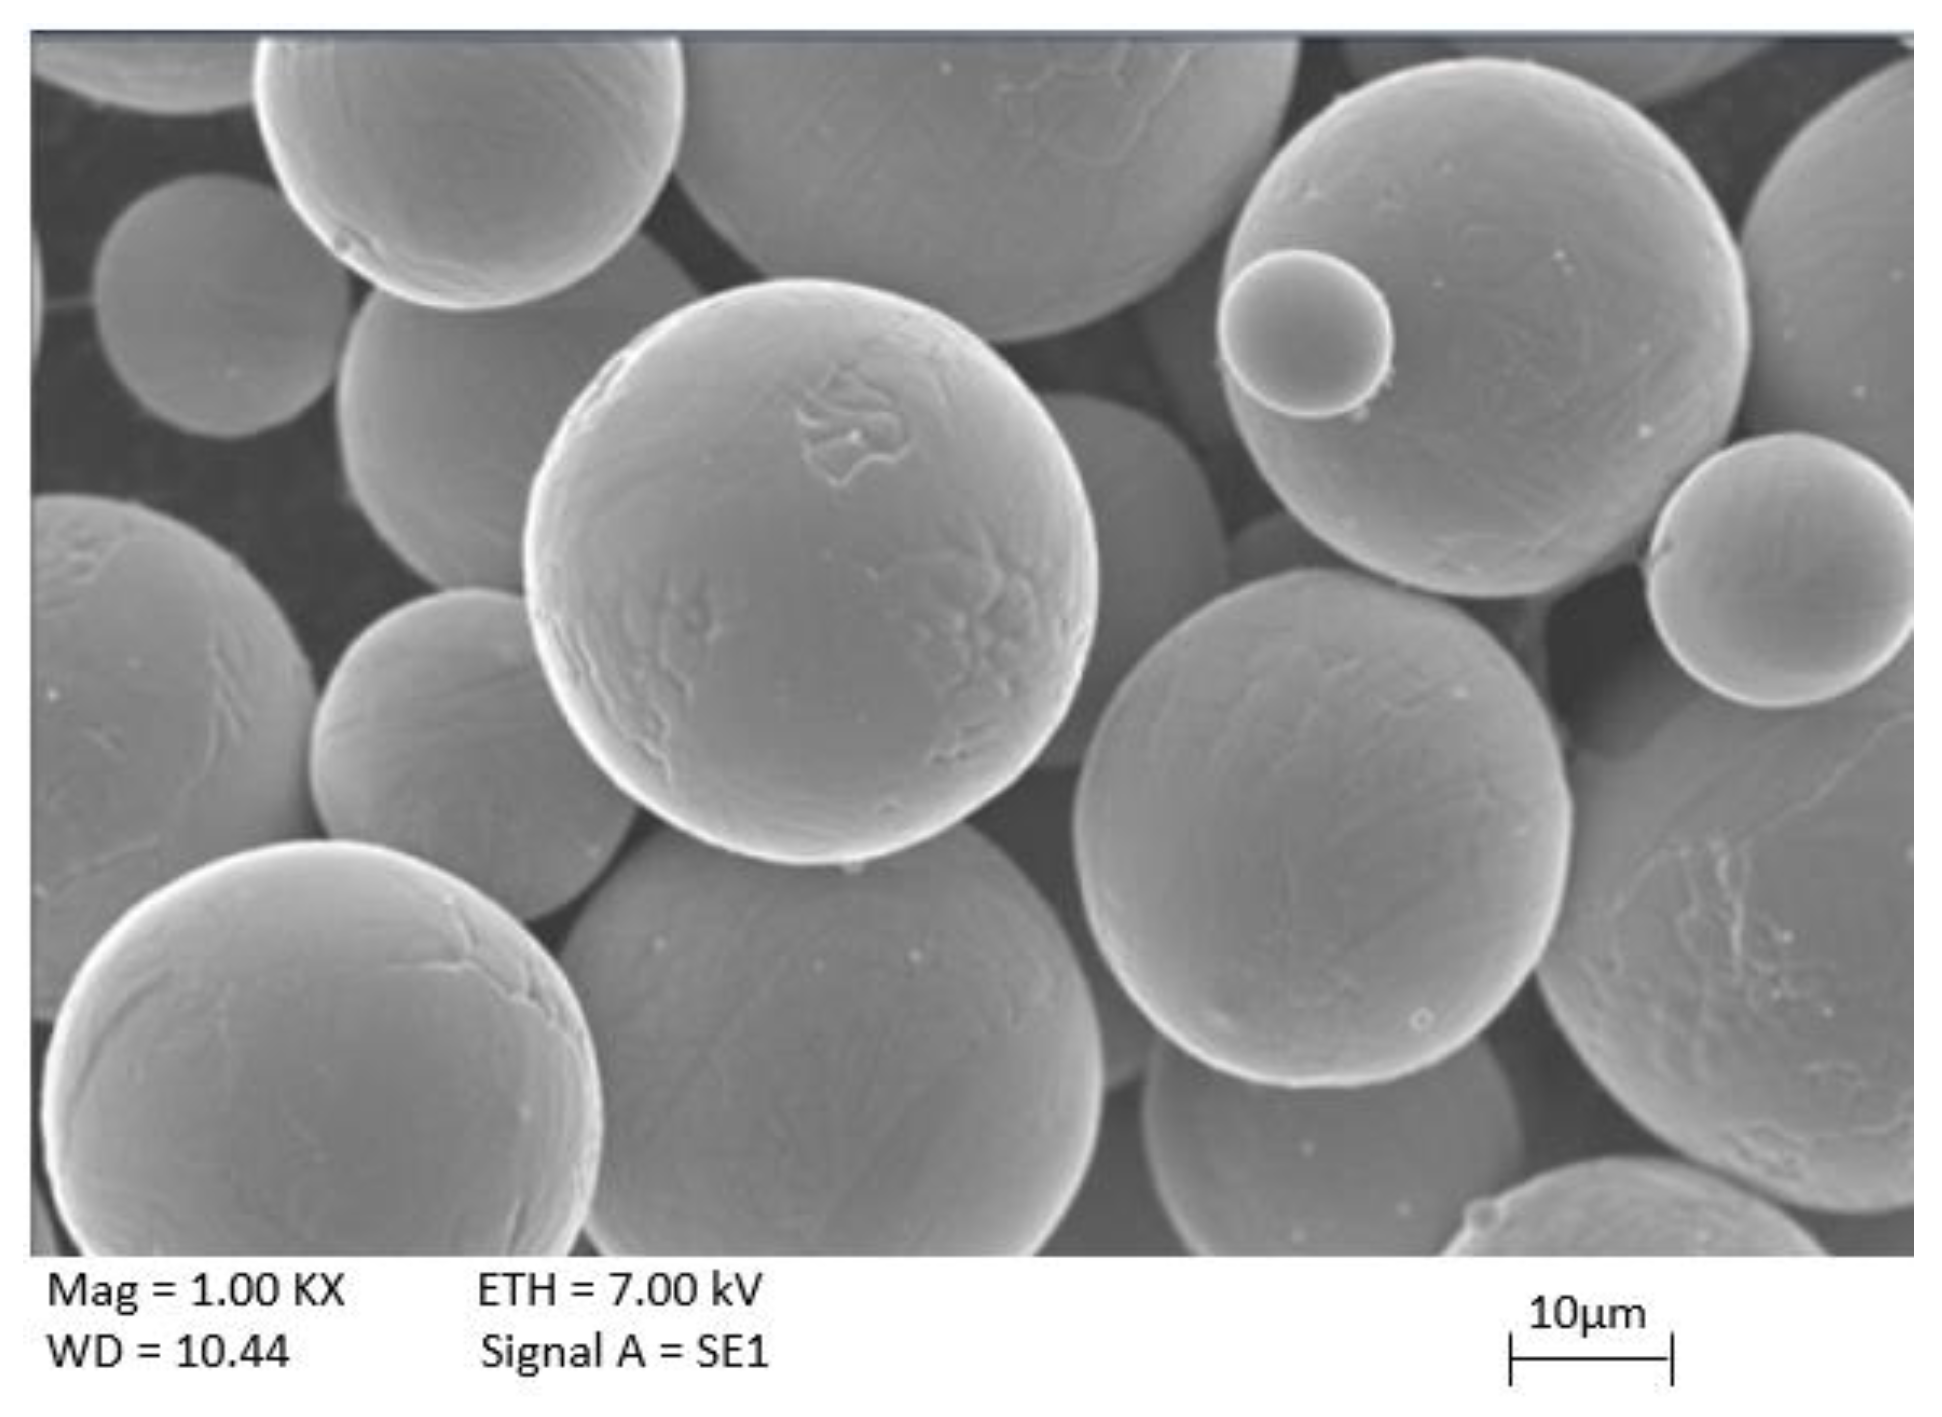
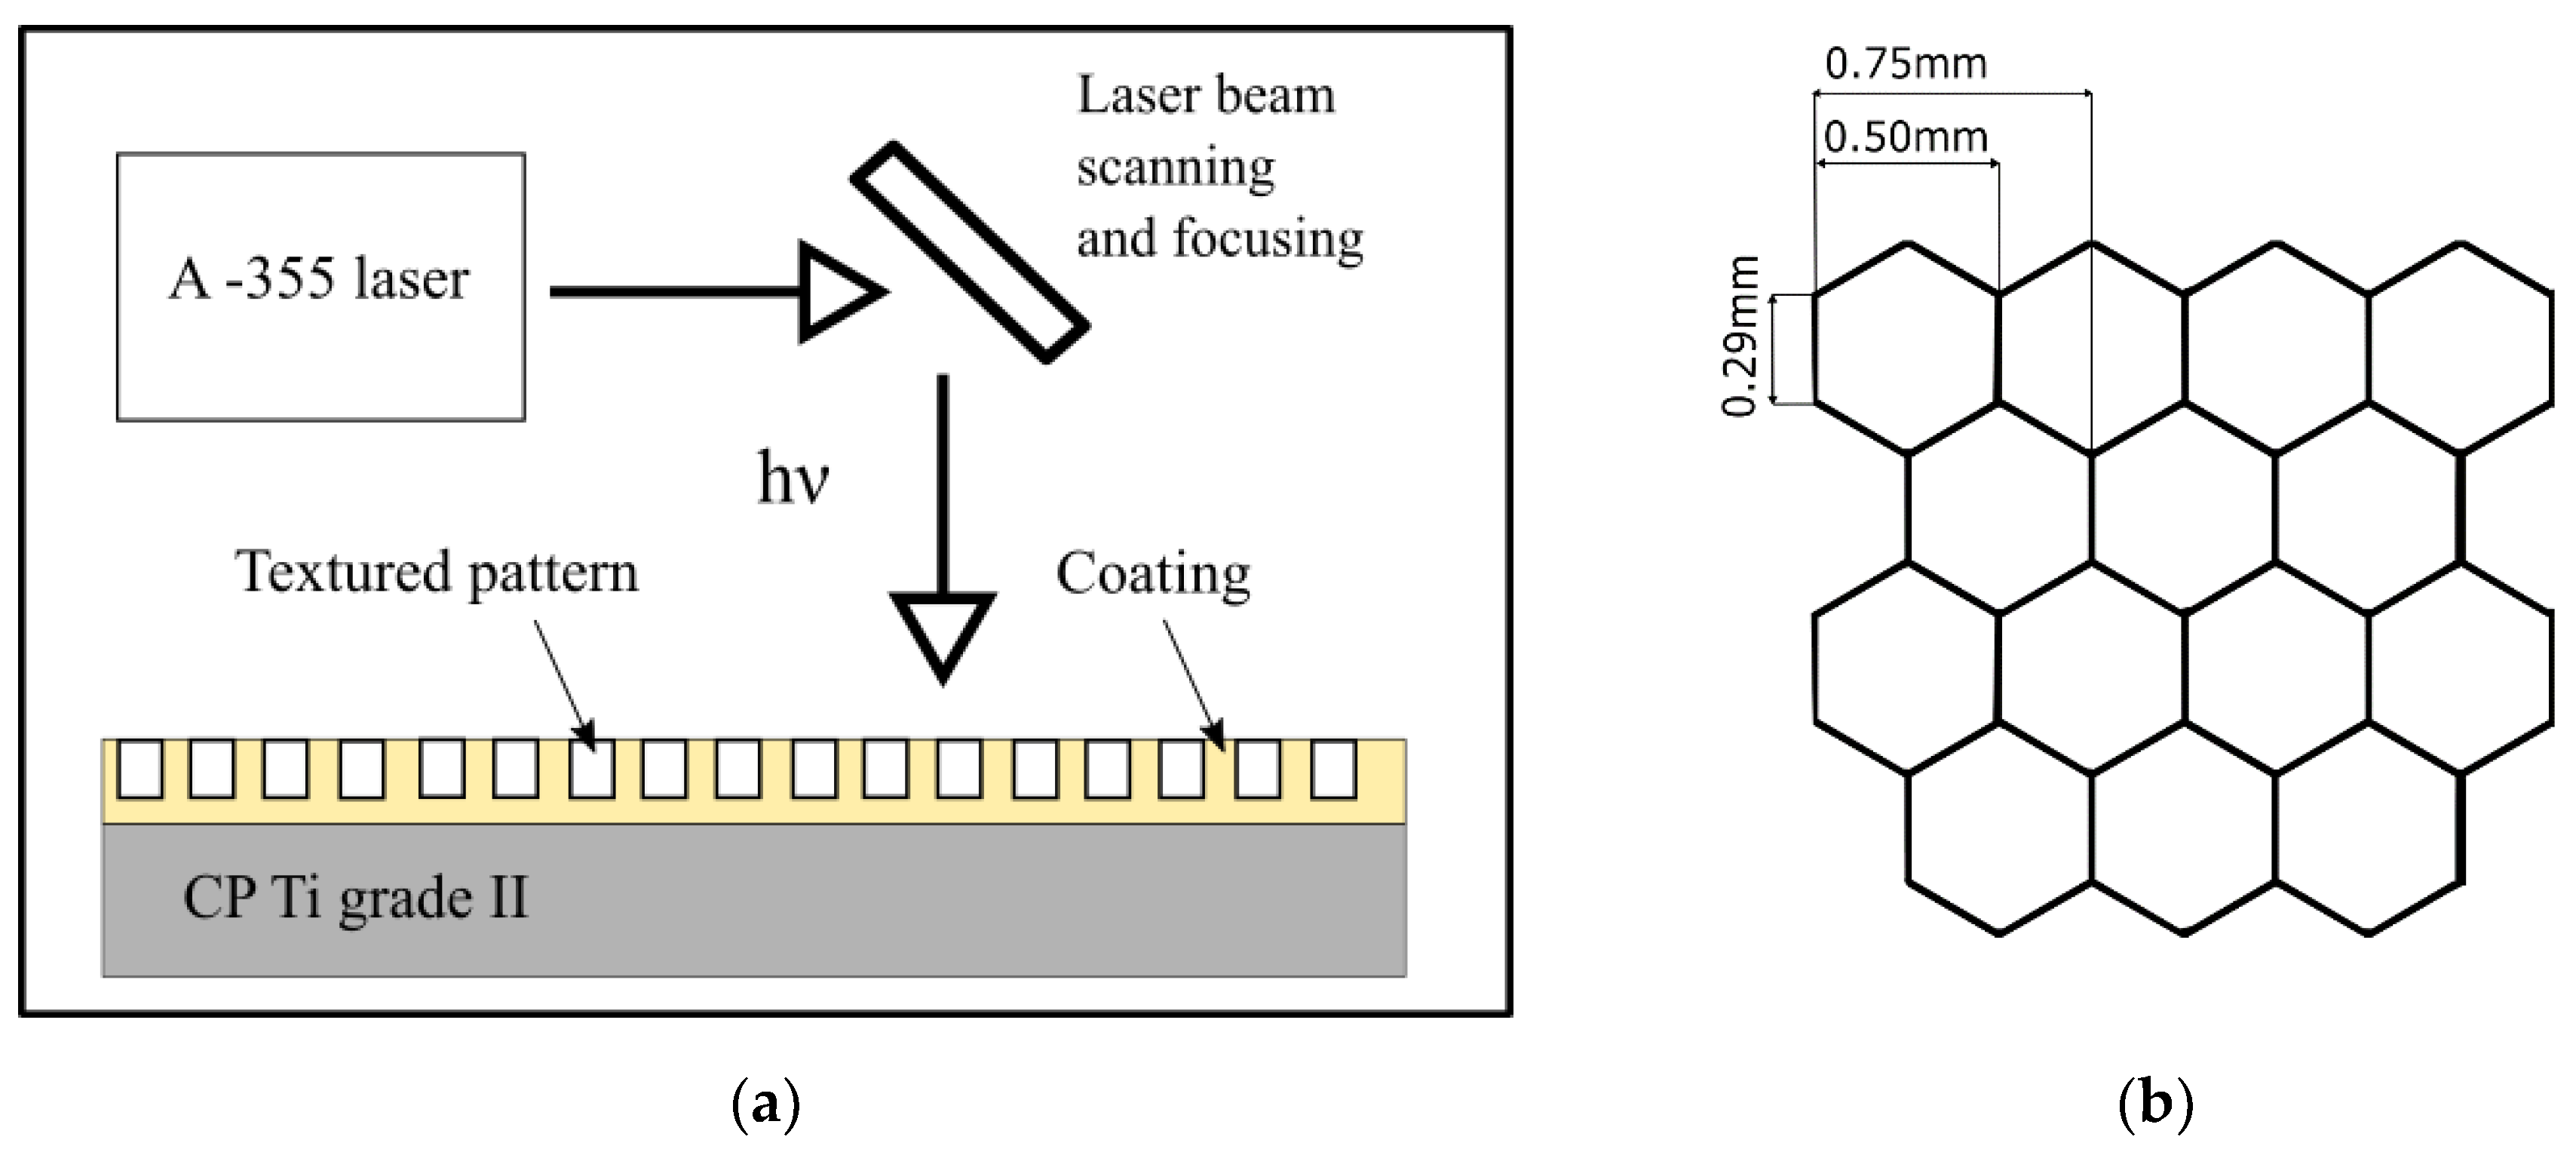
2. Materials and Methods
2.1. Surface Topography Investigation and Phase Analysis
2.2. Physicochemical and Electrochemical Properties Analysis
2.3. Wear Test
3. Results
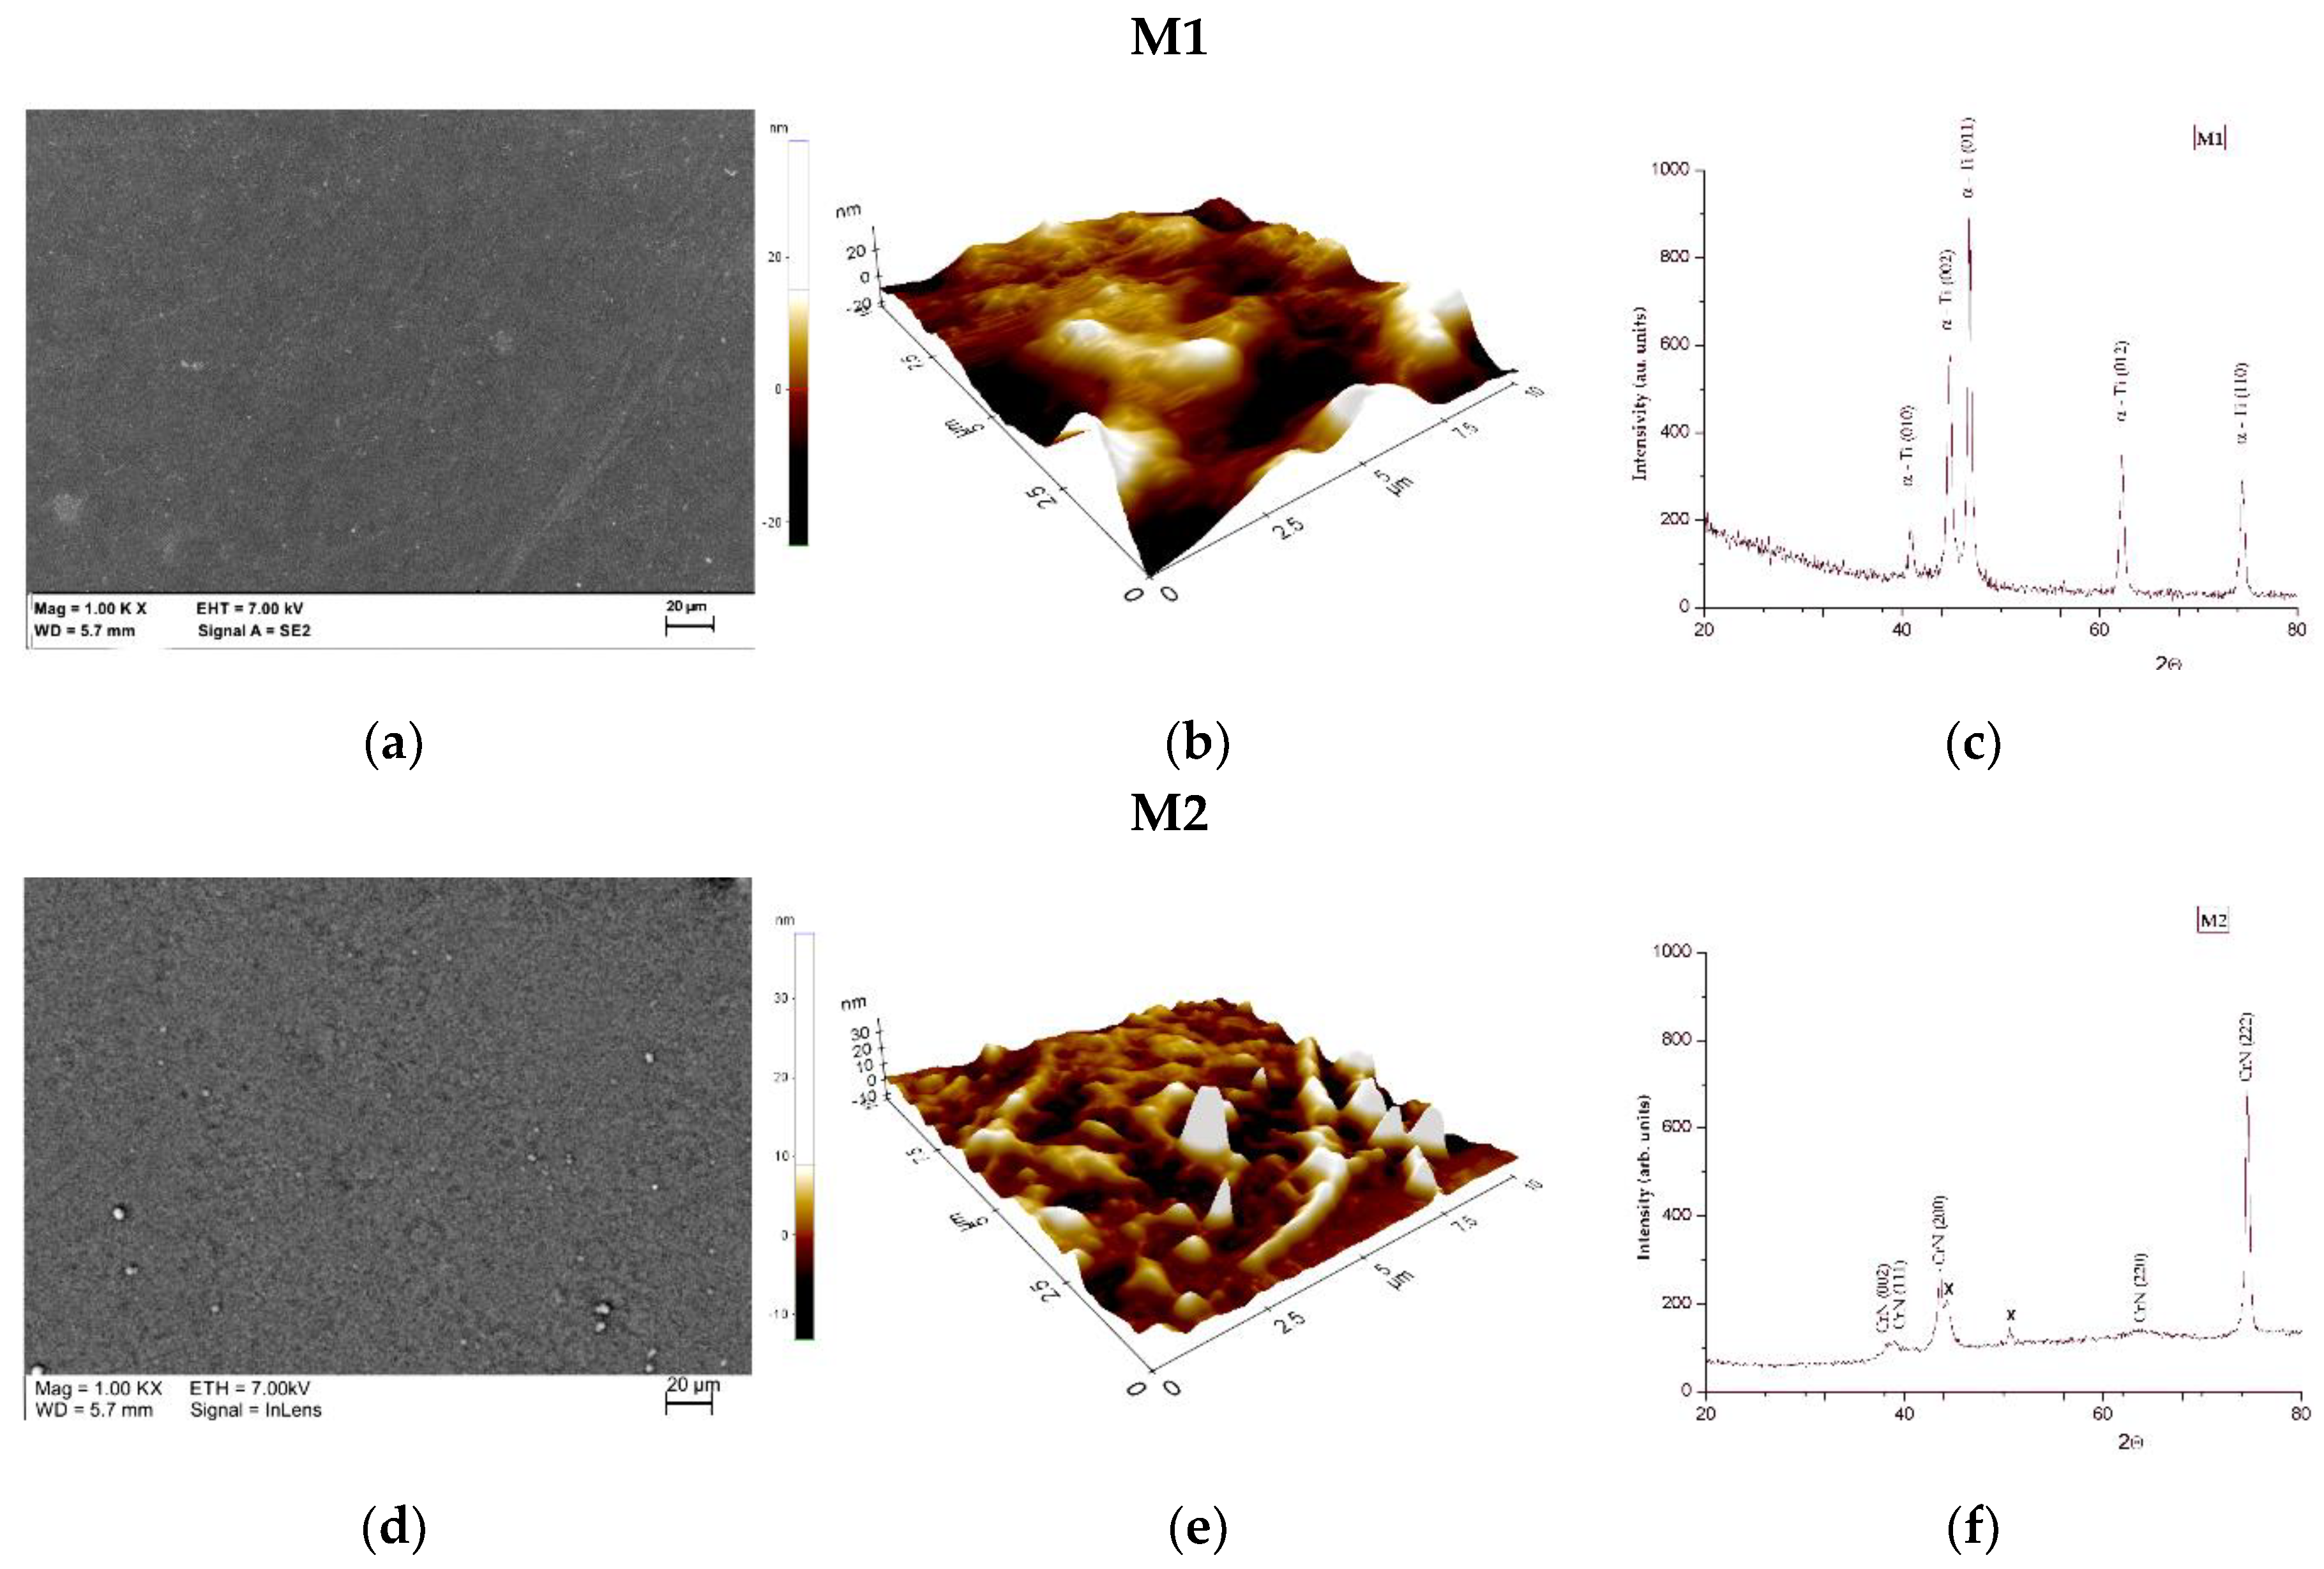
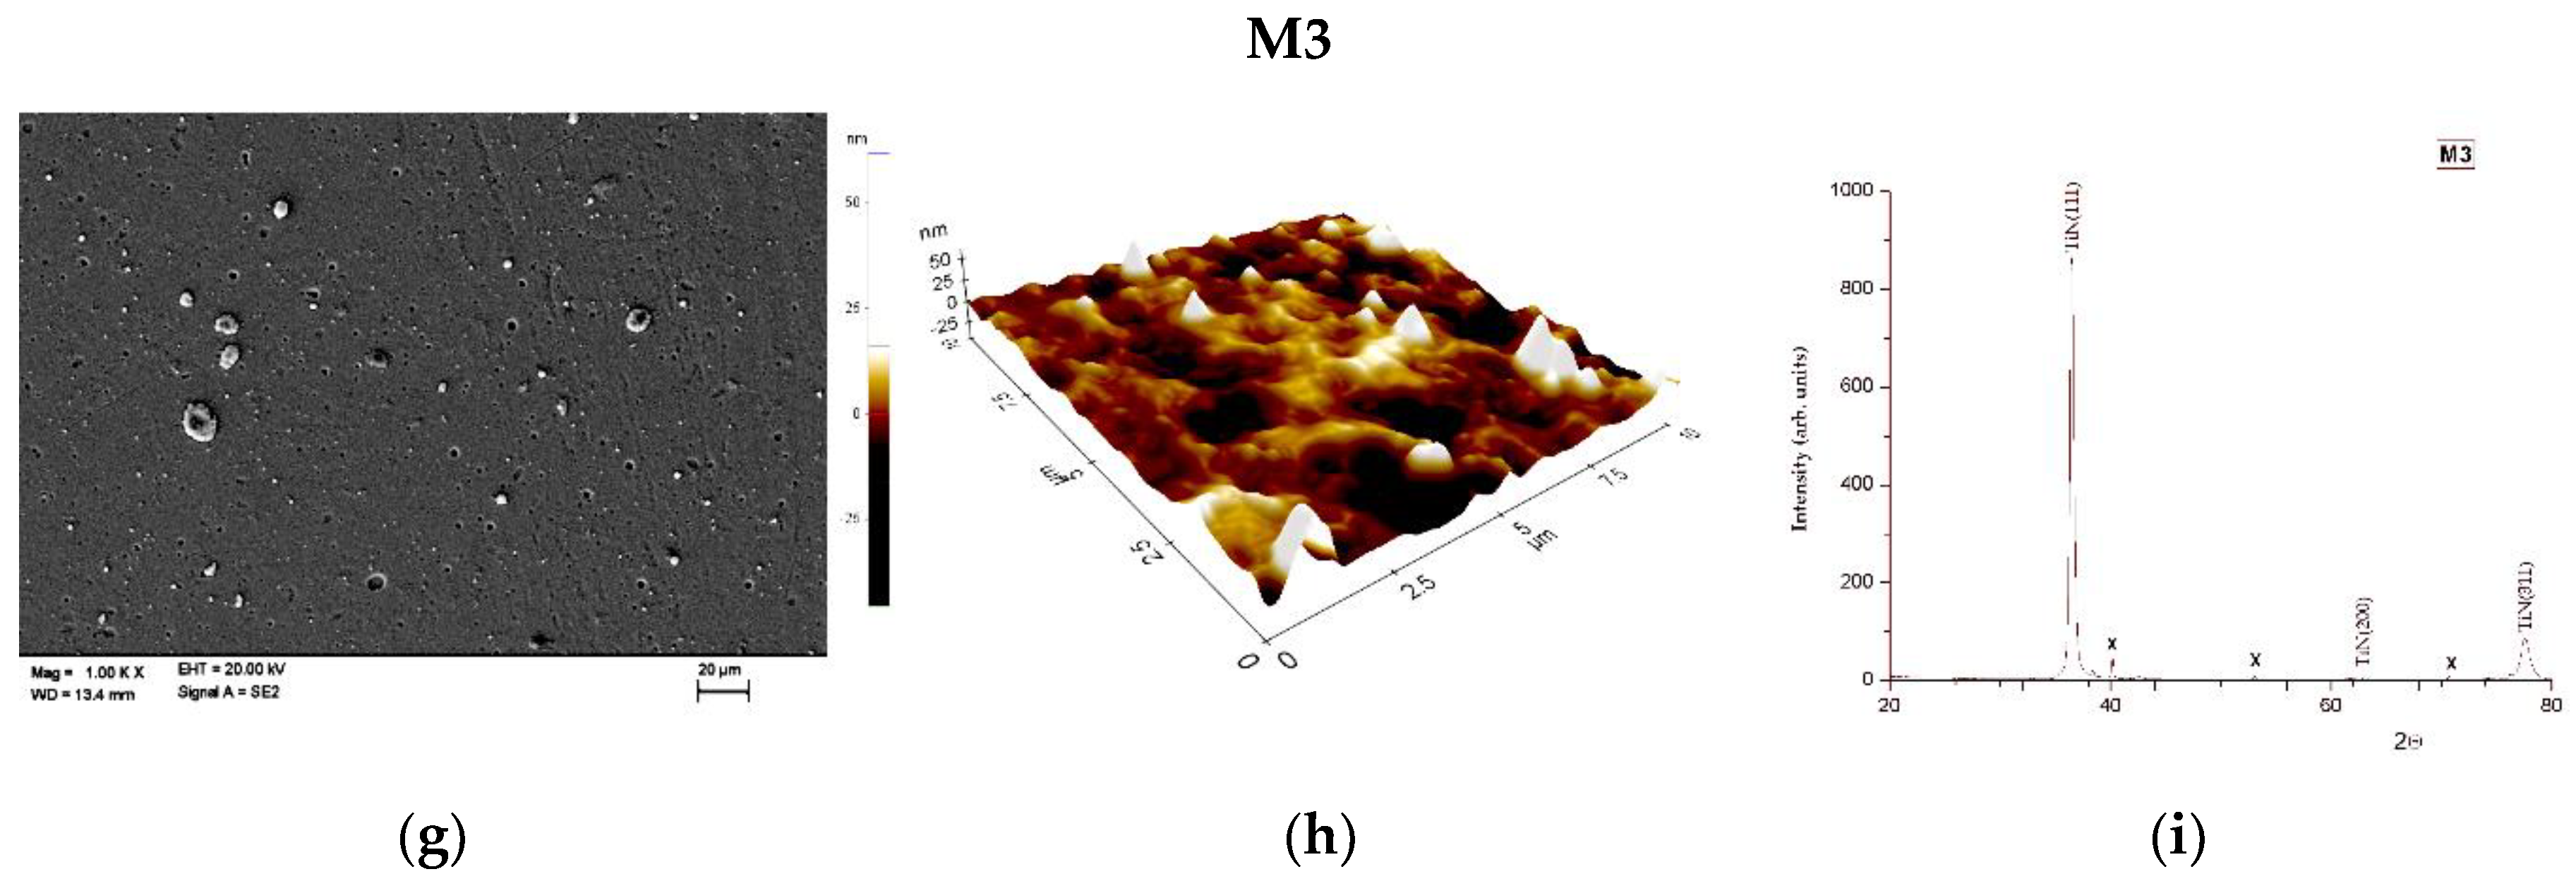
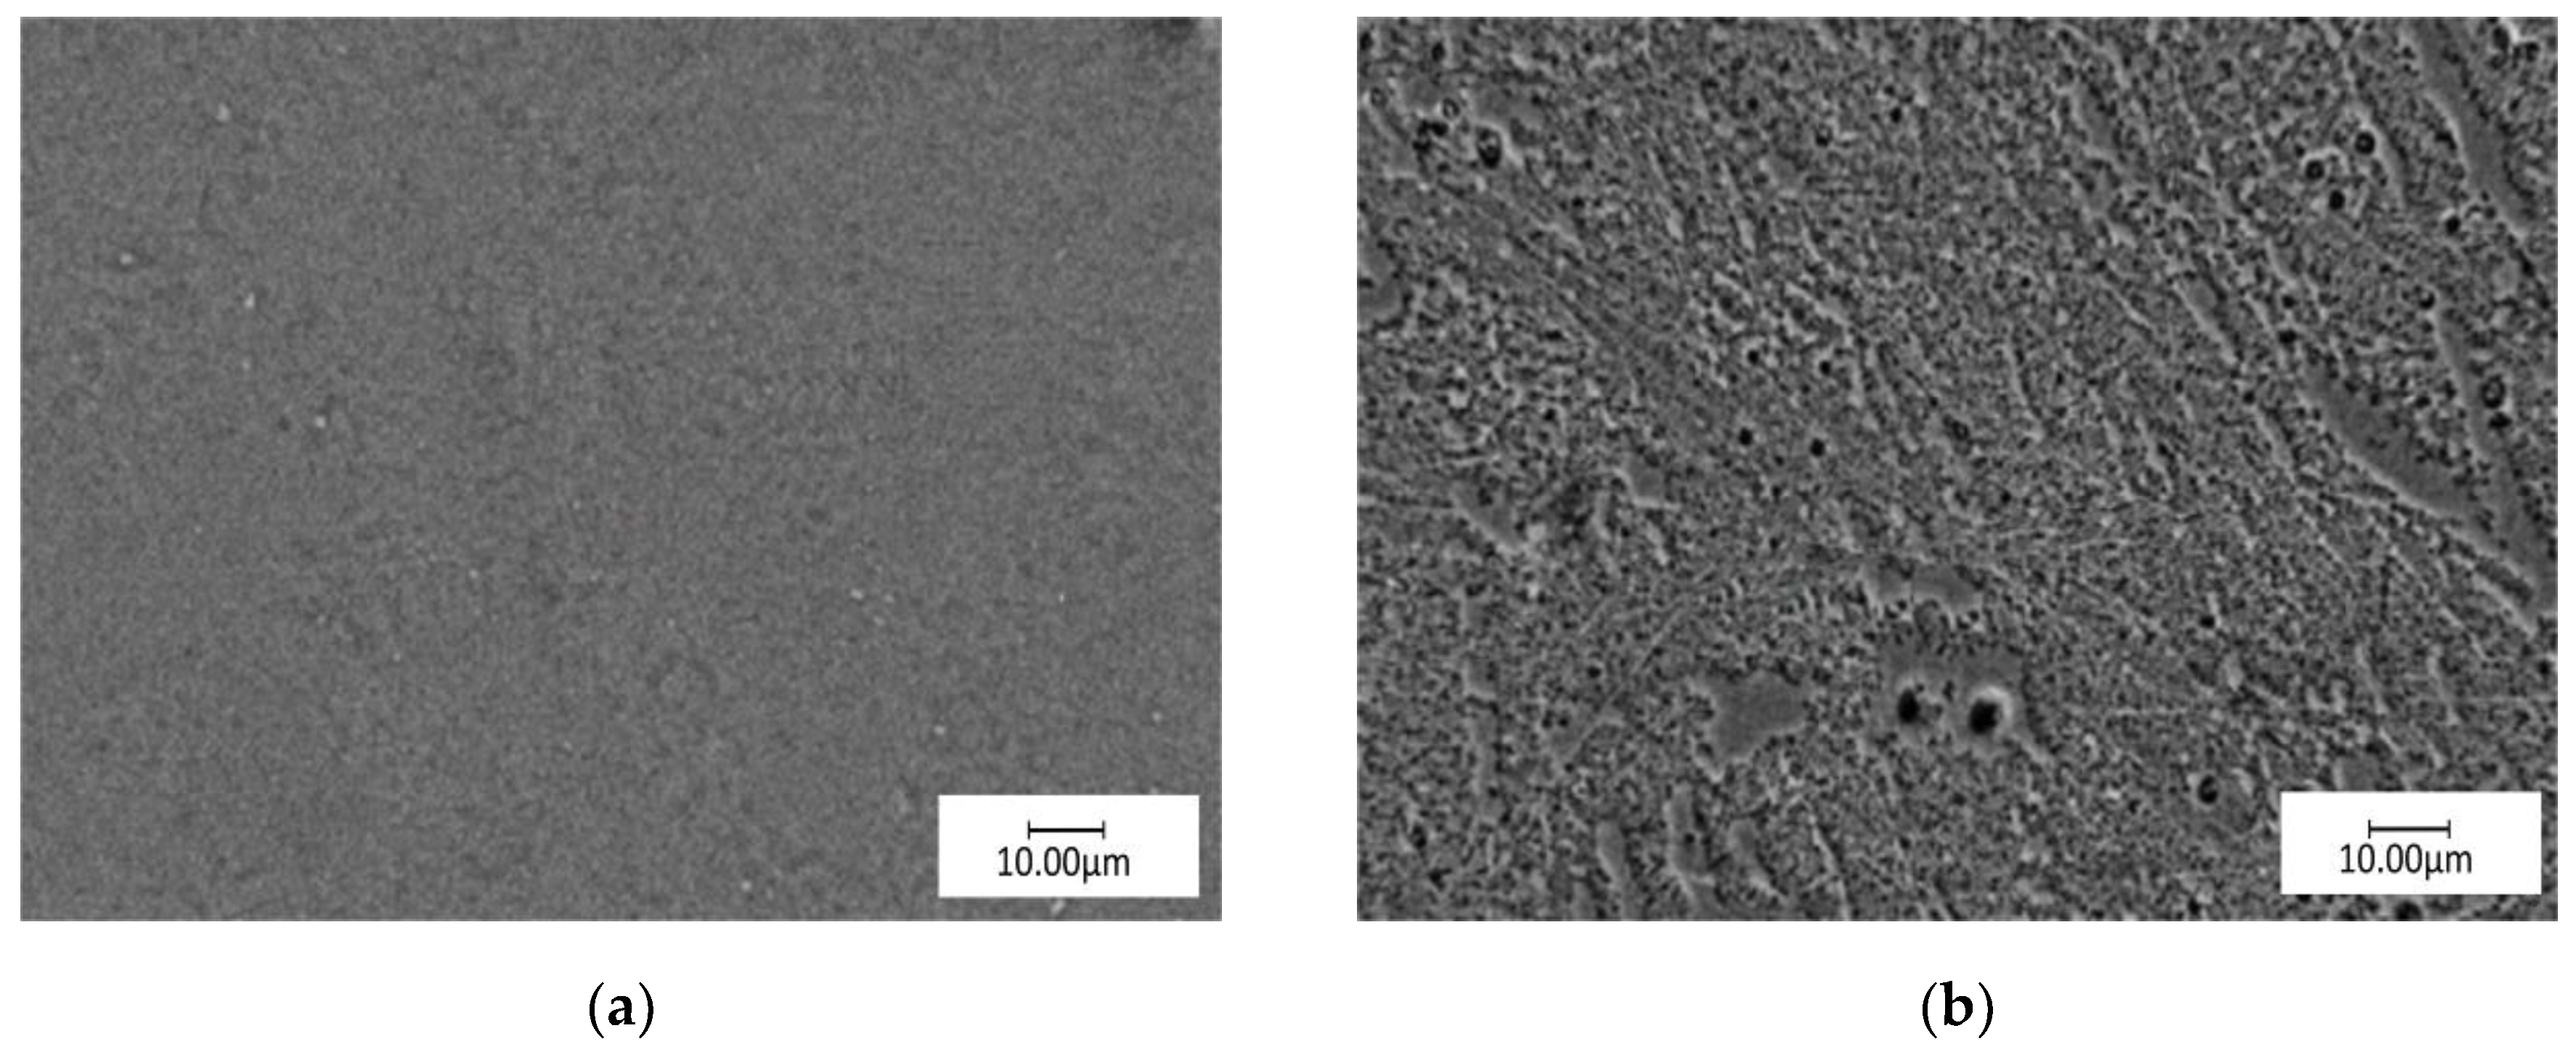
3.1. Surface Topography and Phase Analysis
3.2. Physicochemical and Electrochemical Properties Analysis
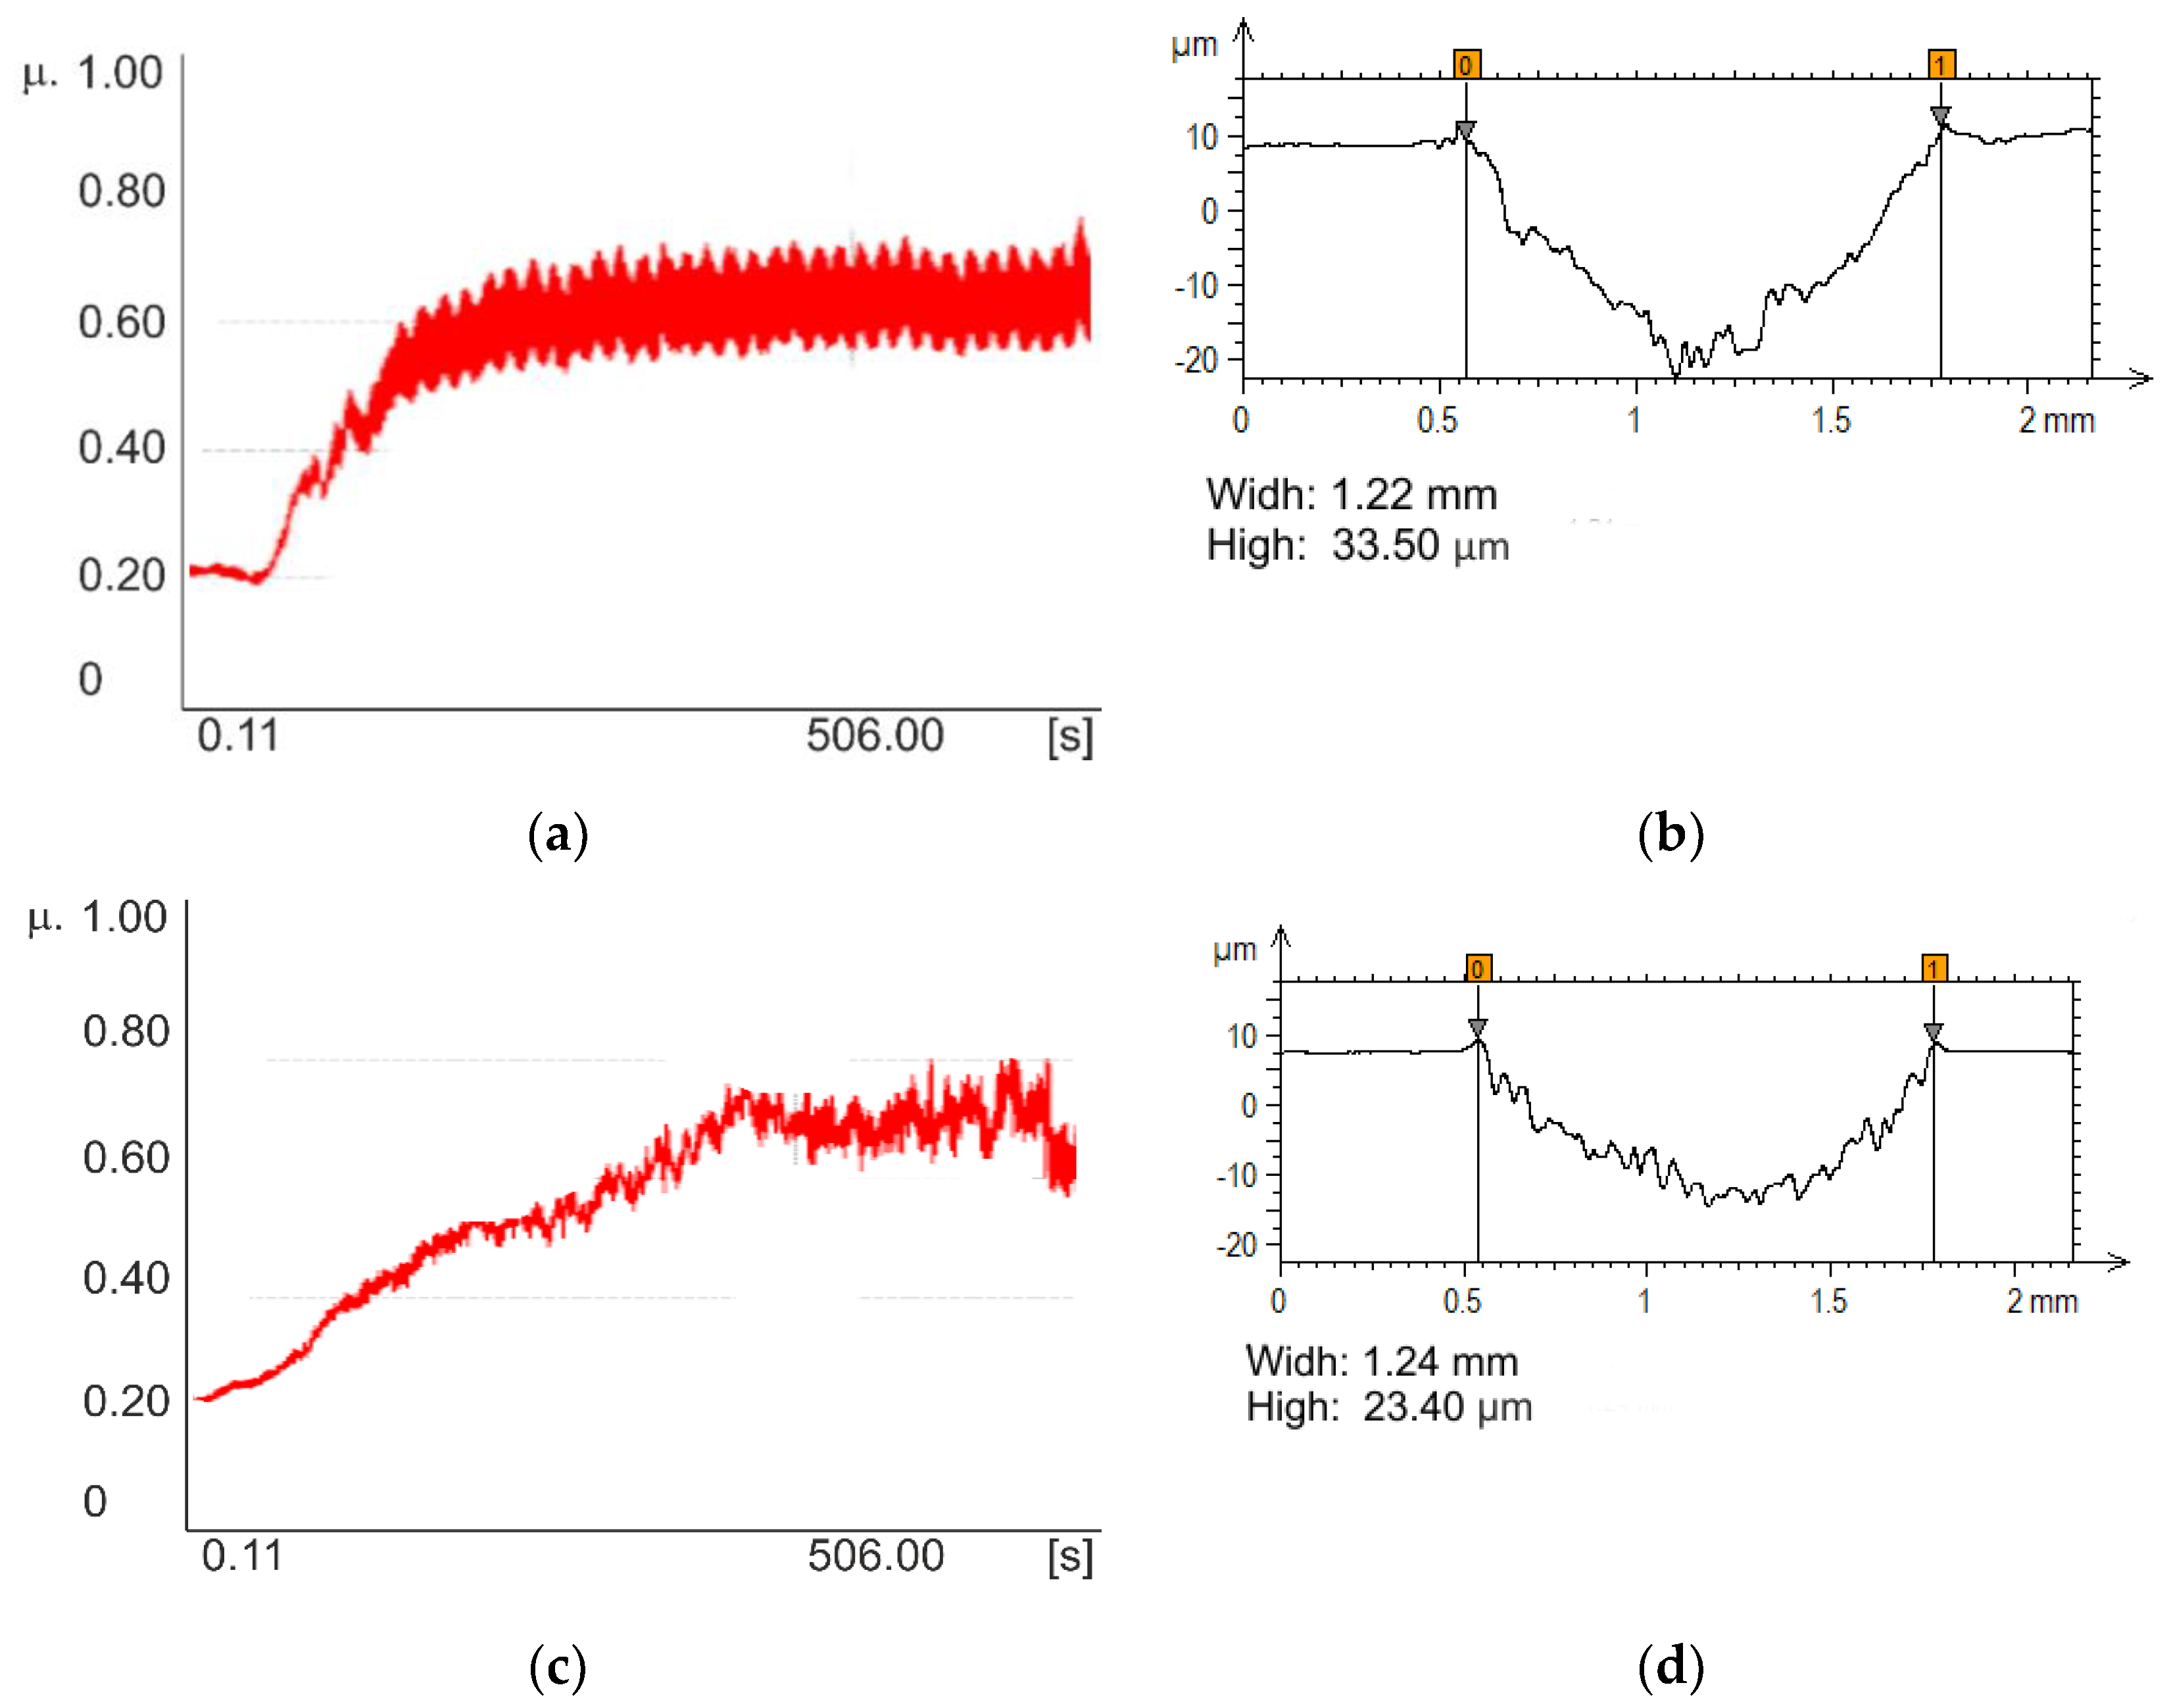
3.3. Wear Test
4. Discussion
5. Conclusions
Author Contributions
Funding
Conflicts of Interest
References
- Elias, C.N.; Fernandes, D.J.; De Souza, F.M.; Monteiro, E.D.S.; De Biasi, R.S. Mechanical and clinical properties of titanium and titanium-based alloys (Ti G2, Ti G4 cold worked nanostructured and Ti G5) for biomedical applications. J. Mater. Res. Technol. 2019, 8, 1060–1069. [Google Scholar] [CrossRef]
- Ivlev, I.; Vacek, J.; Kneppo, P. Multi-criteria decision analysis for supporting the selection of medical devices under uncertainty. Eur. J. Oper. Res. 2015, 247, 216–228. [Google Scholar] [CrossRef]
- Bazaka, K.; Jacob, M.V. Implantable devices: Issues and challenges. Electronics 2012, 2, 1–34. [Google Scholar] [CrossRef]
- Mavros, N.; Larimian, T.; Esqivel, J.; Gupta, R.K.; Contieri, R.; Borkar, T. Spark plasma sintering of low modulus titanium-niobium-tantalum-zirconium (TNTZ) alloy for biomedical applications. Mater. Des. 2019, 183, 108163. [Google Scholar] [CrossRef]
- Ramezannejad, A.; Xu, W.; Xiao, W.L.; Fox, K.; Liang, D.; Qian, M. New insights into nickel-free superelastic titanium alloys for biomedical applications. Curr. Opin. Solid State Mater. Sci. 2019, 23, 100783. [Google Scholar] [CrossRef]
- Attar, H.; Bermingham, M.J.; Ehtemam-Haghighi, S.; Dehghan-Manshadi, A.; Kent, D.; Dargusch, M.S. Evaluation of the mechanical and wear properties of titanium produced by three different additive manufacturing methods for biomedical application. Mater. Sci. Eng. A 2019, 760, 339–345. [Google Scholar] [CrossRef]
- Barman, A.; Das, M. Nano-finishing of bio-titanium alloy to generate different surface morphologies by changing magnetorheological polishing fluid compositions. Precis. Eng. 2018, 51, 145–152. [Google Scholar] [CrossRef]
- Ozdemir, Z.; Ozdemir, A.; Basim, G.B. Application of chemical mechanical polishing process on titanium based implants. Mater. Sci. Eng. C 2016, 68, 383–396. [Google Scholar] [CrossRef] [PubMed]
- Rao, S.; Astaneh, S.H.; Villanueva, J.; Silva, F.; Takoudis, C.; Bijukumar, D.; Souza, J.C.M.; Mathew, M.T. Physicochemical and in-vitro biological analysis of bio-functionalized titanium samples in a protein-rich medium. J. Mech. Behav. Biomed. Mater. 2019, 96, 152–164. [Google Scholar] [CrossRef] [PubMed]
- Hryniewicz, T.; Rokicki, R.; Rokosz, K. Corrosion and surface characterization of titanium biomaterial after magnetoelectropolishing. Surf. Coat. Technol. 2009, 203, 1508–1515. [Google Scholar] [CrossRef]
- Raikar, S.; Talukdar, P.; Kumari, S.; Panda, S.K.; Oommen, V.M.; Prasad, A. Factors affecting the survival rate of dental implants: A retrospective study. J. Int. Soc. Prev. Community Dent. 2017, 7, 351–355. [Google Scholar] [CrossRef] [PubMed]
- Salem, K.H.; Lindner, N.; Tingart, M.; Elmoghazy, A.D. Severe metallosis-related osteolysis as a cause of failure after total knee replacement. J. Clin. Orthop. Trauma. 2020, 11, 165–170. [Google Scholar] [CrossRef] [PubMed]
- Magone, K.; Luckenbill, D.; Goswami, T. Metal ions as inflammatory initiators of osteolysis. Arch. Orthop. Trauma Surg. 2015, 135, 683–695. [Google Scholar] [CrossRef] [PubMed]
- Veiko, V.P.; Odintsova, G.V.; Gazizova, M.Y.; Karlagina, Y.Y.; Manokhin, S.S.; Yatsuk, R.M.; Vasilkov, S.D.; Kolobov, Y.R. The influence of laser micro- and nanostructuring on the wear resistance of Grade-2 titanium surface. Laser Phys. 2018, 28, 086002. [Google Scholar] [CrossRef]
- Babis, G.C.; Stavropoulos, N.A.; Sasalos, G.; Ochsenkuehn-Petropoulou, M.; Megas, P. Metallosis and elevated serum levels of tantalum following failed revision hip arthroplasty-A case report. Acta Orthop. 2014, 85, 677–680. [Google Scholar] [CrossRef]
- Prasad, K.; Bazaka, O.; Chua, M.; Rochford, M.; Fedrick, L.; Spoor, J.; Symes, R.; Tieppo, M.; Collins, C.; Markwll, D.; et al. Metallic biomaterials: Current challenges and opportunities. Materials 2017, 10, 884. [Google Scholar] [CrossRef]
- Souza, J.C.M.; Barbosa, S.L.; Ariza, E.A.; Henriques, M.; Teughels, W.; Ponthiaux, P.; Celis, J.P.; Rocha, L.A. How do titanium and Ti6Al4V corrode in fluoridated medium as found in the oral cavity? An in vitro study. Mater. Sci. Eng. C 2015, 47, 384–393. [Google Scholar] [CrossRef]
- Çelik, I. Influence of CrN Coating on Electrochemical Behavior of Plasma Nitrided Pure Titanium in Bio-simulated Environment. J. Bionic Eng. 2016, 13, 150–155. [Google Scholar] [CrossRef]
- Zhao, X.; Liu, H.; Li, S.; Wang, X.; Sheng, Y.; Zhang, P.; Li, W. Combined effect of TiN coating and surface texture on corrosion-wear behavior of selective laser melted CP-titanium in simulated body fluid. J. Alloys Compd. 2020, 816, 152667. [Google Scholar] [CrossRef]
- Pedrosa, P.; Alves, E.; Barradas, N.P.; Fiedler, P.; Haueisen, J.; Vaz, F.; Fonseca, C. TiN x coated polycarbonate for bio-electrode applications. Corros. Sci. 2012, 56, 49–57. [Google Scholar] [CrossRef]
- Rupp, F.; Scheideler, L.; Eichler, M.; Geis-Gerstorfer, J. Wetting behavior of dental implants. Int. J. Oral Maxillofac. Implant. 2011, 26, 1256–1266. [Google Scholar]
- Gittens, R.A.; Olivares-Navarrete, R.; Cheng, A.; Anderson, D.M.; McLachlan, T.; Stephan, I.; Geis-Gerstorfer, J.; Sandhage, K.H.; Fedorov, A.G.; Rupp, F.; et al. The roles of titanium surface micro/nanotopography and wettability on the differential response of human osteoblast lineage cells. Acta Biomater. 2013, 9, 6268–6277. [Google Scholar] [CrossRef]
- Wennerberg, A.; Albrektsson, T. Effects of titanium surface topography on bone integration: A systematic review. Clin. Oral Implant. Res. 2009, 20, 172–184. [Google Scholar] [CrossRef]
- Erdemir, A. Review of engineered tribological interfaces for improved boundary lubrication. Tribol. Int. 2005, 38, 249–256. [Google Scholar] [CrossRef]
- Fage, S.W.; Muris, J.; Jakobsen, S.S.; Thyssen, J.P. Titanium: A review on exposure, release, penetration, allergy, epidemiology, and clinical reactivity. Contact Dermat. 2016, 74, 323–345. [Google Scholar] [CrossRef]
- Etsion, I. Improving tribological performance of mechanical components by laser surface texturing. Tribol. Lett. 2004, 17, 733–737. [Google Scholar] [CrossRef]
- Grabowski, A.; Sozańska, M.; Adamiak, M.; Kępińska, M.; Florian, T. Laser surface texturing of Ti6Al4V alloy, stainless steel and aluminium silicon alloy. Appl. Surf. Sci. 2018, 461, 117–123. [Google Scholar] [CrossRef]
- Quirynen, M.; Al-Nawas, B.; Meijer, H.J.A.; Razavi, A.; Reichert, T.E.; Schimmel, M.; Storelli, S.; Romeo, E.; Bräuer, I.; Castro-Laza, J. Small-diameter titanium Grade IV and titanium-zirconium implants in edentulous mandibles: Three-year results from a double-blind, randomized controlled trial. Clin. Oral Implants Res. 2015, 26, 831–840. [Google Scholar] [CrossRef] [PubMed]
- Cordeiro, J.M.; Barão, V.A.R. Is there scientific evidence favoring the substitution of commercially pure titanium with titanium alloys for the manufacture of dental implants? Mater. Sci. Eng. C 2017, 71, 1201–1215. [Google Scholar] [CrossRef] [PubMed]
- Mareci, D.; Bocanu, C.; Nemtoi, G.; Aelenei, D. Electrochemical behaviour of titanium alloys in artificial saliva. J. Serb. Chem. Soc. 2005, 70, 891–897. [Google Scholar] [CrossRef]
- Hong, M.-H.; Min, B.; Kwon, T.-Y. Fabricating High-Quality 3D-Printed Alloys for Dental Applications. Appl. Sci. 2017, 7, 710. [Google Scholar] [CrossRef]
- Cosma, C.; Kessler, J.; Gebhardt, A.; Campbell, I.; Balc, N. Improving the mechanical strength of dental applications and lattice structures SLM processed. Materials 2020, 13, 905. [Google Scholar] [CrossRef] [PubMed]
- Vlacic-Zischke, J.; Hamlet, S.M.; Friis, T.; Tonetti, M.S.; Ivanovski, S. The influence of surface microroughness and hydrophilicity of titanium on the up-regulation of TGFβ/BMP signalling in osteoblasts. Biomaterials 2011, 32, 665–671. [Google Scholar] [CrossRef] [PubMed]
- Olivares-Navarrete, R.; Hyzy, S.L.; Hutton, D.L.; Erdman, C.P.; Wieland, M.; Boyan, B.D.; Schwartz, Z. Direct and indirect effects of microstructured titanium substrates on the induction of mesenchymal stem cell differentiation towards the osteoblast lineage. Biomaterials 2010, 31, 2728–2735. [Google Scholar] [CrossRef] [PubMed]
- Sotniczuk, A.; Heise, S.; Topolski, K.; Garbacz, H.; Boccaccini, A.R. Chitosan/bioactive glass coatings as a protective layer against corrosion of nanocrystalline titanium under simulated inflammation. Mater. Lett. 2020, 264, 127284. [Google Scholar] [CrossRef]
- Liu, J.; Zhang, L.; Mu, X.; Zhang, P. Studies of electrochemical corrosion of low alloy steel under epoxy coating exposed to natural seawater using the WBE and EIS techniques. Prog. Org. Coat. 2017, 111, 315–321. [Google Scholar] [CrossRef]
- Shanaghi, A.; Chu, P.K. Investigation of corrosion mechanism of NiTi modified by carbon plasma immersion ion implantation (C-PIII) by electrochemical impedance spectroscopy. J. Alloys Compd. 2019, 790, 1067–1075. [Google Scholar] [CrossRef]
- Ribeiro, D.V.; Abrantes, J.C.C. Application of electrochemical impedance spectroscopy (EIS) to monitor the corrosion of reinforced concrete: A new approach. Constr. Build. Mater. 2016, 111, 98–104. [Google Scholar] [CrossRef]
- Liverani, E.; Toschi, S.; Ceschini, L.; Fortunato, A. Effect of selective laser melting (SLM) process parameters on microstructure and mechanical properties of 316L austenitic stainless steel. J. Mater. Process. Technol. 2017, 249, 255–263. [Google Scholar] [CrossRef]
- Guo, P.; Zou, B.; Huang, C.; Gao, H. Study on microstructure, mechanical properties and machinability of efficiently additive manufactured AISI 316L stainless steel by high-power direct laser deposition. J. Mater. Process. Technol. 2017, 240, 12–22. [Google Scholar] [CrossRef]
- Gao, W.; Zhang, Y.; Ramanujan, D.; Ramani, K.; Chen, Y.; Williams, C.B.; Wang, C.C.L.; Shin, Y.C.; Zhang, S.; Zavattieri, P.D. The status, challenges, and future of additive manufacturing in engineering. CAD Comput. Aided Des. 2015, 69, 65–89. [Google Scholar] [CrossRef]
- Stwora, A.; Skrabalak, G. Influence of selected parameters of Selective Laser Sintering process on properties of sintered materials Manufacturing and processing. Mater. Sci. 2013, 61, 375–380. [Google Scholar]
- Ziębowicz, A.; Woźniak, A.; Ziębowicz, B.; Adamiak, M.; Boryło, P. Microstructure and properties of CoCr alloys used in prosthetics procedure. Arch. Mater. Sci. Eng. 2018, 89, 20–26. [Google Scholar] [CrossRef]
- Wang, Y.; Ke, C.; Wu, T.; Zhao, X.; Wang, R. Nanosecond laser texturing with hexagonal honeycomb micro-structure on Titanium for improved wettability and optical properties. Optik (Stuttg) 2019, 192, 162953. [Google Scholar] [CrossRef]
- Yu, Z.; Yang, G.; Zhang, W.; Hu, J. Investigating the effect of picosecond laser texturing on microstructure and biofunctionalization of titanium alloy. J. Mater. Process. Technol. 2018, 255, 129–136. [Google Scholar] [CrossRef]
- Nuckowski, P.M.; Wróbel, T. The influence of variable parameters of horizontal continuous casting on the structure of AlCu4MgSi alloy ingots. Arch. Foundry Eng. 2018, 18, 196–202. [Google Scholar] [CrossRef]
- Nuckowski, P.M. Texture and residual stresses in the cusn6 alloy subjected to intense plastic deformation. Arch. Metall. Mater. 2018, 63, 241–245. [Google Scholar] [CrossRef]
- Ziębowicz, A.; Woźniak, A.; Ziębowicz, B. The Influence of Technology on the Physicochemical and Electrochemical Properties of the Prosthetic Materials; Springer: Berlin, Germany, 2018; pp. 349–357. [Google Scholar]
- Firlik, S. Comparison of methods for the surface free energy determination of polimeric layers aligning liquid crystals (in polish). Chemik 2010, 64, 238–245. [Google Scholar]
- ISO 3685-Tools Life Testing with Singer-Point Turning Tools; PN-EN ISO 10993-15:2019. Biological evaluation of medical devices. Part 15: Identification and quantification of degradation products from metals and alloys; International Organization for Standardization: Geneva, Switzerland, 1993.
- Amado, J.M.; Rodríguez, A.; Montero, J.N.; Tobar, M.J.; Yáñez, A. A comparison of laser deposition of commercially pure titanium using gas atomized or Ti sponge powders. Surf. Coat. Technol. 2019, 374, 253–263. [Google Scholar] [CrossRef]
- Giannelli, M.; Bani, D.; Tani, A.; Materassi, F.; Chellini, F.; Sassoli, C. Effects of an Erbium:Yttrium-Aluminum-Garnet Laser and Ultrasonic Scaler on Titanium Dioxide-Coated Titanium Surfaces Contaminated With Subgingival Plaque: An In Vitro Study to Assess Post-Treatment Biocompatibility With Osteogenic Cells. J. Periodontol. 2017, 88, 1211–1220. [Google Scholar] [CrossRef]
- Li, K.; Yao, W.; Xie, Y.; Zhang, J.; Li, B.; Wan, Z.; Zhang, Z.; Lu, L.; Tang, Y. A strongly hydrophobic and serum-repelling surface composed of CrN films deposited on laser-patterned microstructures that was optimized with an orthogonal experiment. Surf. Coat. Technol. 2020, 391, 125708. [Google Scholar] [CrossRef]
- Tang, D.; Chen, H.; Xiao, W.; Deng, H.; Zou, S.; Ren, Y.; Lei, M.; Zhou, X. Substrate bias effects on mechanical properties and high temperature oxidation performance of sputtered TiN-coated Zr-4. J. Nucl. Mater. 2019, 524, 330–339. [Google Scholar] [CrossRef]
- Chen, Y.; Wang, S.; Hao, Y.; Pu, J.; Jiang, X.; Huang, L.F.; Wang, L. Friction and Wear Behavior of CrN Coating on 316L Stainless Steel in Liquid Sodium at Elevated Temperature. Tribol. Int. 2020, 143, 106079. [Google Scholar] [CrossRef]
- Nolan, D.; Huang, S.W.; Leskovsek, V.; Braun, S. Sliding wear of titanium nitride thin films deposited on Ti-6Al-4V alloy by PVD and plasma nitriding processes. Surf. Coat. Technol. 2006, 200, 5698–5705. [Google Scholar] [CrossRef]
- Cai, Y.; Luo, X.; Maclean, M.; Qin, Y.; Duxbury, M.; Ding, F. A single-step fabrication approach for development of antimicrobial surfaces. J. Mater. Process. Technol. 2019, 271, 249–260. [Google Scholar] [CrossRef]
- Raun, A.; Saklayen, N.; Zgrabik, C.; Shen, W.; Madrid, M.; Huber, M.; Hu, E.; Mazur, E. A comparison of inverted and upright laser-activated titanium nitride micropyramids for intracellular delivery. Sci. Rep. 2018, 8, 1–9. [Google Scholar] [CrossRef]
- Voevodin, A.A.; Zabinski, J.S. Laser surface texturing for adaptive solid lubrication. Wear 2006, 261, 1285–1292. [Google Scholar] [CrossRef]
- Ma, T.; Ge, X.; Zhang, Y.; Lin, Y. Effect of Titanium Surface Modifications of Dental Implants on Rapid Osseointegration. In Interface Oral Health Science 2016; Springer: Singapore, 2017; pp. 247–256. [Google Scholar]
- Pfleging, W.; Kumari, R.; Besser, H.; Scharnweber, T.; Majumdar, J.D. Laser surface textured titanium alloy (Ti-6Al-4V): Part 1-Surface characterization. Appl. Surf. Sci. 2015, 355, 104–111. [Google Scholar] [CrossRef]
- Chibowski, E.; Jurak, M. Comparison of contact angle hysteresis of different probe liquids on the same solid surface. Colloid Polym. Sci. 2013, 291, 391–399. [Google Scholar] [CrossRef]
- Van Loosdrecht, W.; Mark, C.M.; Norde, W.; Zehnder, A.J.B. Physical Chemical Description of Bacterial Adhesion. J. Biomater. Appl. 1990, 5, 91–106. [Google Scholar] [CrossRef]
- Kochkodan, V.; Tsarenko, S.; Potapchenko, N.; Kosinova, V.; Goncharuk, V. Adhesion of microorganisms to polymer membranes: A photobactericidal effect of surface treatment with TiO2. Desalination 2008, 220, 380–385. [Google Scholar] [CrossRef]
- Giaouris, E.; Chapot-Chartier, M.P.; Briandet, R. Surface physicochemical analysis of natural Lactococcus lactis strains reveals the existence of hydrophobic and low charged strains with altered adhesive properties. Int. J. Food Microbiol. 2009, 131, 2–9. [Google Scholar] [CrossRef]
- Borecká-Melkusová, S.; Bujdáková, H. Variation of cell surface hydrophobicity and biofilm formation among genotypes of Candida albicans and Candida dubliniensis under antifungal treatment. Can. J. Microbiol. 2008, 54, 718–724. [Google Scholar] [CrossRef] [PubMed]
- Yue, T.M.; Cheung, T.M.; Man, H.C. Effects of laser surface treatment on the corrosion properties of Ti-6Al-4V alloy in Hank’s solution. J. Mater. Sci. Lett. 2000, 19, 205–208. [Google Scholar] [CrossRef]
- Kumari, R.; Scharnweber, T.; Pfleging, W.; Besser, H.; Majumdar, J.D. Laser surface textured titanium alloy (Ti-6Al-4V)-Part II-Studies on bio-compatibility. Appl. Surf. Sci. 2015, 357, 750–758. [Google Scholar] [CrossRef]
- Yang, B.; Uchida, M.; Kim, H.M.; Zhang, X.; Kokubo, T. Preparation of bioactive titanium metal via anodic oxidation treatment. Biomaterials 2004, 25, 1003–1010. [Google Scholar] [CrossRef]


| Ti | Fe | O | C | N | H |
|---|---|---|---|---|---|
| 99.70 | 0.03 | 0.11 | 0.01 | ≤0.01 | 0.02 |
| Parameters | Value | Density of the Tested Samples ρ, [g/cm3] |
|---|---|---|
| Laser power P, [W] | 200 | 4.31 ± 0.02 |
| Scanning speed SP, [mm/s] | 1333 | |
| Layer thickness t, [µm] | 25 | |
| Poind Distance PD, [µm] | 80 | |
| Energy Density E, [J/mm3] | 75 |
| Cutting Speed | Frequency | Laser Power at Laser Head | Etching Speed | Beam Width | M2 |
|---|---|---|---|---|---|
| 1 mm/s | 400 Hz | 48 mW | 1 mm/s | ~30 µm | <1.2 |
| No. | Name | Surface Treatment |
|---|---|---|
| 1 | M1 | Initial state |
| 2 | M2 | Initial state + CrN |
| 2 | M3 | Initial state + TiN |
| 4 | M4 | Initial state + CrN + texturing |
| 5 | M5 | Initial state + TiN + texturing |
| SFE, [mJ/m2] | |||
|---|---|---|---|
| γL | |||
| Distilled water | 72.80 | 21.80 | 51.00 |
| Diiodonomethane | 50.80 | 50.80 | 0 |
| No. | Name | Area, [µm] | Ra, [nm] | Rq (RMS), [nm] | ∆Zmax, [nm] |
|---|---|---|---|---|---|
| 1 | M1 | 25 × 25 | 84 ± 14 | 98 ± 16 | 377 ± 98 |
| 2 | M2 | 25 × 25 | 187 ± 24 | 220 ± 31 | 966 ± 105 |
| 3 | M3 | 25 × 25 | 42 ± 9 | 82 ± 10 | 162 ± 20 |
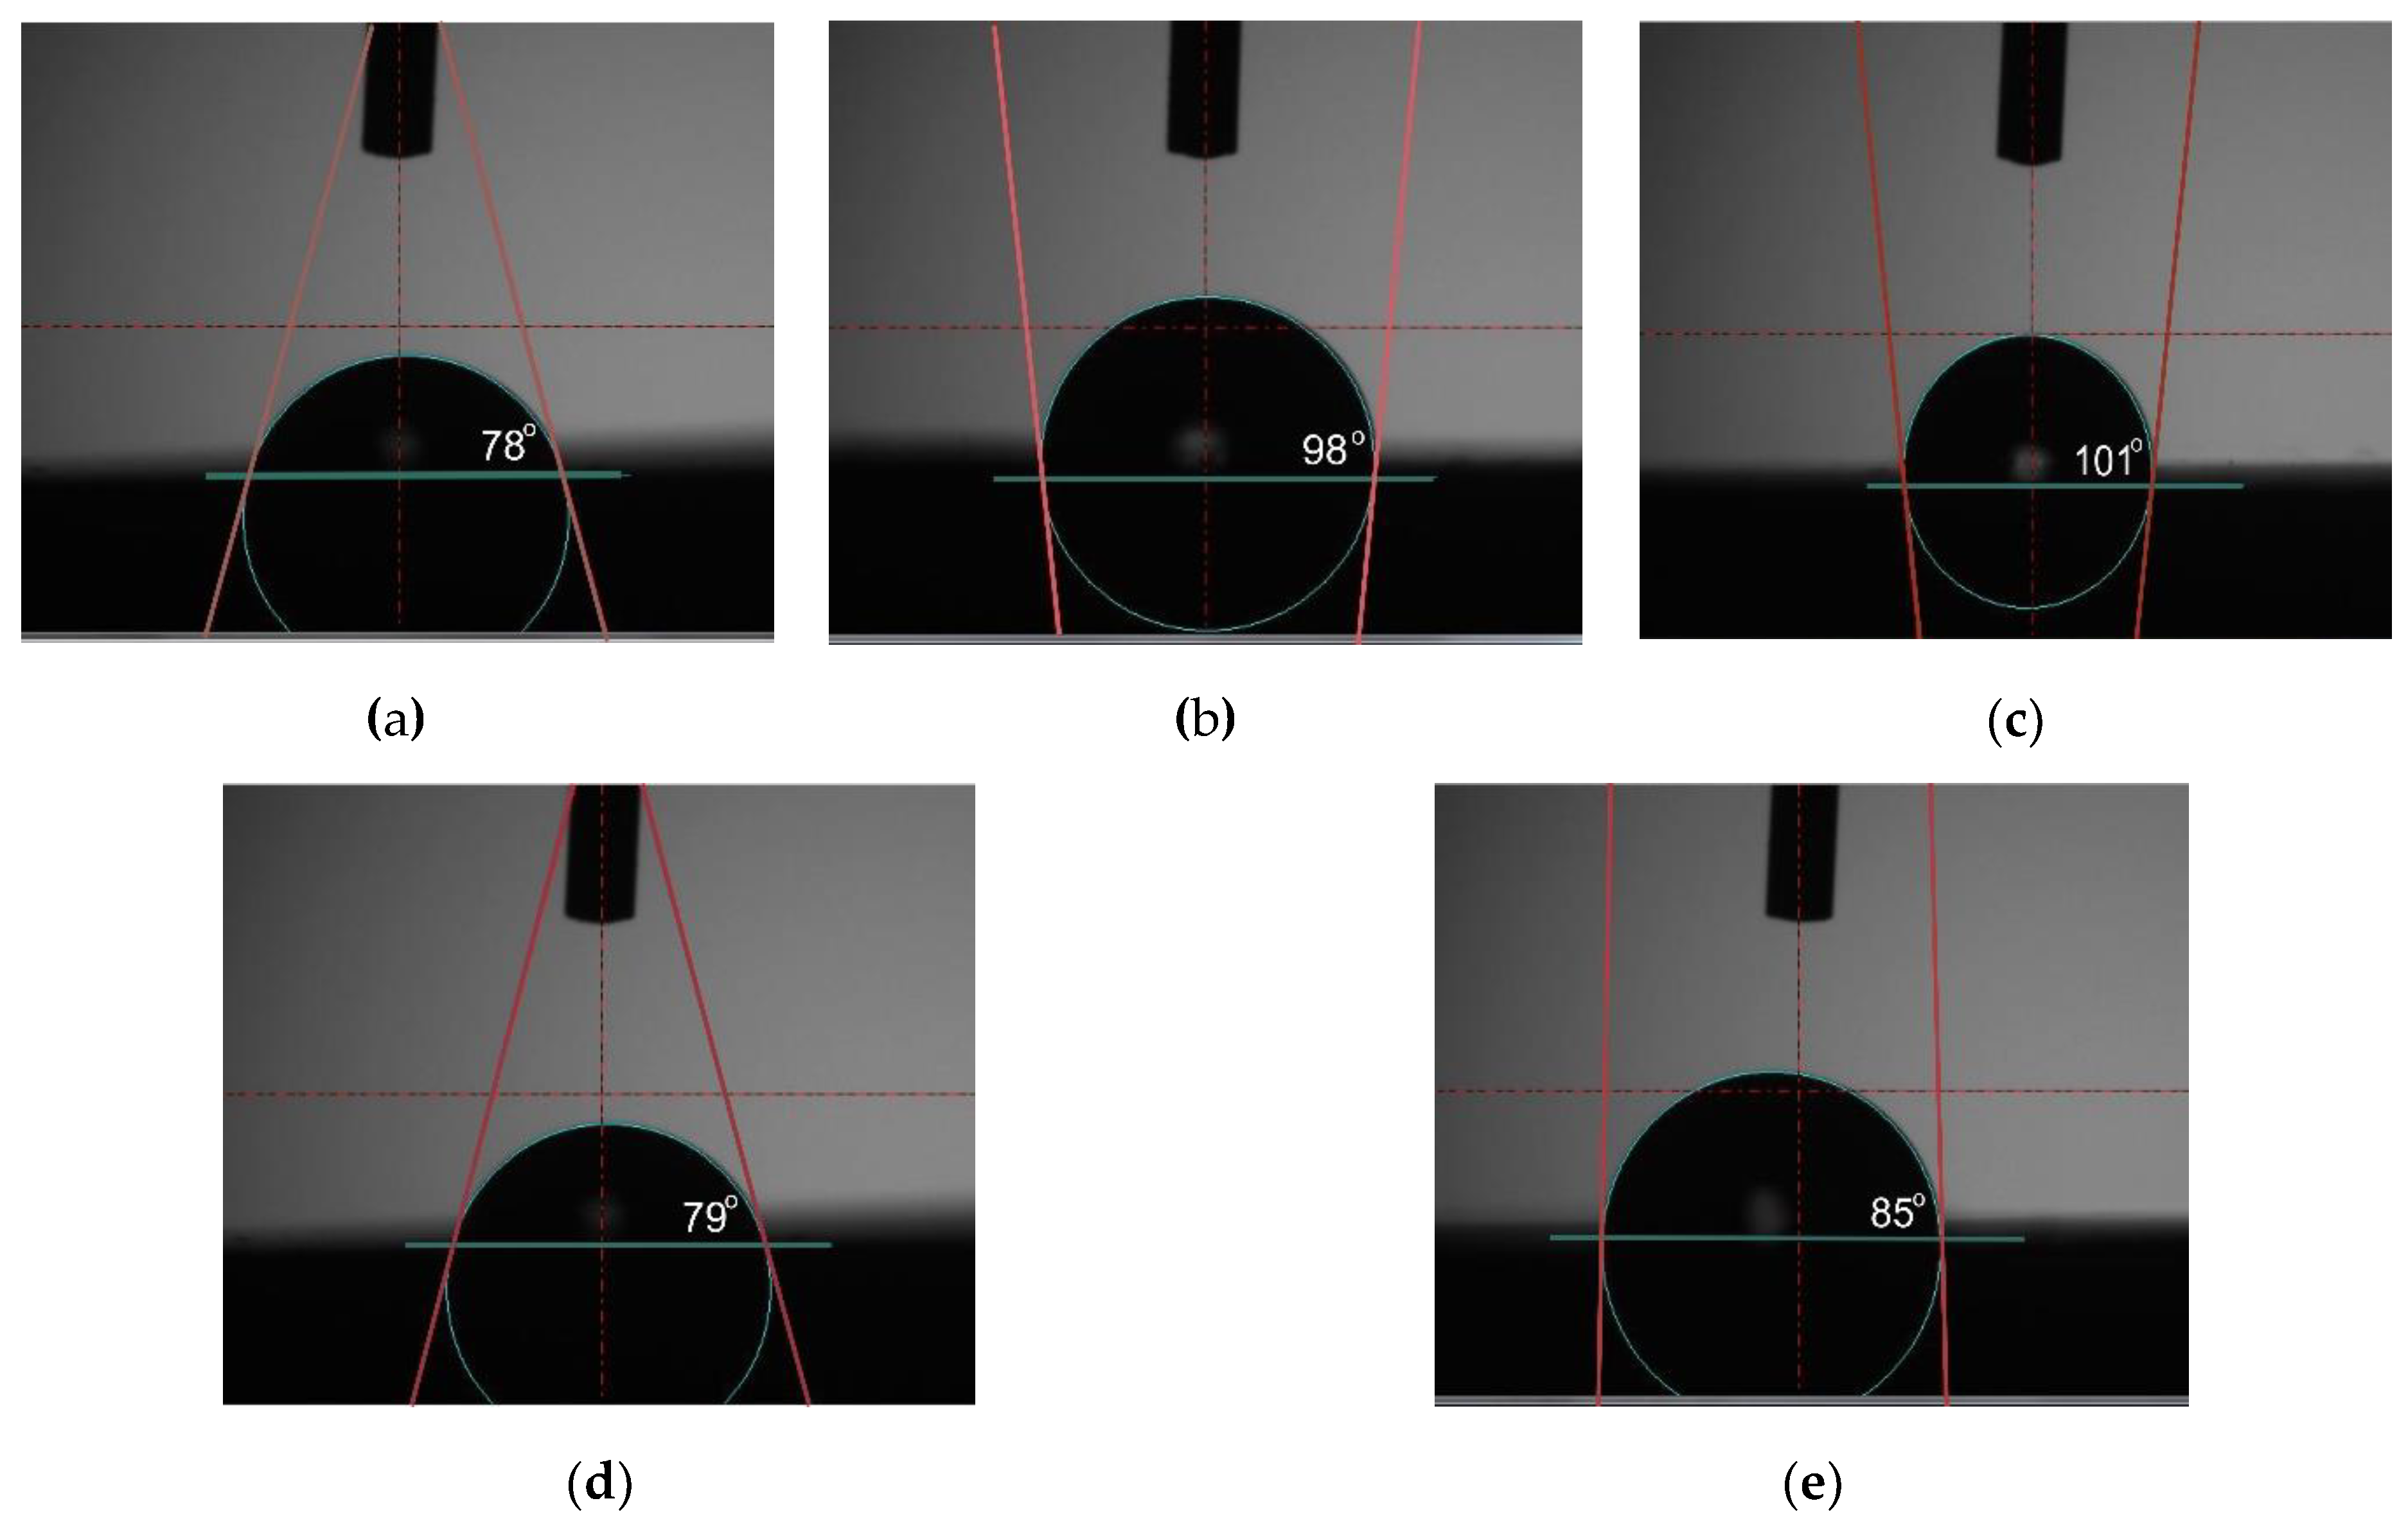
| No. | Name | Wetting Angle, [°] | Surface Free Energy, [mJ/m2] | |||
|---|---|---|---|---|---|---|
| Distilled Water | Diiodonomethane | γS | ||||
| 1 | M1 | 78 ± 10 | 51 ± 9 | 44 | 25 | 10 |
| 2 | M2 | 98 ± 8 | 47 ± 10 | 31 | 21 | 5 |
| 3 | M3 | 101 ± 12 | 47 ± 10 | 33 | 17 | 4 |
| 4 | M4 | 79 ± 7 | 45 ± 7 | 37 | 36 | 8 |
| 5 | M5 | 85 ± 11 | 44 ± 6 | 37 | 32 | 6 |
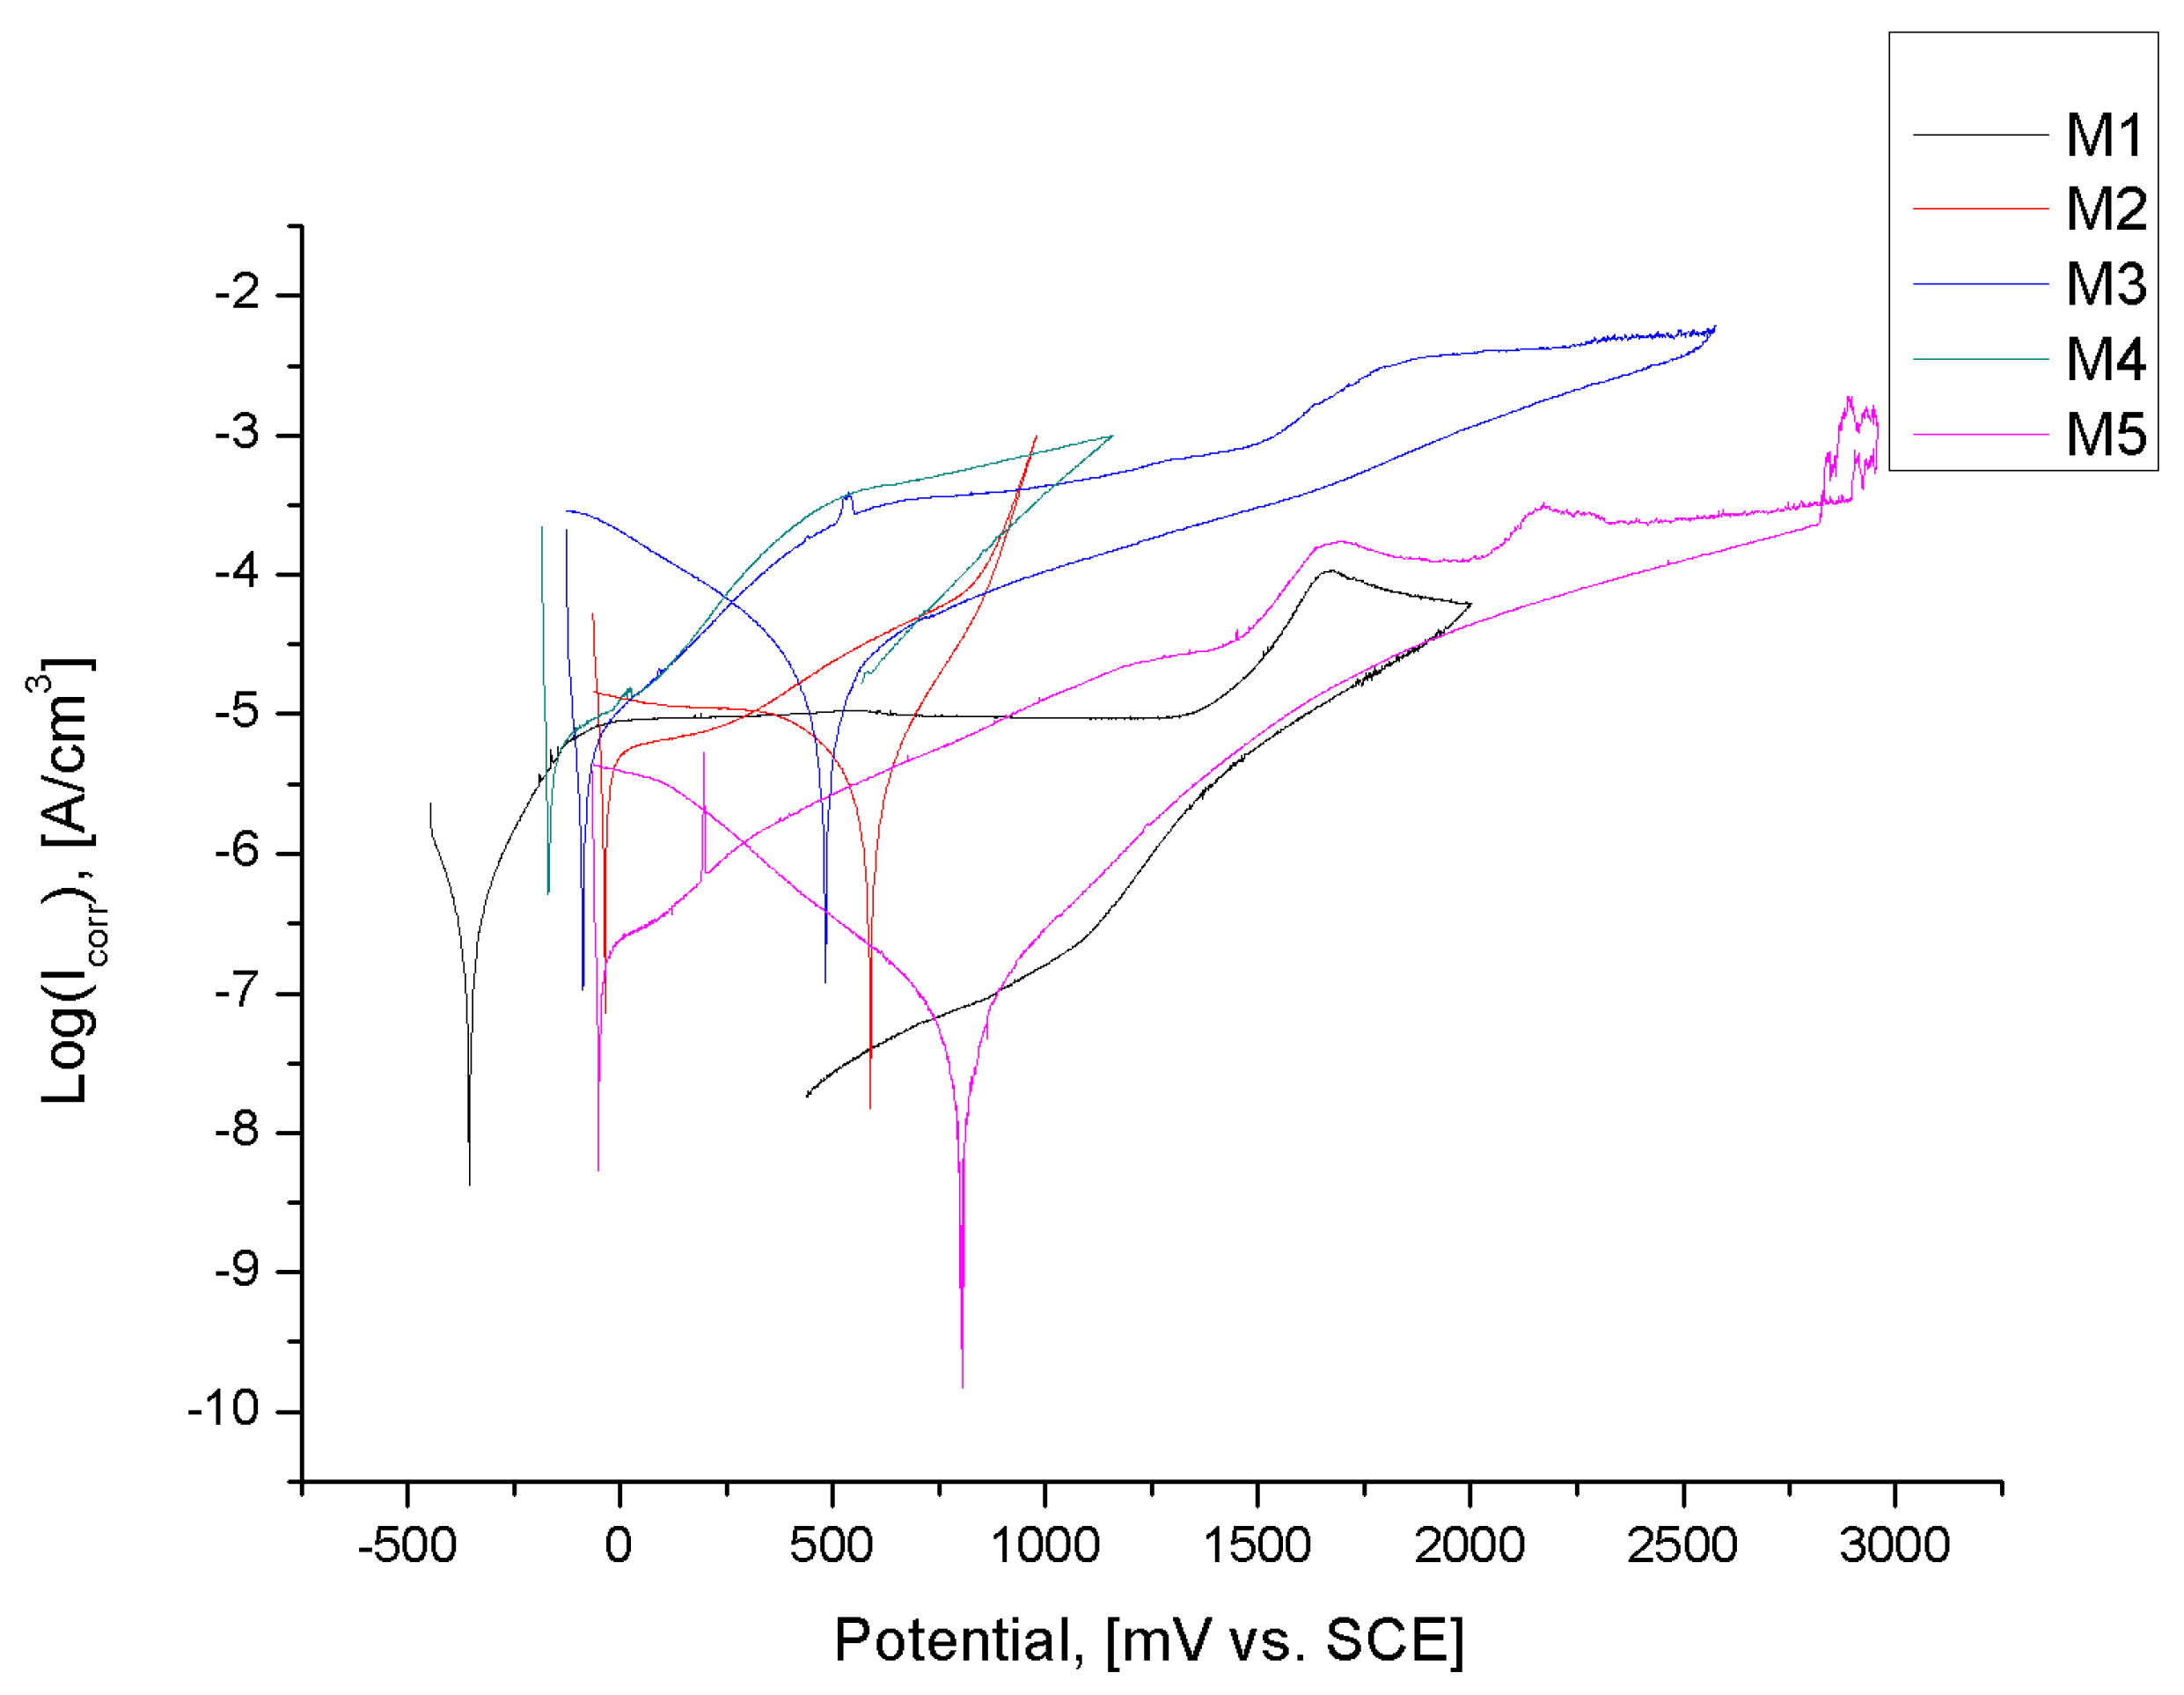
| No. | Name | Ecorr, [mV] | Eb, [mV] | Ecp, [mV] | Etr, [mV] |
|---|---|---|---|---|---|
| 1 | M1 | −355 ± 52 | 1709 ± 87 | 1379 ± 87 | - |
| 2 | M2 | −258 ± 21 | - | - | 1088 ± 87 |
| 3 | M3 | −91 ± 14 | - | - | 2572 ± 102 |
| 4 | M4 | −57 ± 11 | - | - | 1104 ± 95 |
| 5 | M5 | −43 ± 12 | - | - | 3052 ± 143 |
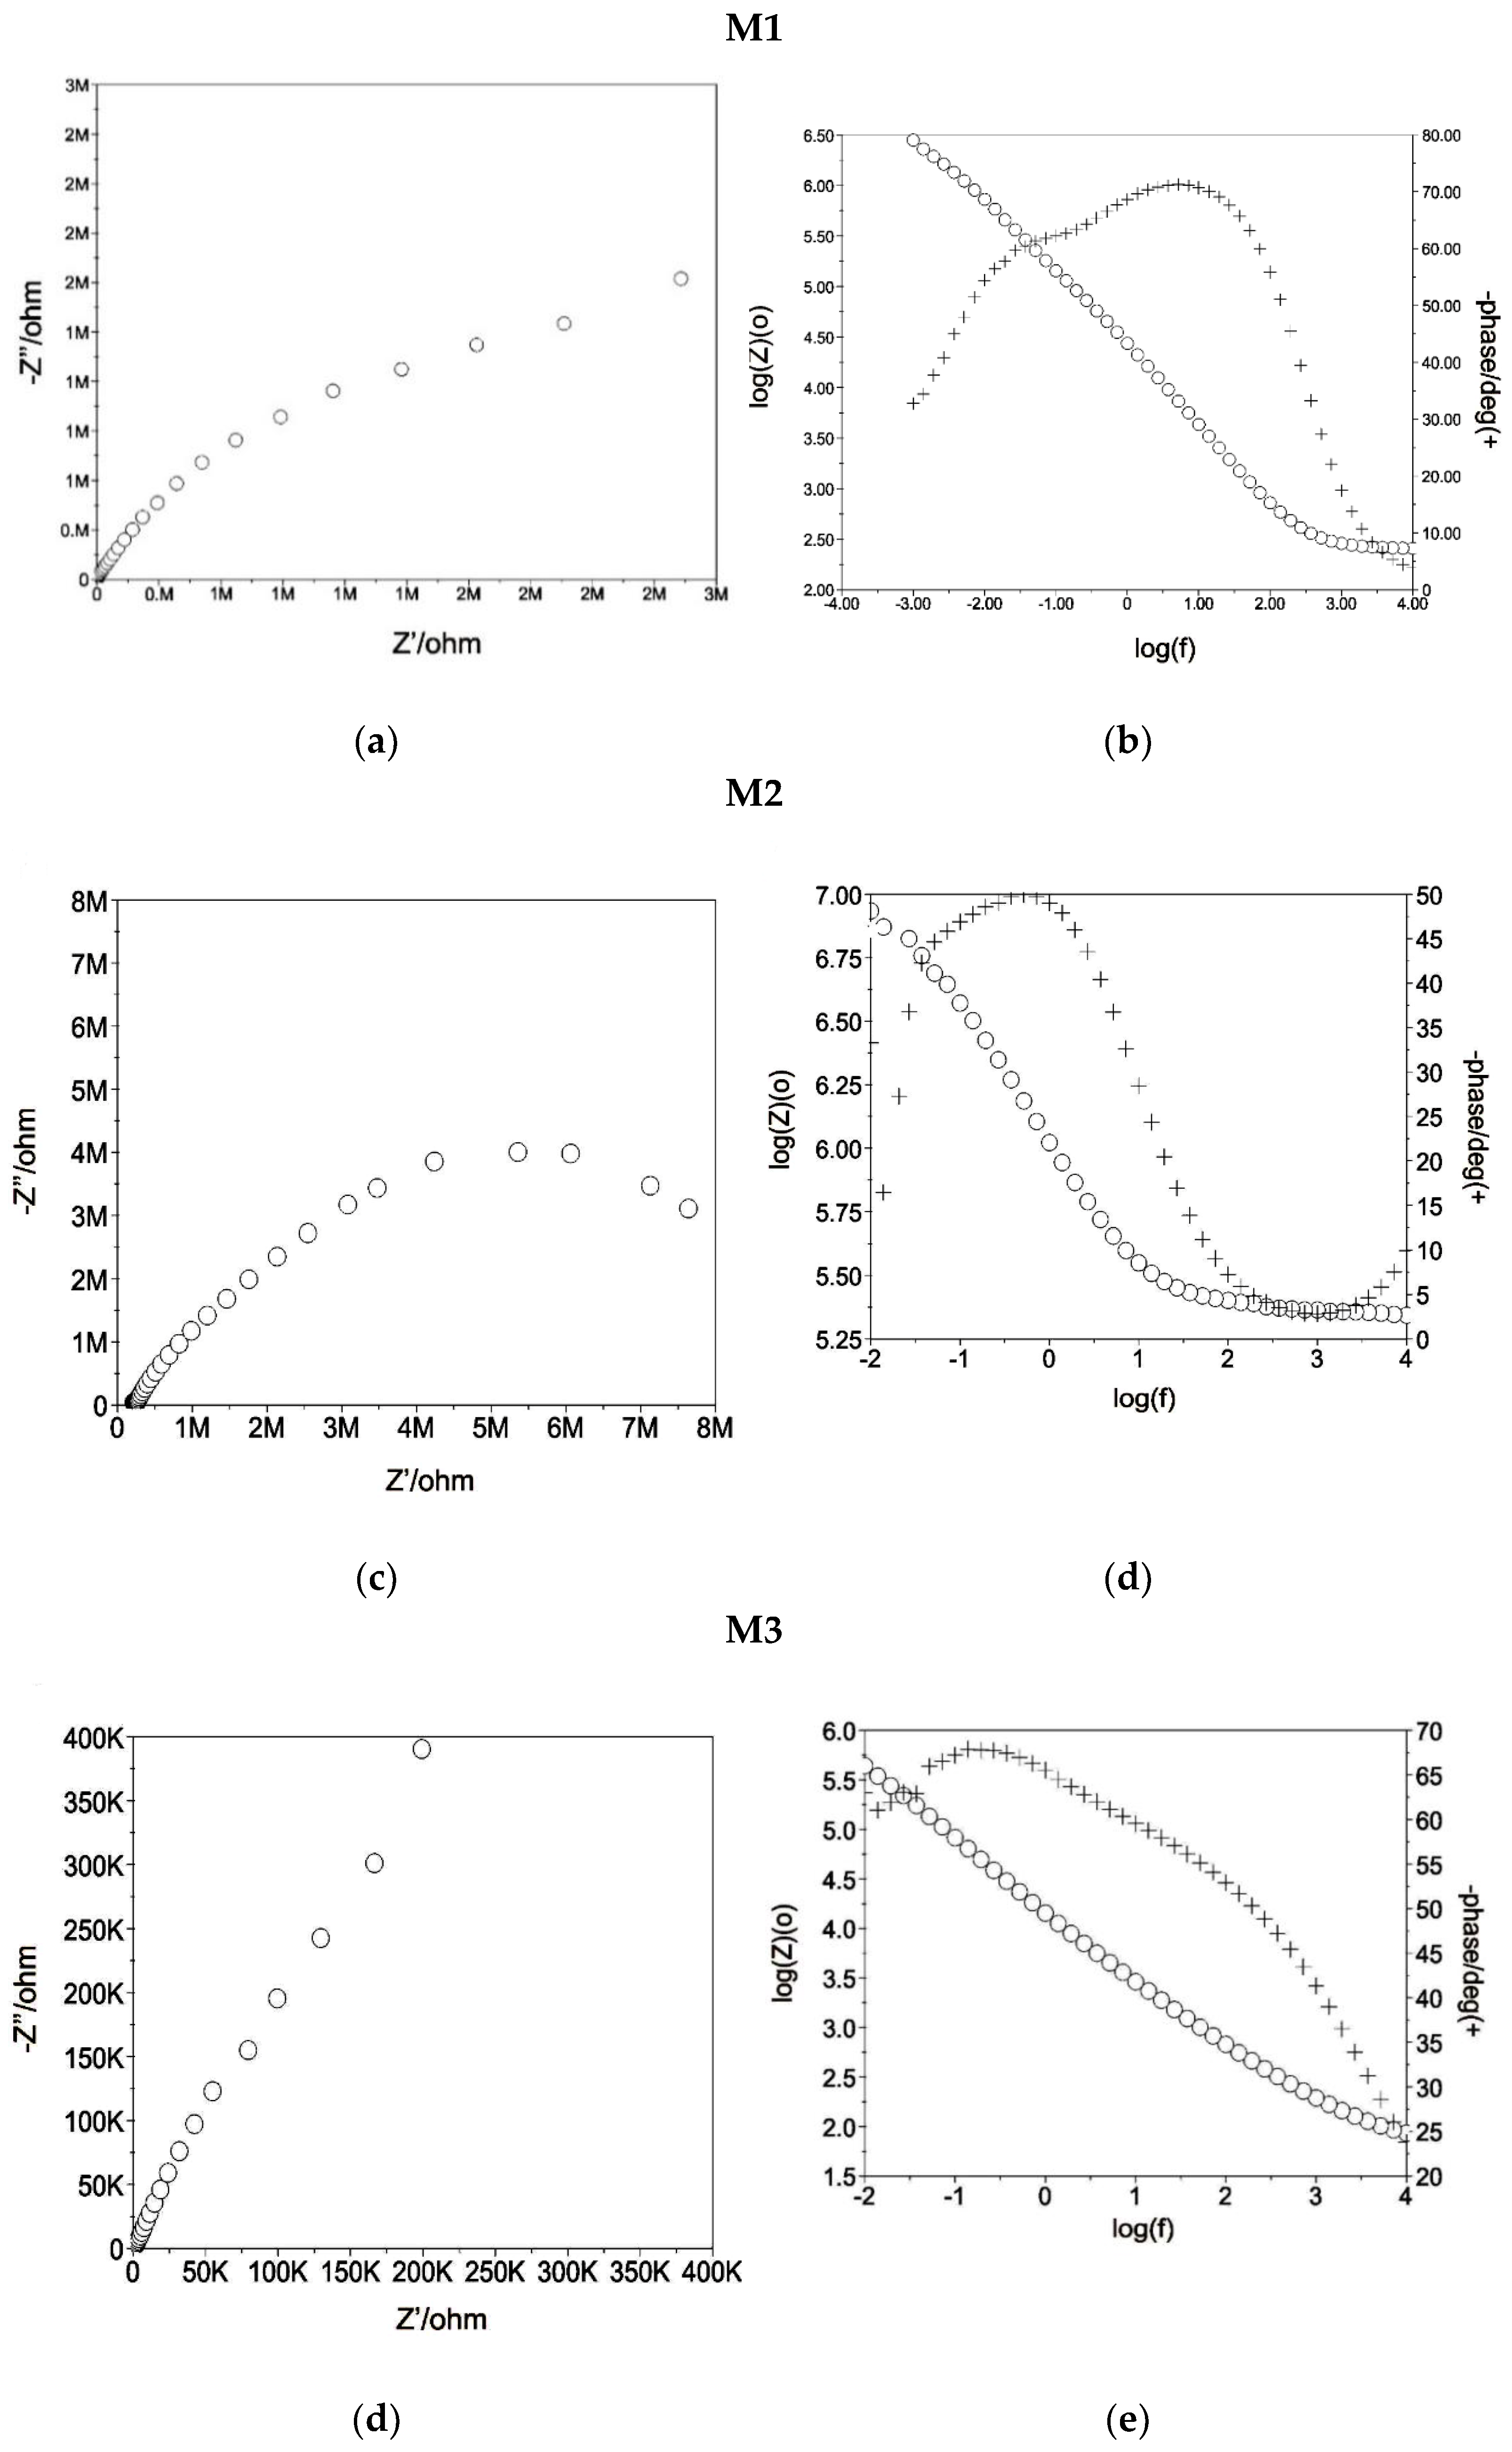
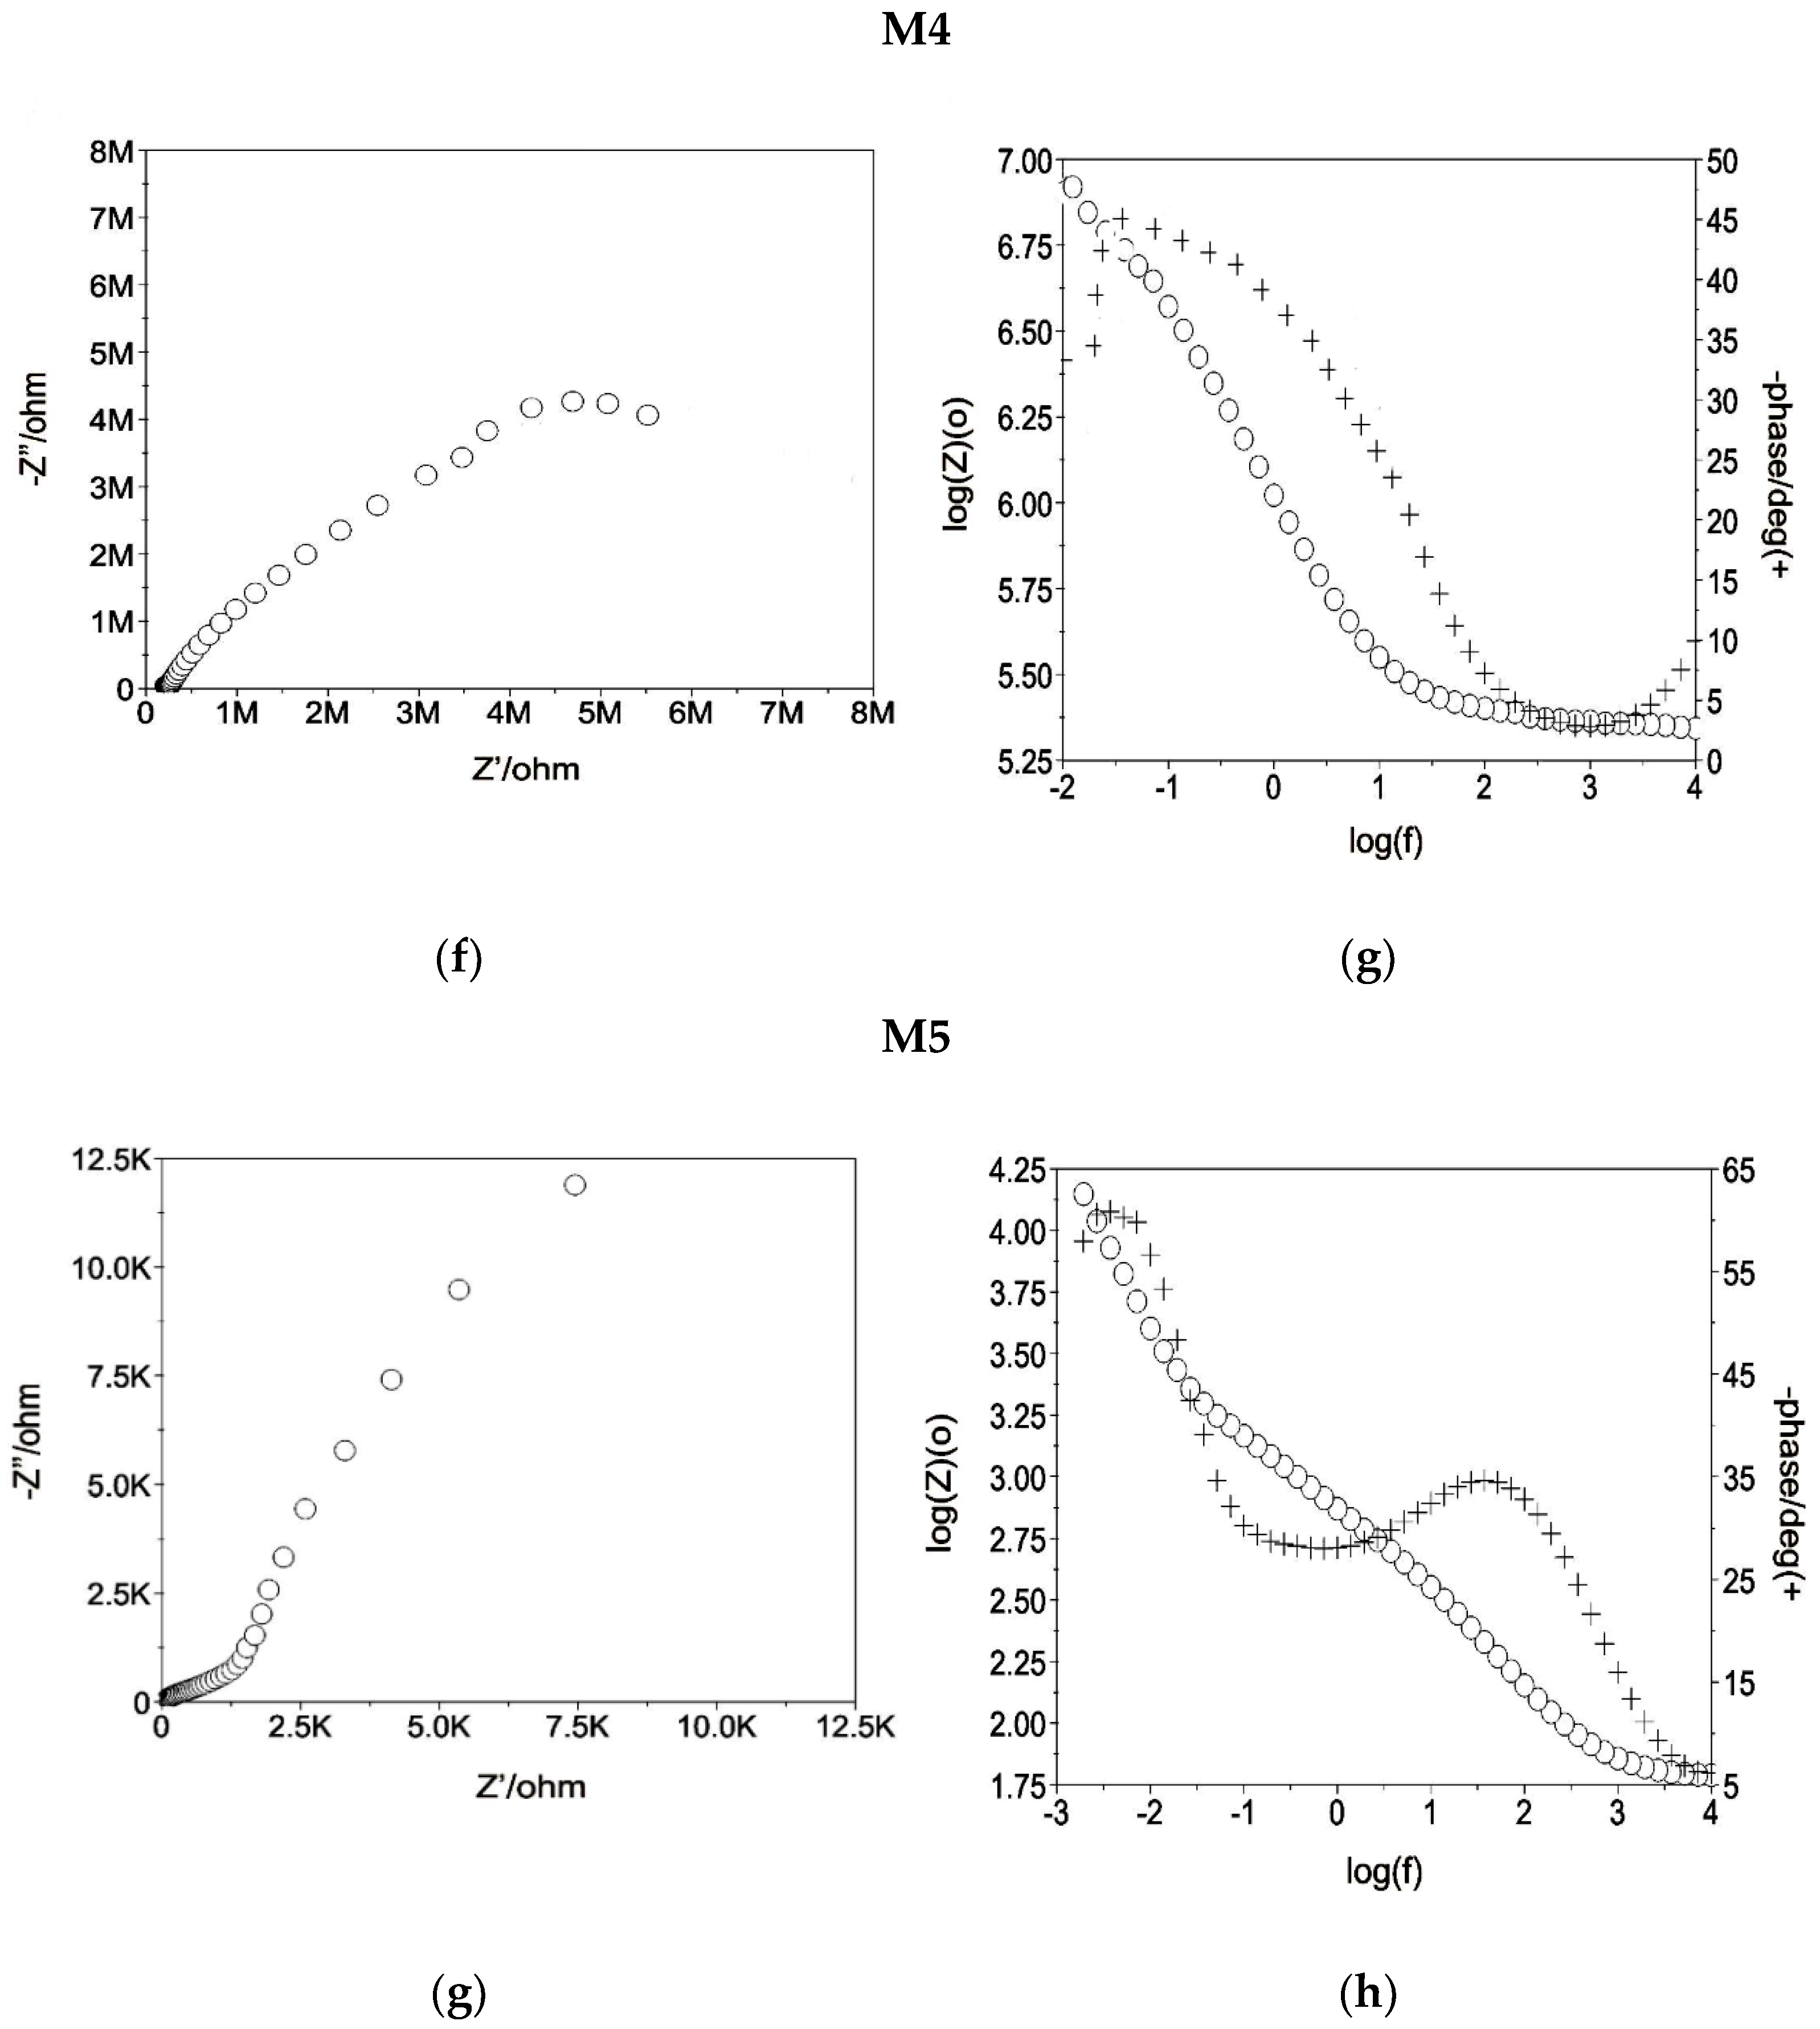
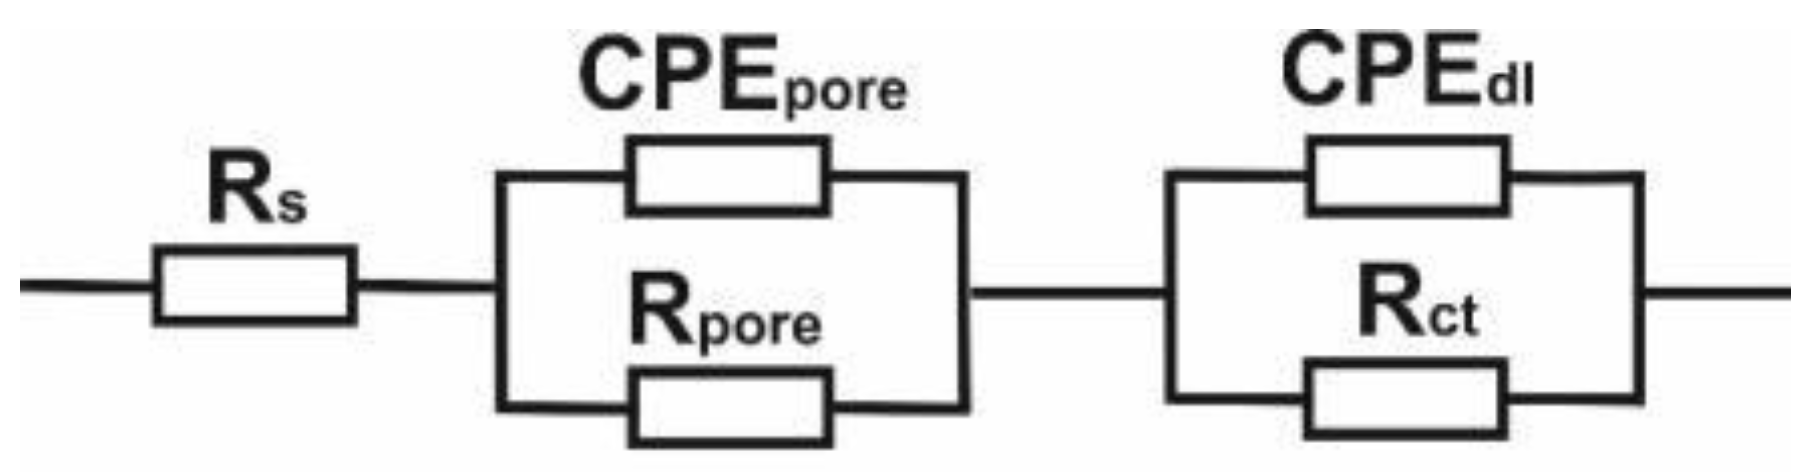
| No. | Eopcr, [mV] | Rs, [Ωcm2] | Rpore, [Ωcm2] | CPEpore, [mV] | Rct, [kΩcm2] | CPEdl, [mV] | |||
|---|---|---|---|---|---|---|---|---|---|
| Y, [kΩcm−ms−n] | n1 | Y, [Ωcm−ms−n] | n2 | ||||||
| 1 | M1 | −257 | 40 | 40 | 0.8553 × 10⁻⁵ | 0.9 | 4930 | 0.6732 × 10⁻⁵ | 0.7 |
| 2 | M2 | −257 | 55 | 619 | 0.7440 × 10⁻⁶ | 0.9 | 4520 | 0.7616 × 10⁻⁶ | 0.9 |
| 3 | M3 | −257 | 54 | 592 | 0.7440 × 10⁻⁶ | 0.6 | 10,255 | 0.1884 × 10⁻⁵ | 0.9 |
| 4 | M4 | +42 | 69 | 1 | 0.1258× 10⁻⁴ | 0.8 | 2494 | 0.1759 × 10⁻⁴ | 0.8 |
| 5 | M5 | −2 | 68 | 53 | 0.4426 × 10⁻⁴ | 0.9 | 11,320 | 0.3157 × 10⁻⁴ | 0.7 |
| No. | Name | µ | Wear Volume, [µm] | W |
|---|---|---|---|---|
| 1 | M1 | 0.54 ± 0.06 | 51,571 ± 9184 | 2.2 × 10⁻¹⁶ |
| 2 | M2 | 0.55 ± 0.08 | 19,174 ± 1131 | 7.7 × 10⁻¹⁷ |
| 3 | M3 | 0.62 ± 0.6 | 22,287 ± 1063 | 8.9 × 10⁻¹⁷ |
| 4 | M4 | 0.63 ± 0.07 | 19,247 ± 1053 | 7.4 × 10⁻¹⁷ |
| 5 | M5 | 0.69 ± 0.07 | 18,786 ± 1088 | 7.2 × 10⁻¹⁷ |
© 2020 by the authors. Licensee MDPI, Basel, Switzerland. This article is an open access article distributed under the terms and conditions of the Creative Commons Attribution (CC BY) license (http://creativecommons.org/licenses/by/4.0/).
Share and Cite
Woźniak, A.; Adamiak, M.; Chladek, G.; Bonek, M.; Walke, W.; Bialas, O. The Influence of Hybrid Surface Modification on the Selected Properties of CP Titanium Grade II Manufactured by Selective Laser Melting. Materials 2020, 13, 2829. https://doi.org/10.3390/ma13122829
Woźniak A, Adamiak M, Chladek G, Bonek M, Walke W, Bialas O. The Influence of Hybrid Surface Modification on the Selected Properties of CP Titanium Grade II Manufactured by Selective Laser Melting. Materials. 2020; 13(12):2829. https://doi.org/10.3390/ma13122829
Chicago/Turabian StyleWoźniak, Anna, Marcin Adamiak, Grzegorz Chladek, Mirosław Bonek, Witold Walke, and Oktawian Bialas. 2020. "The Influence of Hybrid Surface Modification on the Selected Properties of CP Titanium Grade II Manufactured by Selective Laser Melting" Materials 13, no. 12: 2829. https://doi.org/10.3390/ma13122829
APA StyleWoźniak, A., Adamiak, M., Chladek, G., Bonek, M., Walke, W., & Bialas, O. (2020). The Influence of Hybrid Surface Modification on the Selected Properties of CP Titanium Grade II Manufactured by Selective Laser Melting. Materials, 13(12), 2829. https://doi.org/10.3390/ma13122829