An Innovative Test Method for Tensile Strength of Concrete by Applying the Strut-and-Tie Methodology

Abstract
1. Introduction
2. Existing Concrete Tensile Strength Testing Method
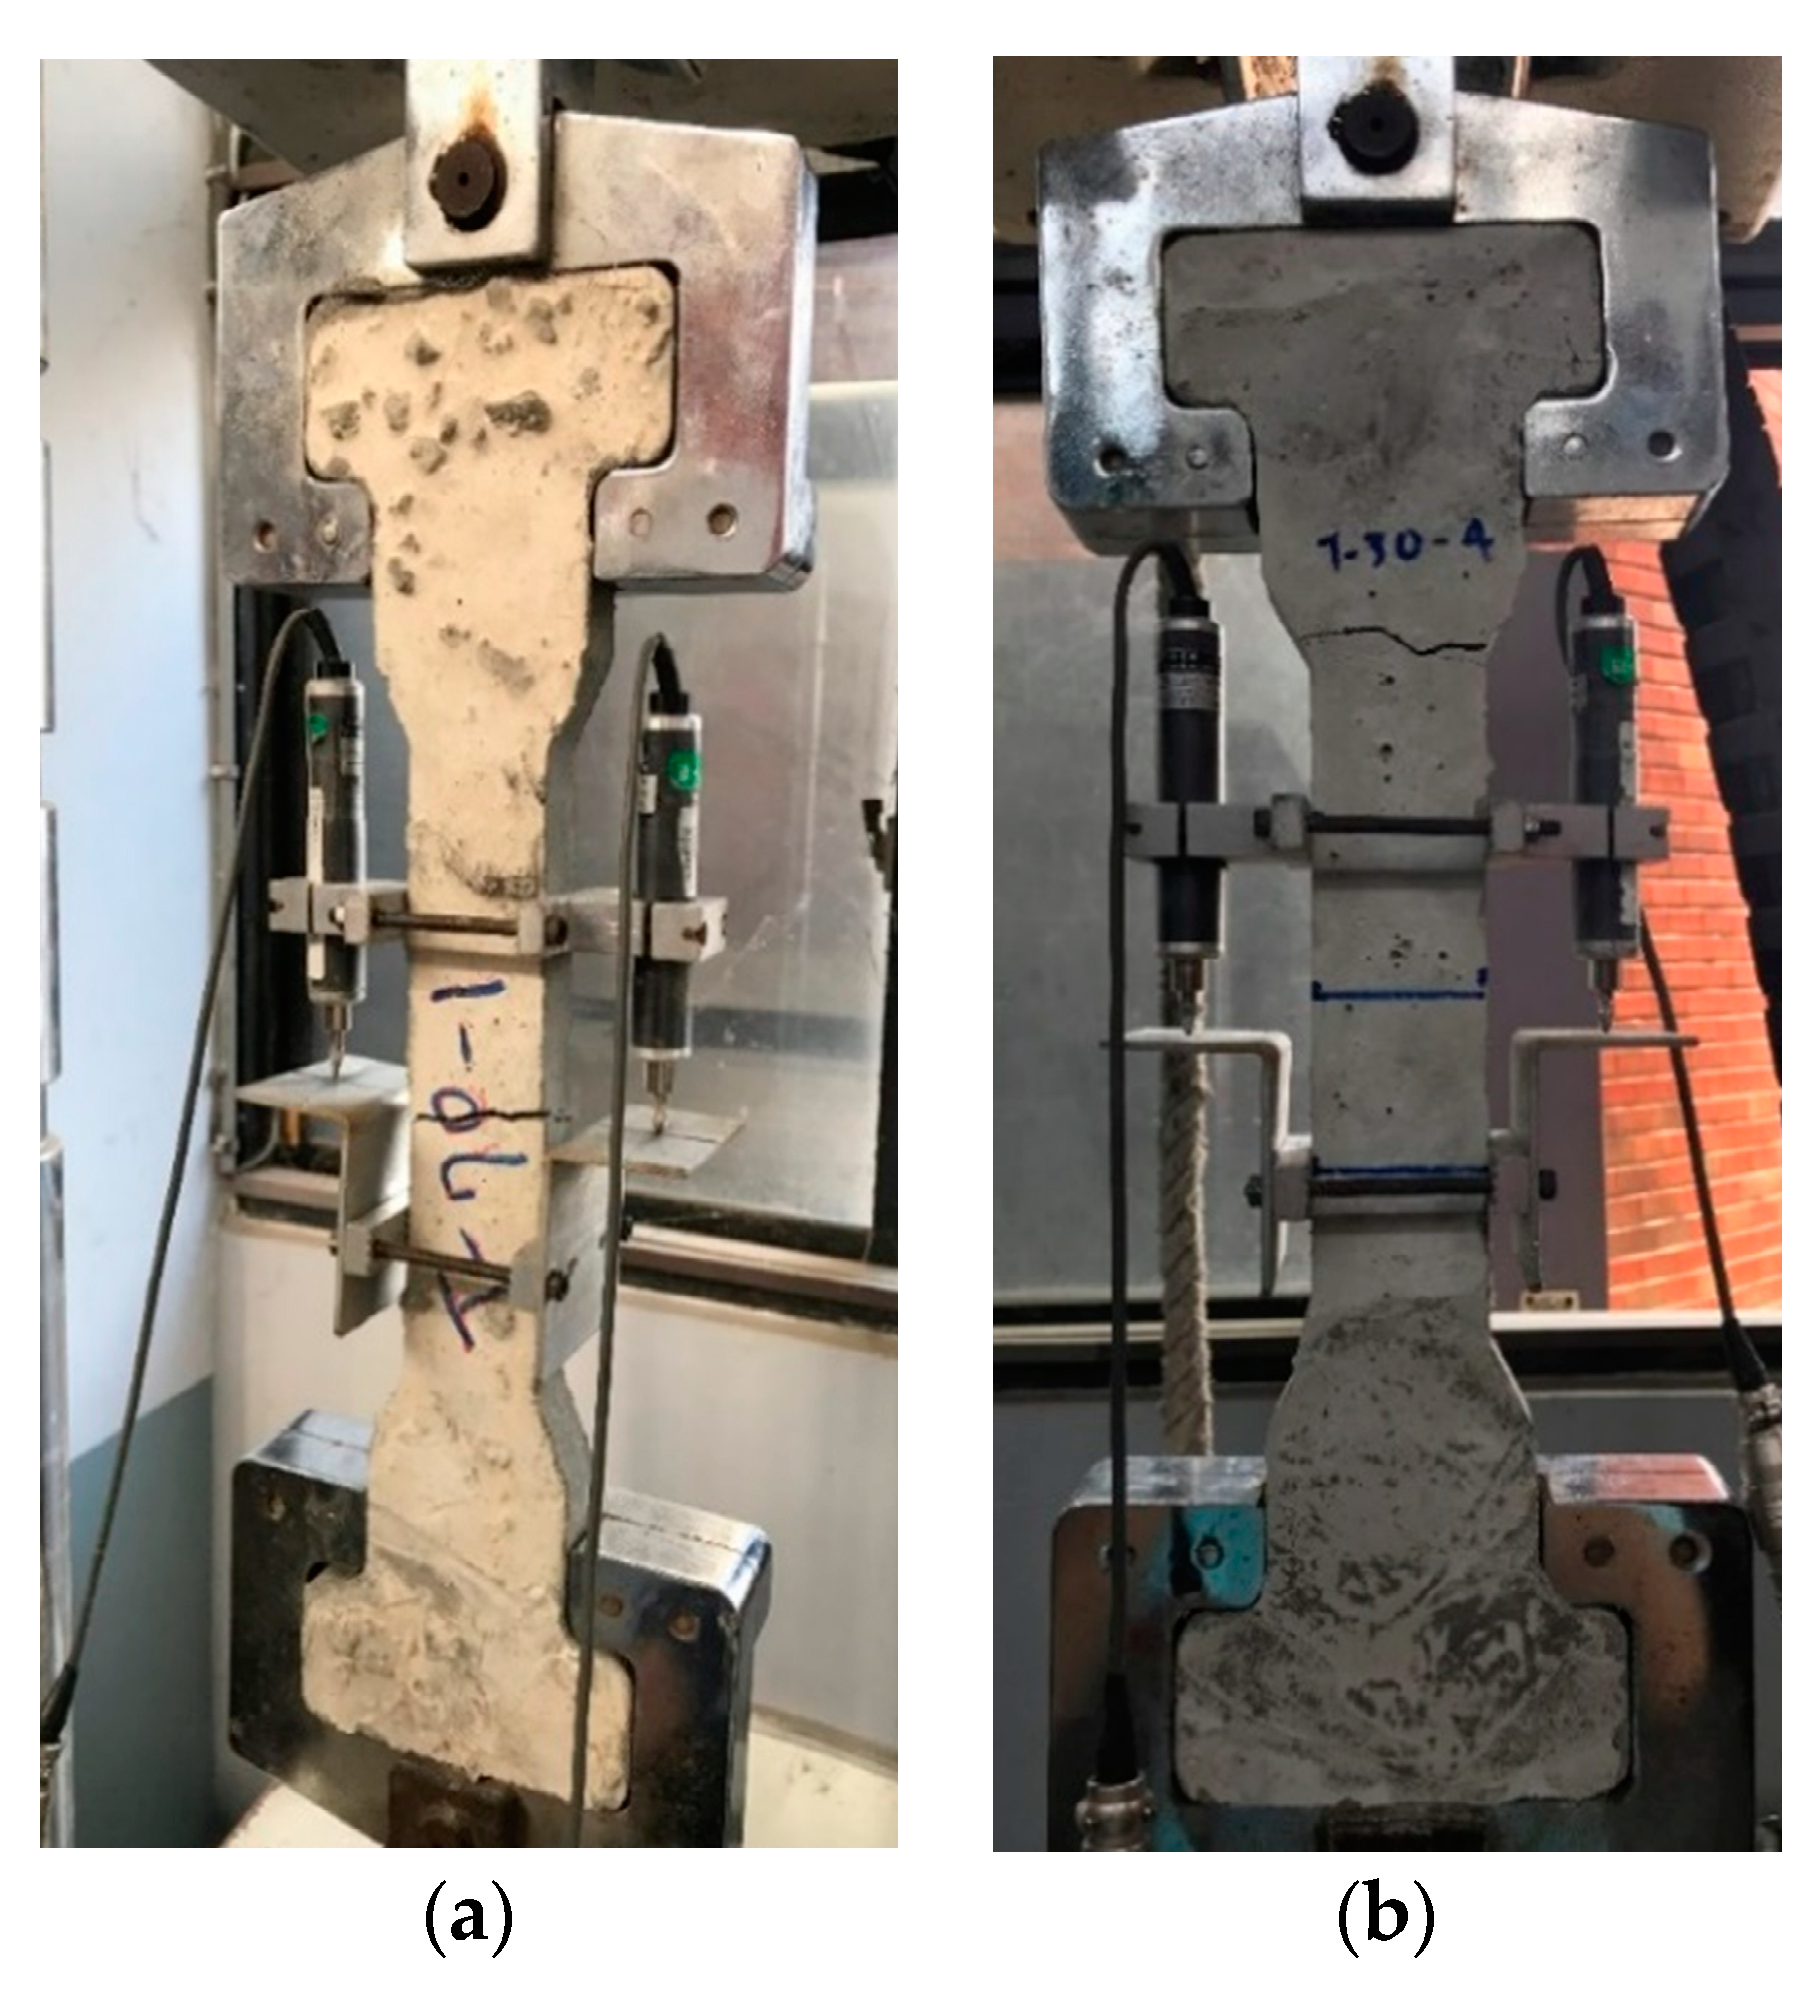
2.1. Direct Tension Test
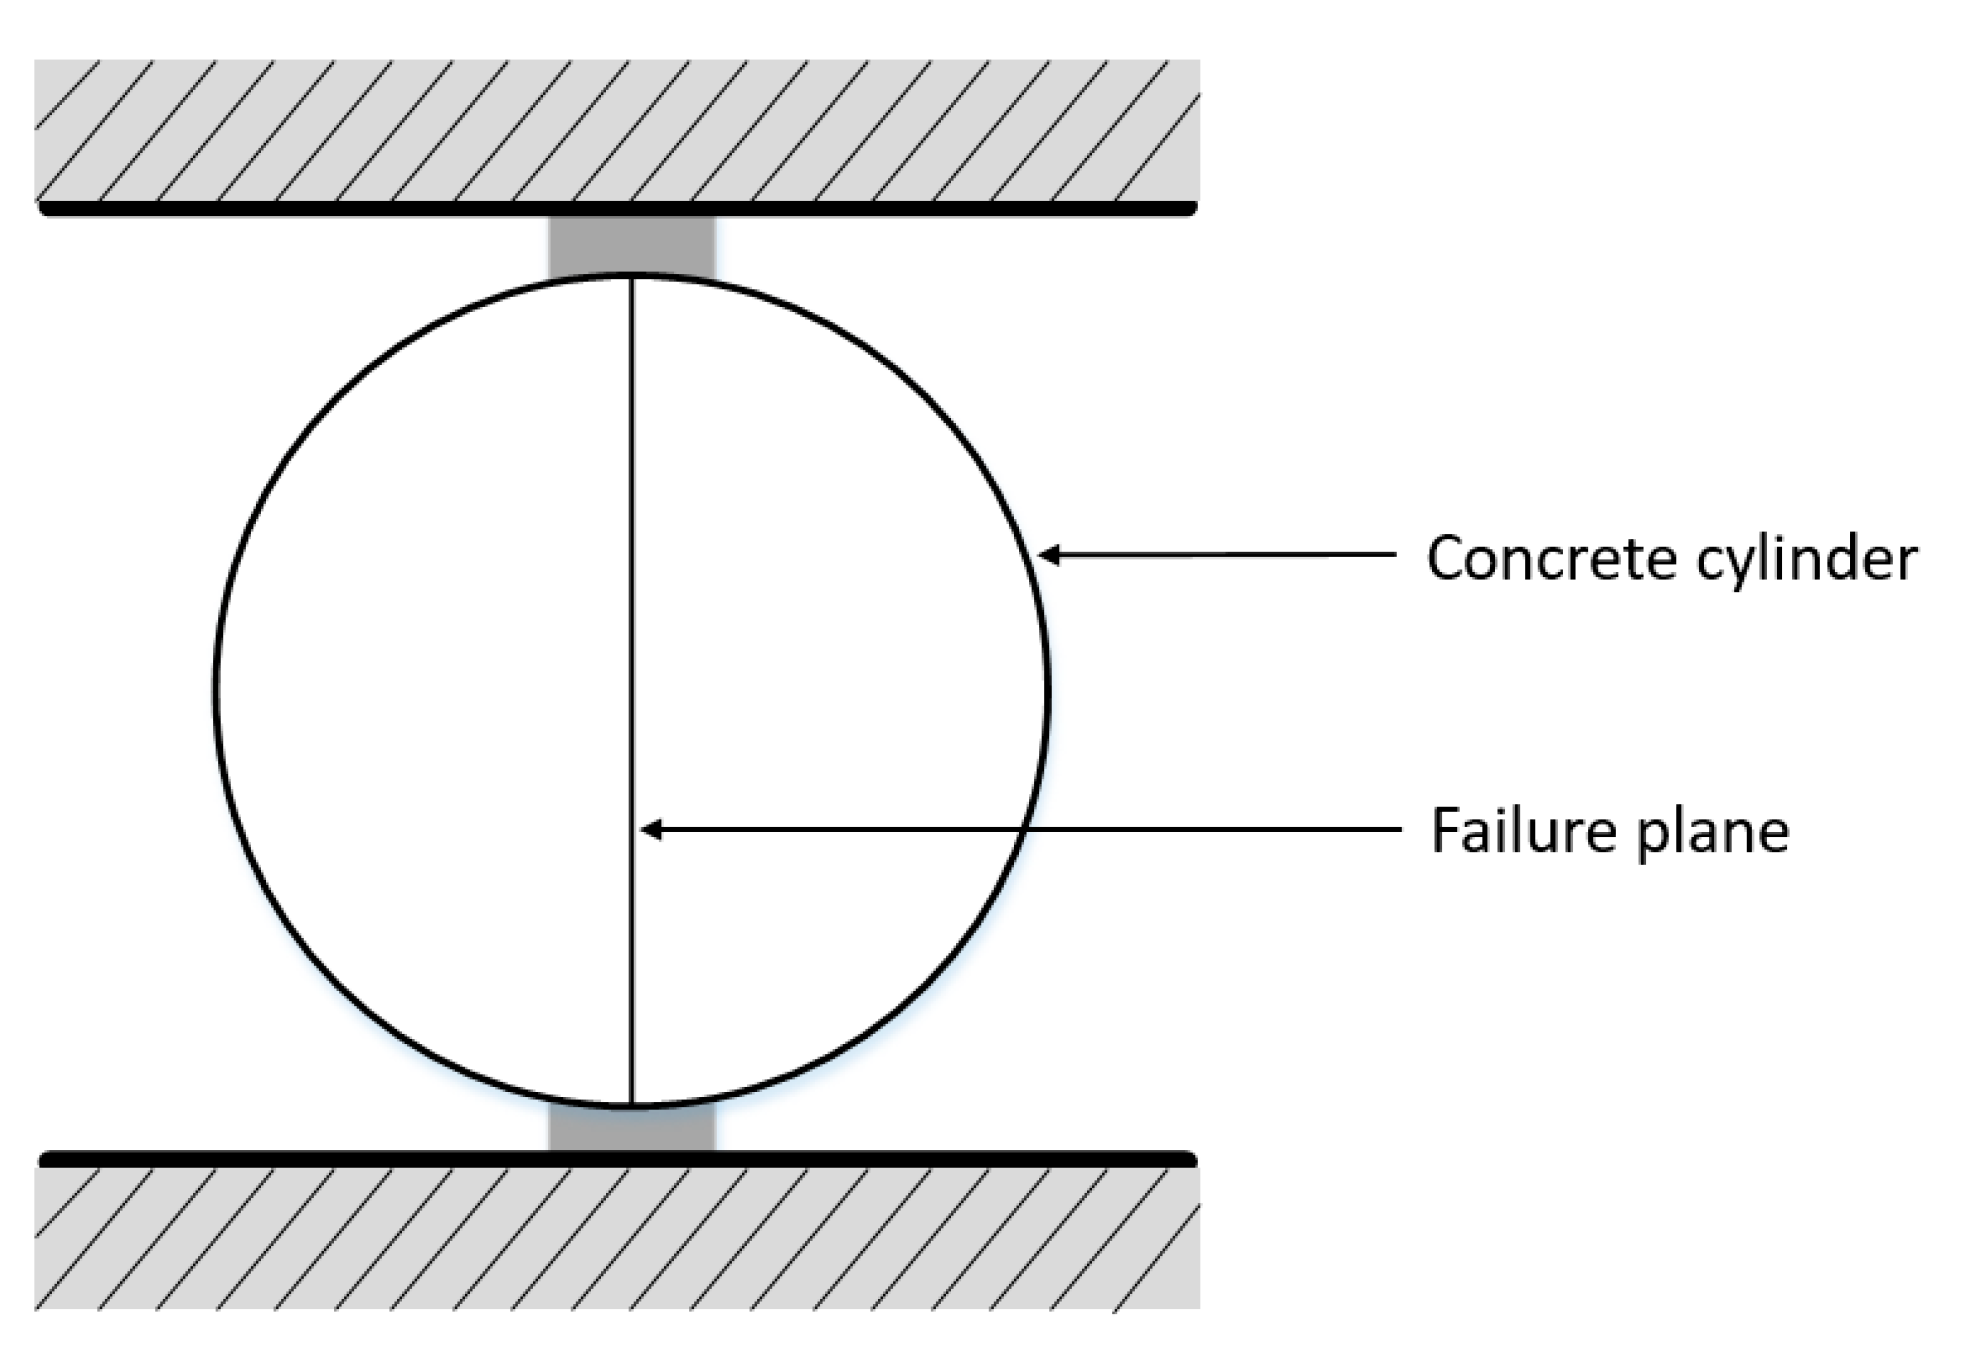
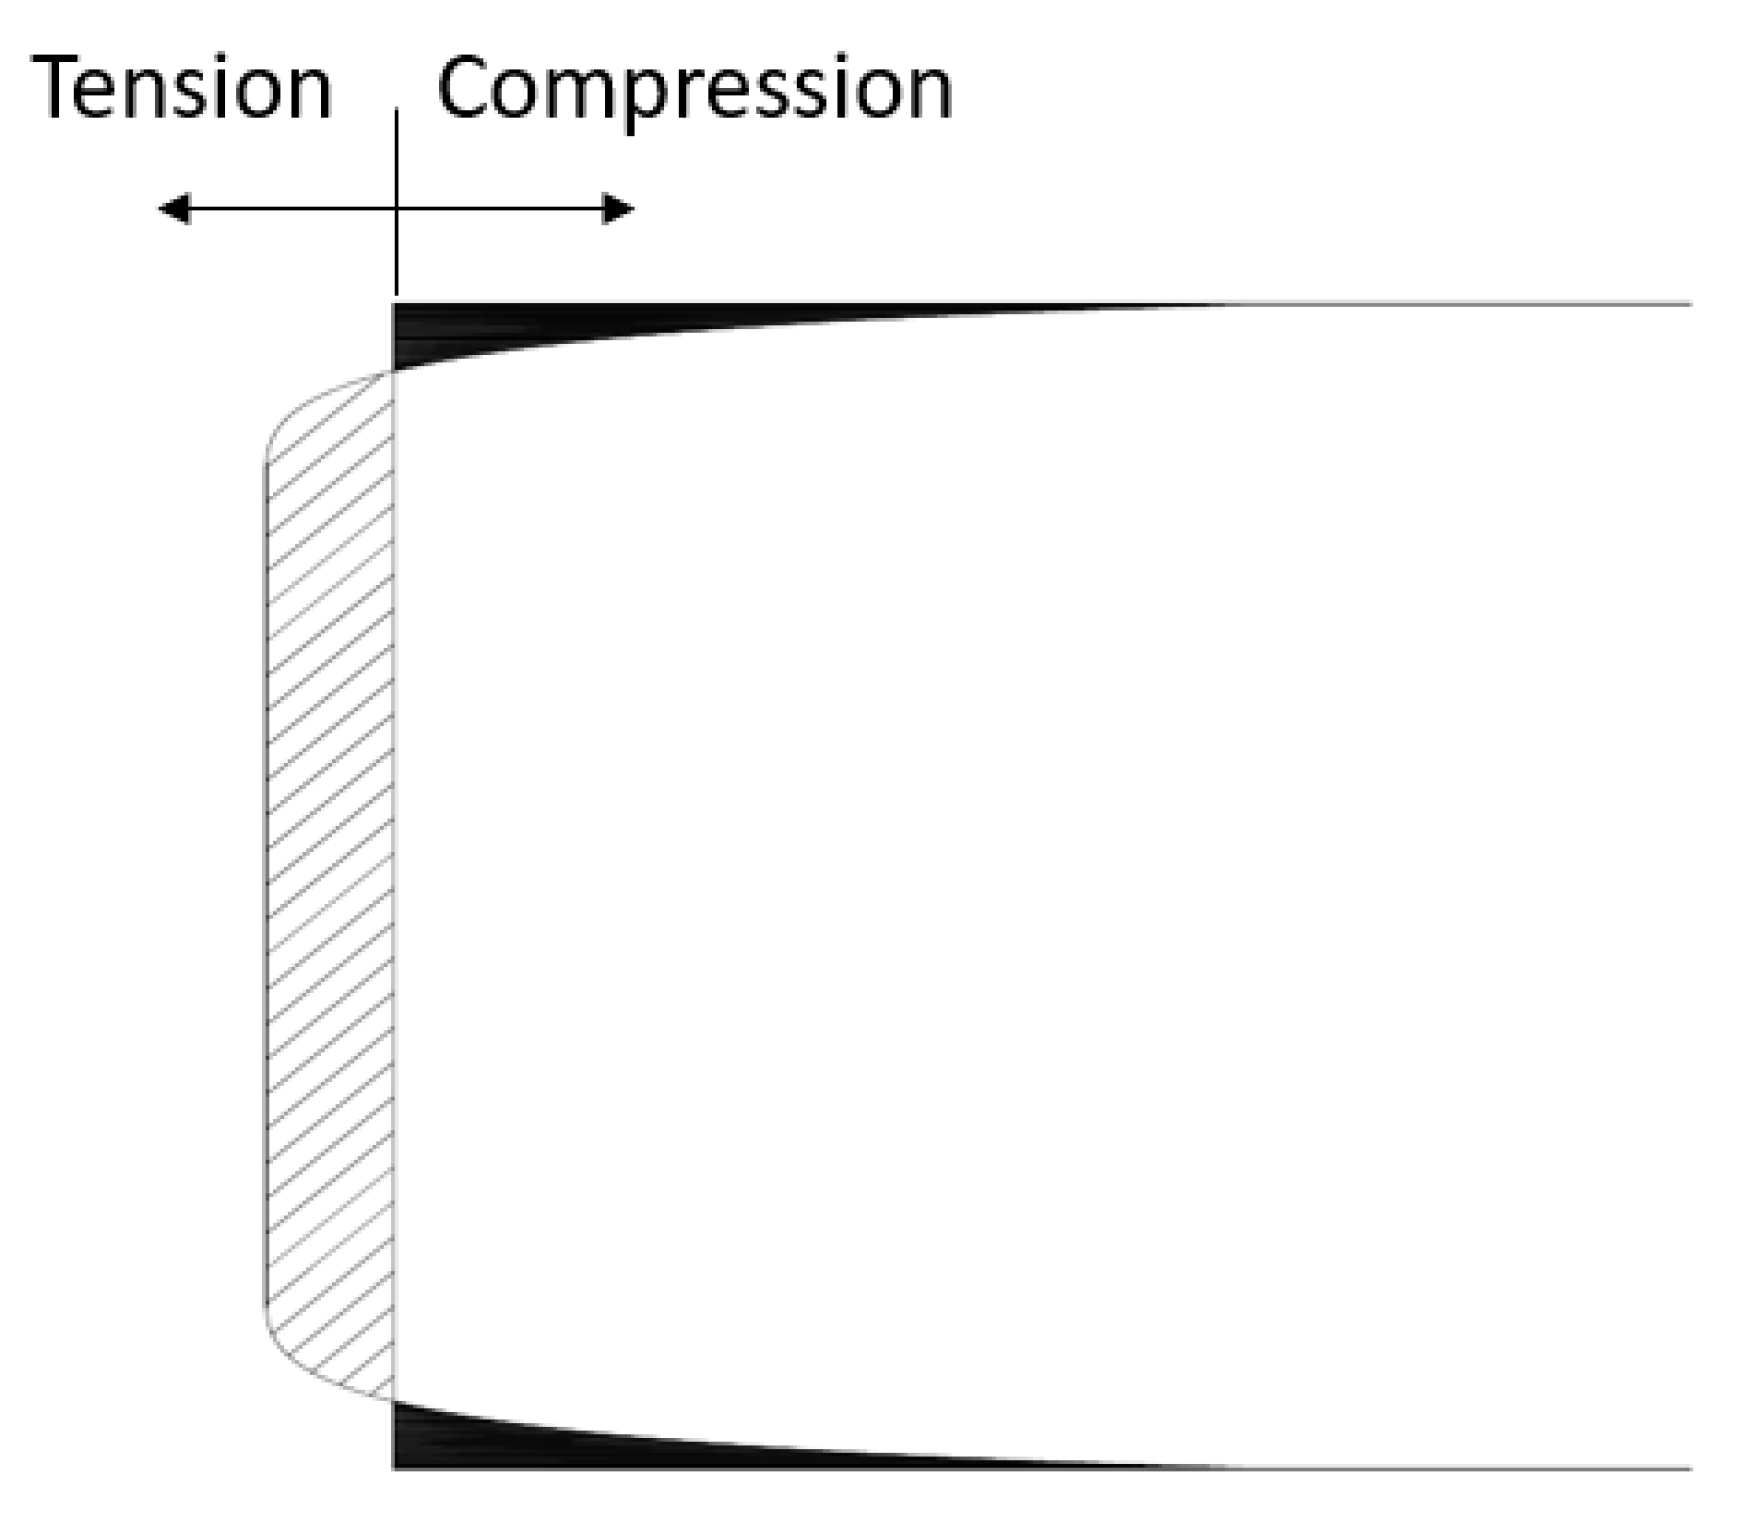
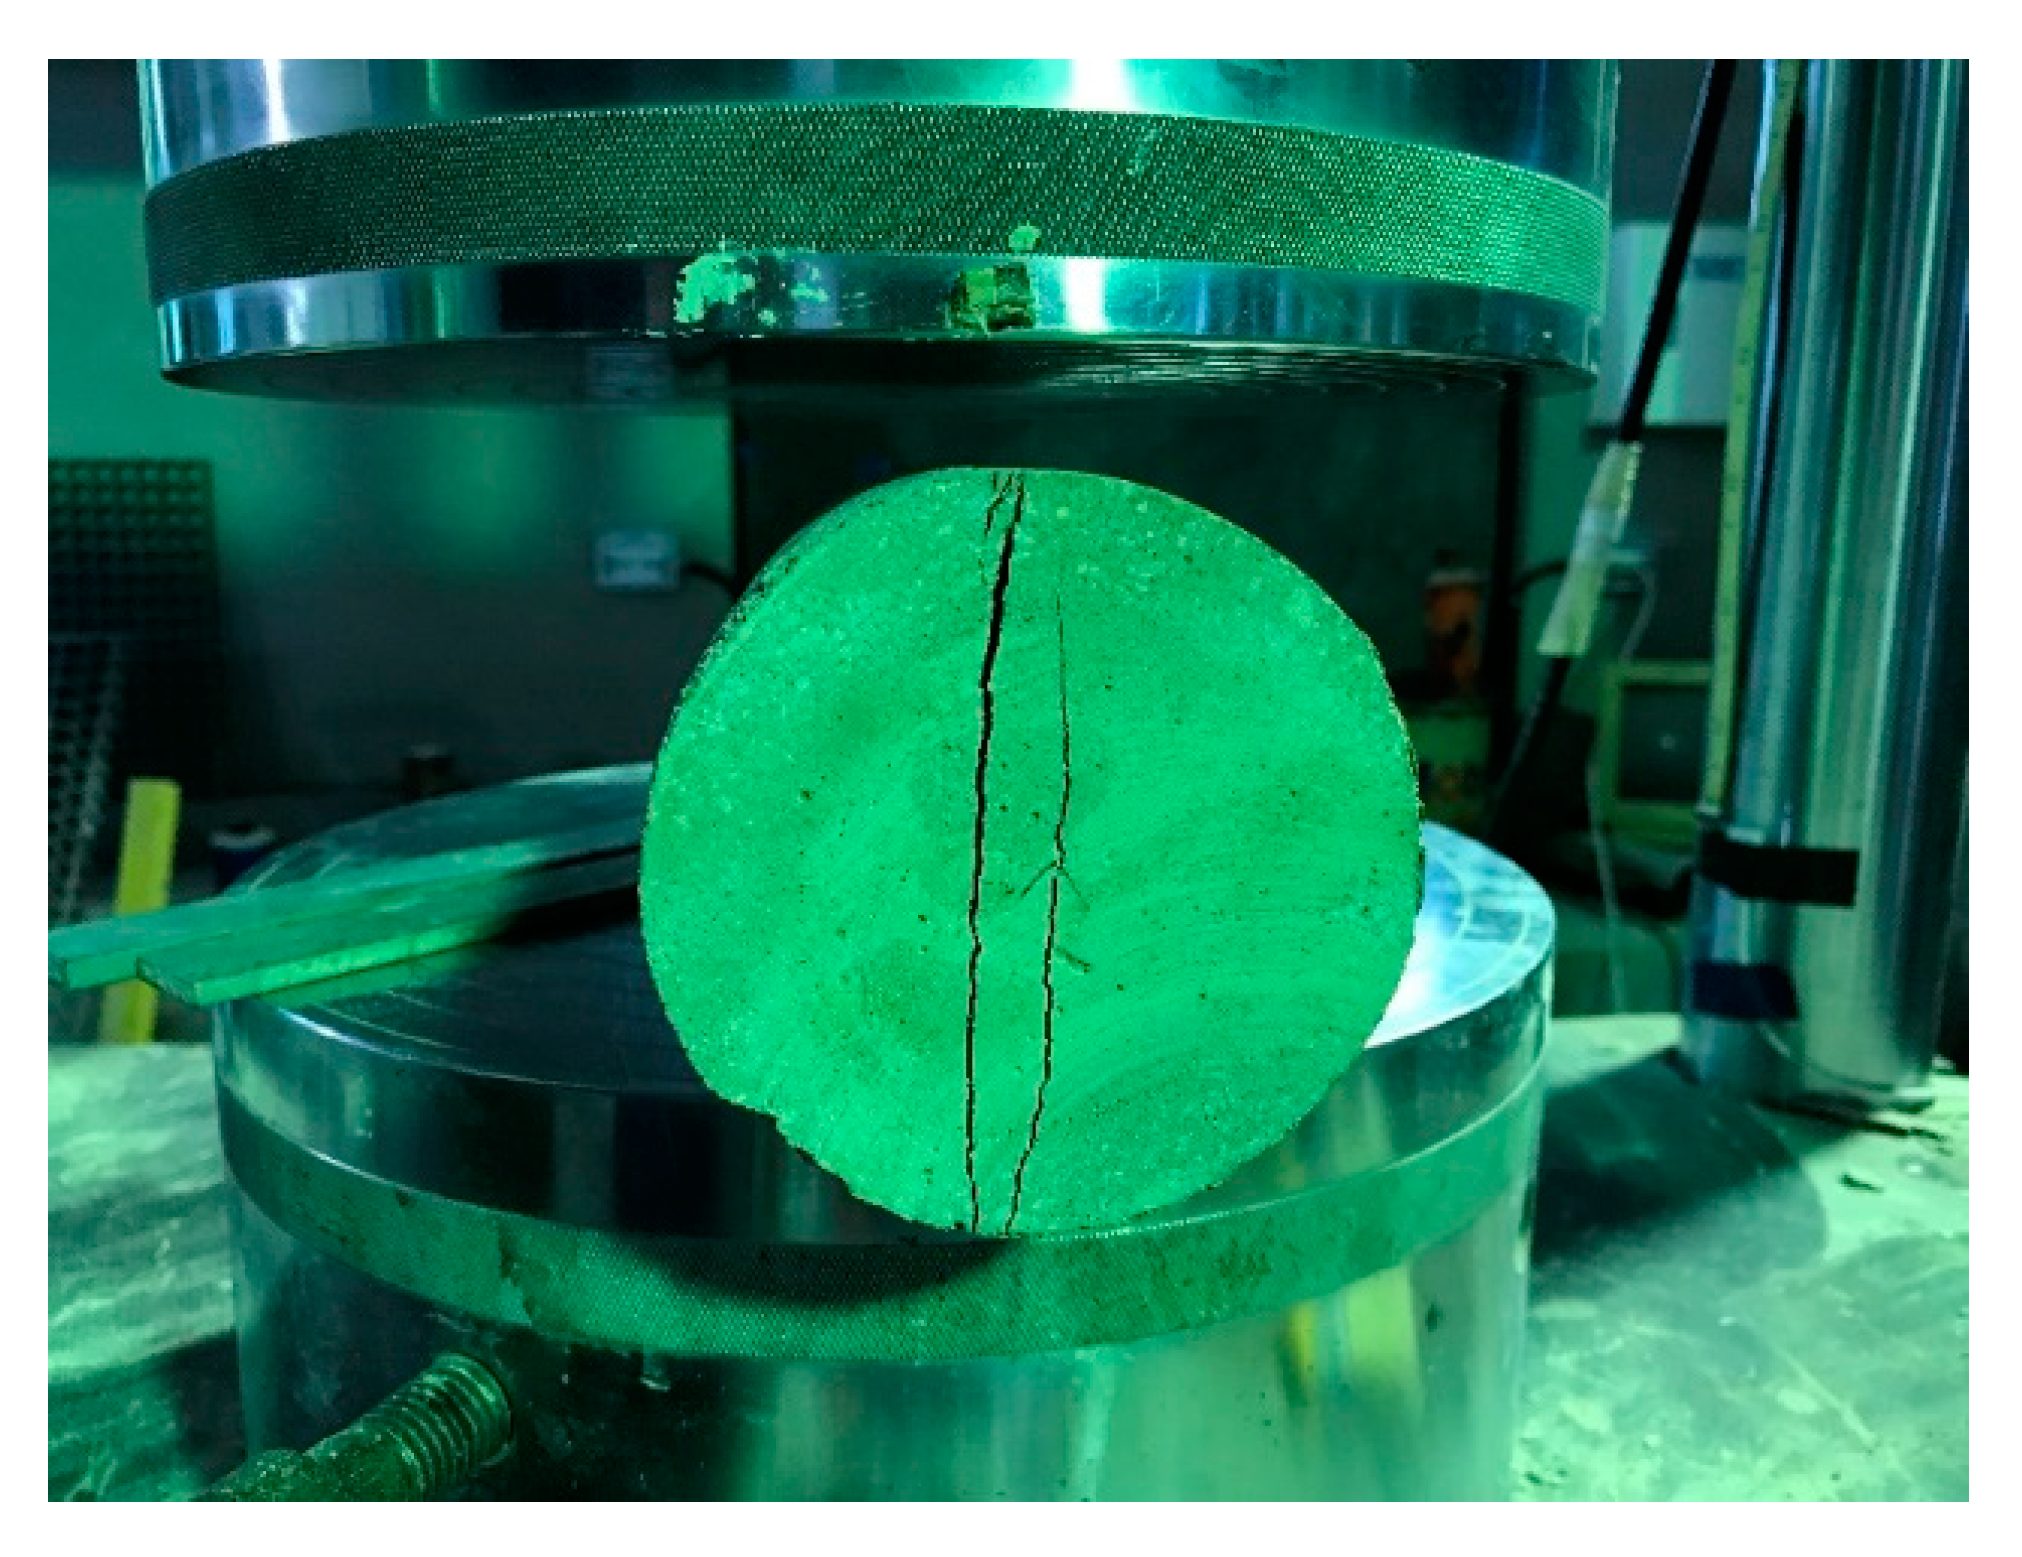
2.2. Splitting Tensile Test (ASTM C496)
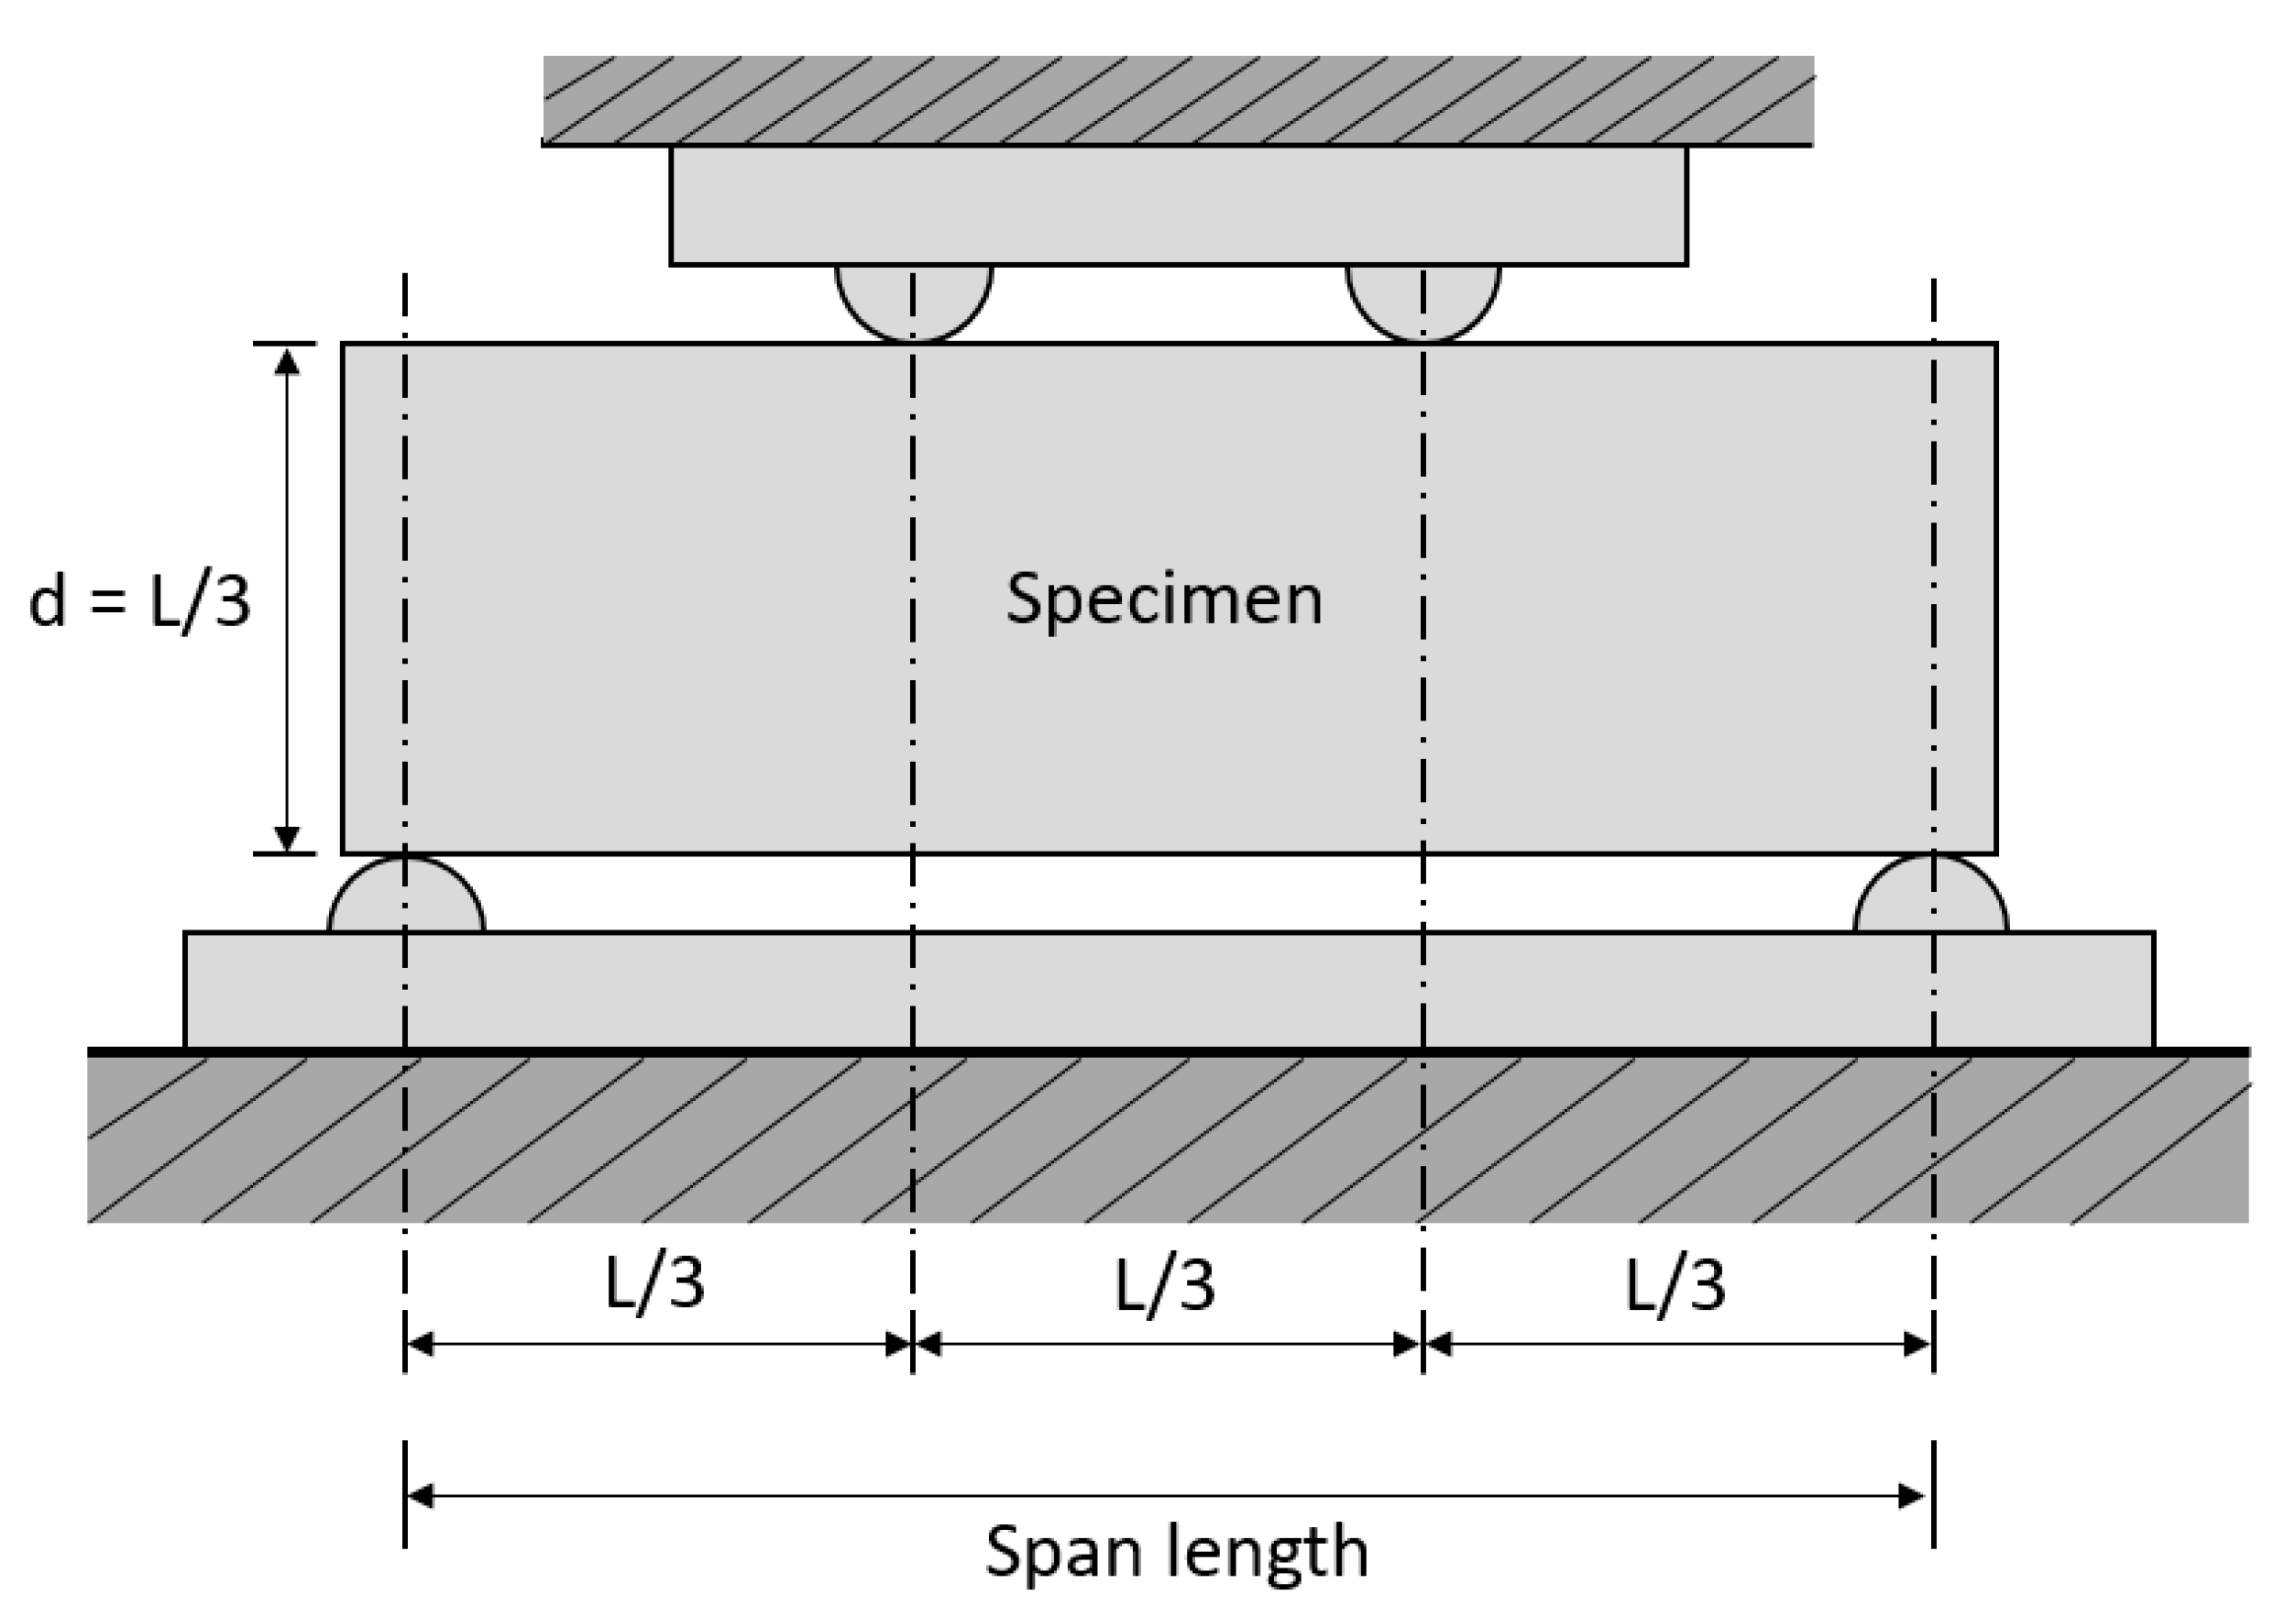
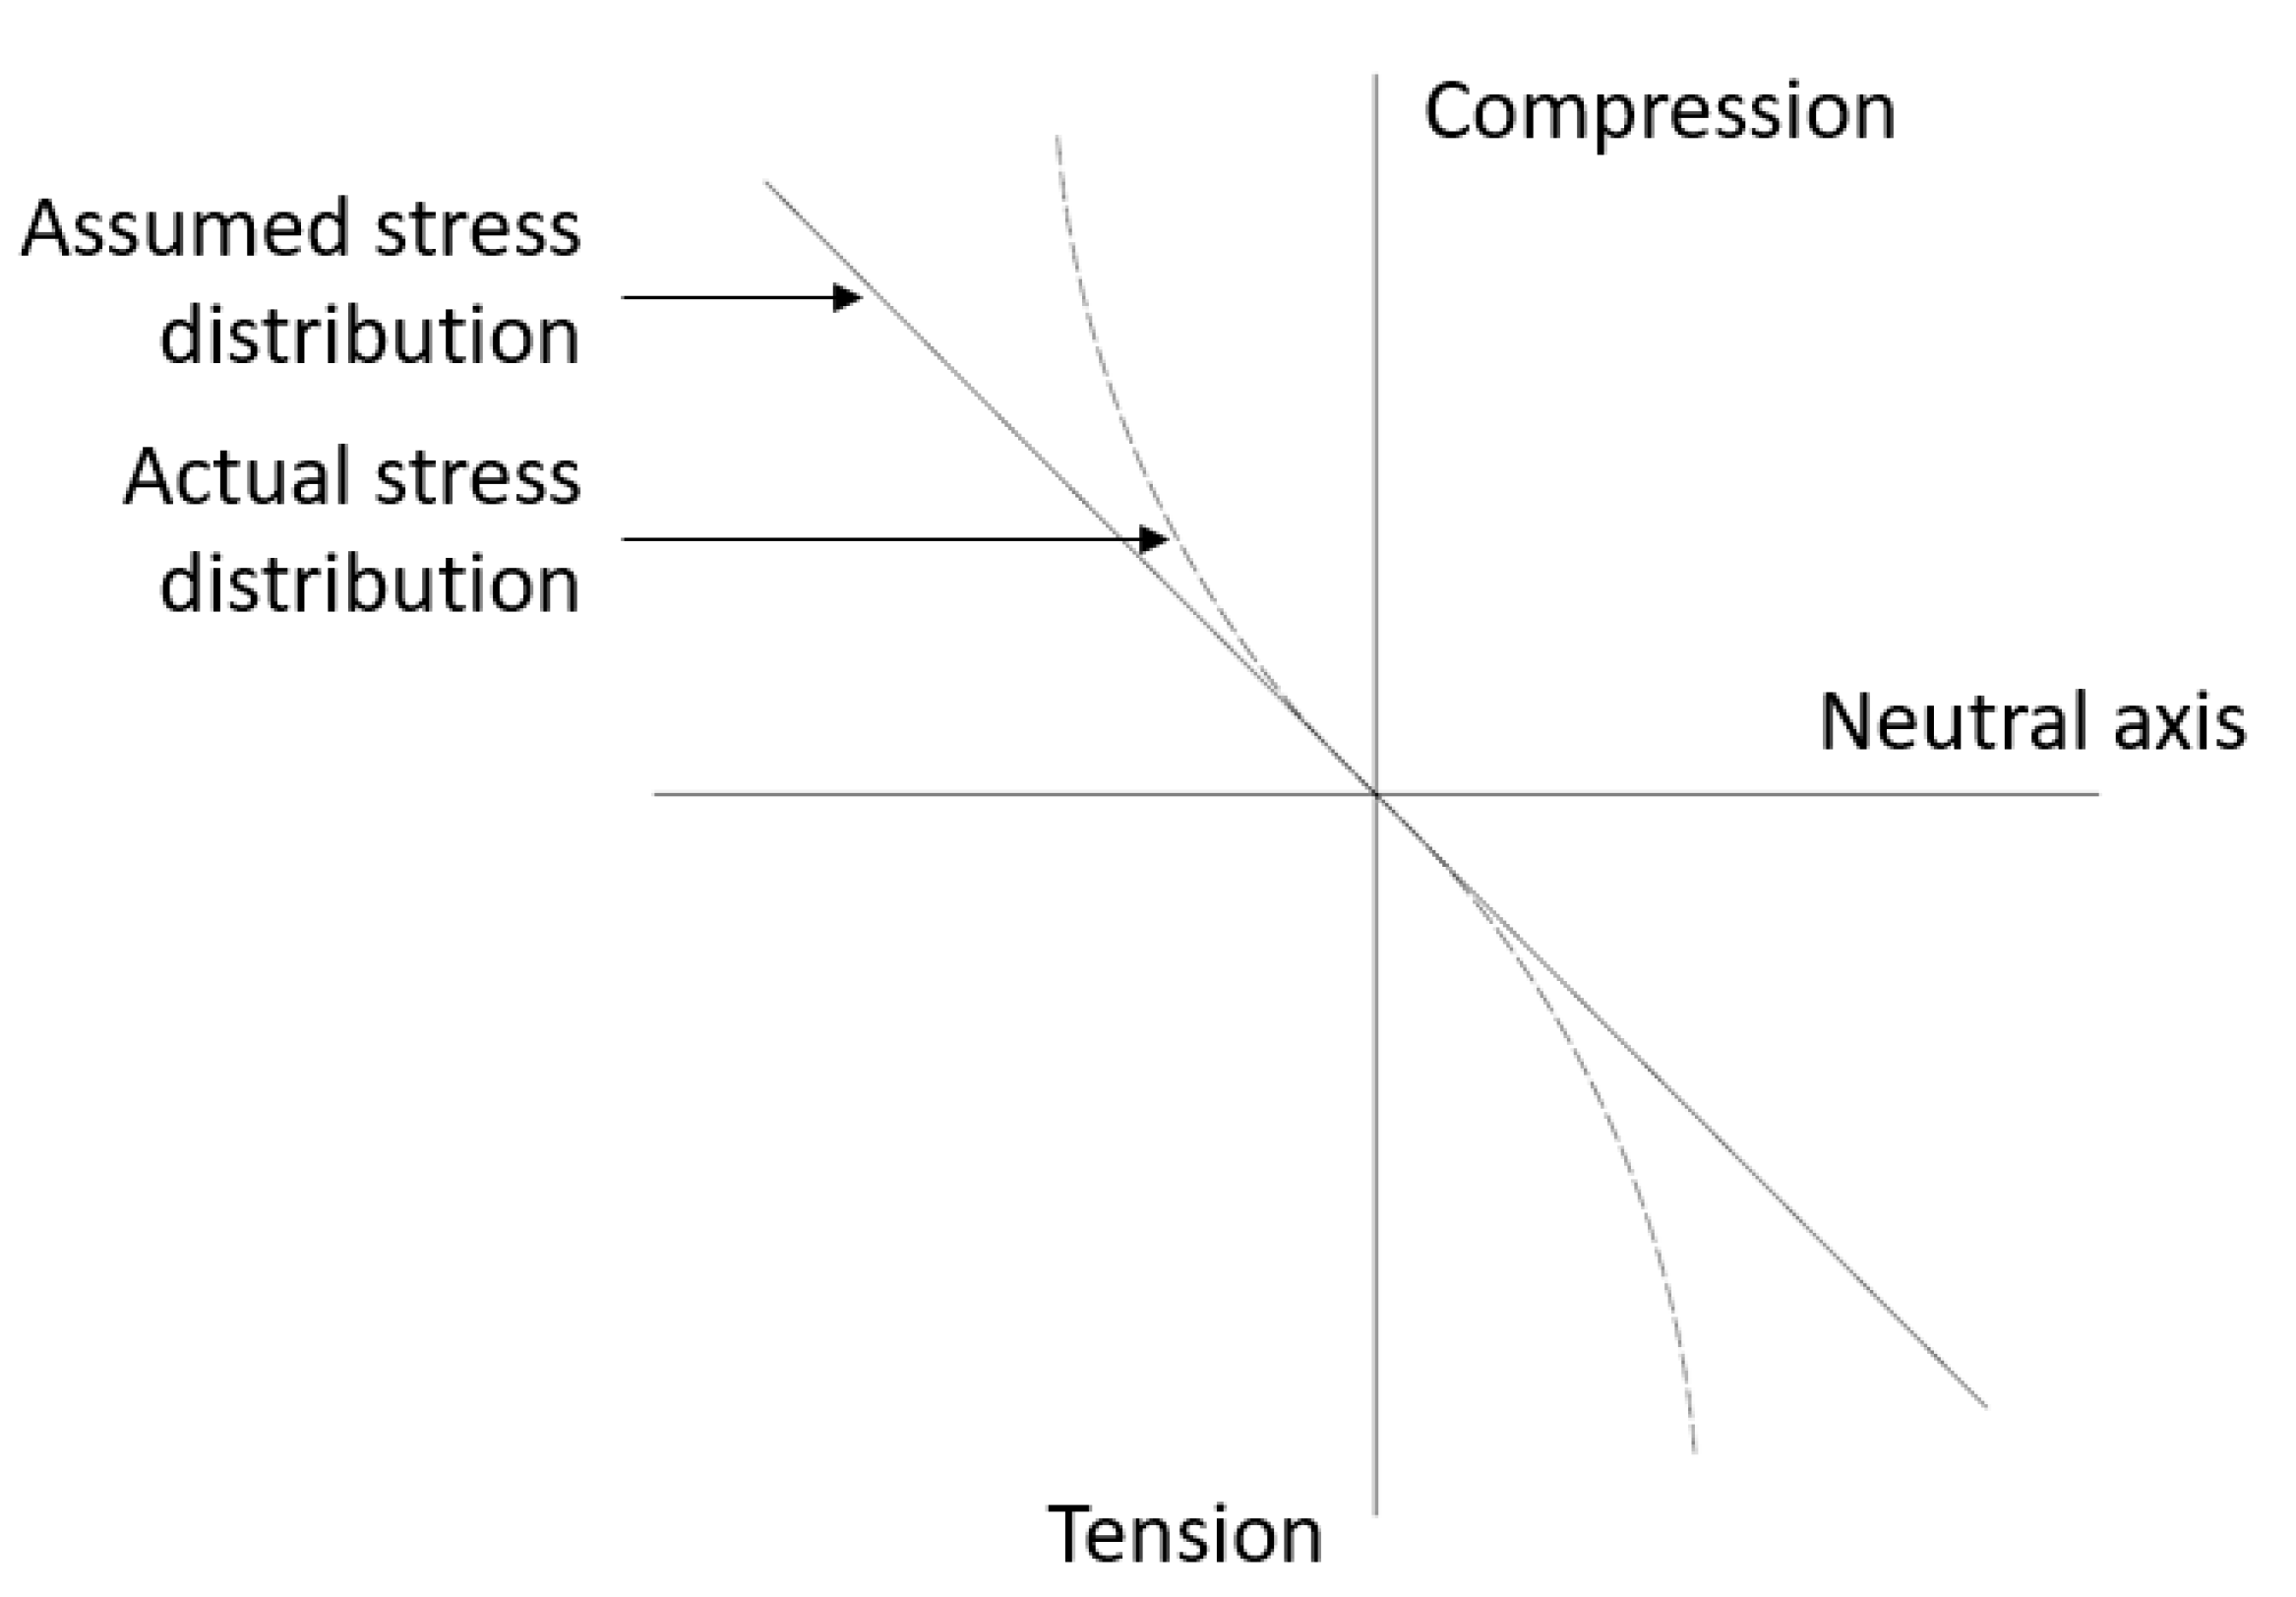
2.3. Flexural Test (ASTM C78)
3. Experimental Program
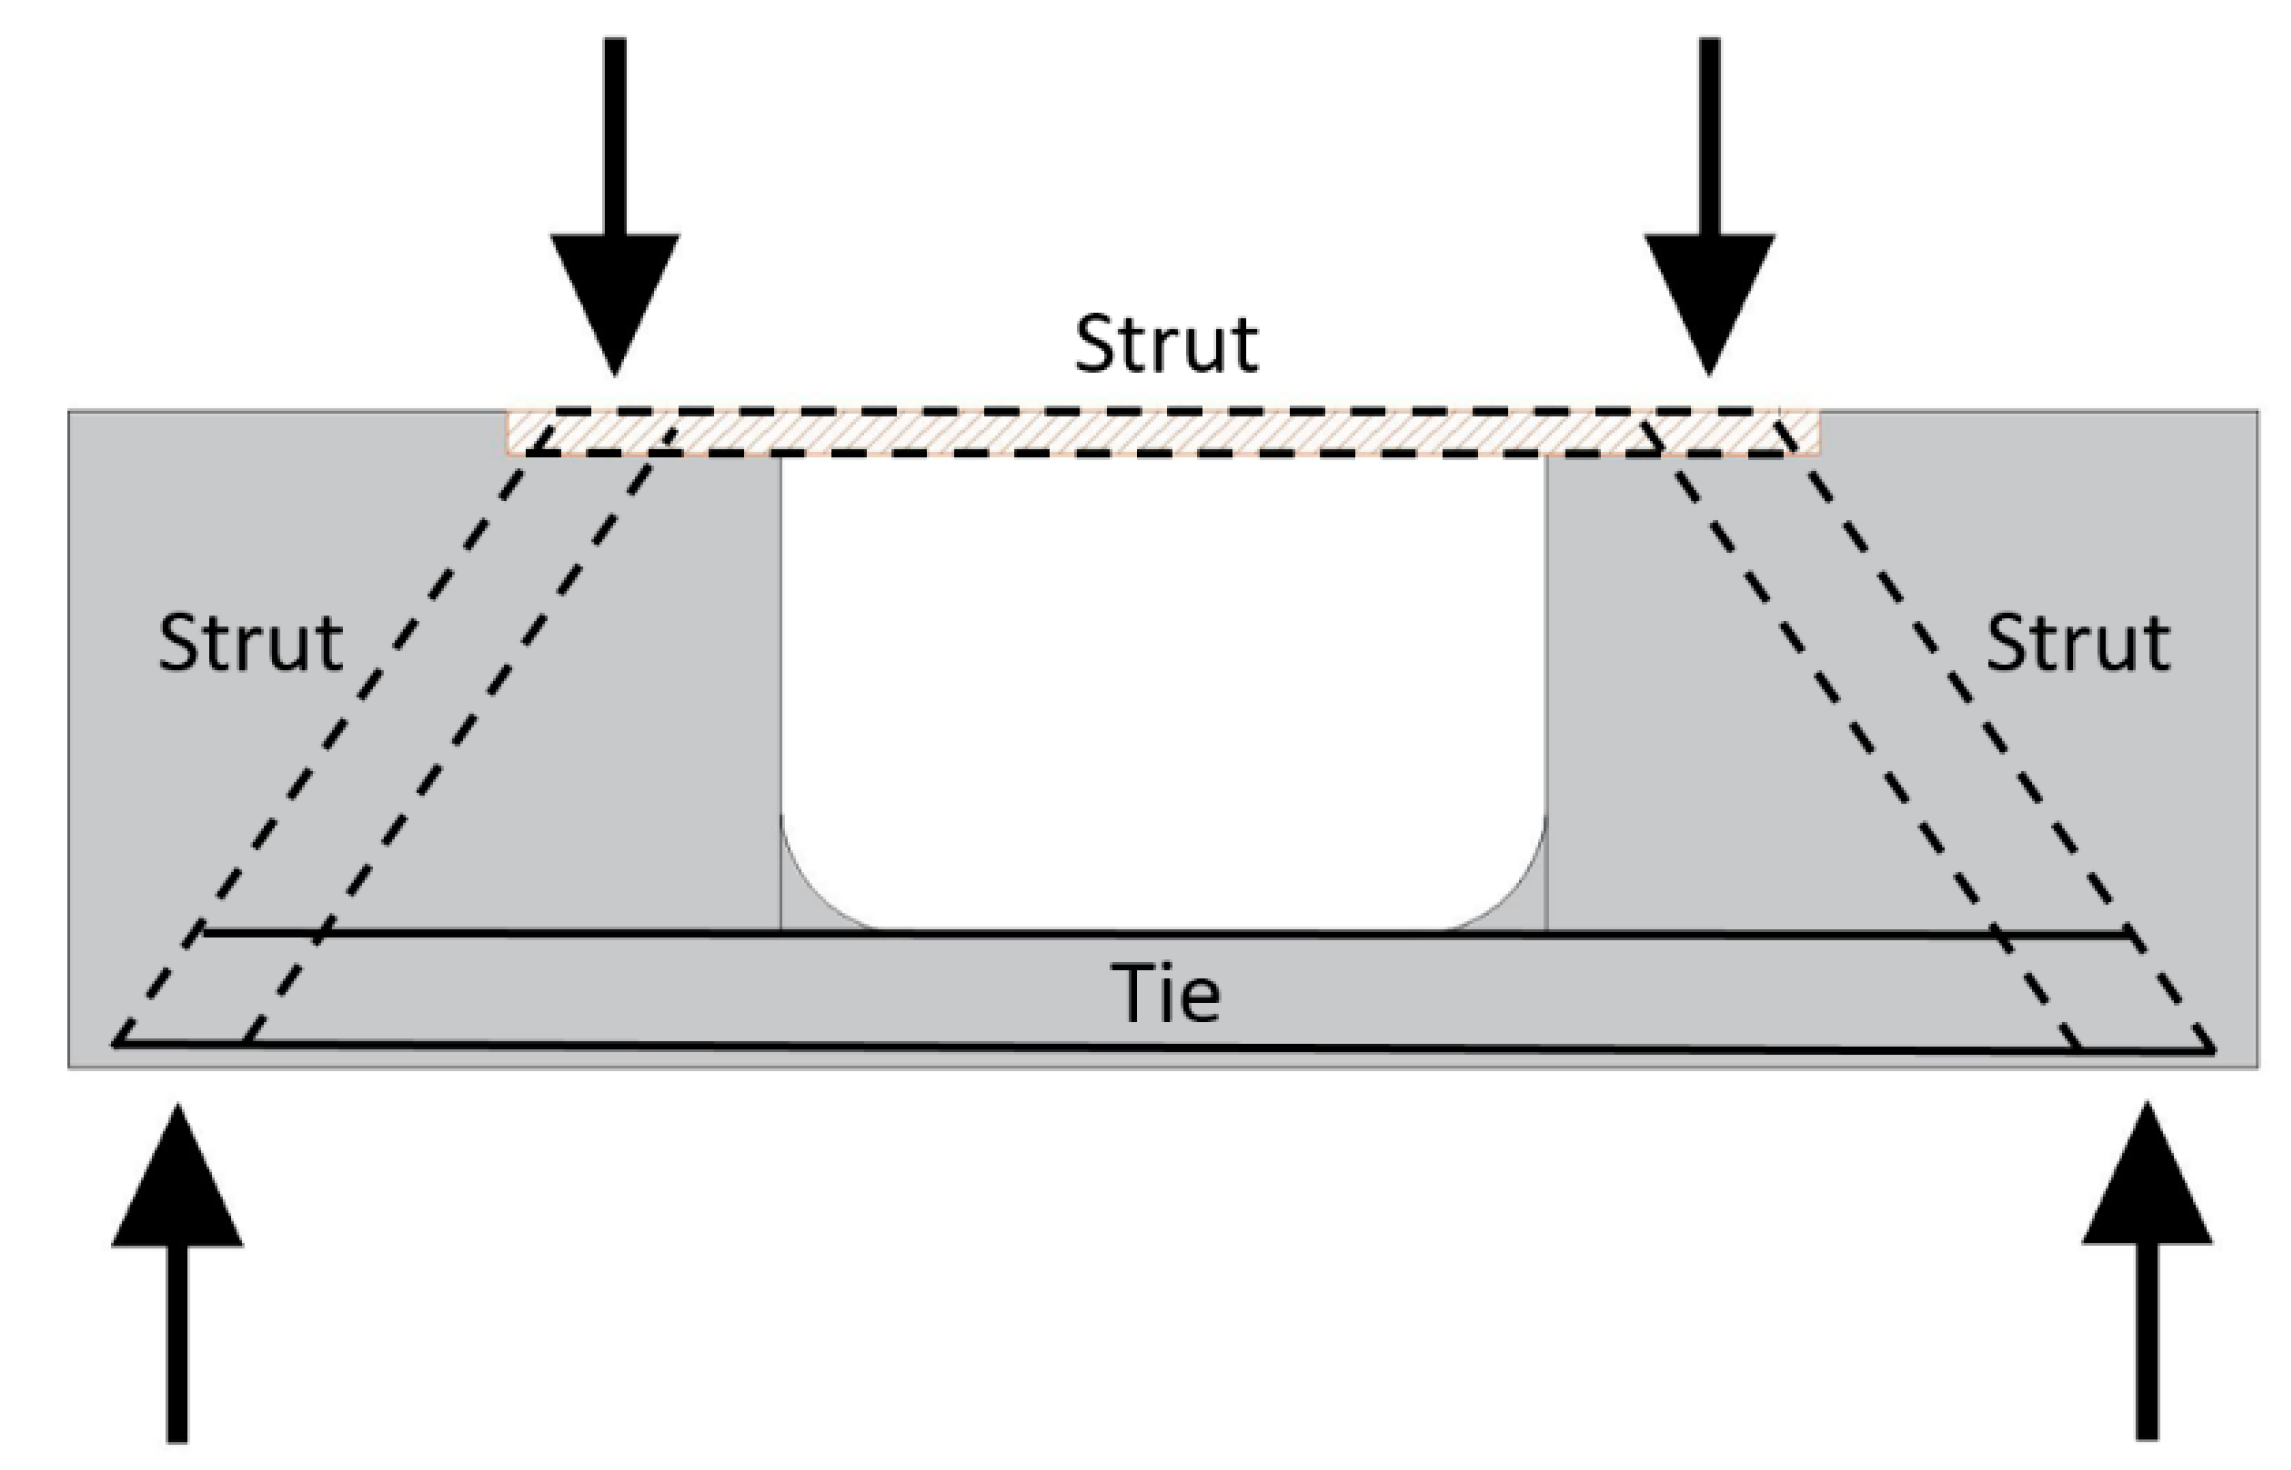
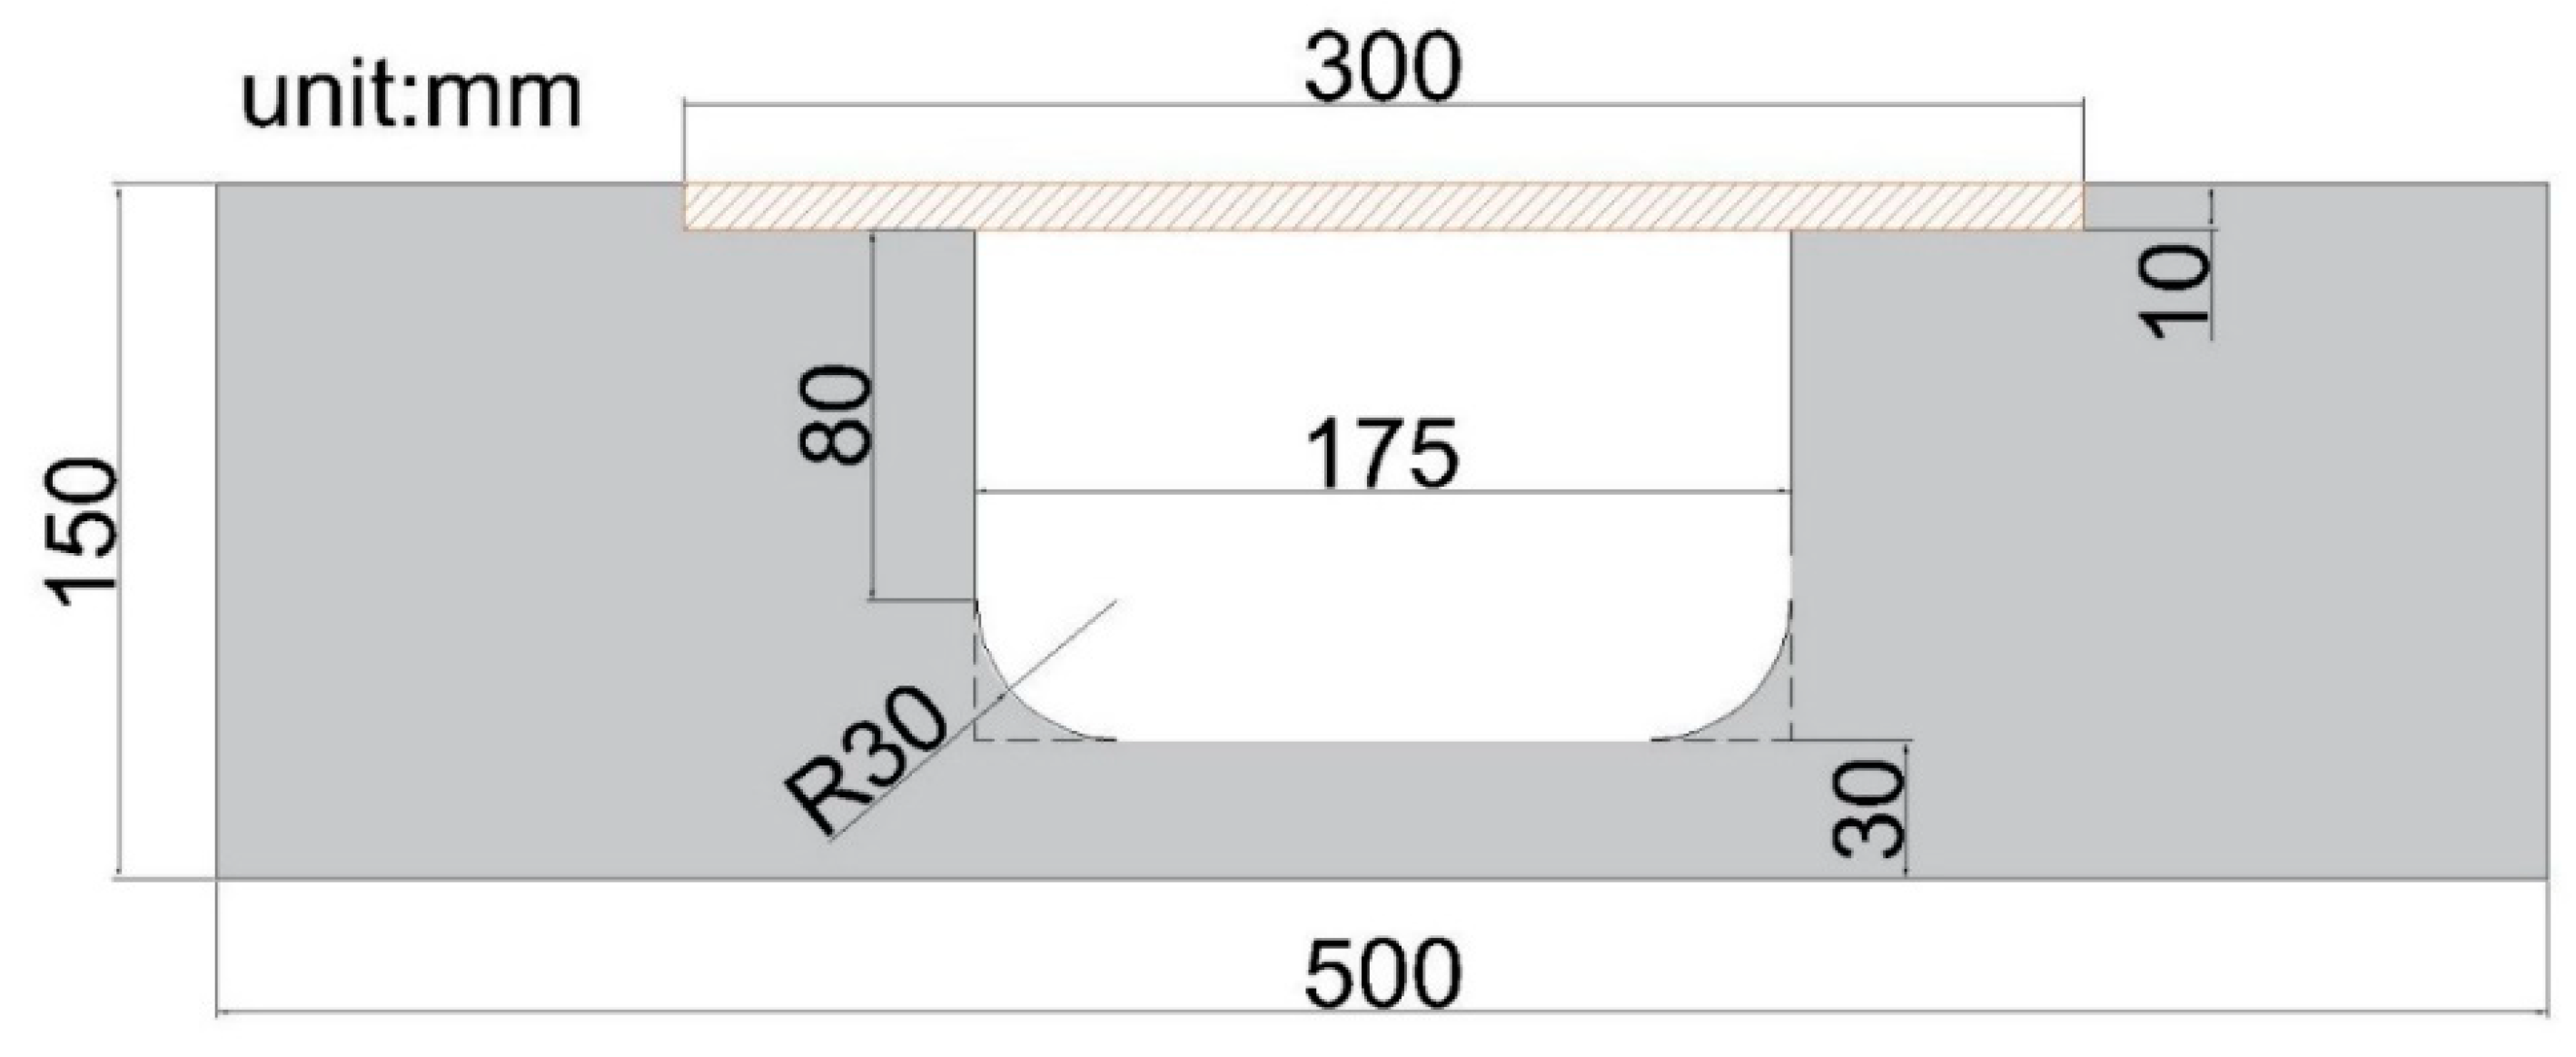
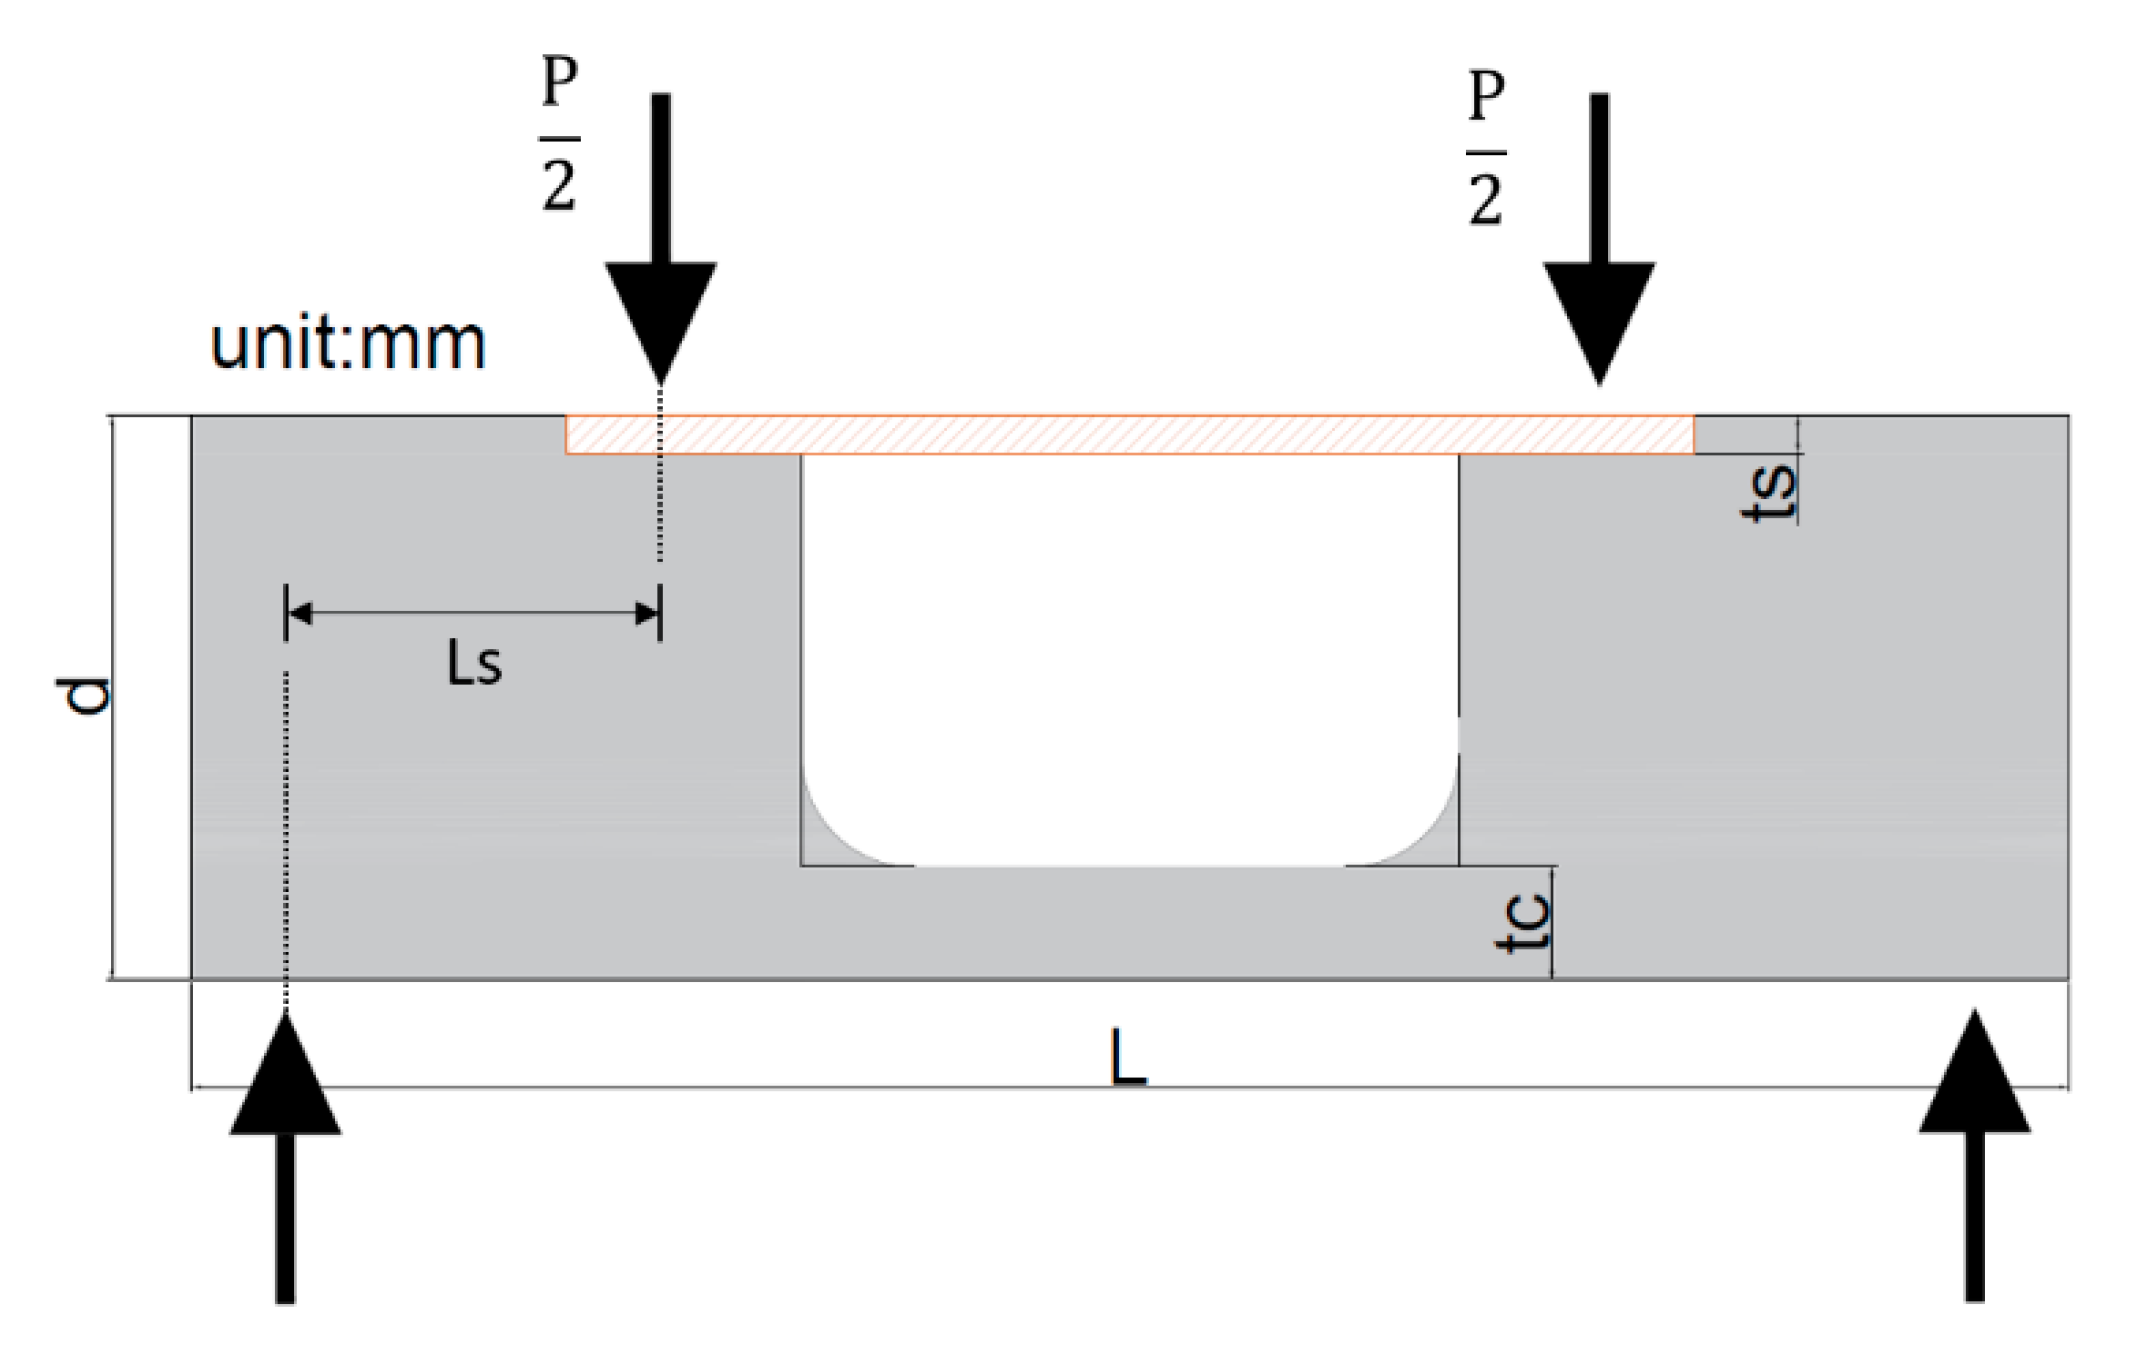
3.1. Design of Strut-and-Tie Beam Specimen
3.2. Materials
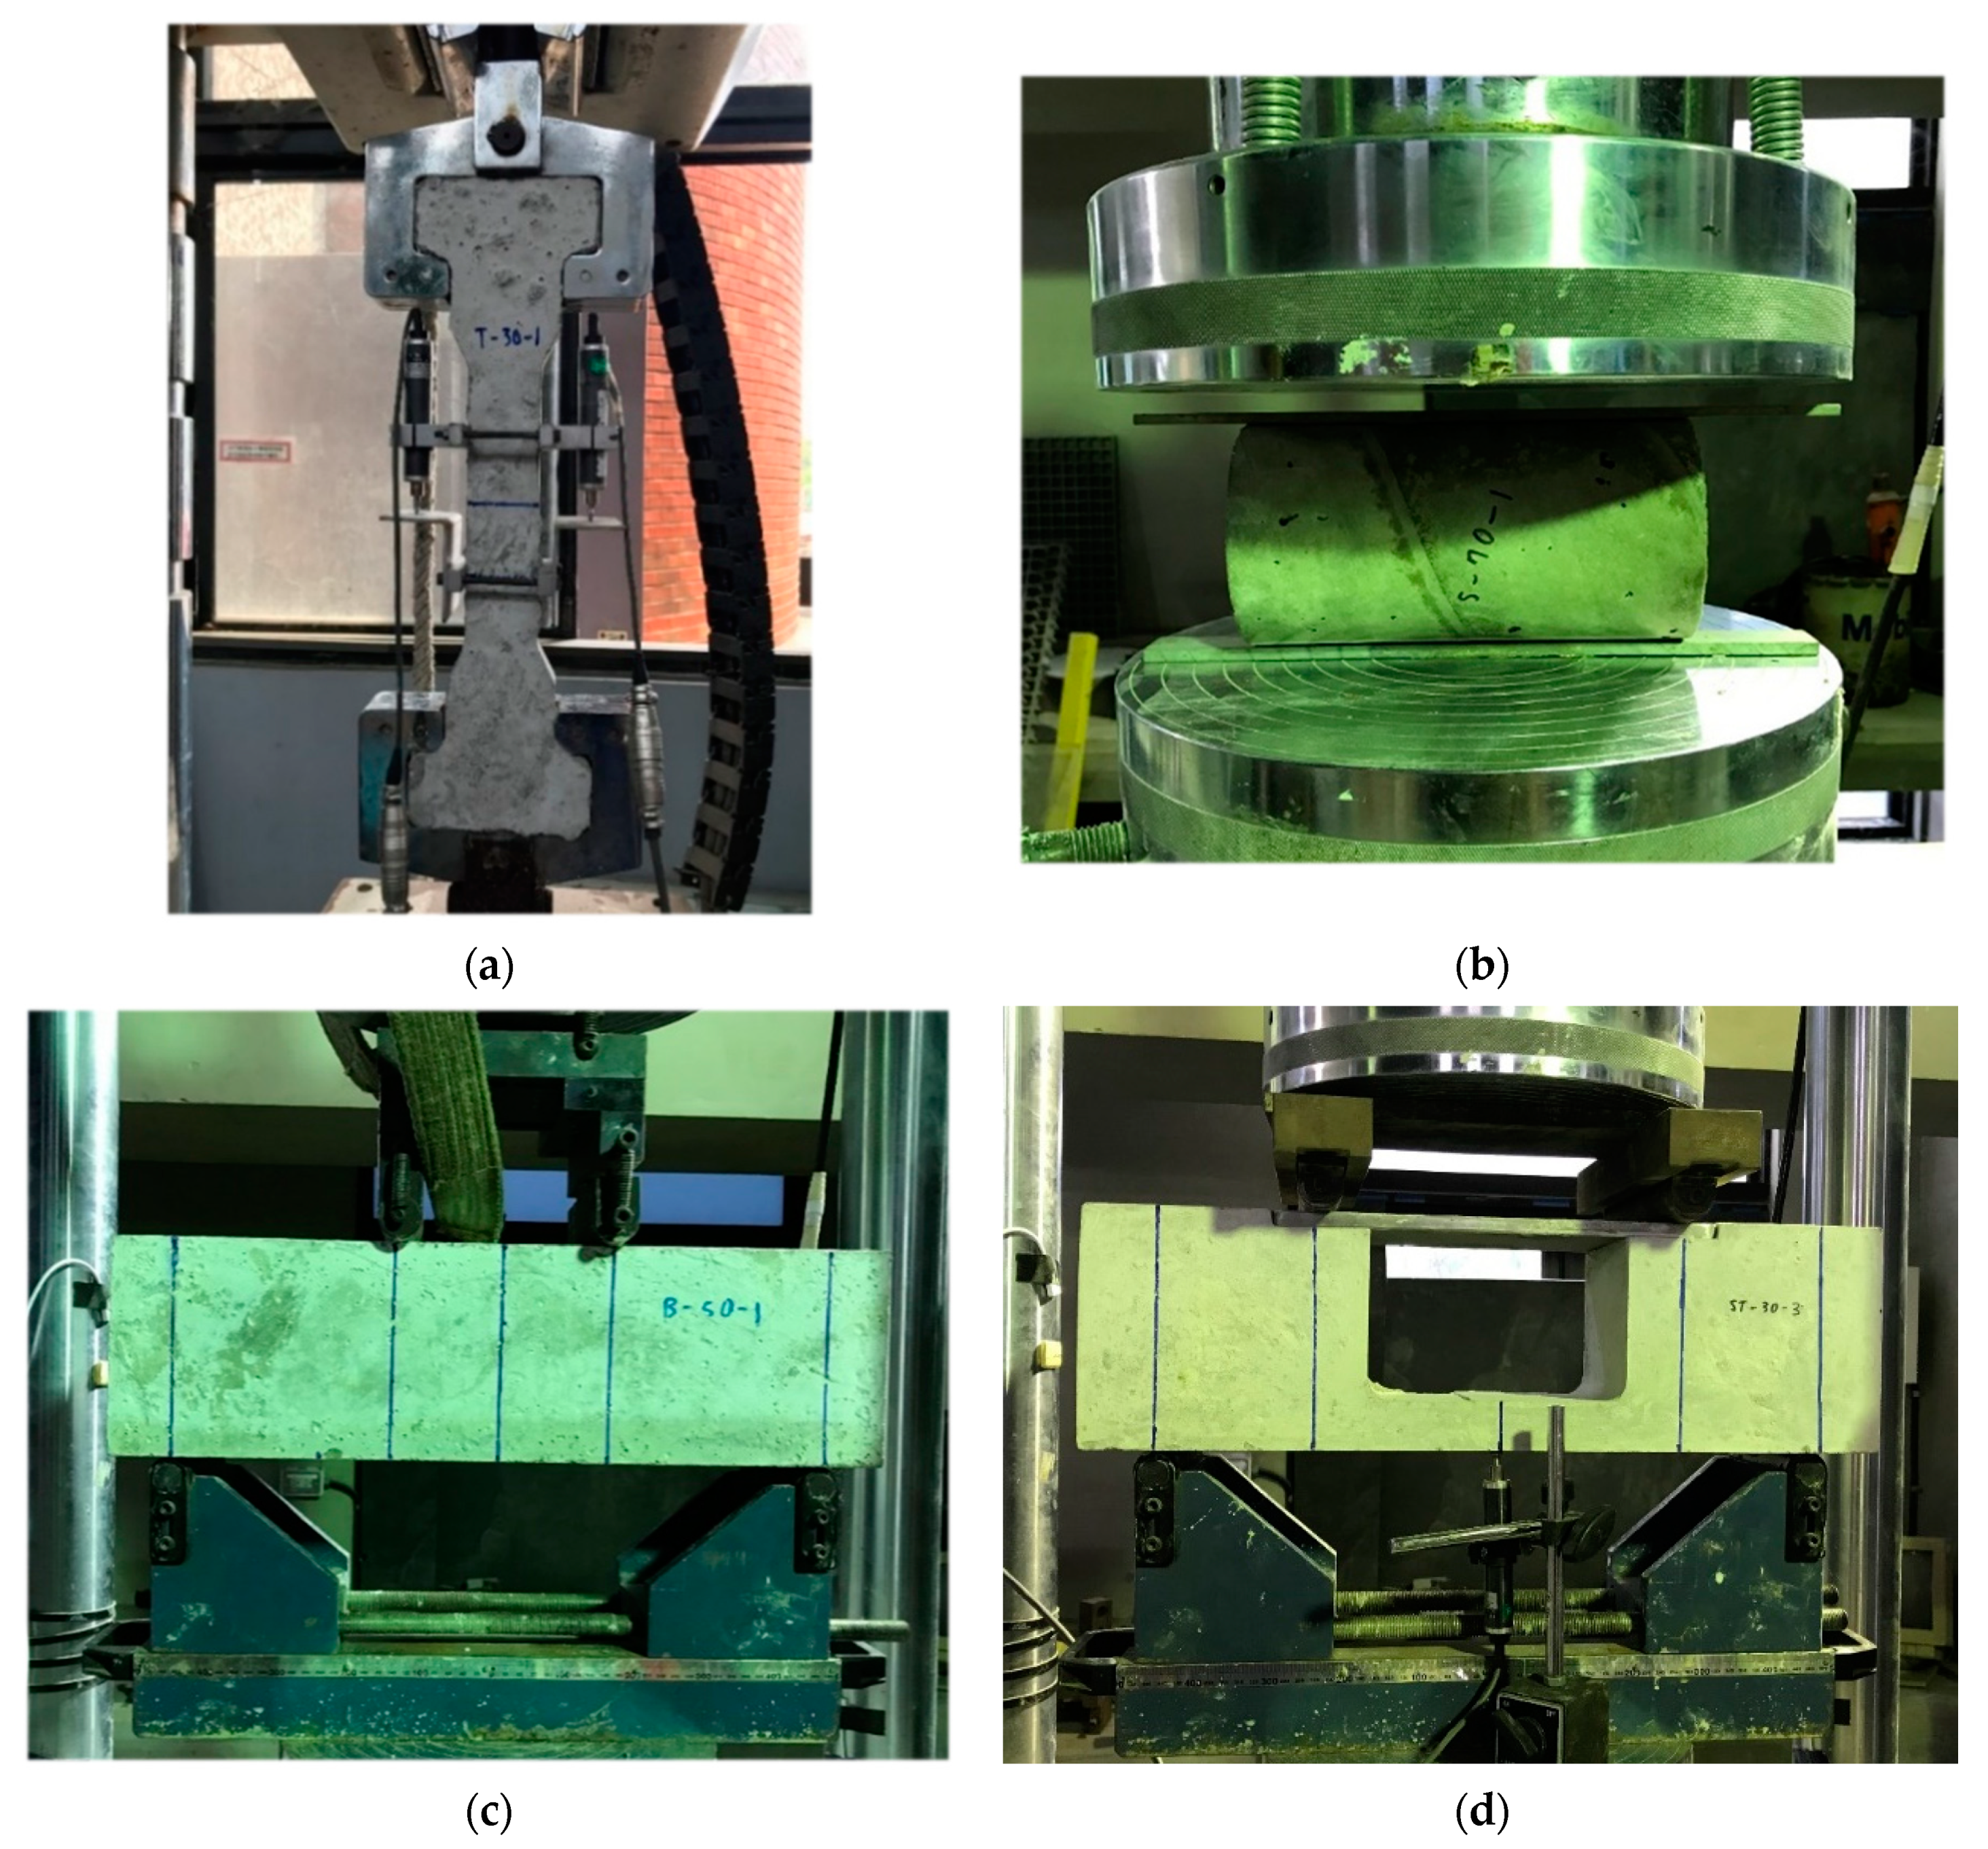
3.3. Test Setup
4. Calculation of Concrete Tensile Strength
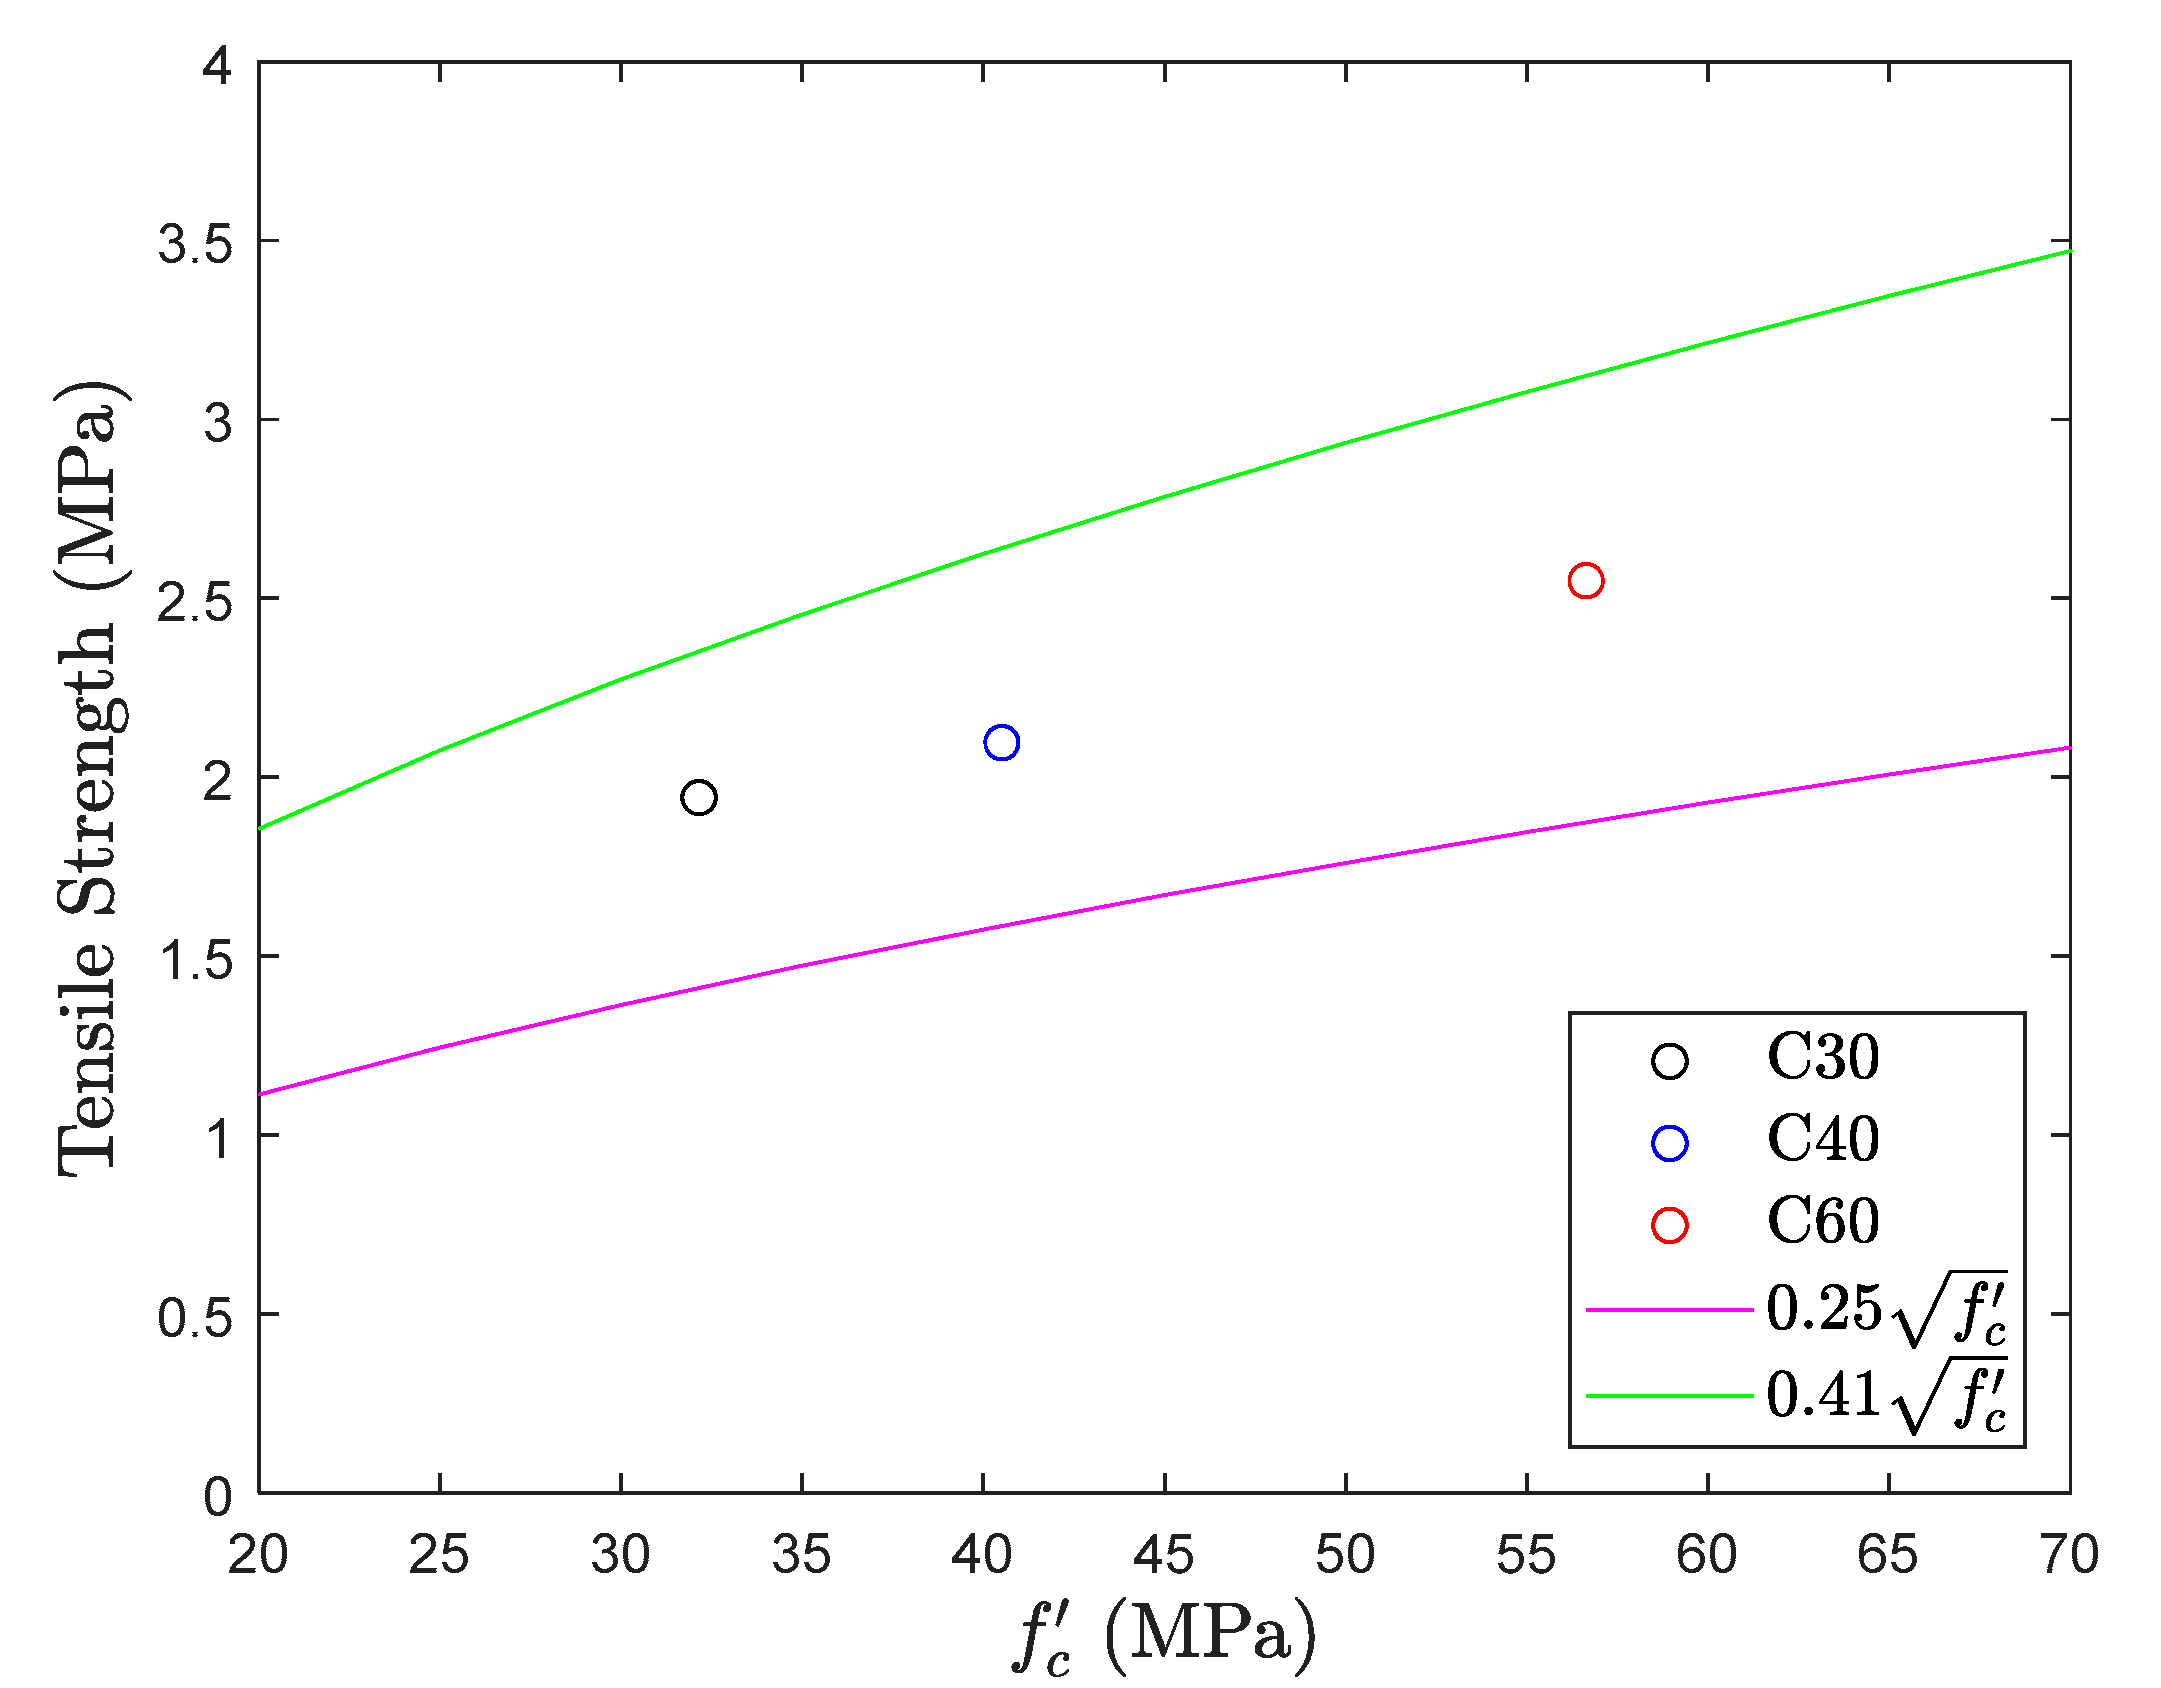
4.1. Readily Available Tensile Strength Interpretation Formulas In a Tabular Form (Table 4)
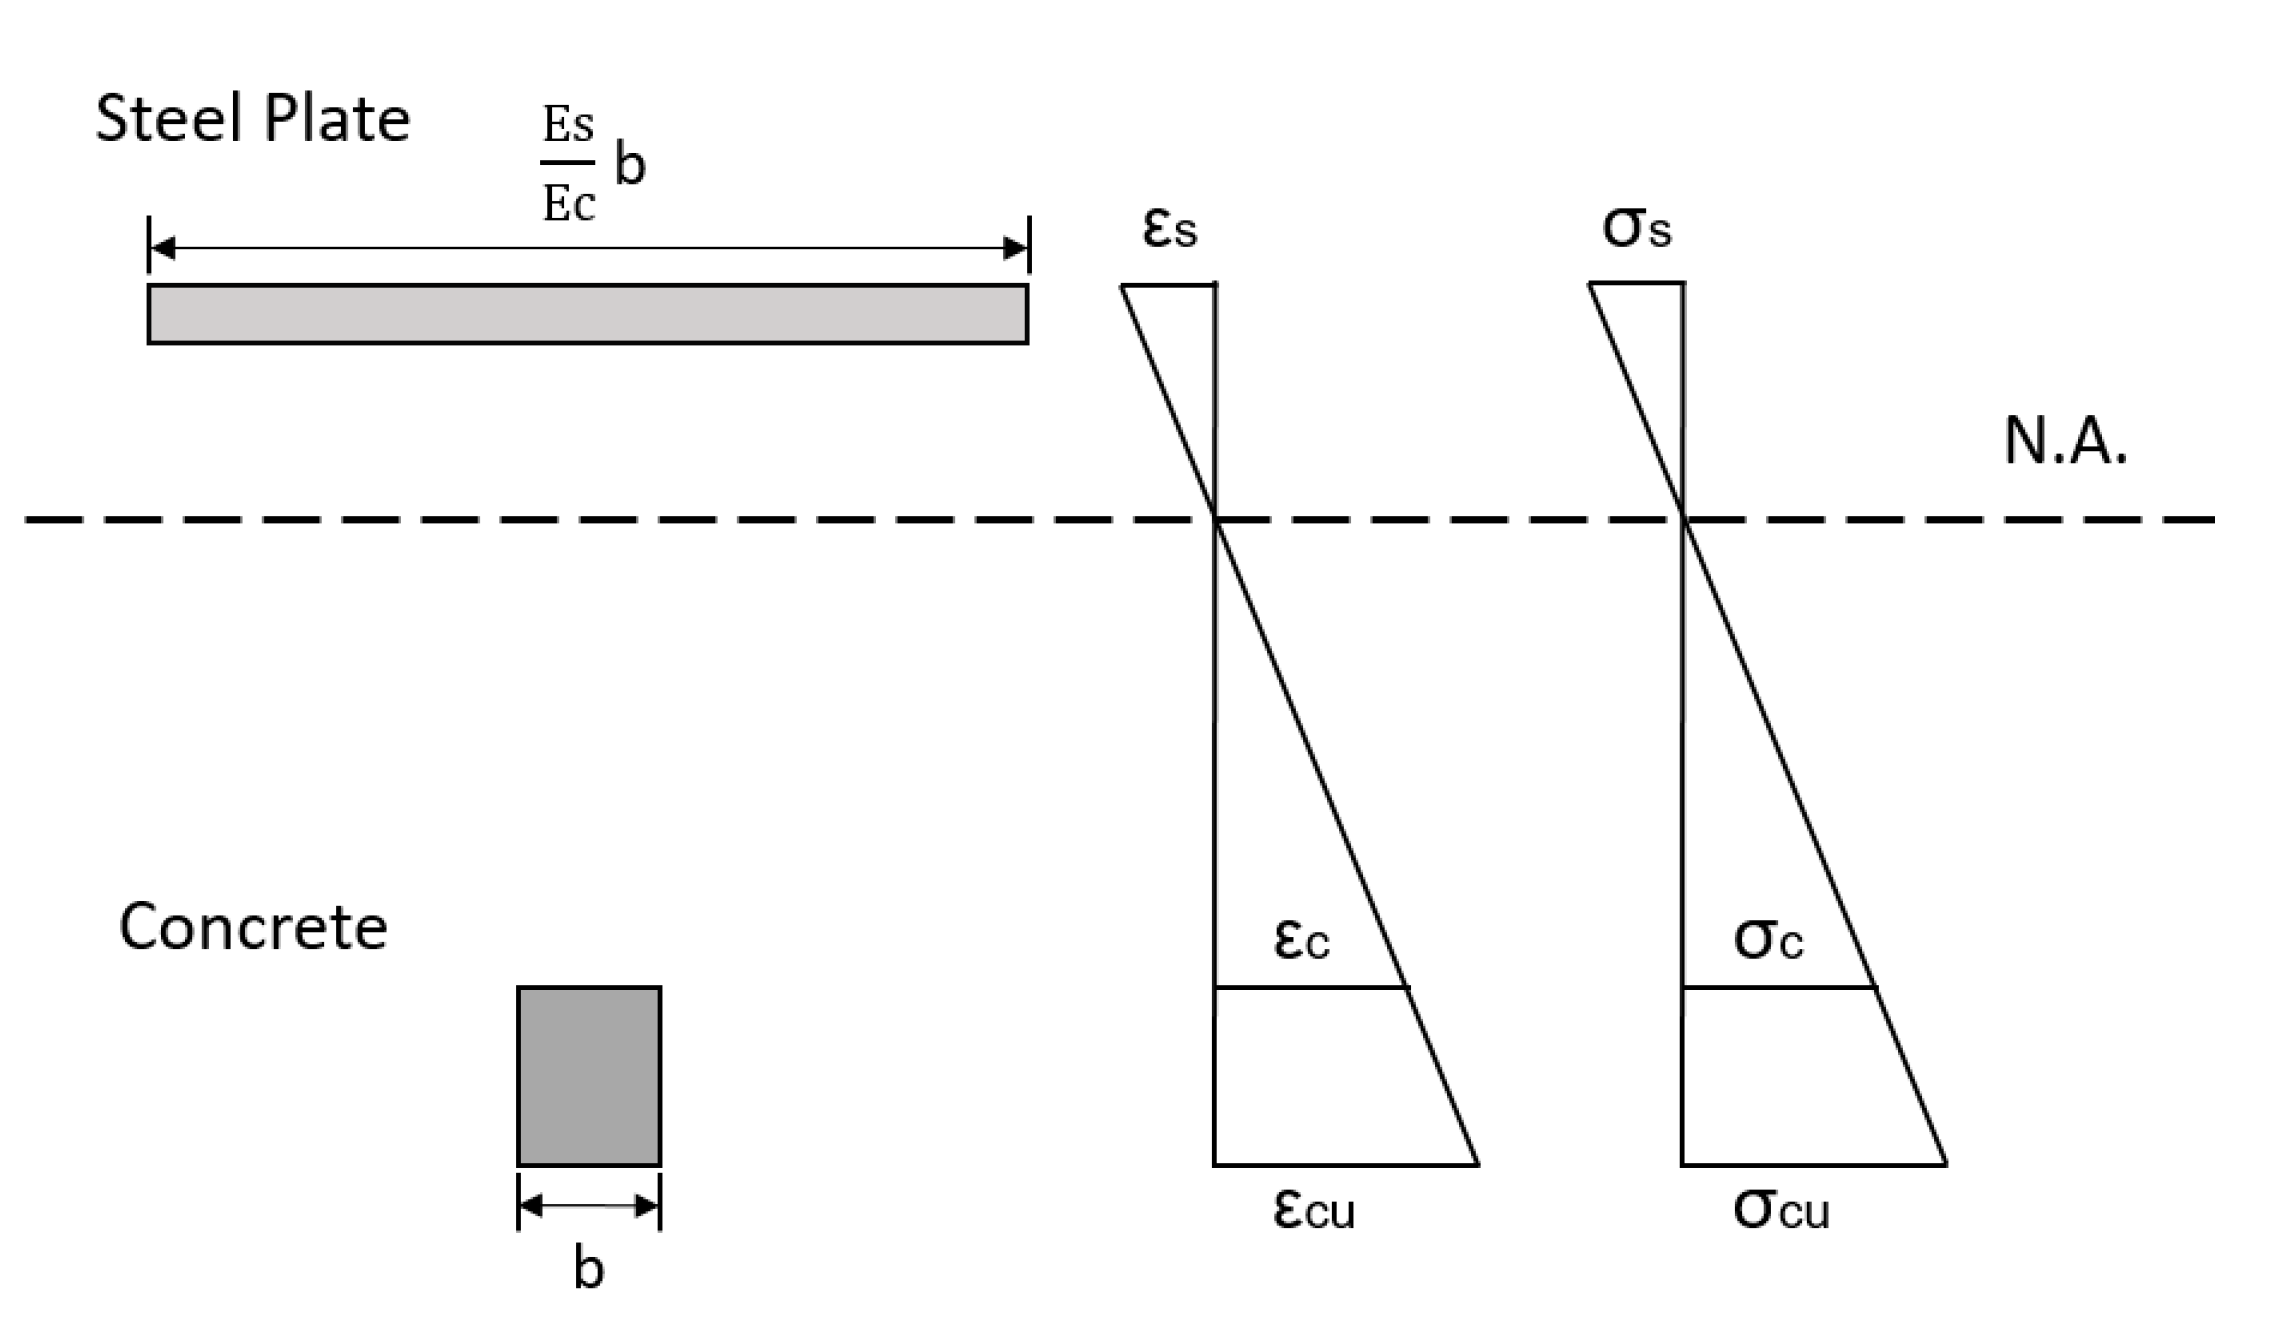
4.2. Strut-and-Tie Method
5. Test Results
5.1. Compression Test
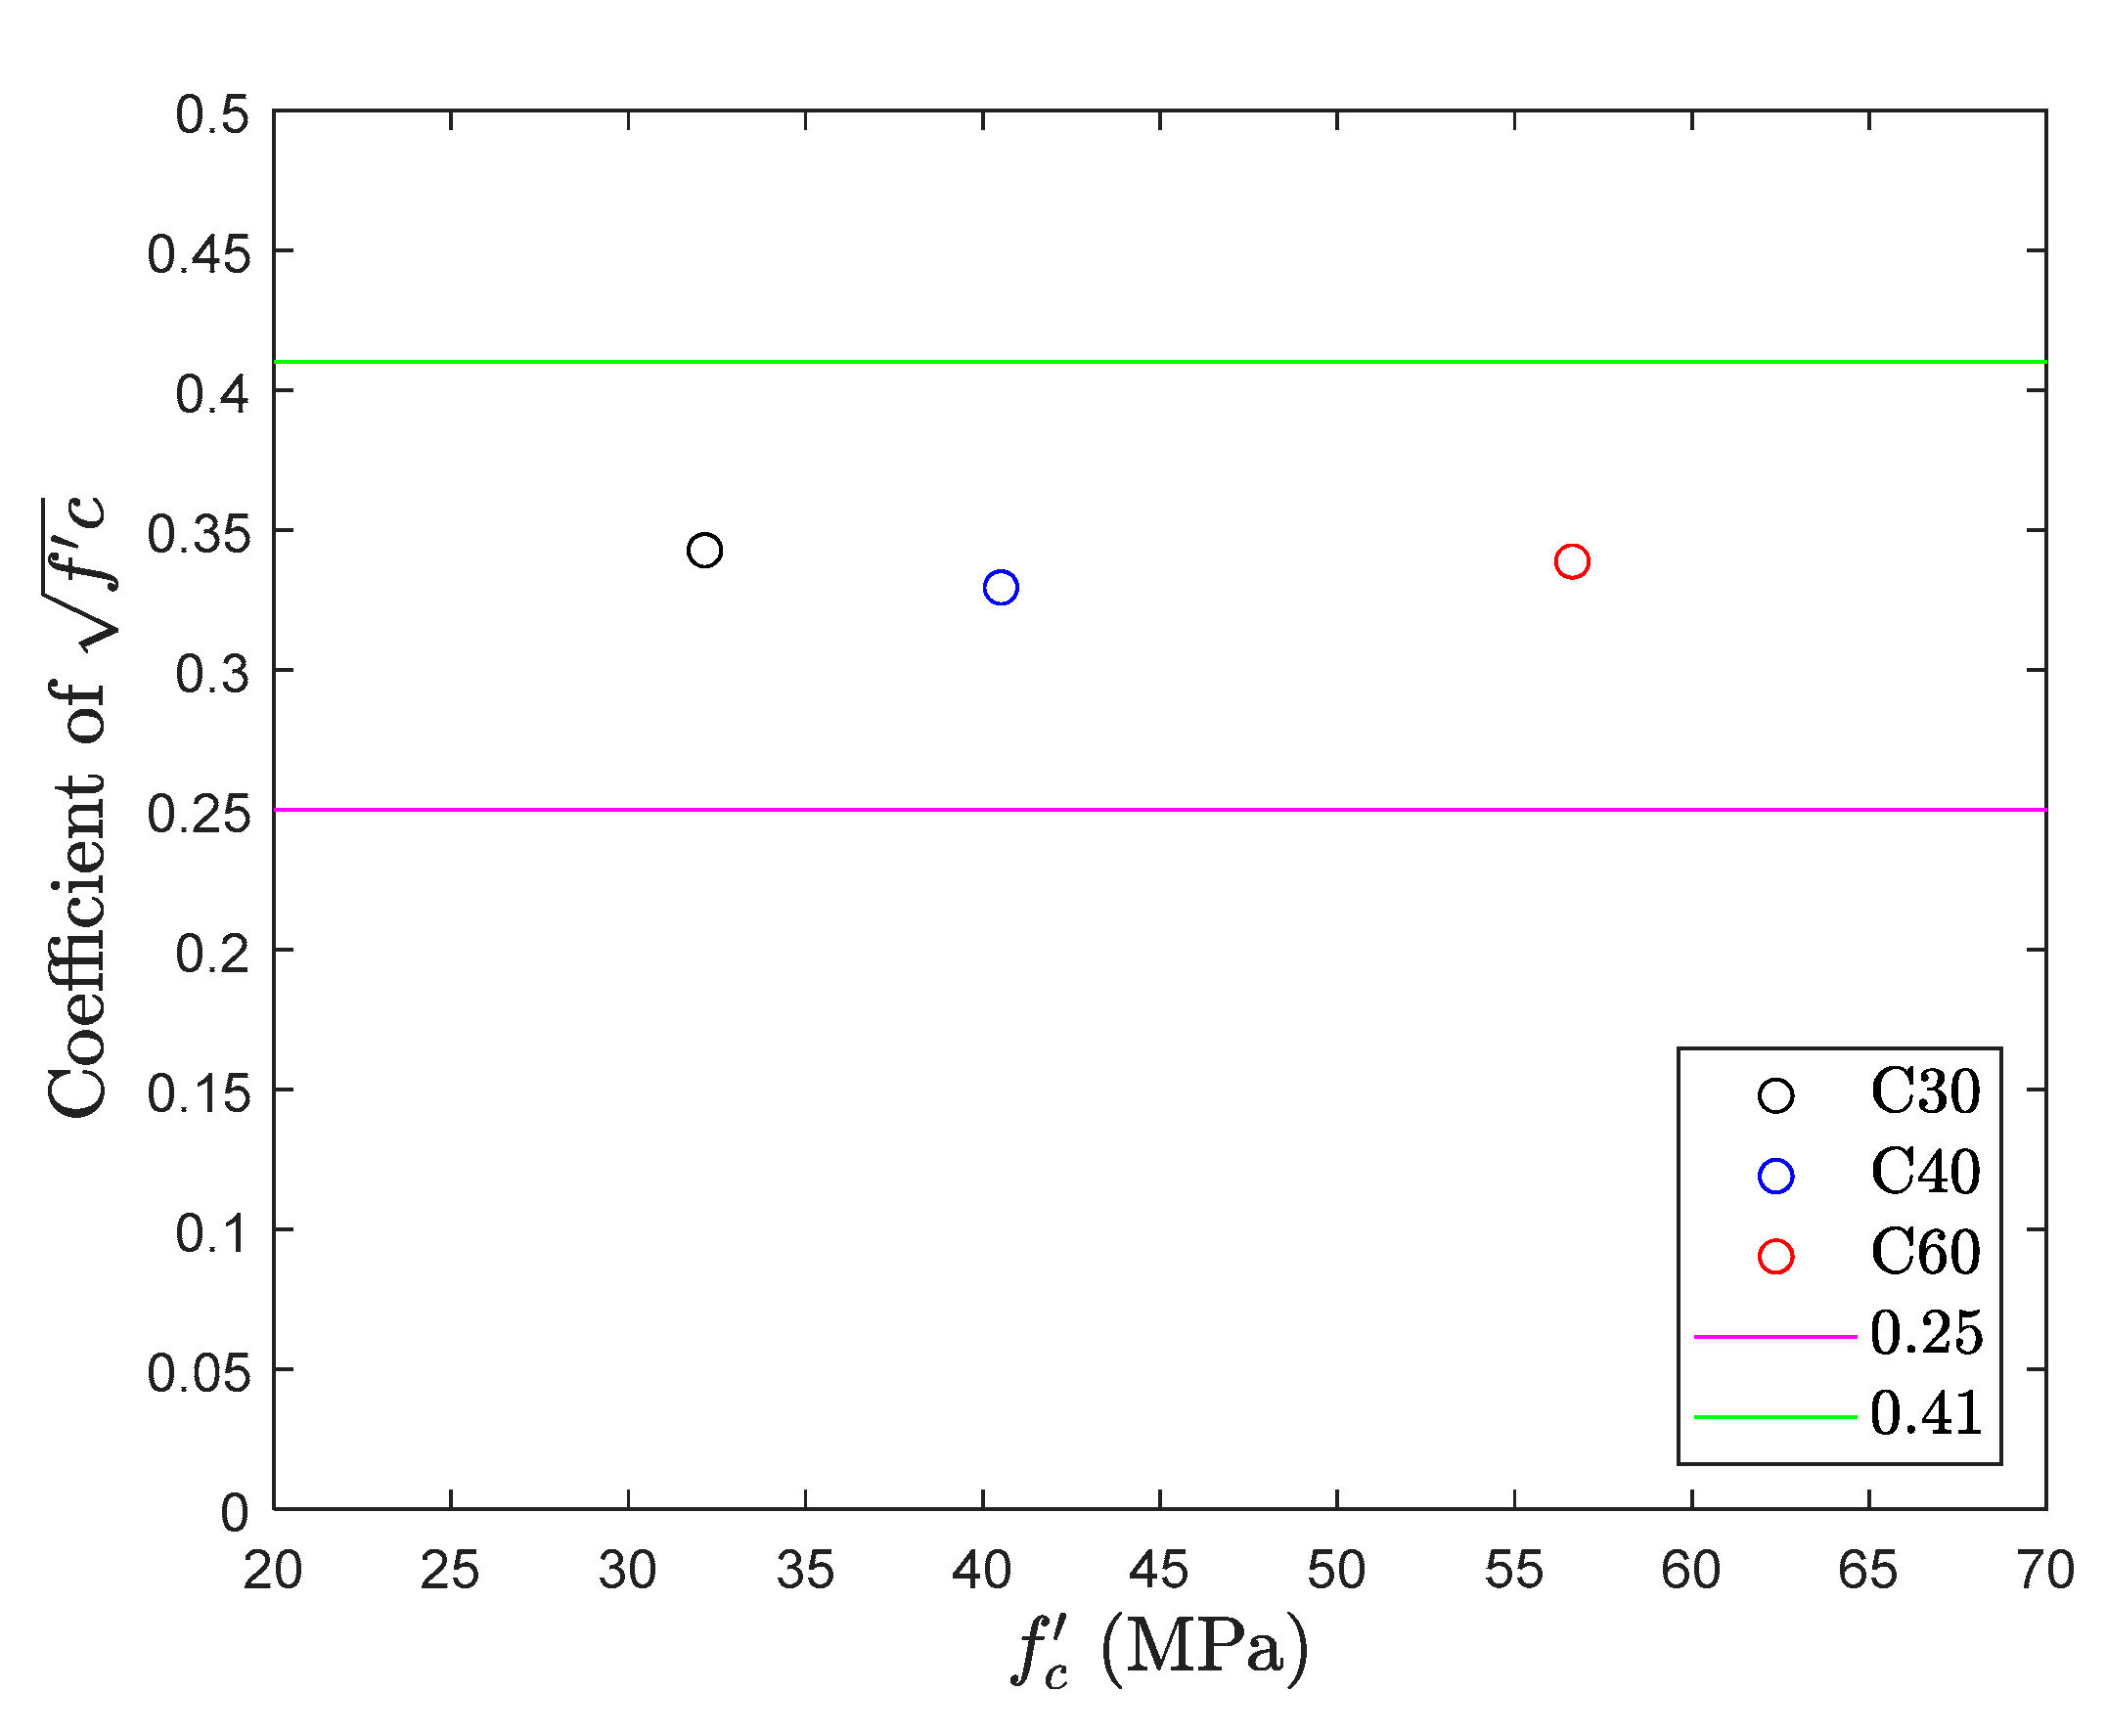
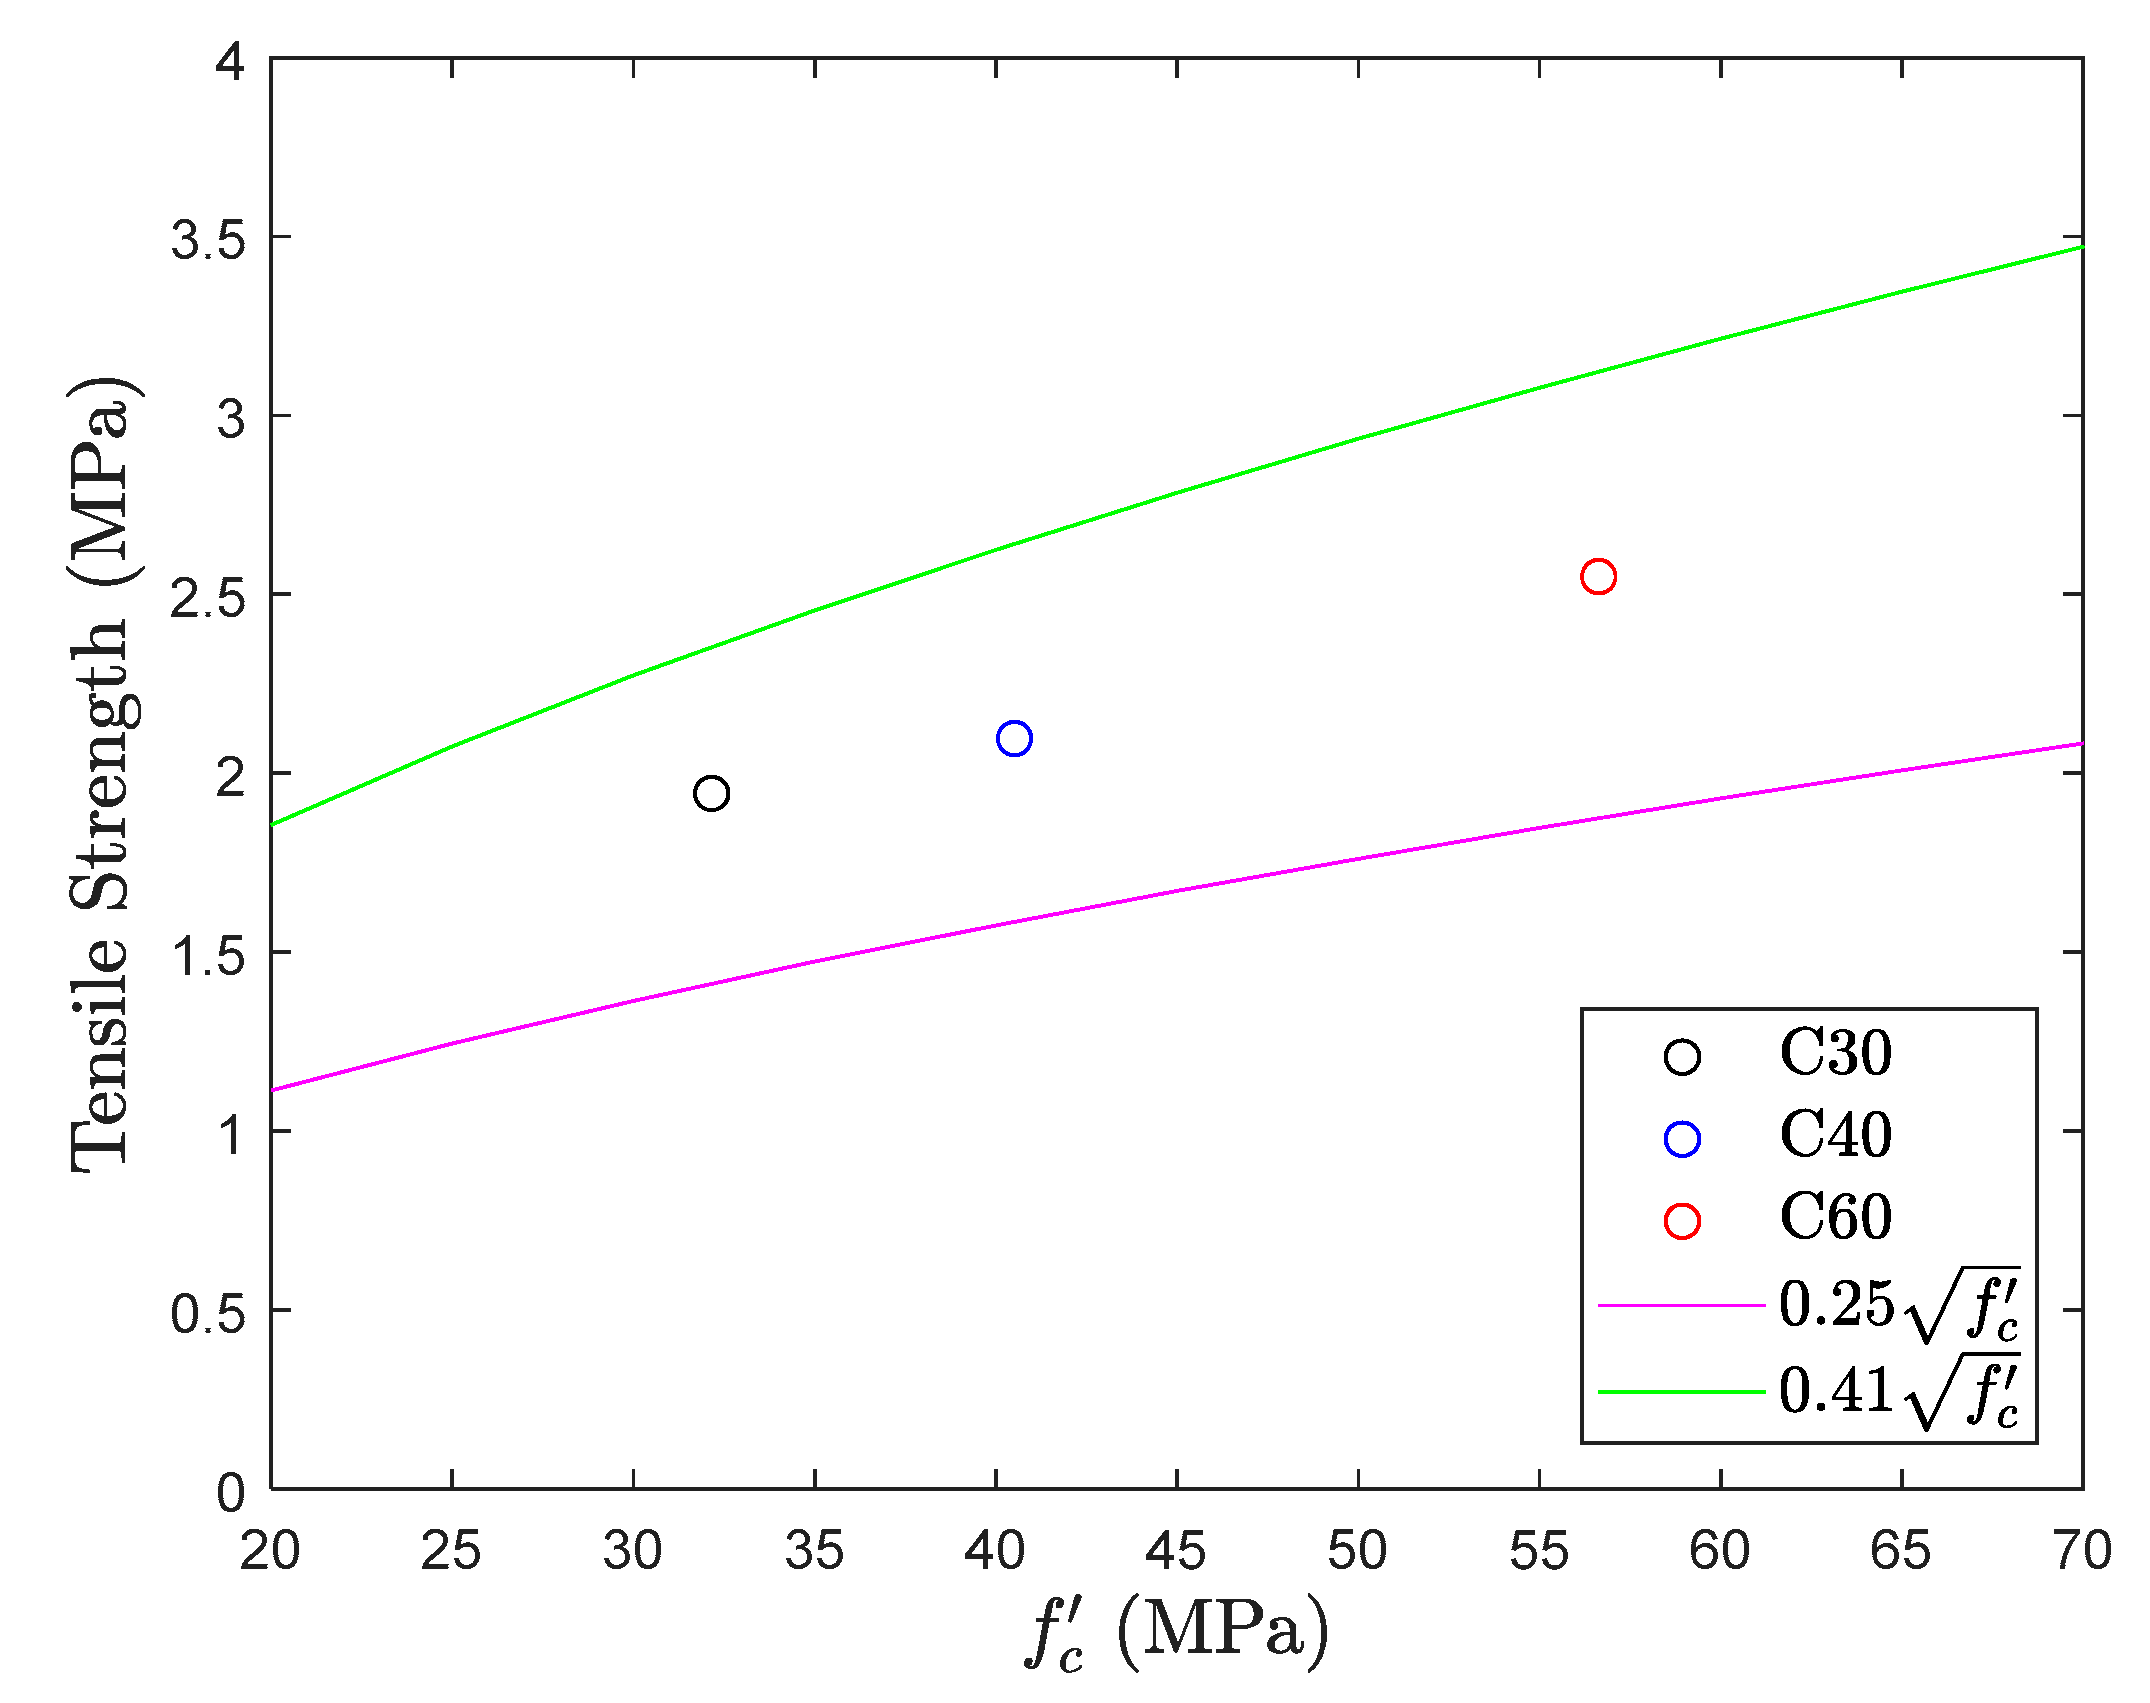
5.2. Direct Tension Test
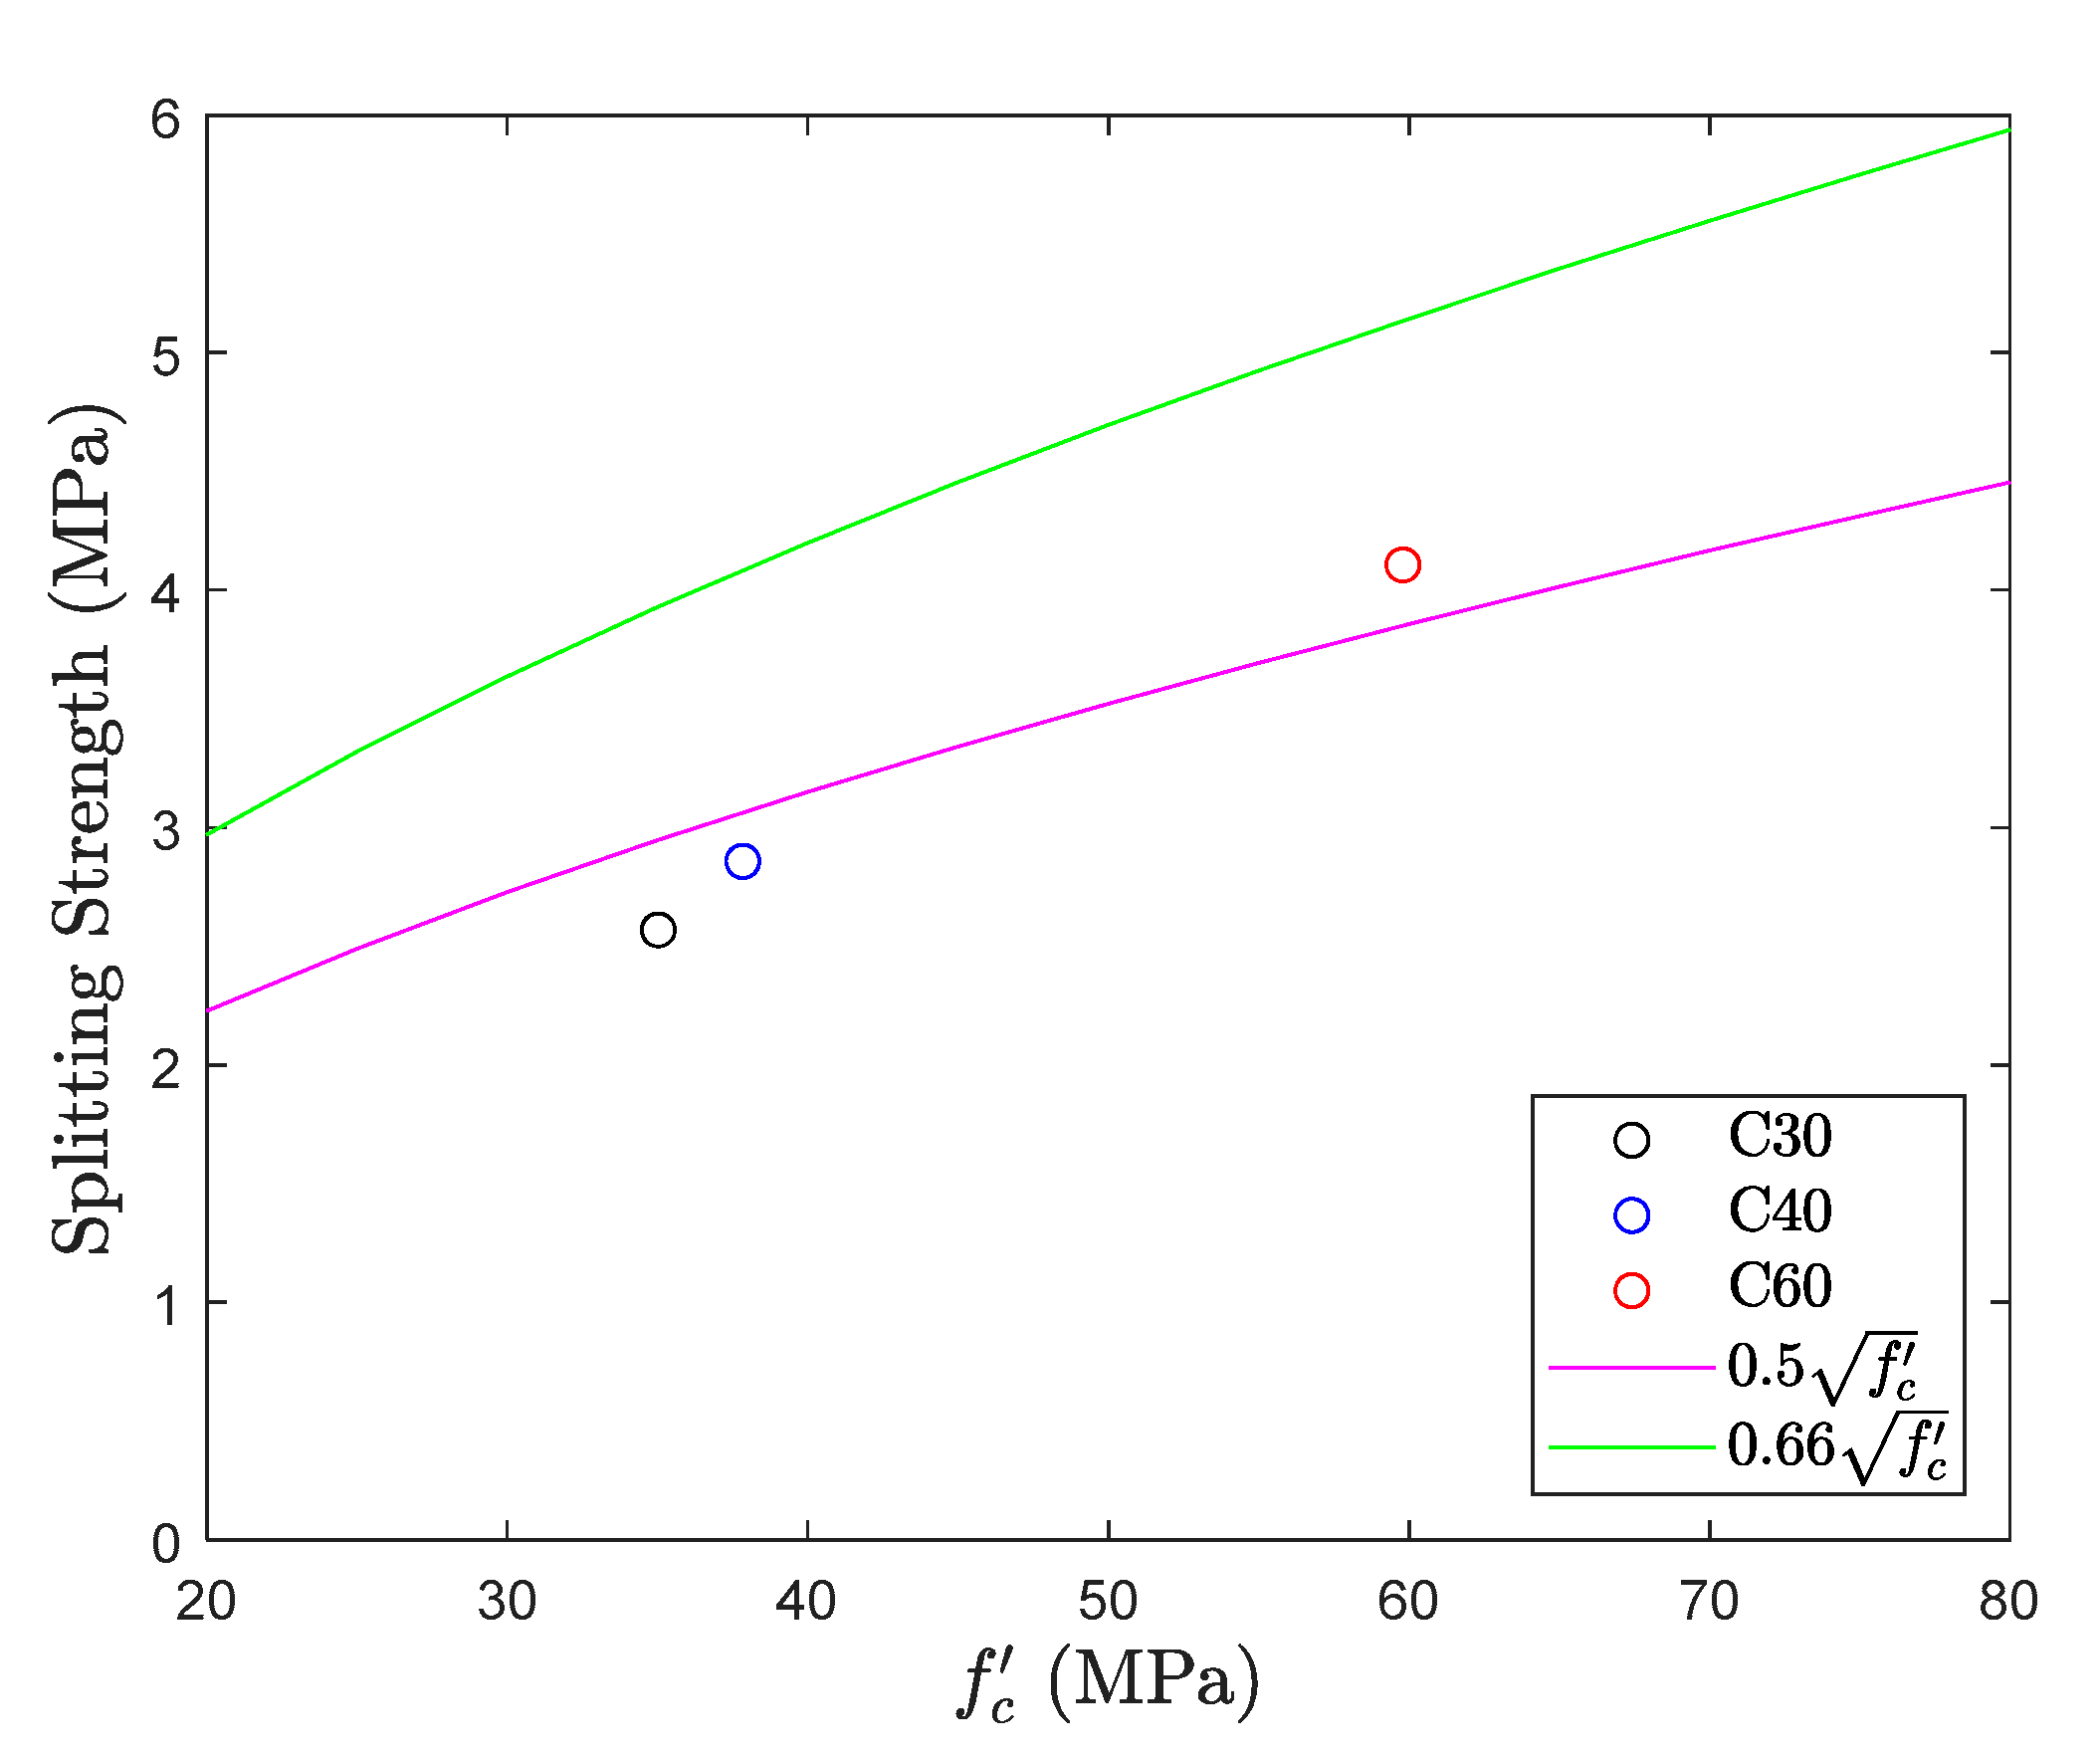
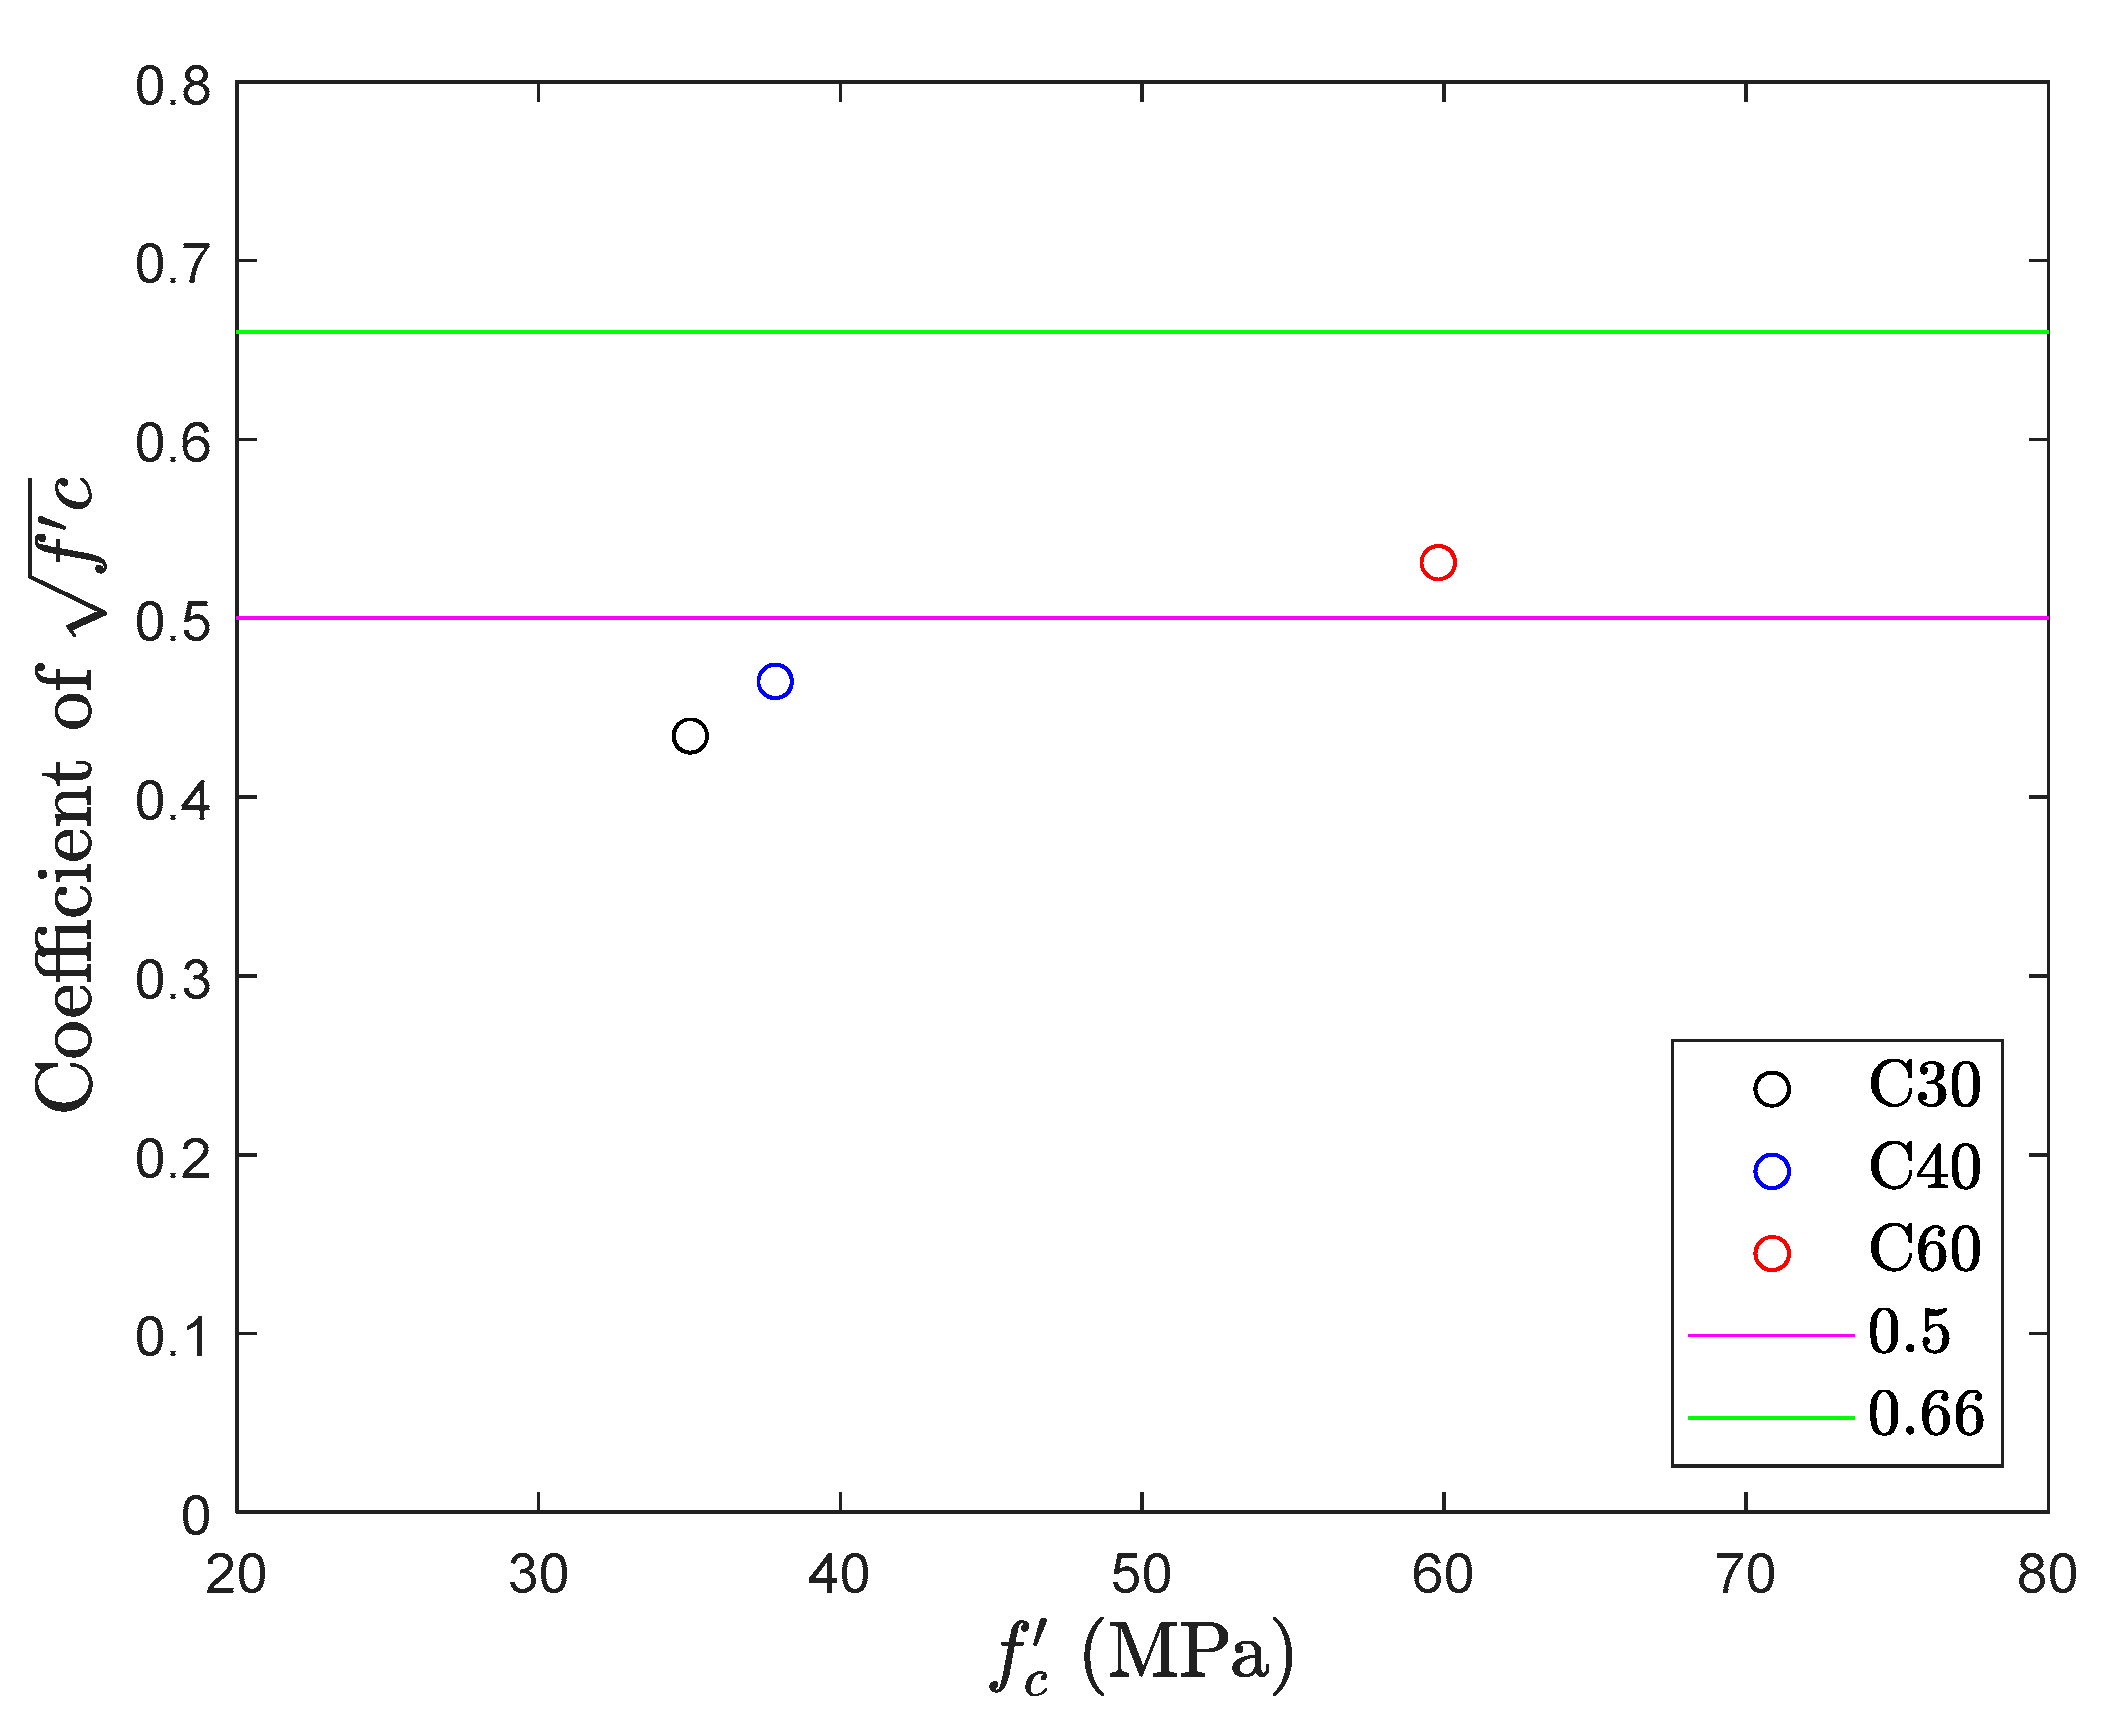
5.3. Splitting Test
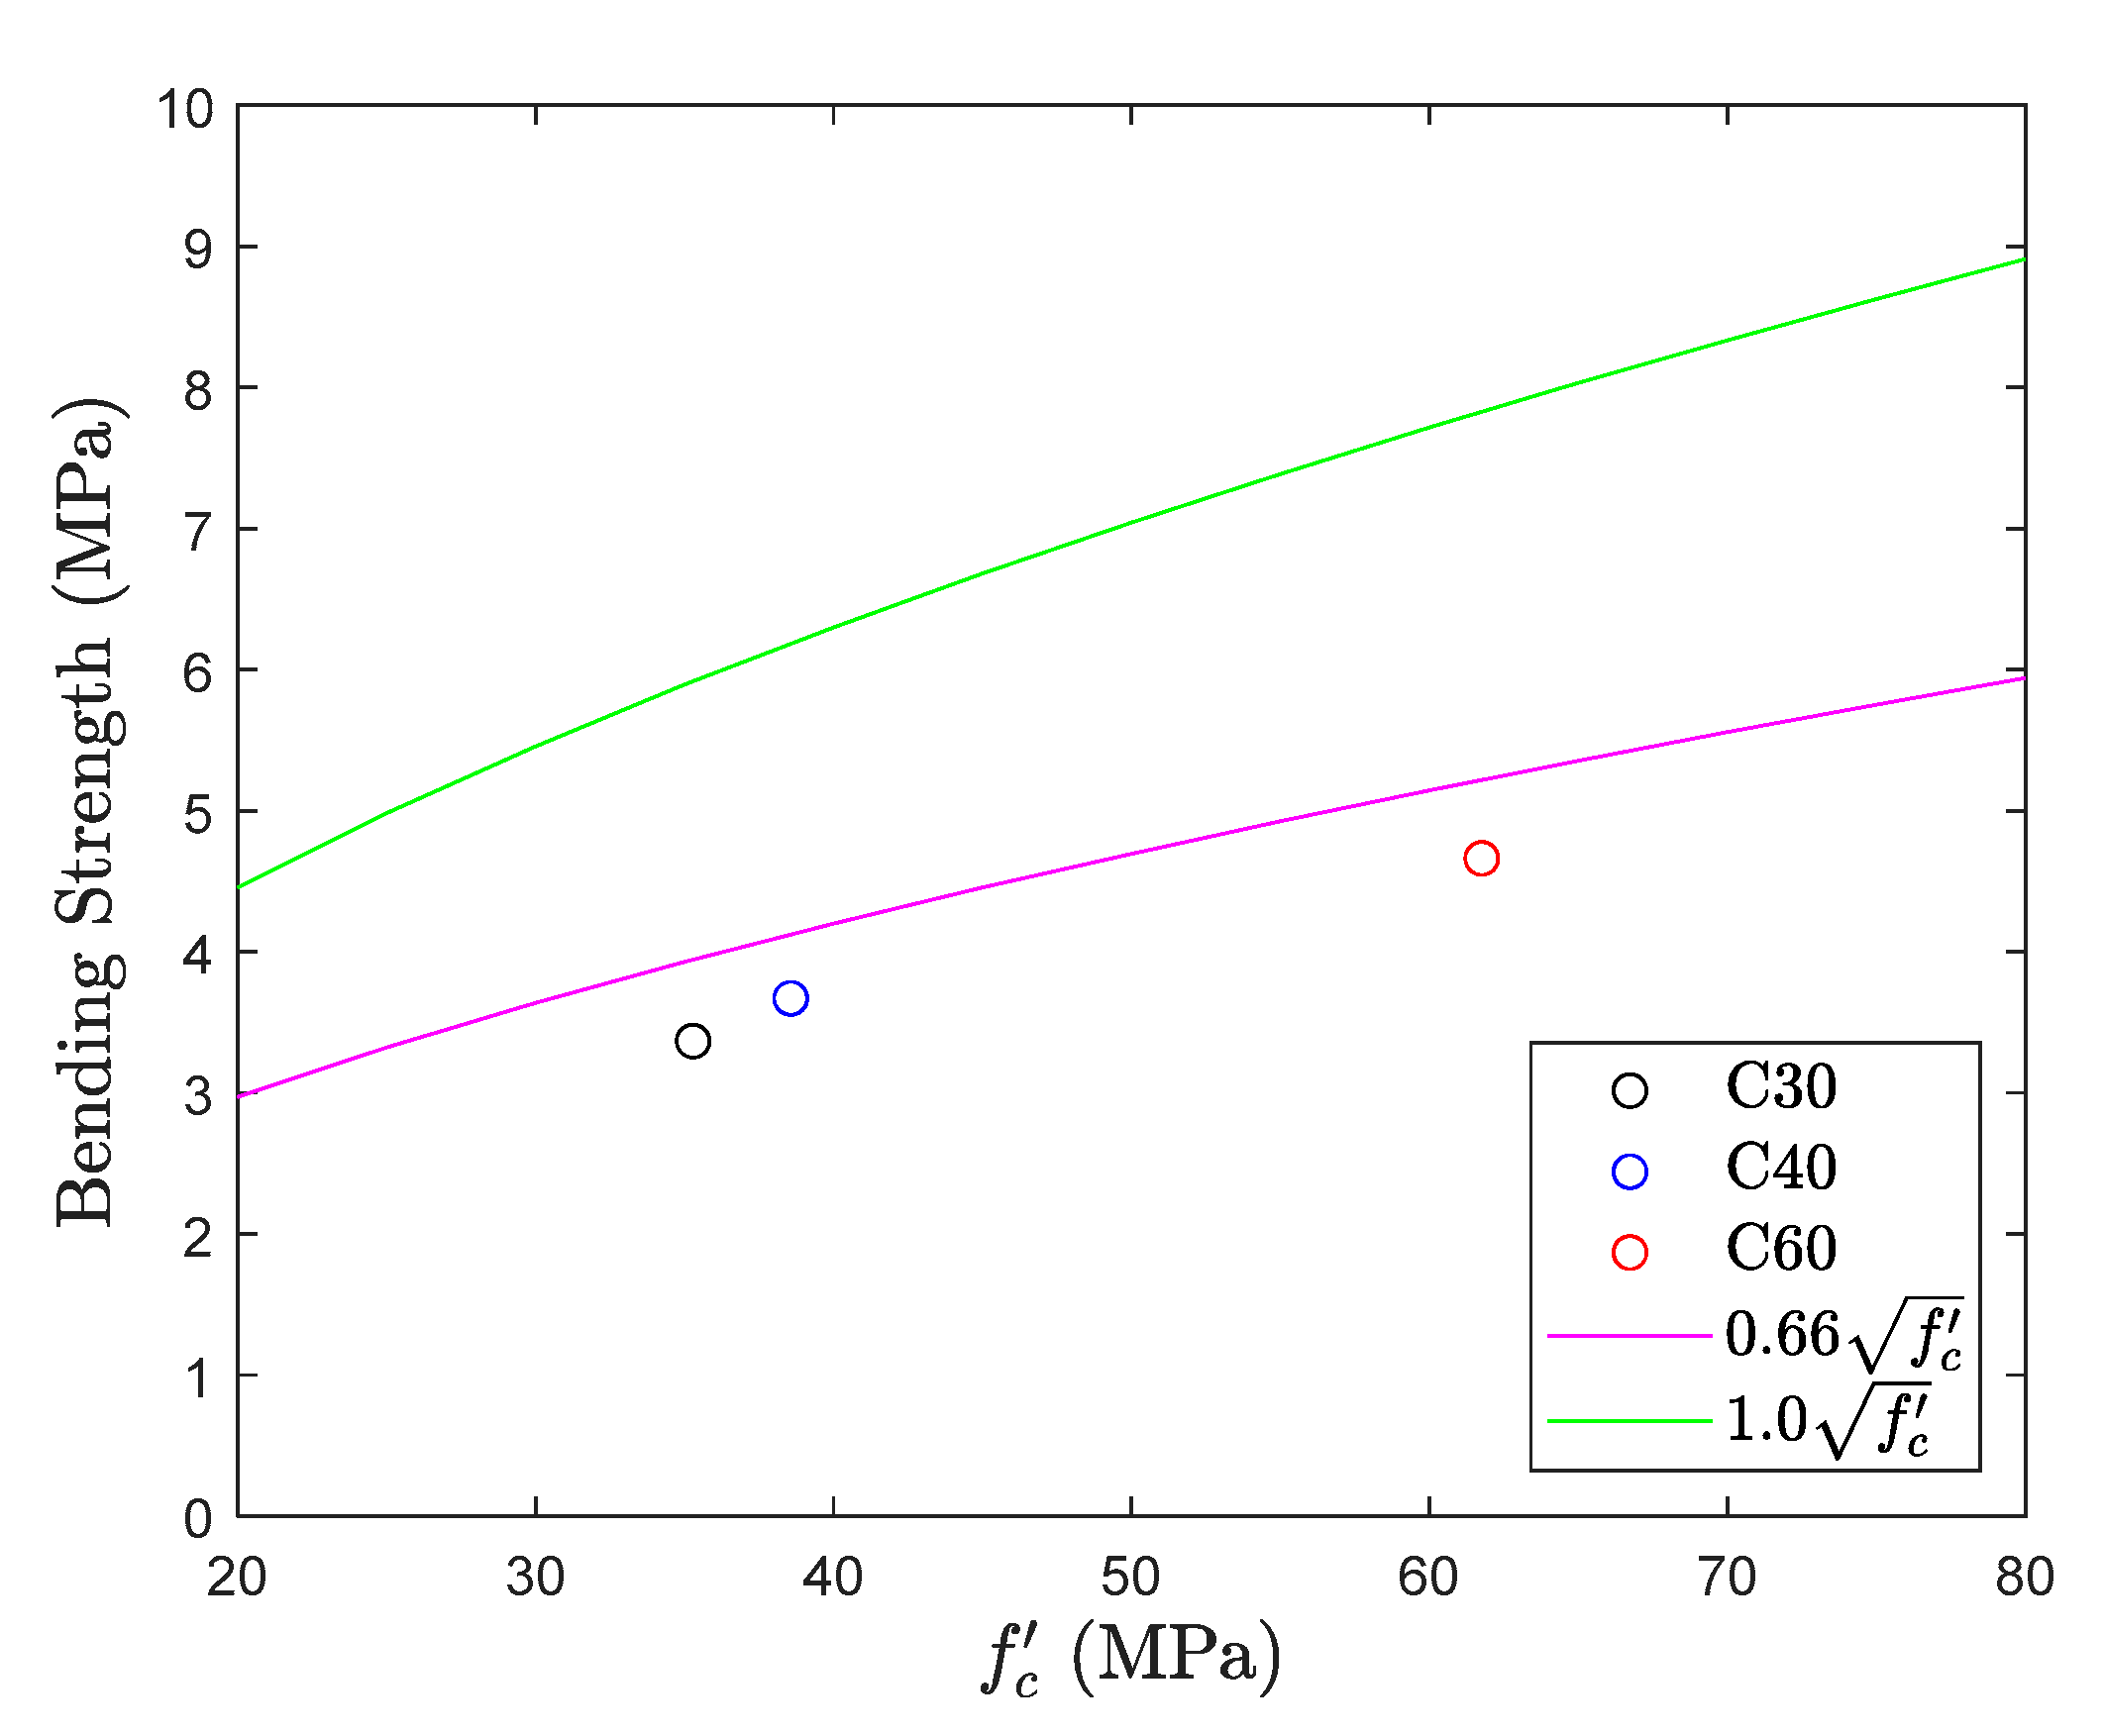
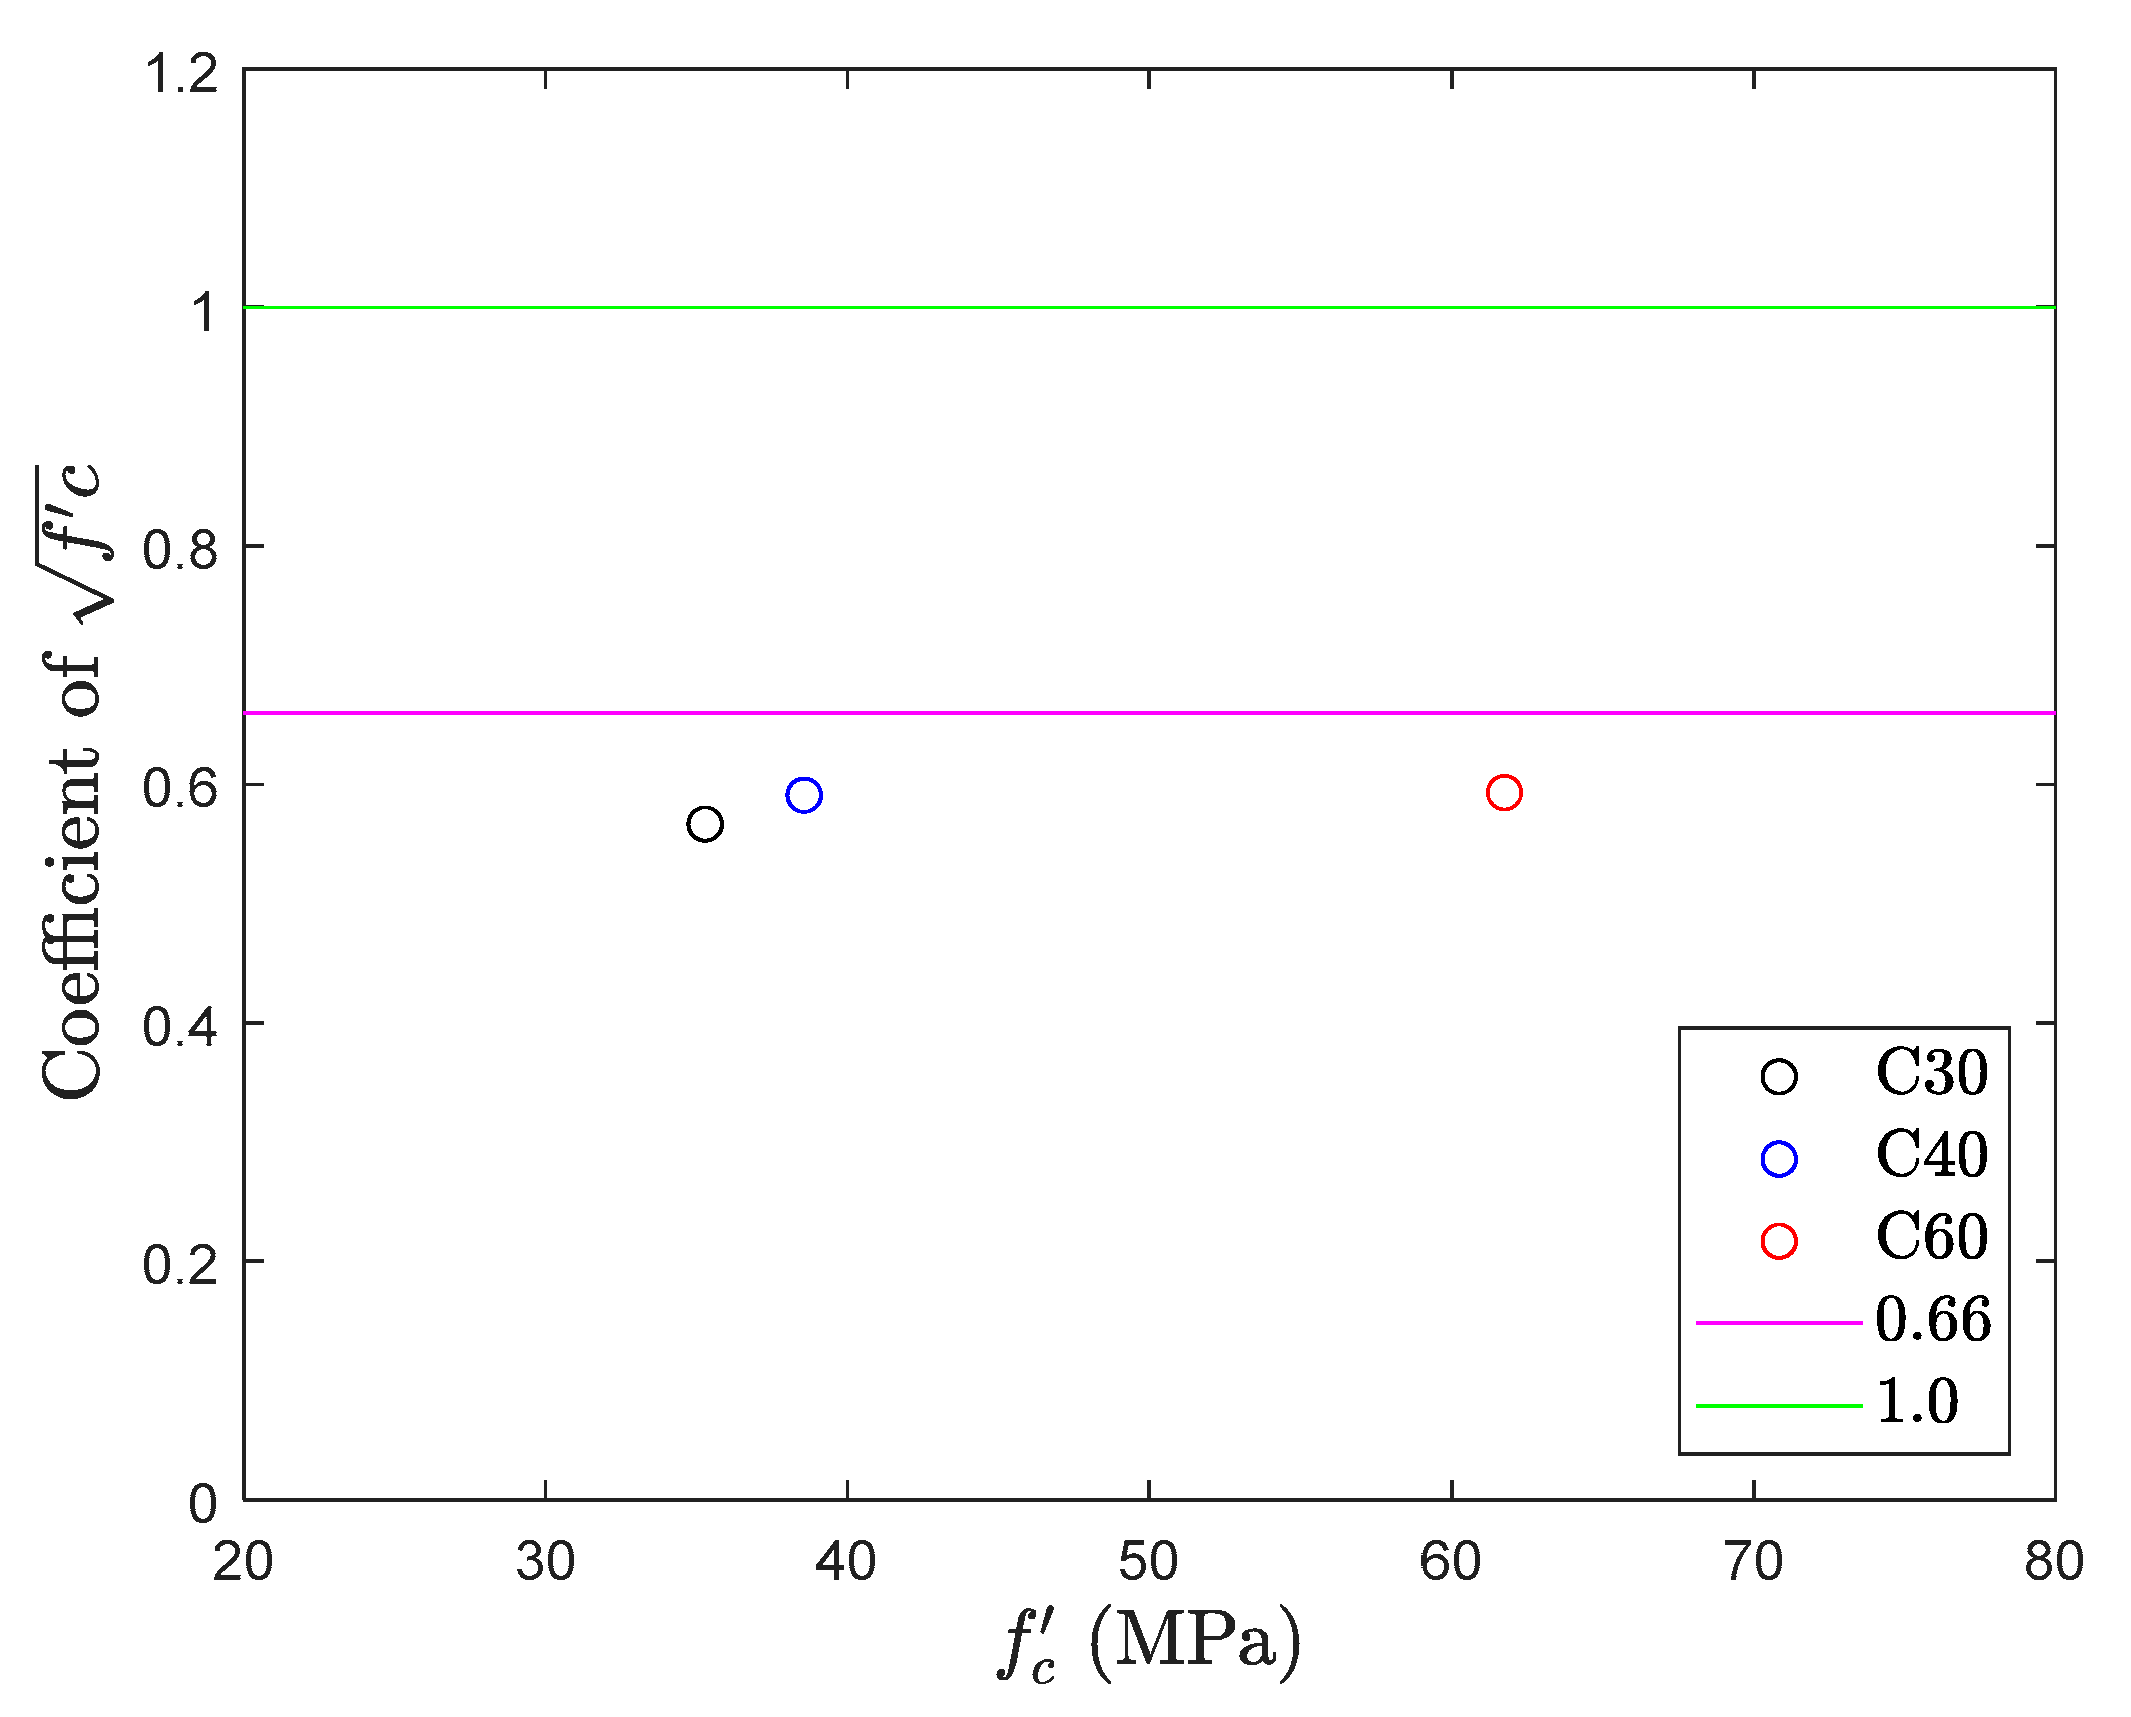
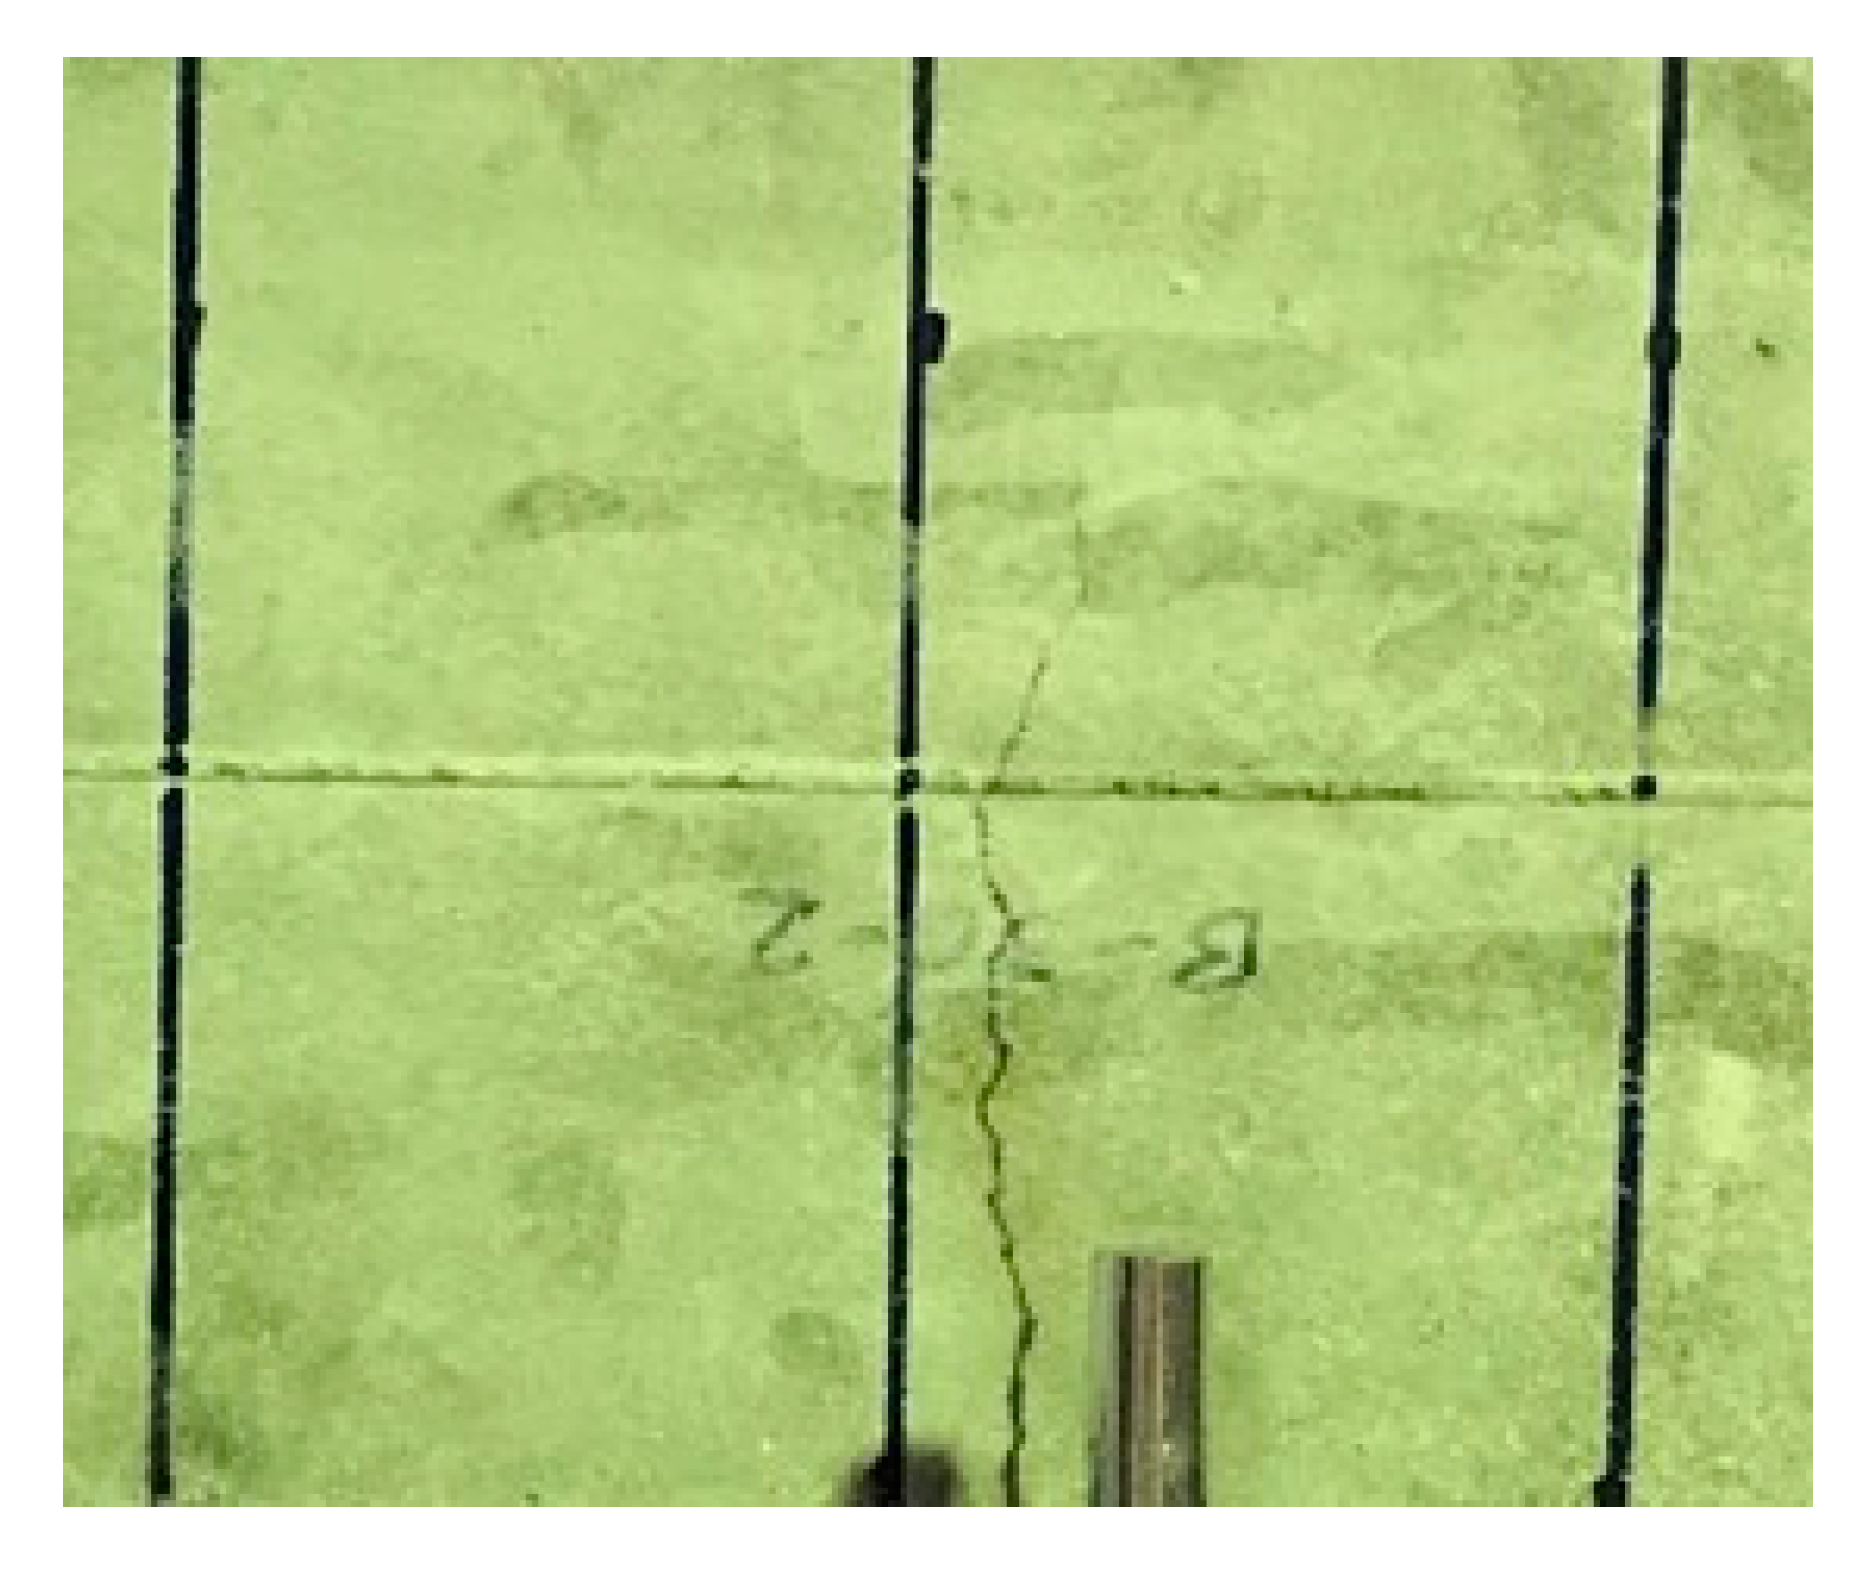
5.4. Flexural Test
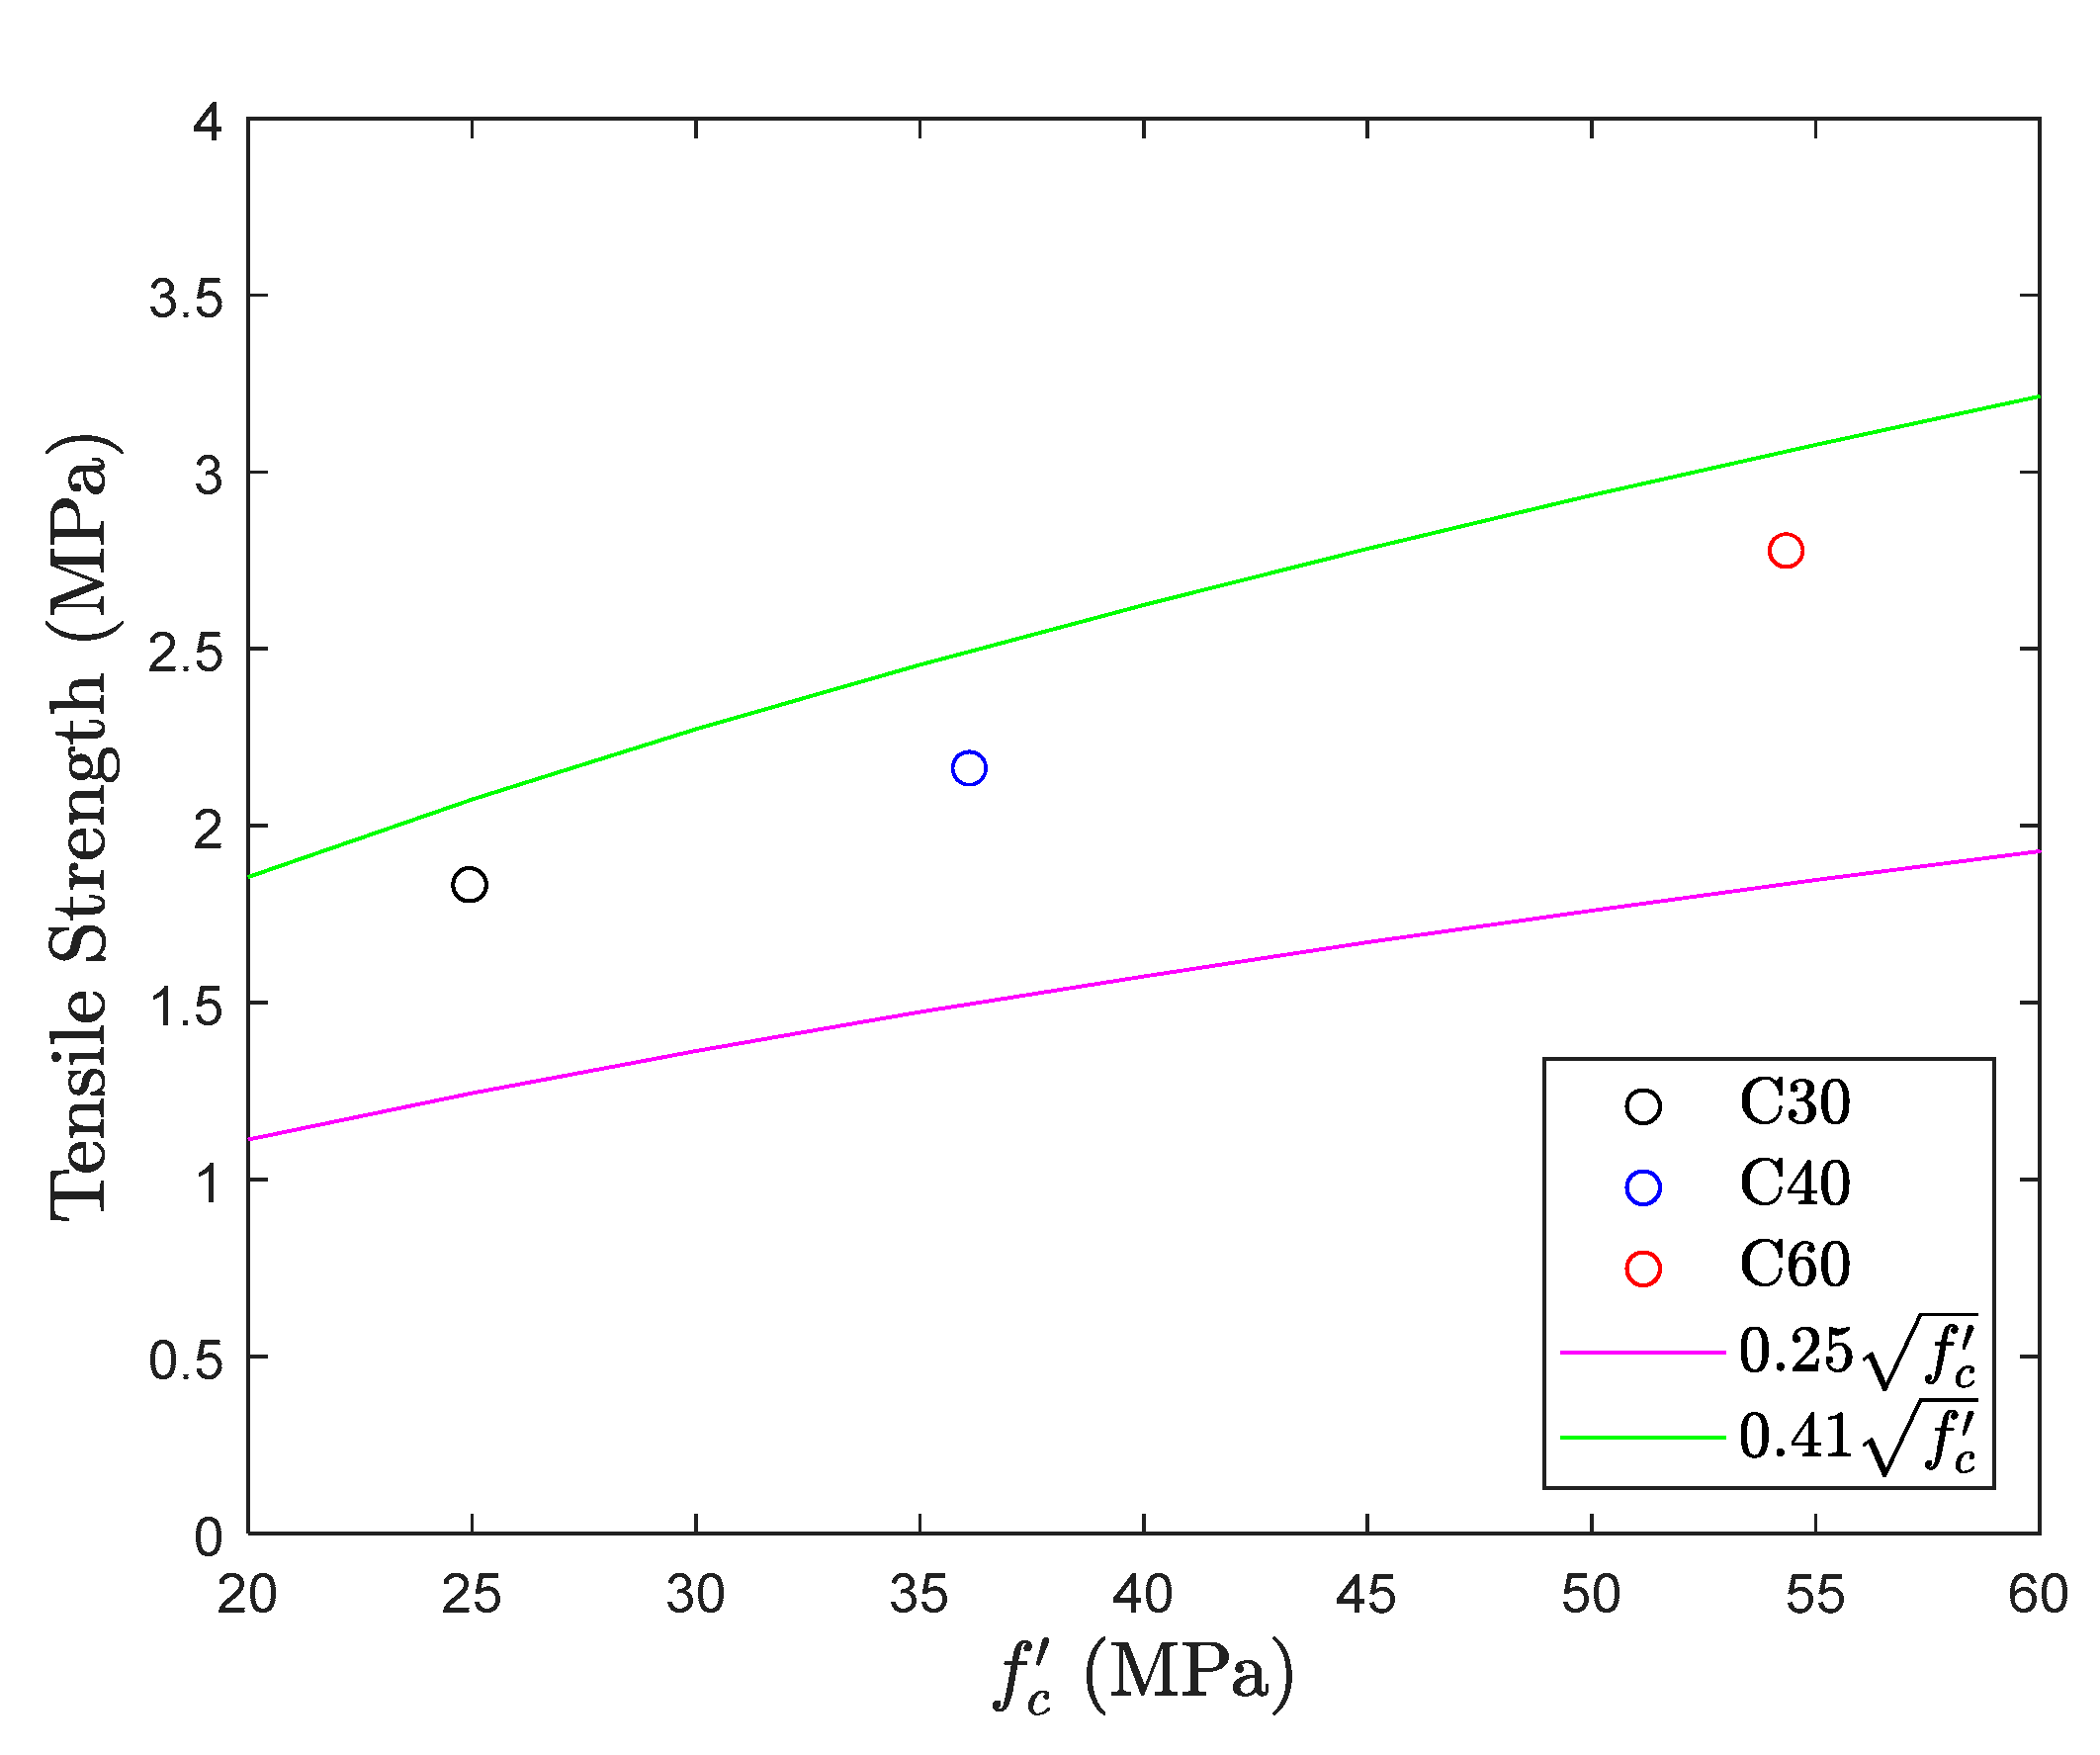
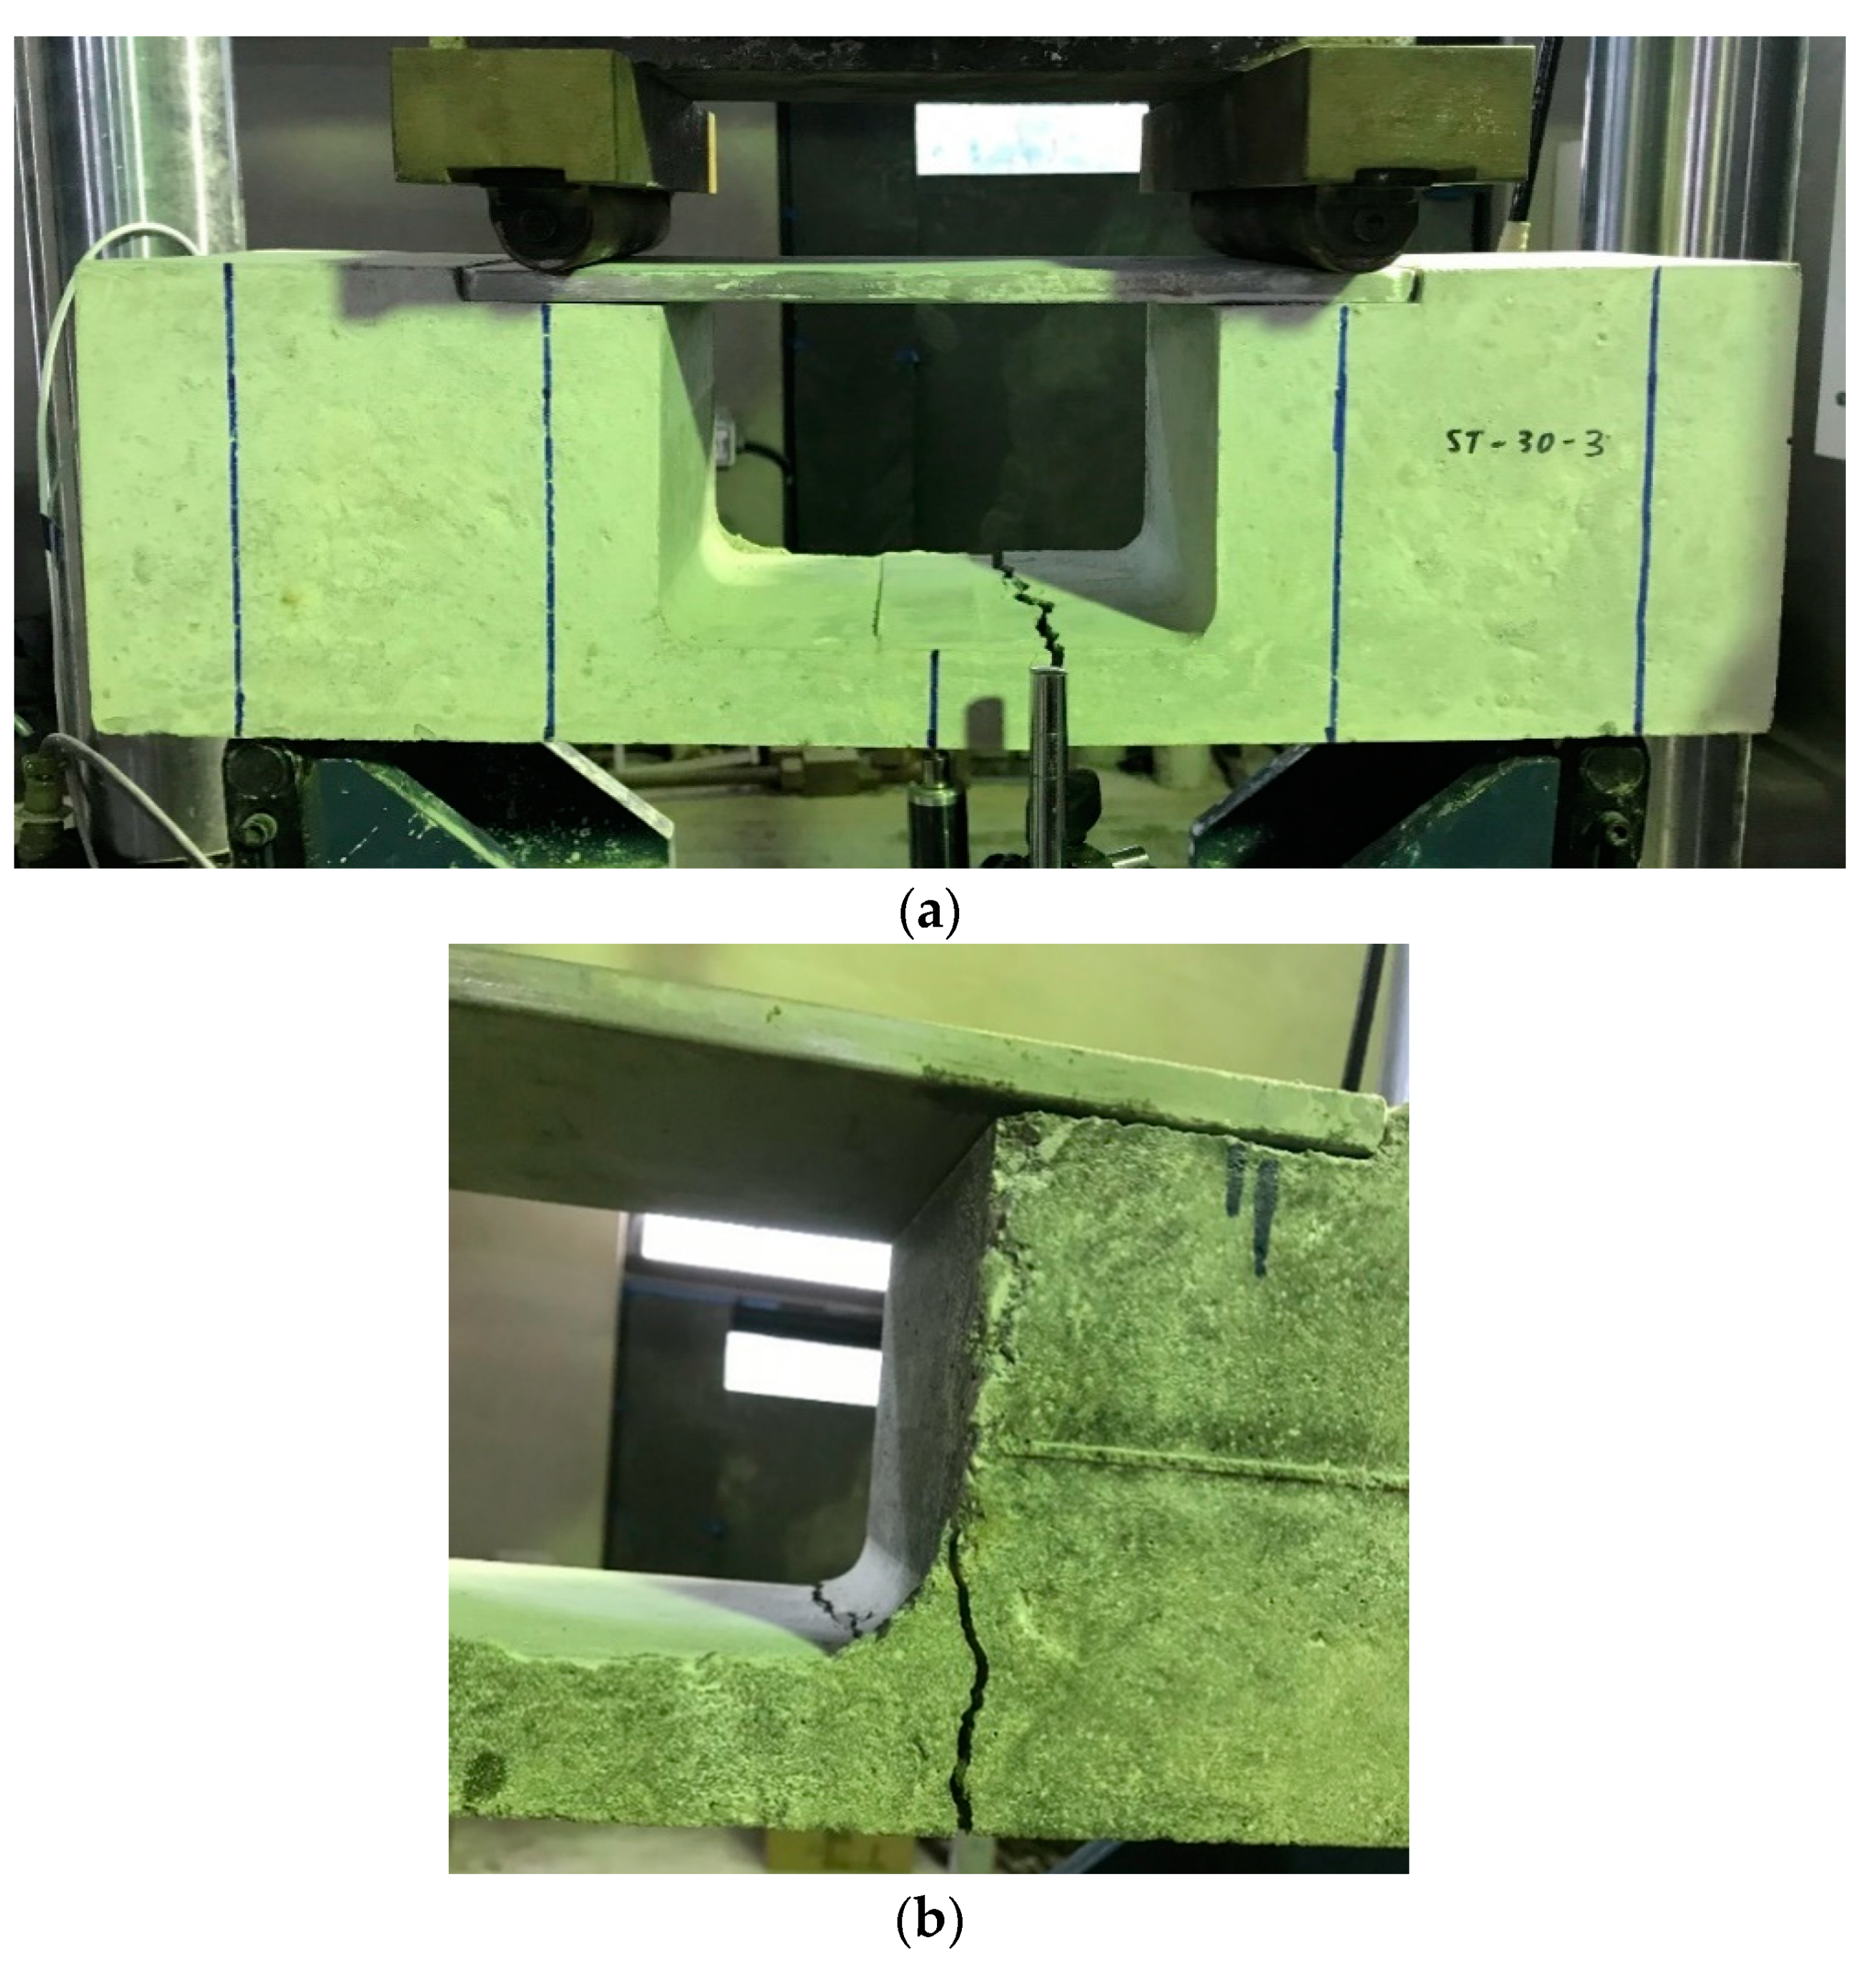
5.5. Strut-and-Tie Method
6. Analysis of Test Results
6.1. Comparison of ABAQUS Analysis and Test Result
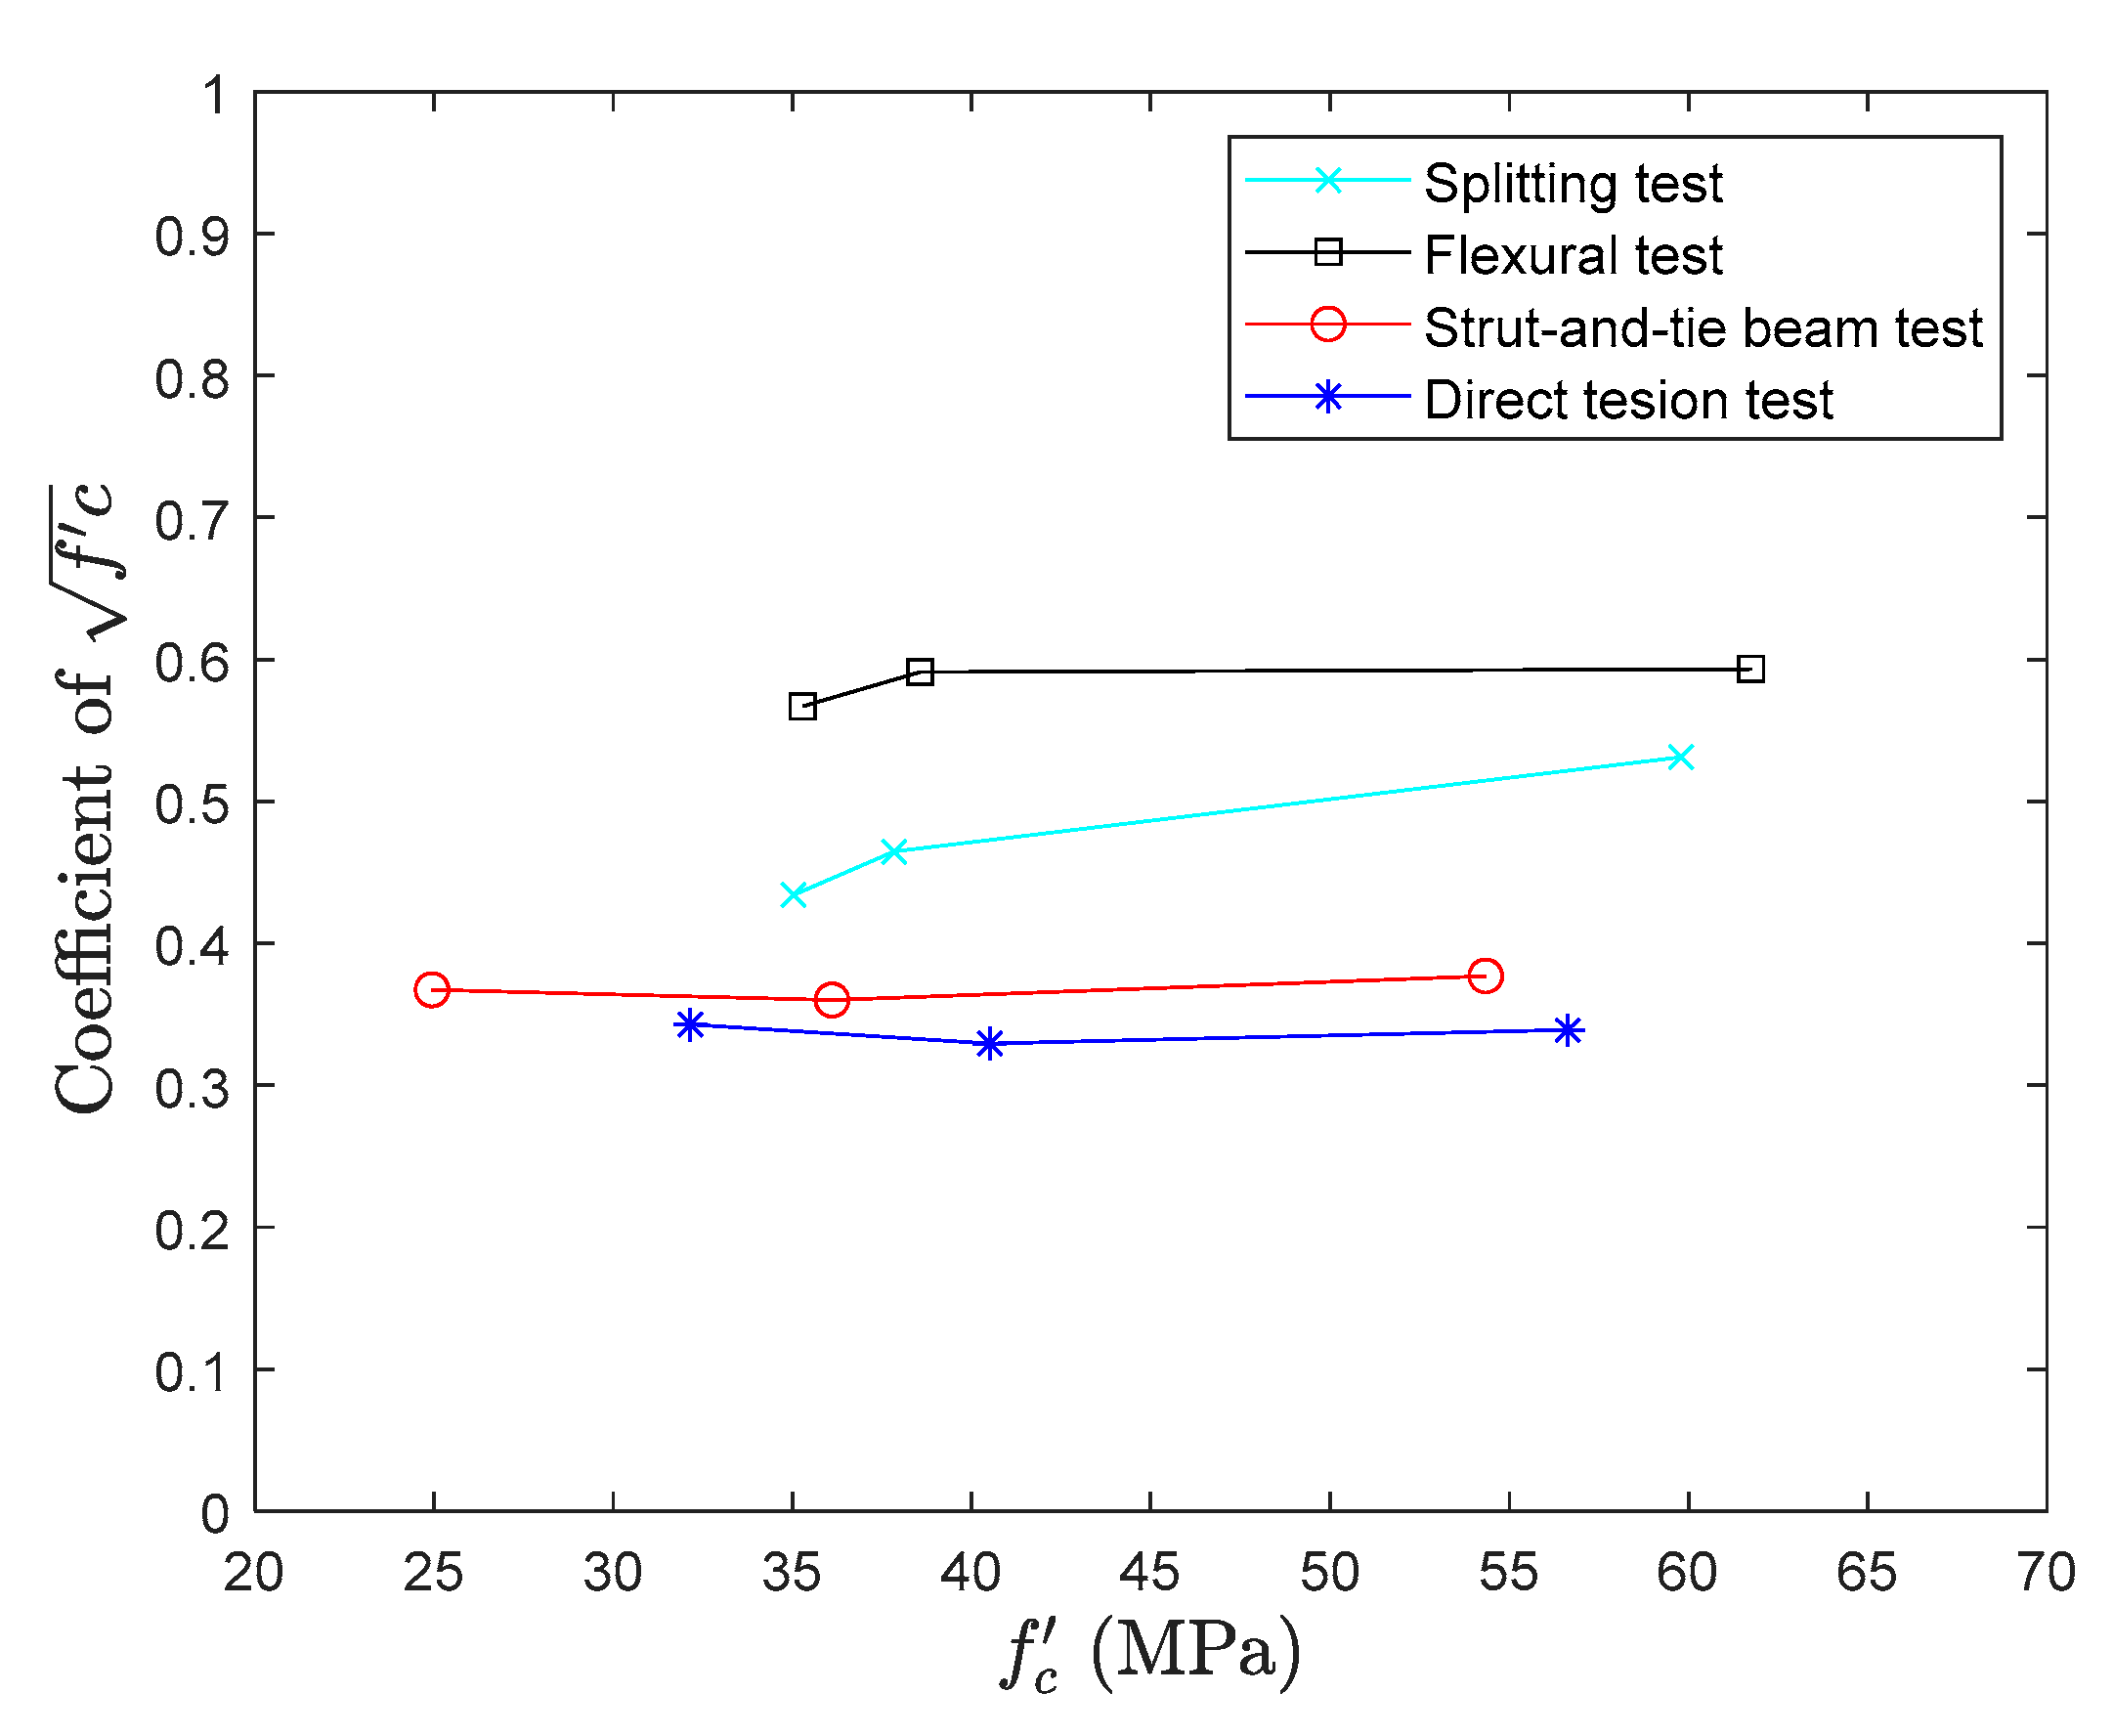
6.2. Comparison of Different Testing Methods
7. Conclusions
- Three different kinds of tensile tests for concrete were studied and a new method was proposed for evaluating the performance of concrete under tension. This new method is mainly adopting strut-and-tie methodology. The performance of the concrete in tension was evaluated by using all the four methods and the results were compared to determine the feasibility of each test. The results indicated that the newly proposed test produces good test results.
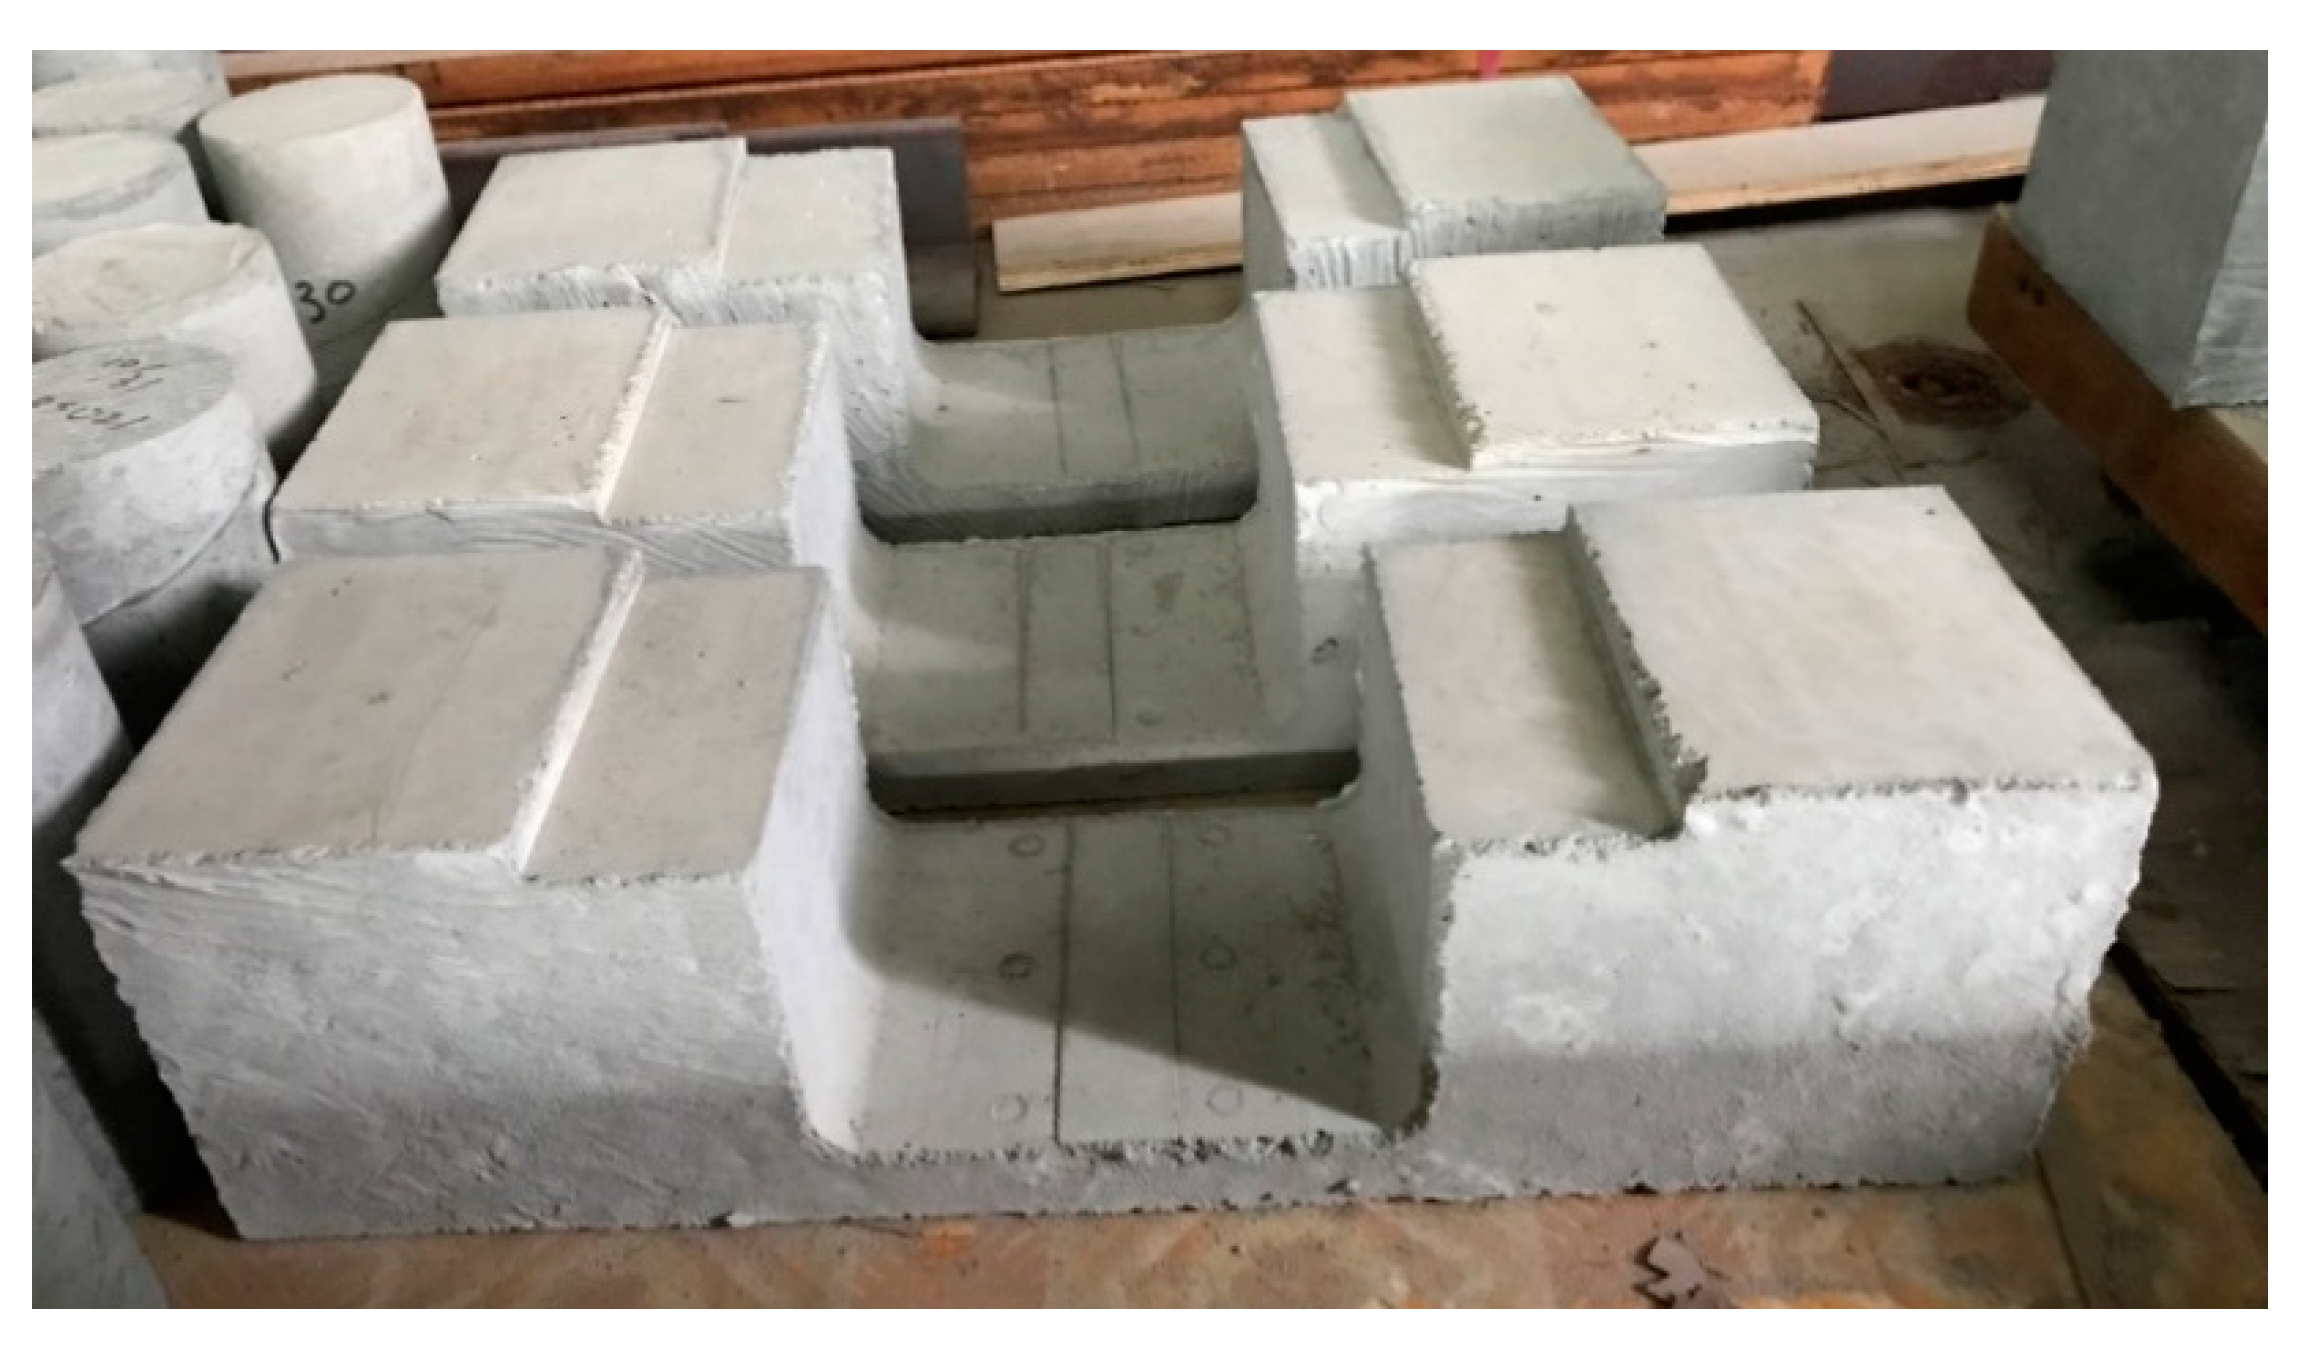
- Implementation of the strut-and-tie method is very simple and the results obtained from this method are nearly similar to the actual tensile strength of concrete. This method is advantageous in the following ways: the test does not need any special mold for casting the specimen, maintaining the test specimen is easy, loading equipment and testing setup is the same as in the flexural test.
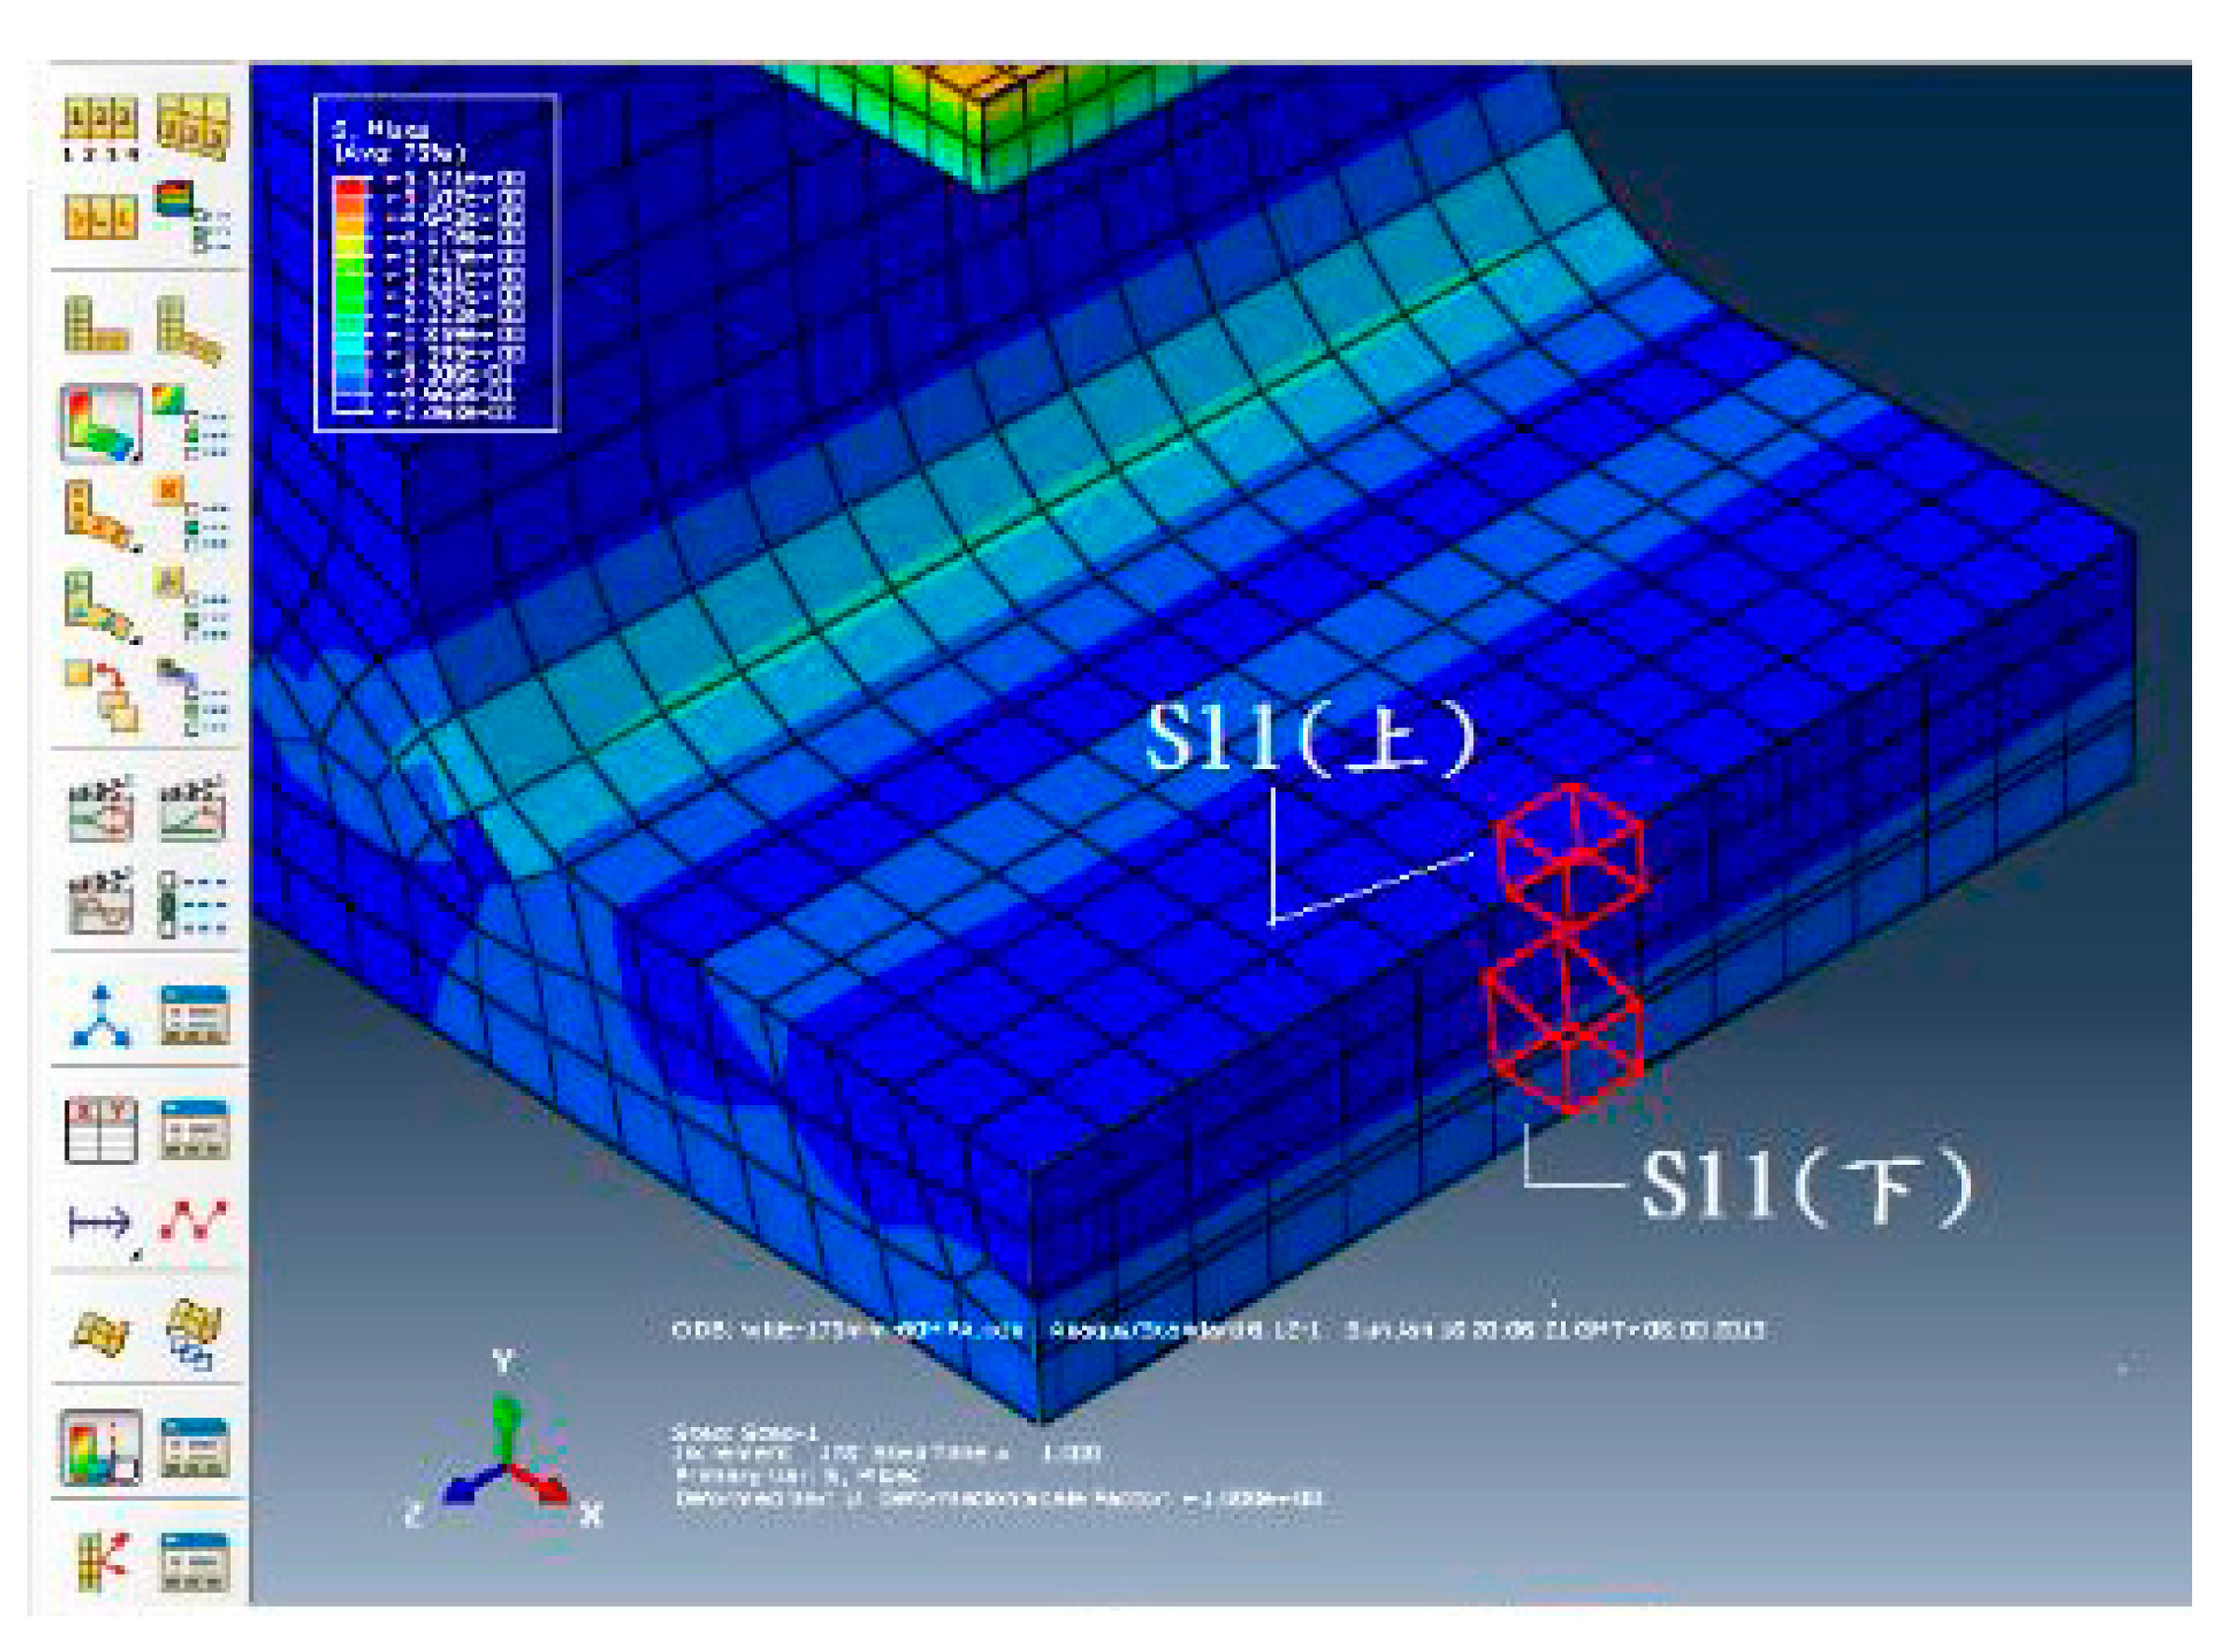
- The optimum width of the opening 175 mm in the strut-and-tie beam was assessed by using the software based on the Finite Element Method (ABAQUS). The thickness of the tie member, 30 mm, was decided based on the maximum size of aggregate used in the concrete. The width of the opening was adopted to ensure the fairly uniform distribution of the tensile stresses in concrete tie member on both upper and lower surfaces as in the direct tension test.
- Tensile test results obtained by using the other three methods have their shortcomings such as direct tension test is prone to eccentricity and secondary bending moment and gives variation in results. Also, split tensile test and flexural tests both are the indirect ways of measuring the tensile strength, and specimens are not purely subjected to tension and the test results obtained from these tests overestimates the concrete tensile strength.
- With 175 mm width of the opening, the results obtained by the strut and tie method are very close to the results obtained through a direct tension test with a minimum discrepancy of results. Experimental stability and reliability of the strut-and-tie method make it more coherent for evaluating the tensile strength of concrete.
Author Contributions
Funding
Conflicts of Interest
References
- Cantillo, V.; Guzmán, A. Fluid-pressured test to measure tensile strength of concrete. J. Mater. Civ. Eng. 2014, 26, 776–780. [Google Scholar] [CrossRef]
- Mehta, P.K.; Monteiro, P.J.M. Concrete: Microstructure, Properties, and Materials, 3rd ed.; McGraw-Hill: New York, NY, USA, 2006; pp. 67–80. [Google Scholar]
- Oluokun, F.A. Prediction of concrete tensile strength from its compressive strength: Evaluation of existing relations for normal weight concrete. ACI Mater. J. 1991, 88, 302–309. [Google Scholar]
- Resan, S.F.; Chassib, S.M.; Zemam, S.K.; Madhi, M.J. New approach of concrete tensile strength test. Case Stud. Constr. Mater. 2020, 12, e00347. [Google Scholar] [CrossRef]
- Elvery, R.H.; Haroun, W. A direct tensile test for concrete under long- or short-term loading. Mag. Concr. Res. 1968, 20, 111–116. [Google Scholar] [CrossRef]
- Popovics, S. Relations between various strengths of concrete. In Proceedings of the 46th Annual Meeting of Portland Cement and Concrete, Washington, DC, USA, 1967. [Google Scholar]
- Nilson, A.H.; Darwin, D.; Dolan, C.W. Design of Concrete Structures, 14th ed.; McGraw-Hill: New York, NY, USA, 2010; pp. 46–48. [Google Scholar]
- Ravindra, K.D.; Jorge, B.; Rui, V.S.; Chao, Q.L. Use of recycled aggregates in road pavement applications. In Sustainable Construction Materials: Recycled Aggregates, 1st ed.; Woodhead Publishing: Cambridge, UK, 2019; pp. 451–494. [Google Scholar]
- Khan, M.I.; Mourad, S. New proposed direct tensile strength test for concrete. In Construction Materials and Structures, Proceedings of the First International Conference on Construction Materials and Structures, Johannesburg, South Africa, 24–26 November 2014, 1st ed.; Ekolu, S.O., Dundu, M., Gao, X., Eds.; IOS Press: Amsterdam, The Netherlands, 2014; pp. 436–444. [Google Scholar]
- Kim, J.J.; Taha, M.R. Experimental and numerical evaluation of direct tension test for cylindrical concrete specimens. Adv. Civ. Eng. 2014, 2014, 8. [Google Scholar] [CrossRef]
- ANSYS. ANSYS User’s Manual; Release 16; ANSYS: Canonsburg, PA, USA, 2015. [Google Scholar]
- ABAQUS. Analysis User’s Manual 6.10EF; Dassault Systems Simulia Corp.: Providence, RI, USA, 2010. [Google Scholar]
- van Mier, J.G.M.; van Vliet, M.R.A. Uniaxial tension test for the determination of fracture parameters of concrete: State of the art. Eng. Fract. Mech. 2002, 69, 235–247. [Google Scholar] [CrossRef]
- Cattaneo, S.; Rosati, G. Effect of different boundary conditions in direct tensile tests: Experimental results. Mag. Concr. Res. 1999, 51, 365–374. [Google Scholar] [CrossRef]
- Nguyen, D.H.; Dao, V.T.N.; Lura, P. Tensile properties of concrete at very early ages. Constr. Build. Mater. 2017, 134, 563–573. [Google Scholar] [CrossRef]
- Carpinteri, A.; Maradei, F. Three-jack solution to obtain a truly stable and symmetric tensile concrete test. Exp. Mech. 1995, 35, 19–23. [Google Scholar] [CrossRef]
- Alhussainy, F.; Hasan, H.A.; Sheikh, M.N.; Hadi, M.N.S. A new method for direct tension testing of concrete. J. Test. Eval. 2019, 47, 708–718. [Google Scholar] [CrossRef]
- Ueda, M.; Hasebe, N.; Sato, M.; Okuda, H. Fracture mechanism of plain concrete under uniaxial tension. Exp. Mech. 1994, 24, 31–45. [Google Scholar]
- Katsaragakis, E.S. A new tensile test for concrete. Mater. Struct. 1987, 20, 463–466. [Google Scholar] [CrossRef]
- Ward, M.A. The Testing of Concrete Materials by Precisely Controlled Uni-Axial Tension. Ph.D. Thesis, Imperial College of Science and Technology, London, UK, March 1964. [Google Scholar]
- Zheng, W.; Kwan, A.K.H.; Lee, P.K.K. Direct tension test of concrete. ACI Mater. J. 2001, 98, 63–71. [Google Scholar]
- ASTM. Standard Test Method for Splitting Tensile Strength of Cylindrical Concrete Specimens; ASTM C496/C496M; ASTM: West Conshohocken, PA, USA, 2017. [Google Scholar]
- Lin, Z.; Wood, L. Concrete uniaxial tensile strength and cylinder splitting test. J. Struct. Eng. 2003, 129, 692–698. [Google Scholar] [CrossRef]
- Hannant, D.J.; Buckley, K.J.; Croft, J. The effect of aggregate size on the use of the cylinder slitting test as a measure of tensile strength. Mater. Struct. 1973, 6, 15–21. [Google Scholar]
- Tsiskreki, G.D.; Dzhavakhidze, A.N. The effect of aggregate size on strength and deformation of concrete. Hydrotech. Constr. 1970, 4, 448–453. [Google Scholar] [CrossRef]
- Wight, J.K.; MacGregor, J.G. Reinforced Concrete Mechanics and Design, 6th ed.; Pearson: Hoboken, NJ, USA, 2012; pp. 59–63. [Google Scholar]
- Tasdemir, M.A.; Lydon, F.D.; Barr, B.I.G. The tensile strain capacity of concrete. Mag. Concr. Res. 1996, 48, 211–218. [Google Scholar] [CrossRef]
- Dan, D.Q.; Konietzky, H.; Herbst, M. Brazilian tensile strength tests on some anisotropic rocks. Int. J. Rock Mech. Min. Sci. 2013, 58, 1–7. [Google Scholar] [CrossRef]
- Ma, T.; Peng, N.; Zhu, Z.; Zhang, Q.; Yang, C.; Zhao, J. Brazilian Tensile Strength of Anisotropic Rocks: Review and New Insights. Energies 2018, 11, 304. [Google Scholar] [CrossRef]
- ASTM. Standard Test Method for Flexural Strength of Concrete (Using Simple Beam with Third-Point Loading); ASTM C78; ASTM: West Conshohocken, PA, USA, 2018. [Google Scholar]
- Welch, G.B. Tensile strains in unreinforced concrete beams. Mag. Concr. Res. 1966, 18, 9–18. [Google Scholar] [CrossRef]


| Testing Methods | Range of Tensile Strength (MPa) |
|---|---|
| Direct tension test | |
| Splitting tensile test | |
| Flexural test |
| Width of Opening (mm) | Design Compressive Strength of Concrete (MPa) | Analysis Result | ||||
|---|---|---|---|---|---|---|
| 20 | 40 | 60 | 80 | 100 | ||
| The difference in Tensile Stress (MPa) | ||||||
| 150 | 0.13505 | 0.13516 | 0.10999 | 0.10200 | 0.14929 | |
| 175 | 0.00758 | 0.05074 | 0.06396 | 0.03996 | 0.07586 | Best |
| 200 | 0.10306 | 0.20540 | 0.25261 | 0.28307 | 0.40291 | |
| ID | Compressive Strength Target Value (MPa) | Cement | Sand | Coarse Aggregate | Water | SP |
|---|---|---|---|---|---|---|
| C30 | 30 | 450 | 1000 | 700 | 293 | 2.25 |
| C40 | 40 | 450 | 1000 | 700 | 225 | 5.85 |
| C60 | 60 | 450 | 1000 | 700 | 149 | 9.9 |
| Name of the Test | Formula | Description |
|---|---|---|
| Direct Tension Test | where is the direct tension strength, is the maximum load, is the width and is the thickness of the critical cross section of the specimen. | |
| Splitting Test | where is the splitting tensile strength, is the length and is the diameter of the cylinder specimen. | |
| Flexural Test | where is the modulus of rupture, is the span length of the specimen, is the width and is the depth of the specimen, equals to . |
| Proportion ID | Concrete Compressive Strength (MPa) | |
|---|---|---|
| Direct tension test | C30 | 32.15 |
| C40 | 40.51 | |
| C60 | 56.63 | |
| Splitting test | C30 | 35.03 |
| C40 | 37.84 | |
| C60 | 59.80 | |
| Flexural test | C30 | 35.28 |
| C40 | 38.56 | |
| C60 | 61.76 | |
| Strut-and-tie method | C30 | 24.94 |
| C40 | 36.10 | |
| C60 | 54.34 |
| Testing Methods | ID | Test Tensile Strength (MPa) | Average Coefficient | |
|---|---|---|---|---|
| Direct tension test | C30 | 1.94 | 0.34 | 0.34 |
| C40 | 2.10 | 0.33 | ||
| C60 | 2.55 | 0.34 | ||
| Splitting test | C30 | 2.57 | 0.43 | 0.48 |
| C40 | 2.86 | 0.46 | ||
| C60 | 4.11 | 0.53 | ||
| Flexural test | C30 | 3.37 | 0.57 | 0.58 |
| C40 | 3.67 | 0.59 | ||
| C60 | 4.66 | 0.59 | ||
| Strut-and-tie method | C30 | 1.83 | 0.37 | 0.37 |
| C40 | 2.16 | 0.36 | ||
| C60 | 2.78 | 0.38 |
| Concrete Compressive Strength (MPa) | |||||
|---|---|---|---|---|---|
| 20 | 40 | 60 | 80 | 100 | |
| ABAQUS analysis result (MPa) | 2.05 | 2.84 | 3.51 | 4.06 | 4.55 |
| Testing Method | Concrete Compressive Strength (MPa) | ||
|---|---|---|---|
| 24.94 | 36.10 | 54.34 | |
| Testing Stress (MPa) | |||
| ABAQUS analysis | 2.24 | 2.69 | 3.32 |
| Experiment result | 1.83 | 2.16 | 2.78 |
| Lower bound | 1.25 | 1.50 | 1.84 |
| Upper bound | 2.05 | 2.46 | 3.02 |
© 2020 by the authors. Licensee MDPI, Basel, Switzerland. This article is an open access article distributed under the terms and conditions of the Creative Commons Attribution (CC BY) license (http://creativecommons.org/licenses/by/4.0/).
Share and Cite
Liao, W.-C.; Chen, P.-S.; Hung, C.-W.; Wagh, S.K. An Innovative Test Method for Tensile Strength of Concrete by Applying the Strut-and-Tie Methodology. Materials 2020, 13, 2776. https://doi.org/10.3390/ma13122776
Liao W-C, Chen P-S, Hung C-W, Wagh SK. An Innovative Test Method for Tensile Strength of Concrete by Applying the Strut-and-Tie Methodology. Materials. 2020; 13(12):2776. https://doi.org/10.3390/ma13122776
Chicago/Turabian StyleLiao, Wen-Cheng, Po-Shao Chen, Chung-Wen Hung, and Suyash Kishor Wagh. 2020. "An Innovative Test Method for Tensile Strength of Concrete by Applying the Strut-and-Tie Methodology" Materials 13, no. 12: 2776. https://doi.org/10.3390/ma13122776
APA StyleLiao, W.-C., Chen, P.-S., Hung, C.-W., & Wagh, S. K. (2020). An Innovative Test Method for Tensile Strength of Concrete by Applying the Strut-and-Tie Methodology. Materials, 13(12), 2776. https://doi.org/10.3390/ma13122776