Article

Performance Evaluation and Optimization of Dyes Removal using Rice Bran-Based Magnetic Composite Adsorbent

1
Department of Cosmetic Application and Management, St. Mary’s Junior College of Medicine, Nursing and Management, No. 100, Lane 265, San-Shing Rd., Sec. 2, San-Shing Shiang, YiLan 266, Taiwan
2
Department of Chemical Engineering and Biotechnology, National Taipei University of Technology, No. 1, Sec. 3, Zhongxiao E. Rd., Taipei 10608, Taiwan
*
Author to whom correspondence should be addressed.
Materials 2020, 13(12), 2764; https://doi.org/10.3390/ma13122764
Submission received: 26 May 2020 / Revised: 12 June 2020 / Accepted: 16 June 2020 / Published: 18 June 2020
(This article belongs to the Section Advanced Composites)

Abstract

:
Although several studies have explored green adsorbent synthesized from many types of agriculture waste, this study represents the first attempt to prepare an environmentally friendly rice bran/SnO2/Fe3O4-based absorbent with economic viability and material reusability, for the promotion of sustainable development. Here, rice bran/SnO2/Fe3O4 composites were successfully synthesized and applied for adsorption of reactive blue 4 (RB4) and crystal violet (CV) dyes in aqueous solutions. The adsorption data were well-fitted by the Langmuir isotherm model and the pseudo-second-order kinetic model. The maximum adsorption capacities of the RB4 and CV dyes as indicated by the Langmuir isotherm model were 218.82 and 159.24 mg/g, respectively. As results of response surface methodology (RSM) showed, the quadratic model was appropriate to predict the performance of RB4 dye removal. The findings exhibited that an optimum removal rate of 98% was achieved at 60 °C for pH 2.93 and adsorption time of 360 min. Comparative evaluation of different agricultural wastes indicated that the rice bran/SnO2/Fe3O4 composite appeared to be a highly promising material in terms of regeneration and reusability, and showed that the composite is a potential adsorbent for dye removal from aqueous solutions. Overall, the study results clearly suggest that an adsorbent synthesized from rice bran/SnO2/Fe3O4 magnetic particle composites provides encouraging adsorption capacity for practical applications for environmental prevention.

1. Introduction

Various environmental protection problems (e.g., water pollution) have resulted from the rapid development of industrialization and the significant increase in the human population. Dyes are widely used in many industries and can be harmful to aquatic life, the food web, and humans [1,2]. In fact, the presence of dyes in wastewater may reduce sunlight penetration, exhaust dissolved oxygen, prevent photosynthesis, and accumulate mutagenic and carcinogenic intermediates via chemical or biological reactions [3,4]. The effective removal of dyes from wastewater is one of the major environmental challenges in water management [5]. To date, various methods of wastewater treatment (e.g., biological treatments, chemical oxidation, coagulation/flocculation, ion exchange, membrane filtration, ozone treatment, and photocatalysis) have been used to remove dyes from aqueous solutions [6]. Among these treatment methods, the adsorption method is the most widely used because of its simple operational procedures, system flexibility, economic feasibility, and low energy consumption to produce high-quality treated effluent without secondary pollution [7,8]. To explore low-cost and environmentally friendly adsorbents, various agro-industrial wastes (e.g., walnut shells, mango stones, peanut husks, coir pith, sawdust, bamboo, wheat straw, rice bran, coal bottom ash, blast furnace slag, and orange peel) have been used as a result of their source abundance, recyclability, and economic viability [9,10,11,12,13,14,15]. However, most of the adsorbents synthesized from agriculture wastes have some limitation, such as lower regenerative capacity and adsorption capacity.
The unique characteristics of nanoparticles (NPs) (e.g., high dispersibility and a high surface-to-volume ratio) can provide significant adsorption capacity and are of considerable interest to the scientific community [16,17]. Recently, metal oxide nanocomposites (e.g., MnO2/MCM-41, Fe2O3/SiO2, CuS/ZnS) have been treated as efficient adsorbents for the removal of pollutants from aqueous solutions and have also exhibited the characteristics of good regeneration ability [12,17,18]. Moreover, as several studies revealed, magnetic nanoparticles (e.g., graphene-Fe3O4, NiFe2O4, and Fe3O4/C) are well-performing adsorbents which can be recovered quickly by an external magnetic field after application [19,20,21]. Although composite nanomaterials for dye removal have been reported, few studies have been undertaken on the various adsorption applications of environment-friendly nanocomposite adsorbent produced from agriculture byproducts or wastes. However, clear strategies for alternatives using the most promising composite materials for dye or pollutant removal remain to be uncovered.
Recently, response surface methodology (RSM) has been popularly applied to increase the efficiency of contaminant removal in environmental remediation [22,23]. RSM can quantitatively evaluate interactive effects of multiple variables and effectively reduce the number of experimental variables. RSM has been applied to various wastewater treatments, such as the Fenton process, electrocoagulation, photocatalysis, membranes, and adsorption operations for optimization [24,25,26,27,28]. In addition, regarding recycled agricultural materials, rice bran, also known as miller’s bran, is a common agricultural byproduct in Taiwan and can be obtained during the milling of rice. The major components of rice bran are vitamins, dietary fiber, essential fatty acids, minerals, and other sterols [29]. The functional groups in the rice bran (e.g., carboxyl and hydroxyl substituents) can considerably enhance the efficiency of dye for adsorption, making rice bran a potential adsorbent for removing dyes from aqueous solutions [12].
The purpose of this study was to synthesize a low-cost, reusable, and environmentally friendly adsorbent with highly promising capabilities of dye adsorption. Moreover, the RSM method was adopted to optimize removal efficiency and analyze the factor interactions for maximal performance. This study specifically synthesized a rice bran/SnO2/Fe3O4 composite absorbent for adsorption of reactive blue 4 (RB4) and crystal violet (CV) dyes in aqueous solutions. For system optimization, central composite design (CCD) was selected to globally optimize the three control factors of RB4 dye performance. To determine statistical significance, analysis of variance (ANOVA) was used to evaluate the data validation of the RSM model. To reveal detailed characterization, the rice bran-based composite adsorbents were characterized via scanning electron microscopy (SEM), energy-dispersive X-ray (EDX), Fourier transform infrared (FTIR) spectroscopy, and Brunauer–Emmett–Teller (BET) specific surface area analysis techniques. Moreover, the adsorption behavior of the dyes was analyzed using reaction kinetics and isotherm models. For sustainable uses, the regeneration performance of the composite adsorbent was also investigated in this study. To the best of our knowledge, this work is the first attempt to prepare an environmentally friendly rice bran/SnO2/Fe3O4 adsorbent.

2. Materials and Methods

2.1. Materials

Methanol (purity ≥ 99.9%), ethanol (purity ≥ 99.8%), tin (II) chloride dehydrate, and sodium hydroxide (purity ≥ 97%) were purchased from Fisher Chemical (Pittsburgh, PA, USA). Sodium carbonate (purity ≥ 99%), ferric chloride (purity ≥ 99%), ferrous chloride (purity ≥ 99%) and crystal violet (CV) were obtained from Acros Organics (Geel, Belgium). Reactive blue 4 (RB4) was supplied by Sigma-Aldrich (Natick, MA, USA). All chemicals were analytical grade and used as received. Rice bran was harvested from a local Taichung grinding mill in Taiwan. After cleaning, the rice bran was dried for 6 h in an oven at 110 °C. The dried rice bran was ground in a mill and sieved (20 and 100 mesh) and fractions of 0.15–0.85 mm were selected for the adsorbent preparation.

2.2. Synthesis of Rice Bran/SnO2/Fe3O4 Composite

As indicated in previous research [12], rice bran has been successful modified to be an appropriate adsorbent. The present study modified this adsorbent to a rice bran/SnO2/Fe3O4 composite to significantly augment adsorption efficiency. The modified method of preparing composite materials is shown in Figure 1. After mixing 15 mL of the precursor (0.1 M SnCl2·2H2O) and 35 mL of methanol, 2 g of the rice bran was added to the mixed solution. Subsequently, the mixed solution was then kept in a water bath at 45 °C for 40 min. Then, the pH of the solution was adjusted to 6.7 and the solution was kept in an isothermal water bath for 15 min. The obtained product was filtered and washed several times with deionized water, and then dried in an oven at 50 °C for 6 h. The dried precipitate was ground and then sieved (100 mesh) to obtain the rice bran/SnO2 composite. Then, the magnetite rice bran/SnO2 composite (rice bran/SnO2/Fe3O4) was synthesized by the chemical co-precipitation method [30]. Briefly, rice bran/SnO2 (2 g), ferric chloride (2.7 g), and ferrous chloride (1.2 g) were dissolved in deionized water (100 mL). Sodium carbonate (2.5 M) was slowly added to the mixture to adjust the pH level to 6.0. Then, the mixture was placed in a shaker at 85 °C for 1 h at a constant speed of 100 rpm. After serial procedures of filtering, washing, and drying (50 °C for 6 h), the rice bran/SnO2/Fe3O4 composite was obtained.

2.3. Composite Adsorbent Characterizations

Surface morphology of adsorbents was observed by a scanning electron microscope (S-3000H, Hitachi Science & Technology, Tokyo, Japan). The element identification and distribution of rice bran/SnO2/Fe3O4 composite was analyzed by EDX (Emaxx-act, Horiba, Kyoto, Japan). The surface functional groups on adsorbents were investigated using FTIR Spectroscopy (FT/IR-6600 Series, Jasco, Tokyo, Japan) coupled with single reflection ATR (ATR Pro One) within the wavelength range of 4000–400 cm−1. Brunauer–Emmett–Teller (BET, Micromeritics, Norcross, GA, USA) measurements were made using a Micromeritics’ Gemini™ V Series 2380 analyzer. The specific surface area and pore area distribution of the adsorbent were specifically analyzed. The zero-point charge (pHzpc) of rice bran/SnO2/Fe3O4 composite adsorbent was determined using the salt addition method.

2.4. Batch Adsorption Experiments

The batch dye adsorption experiments were carried out in Erlenmeyer flasks in a temperature-controlled water bath shaker at 100 rpm. The effects of control variables, such as the pH (2–10) of the dye solution, temperature (30–60 °C), adsorbent dose (0.5–3.5 g/L), and contact time (0–360 min) were studied. As indicated by the literature, for comparison the dye concentrations in water streams were approximately 10–200 mg/L [31]. Therefore, the adsorption experiment was executed at a fixed dye initial concentration of 200 mg/L. One control factor was varied to investigate the individual effect of each control factor on the adsorption performance of the adsorbent, while all other control factors were maintained constant. The contents of the CV and RB4 dyes adsorbed onto the adsorbent were determined using a UV/VIS spectrophotometer (Thermo Scientific, Waltham, MA, USA) at maximum wavelengths of 590 and 595 nm, respectively. All the experiments were carried out in triplicate to confirm data reproducibility of the results. The percentage dye removal was calculated according to the following equation and used in the ensuing adsorption experiments:
Dye   removal   % = C 0 C e C 0 × 100 %
Adsorption   capacity   q e = C 0 C e W × V
where C0 and Ce are the initial and equilibrium dye concentrations (mg/L), respectively; qe (mg/g) is the adsorption capacity at equilibrium; and V (L) and W (g) are the volume of the dye solution and the dosage of adsorbent used, respectively.

2.5. Experimental Optimization of Adsorption

To show the full impacts of adsorption, RSM can be used to maximize or minimize the output response and analyze the factor interactions [32]. The adsorption performance was optimized by CCD based on RSM. According to preliminary results of dye adsorption, contact times, temperature, and pH might each affect adsorption performance. Therefore, the variables of contact time, temperature, and pH were chosen for the experimental design of RSM in experimental optimization, acquiring the optimum adsorption conditions for the removal efficiency of RB4. In the optimization work, 20 experiments (8 level points, 6 axial points, and 6 replicates at the center points) were conducted by experimental design, as shown in Table 1. In this study, ANOVA was used to check and evaluate the validation of the RB4 removal quadratic model. To investigate the interactions between dependent variables, 3D surface plots and ANOVA results were also derived.

3. Results and Discussion

3.1. Characterization of Adsorbent

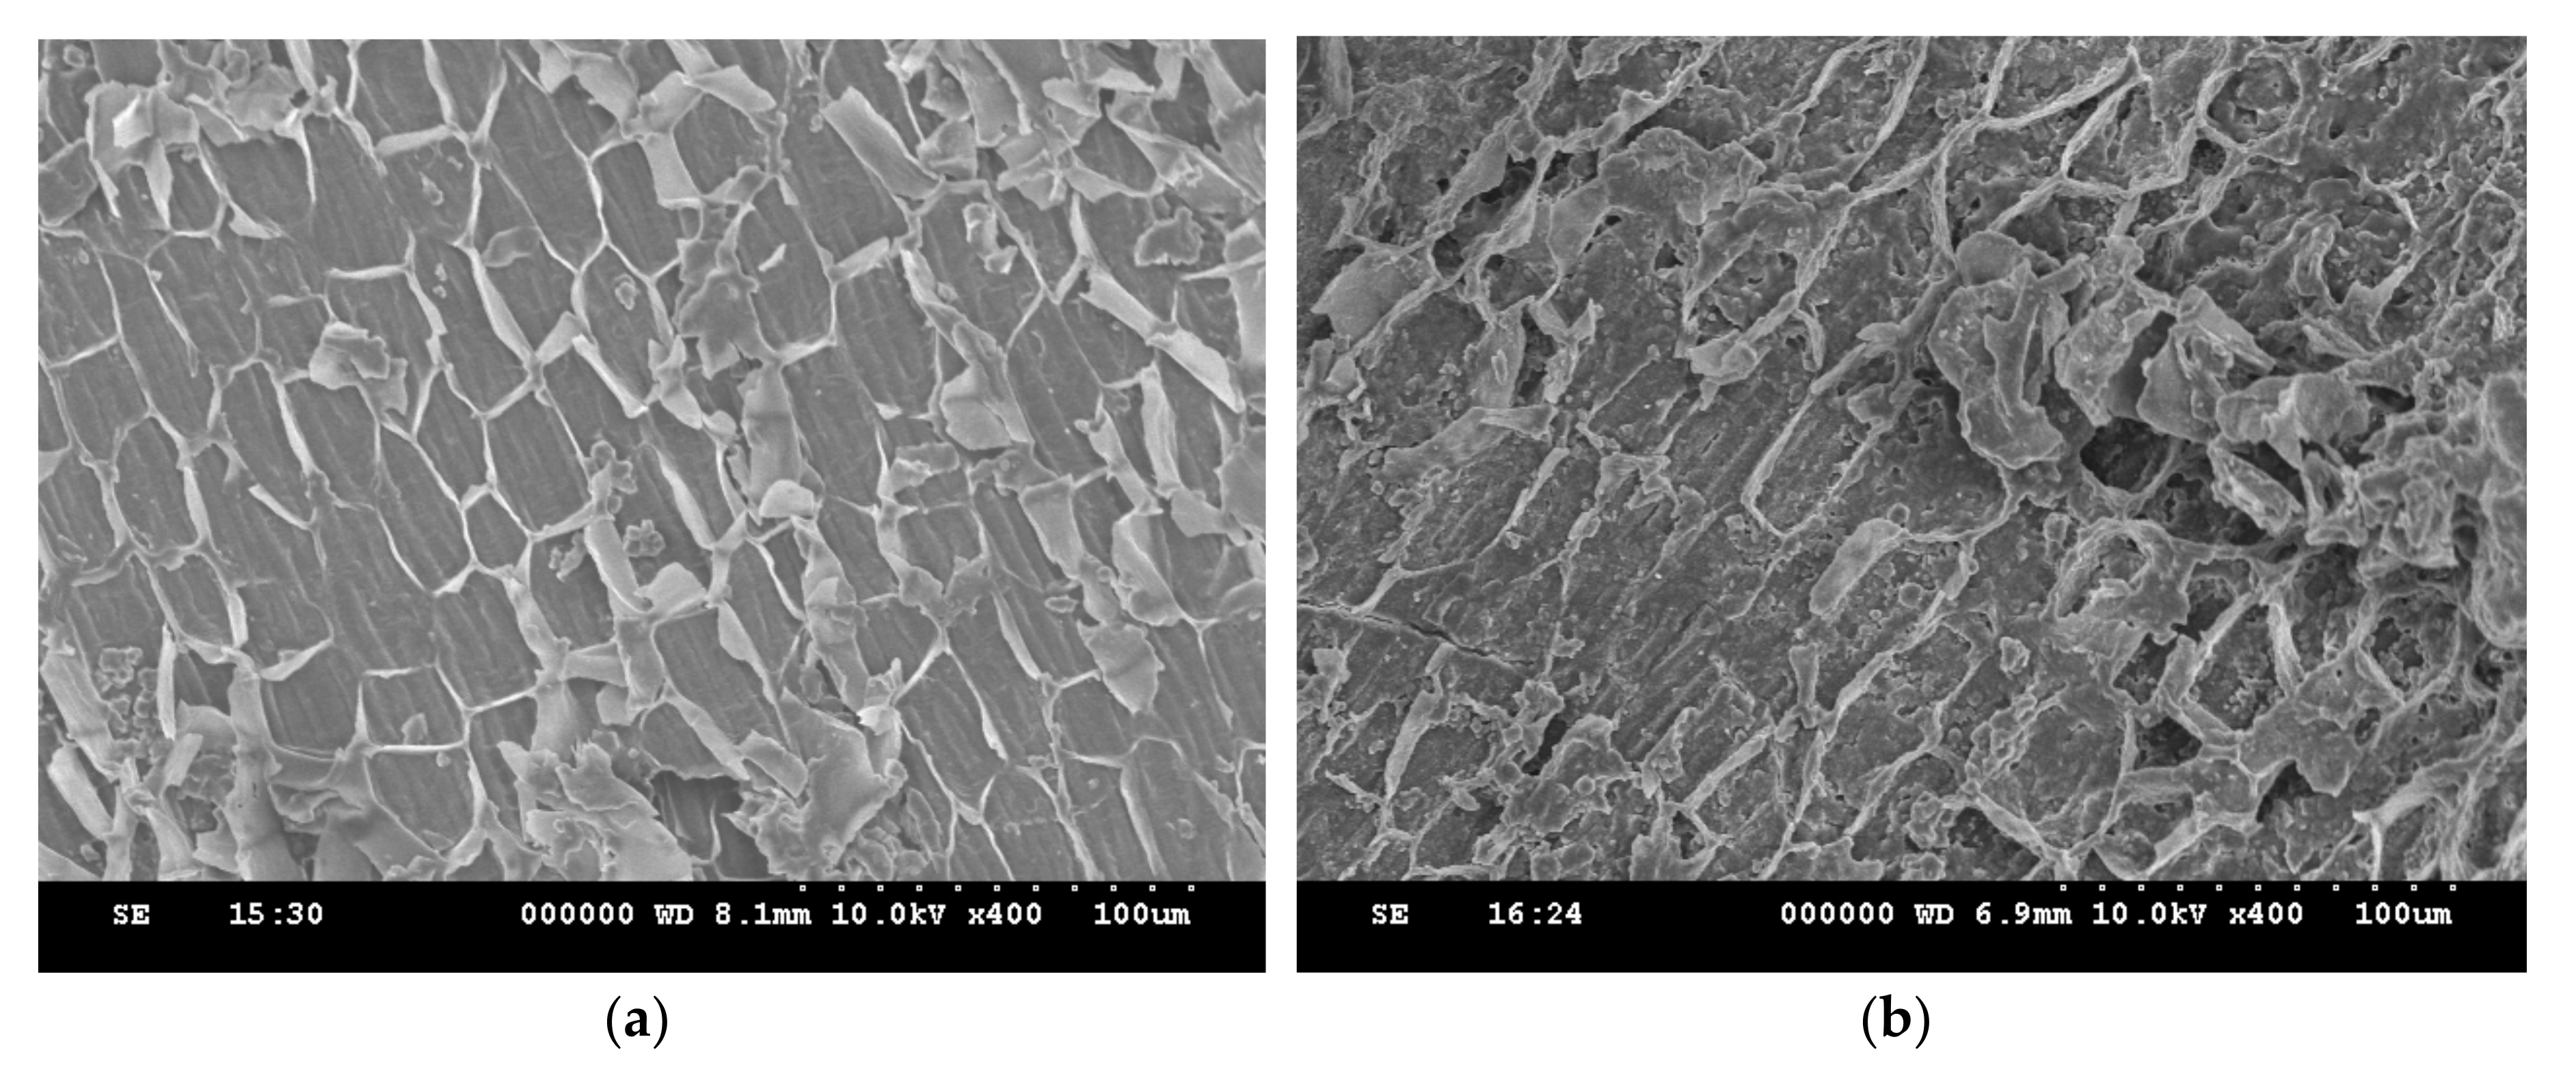
As shown in Figure 2, the micrograph of the rice bran (Figure 2a) exhibited a fiber cell structure of a hexagonal or pentagonal shape with a smooth surface and without pores. After SnO2 was loaded on the rice bran to obtain the rice bran/SnO2 composite, the surface was clearly damaged (Figure 2b). With the magnetizing process, the surface of the rice bran/SnO2/Fe3O4 (Figure 2c) composite was apparently more seriously damaged, allowing magnetic particles to be present. Moreover, EDX analysis of the rice bran/SnO2/Fe3O4 clearly confirmed the presence of atomic species of C, O, Fe, and Sn (Figure 2d).
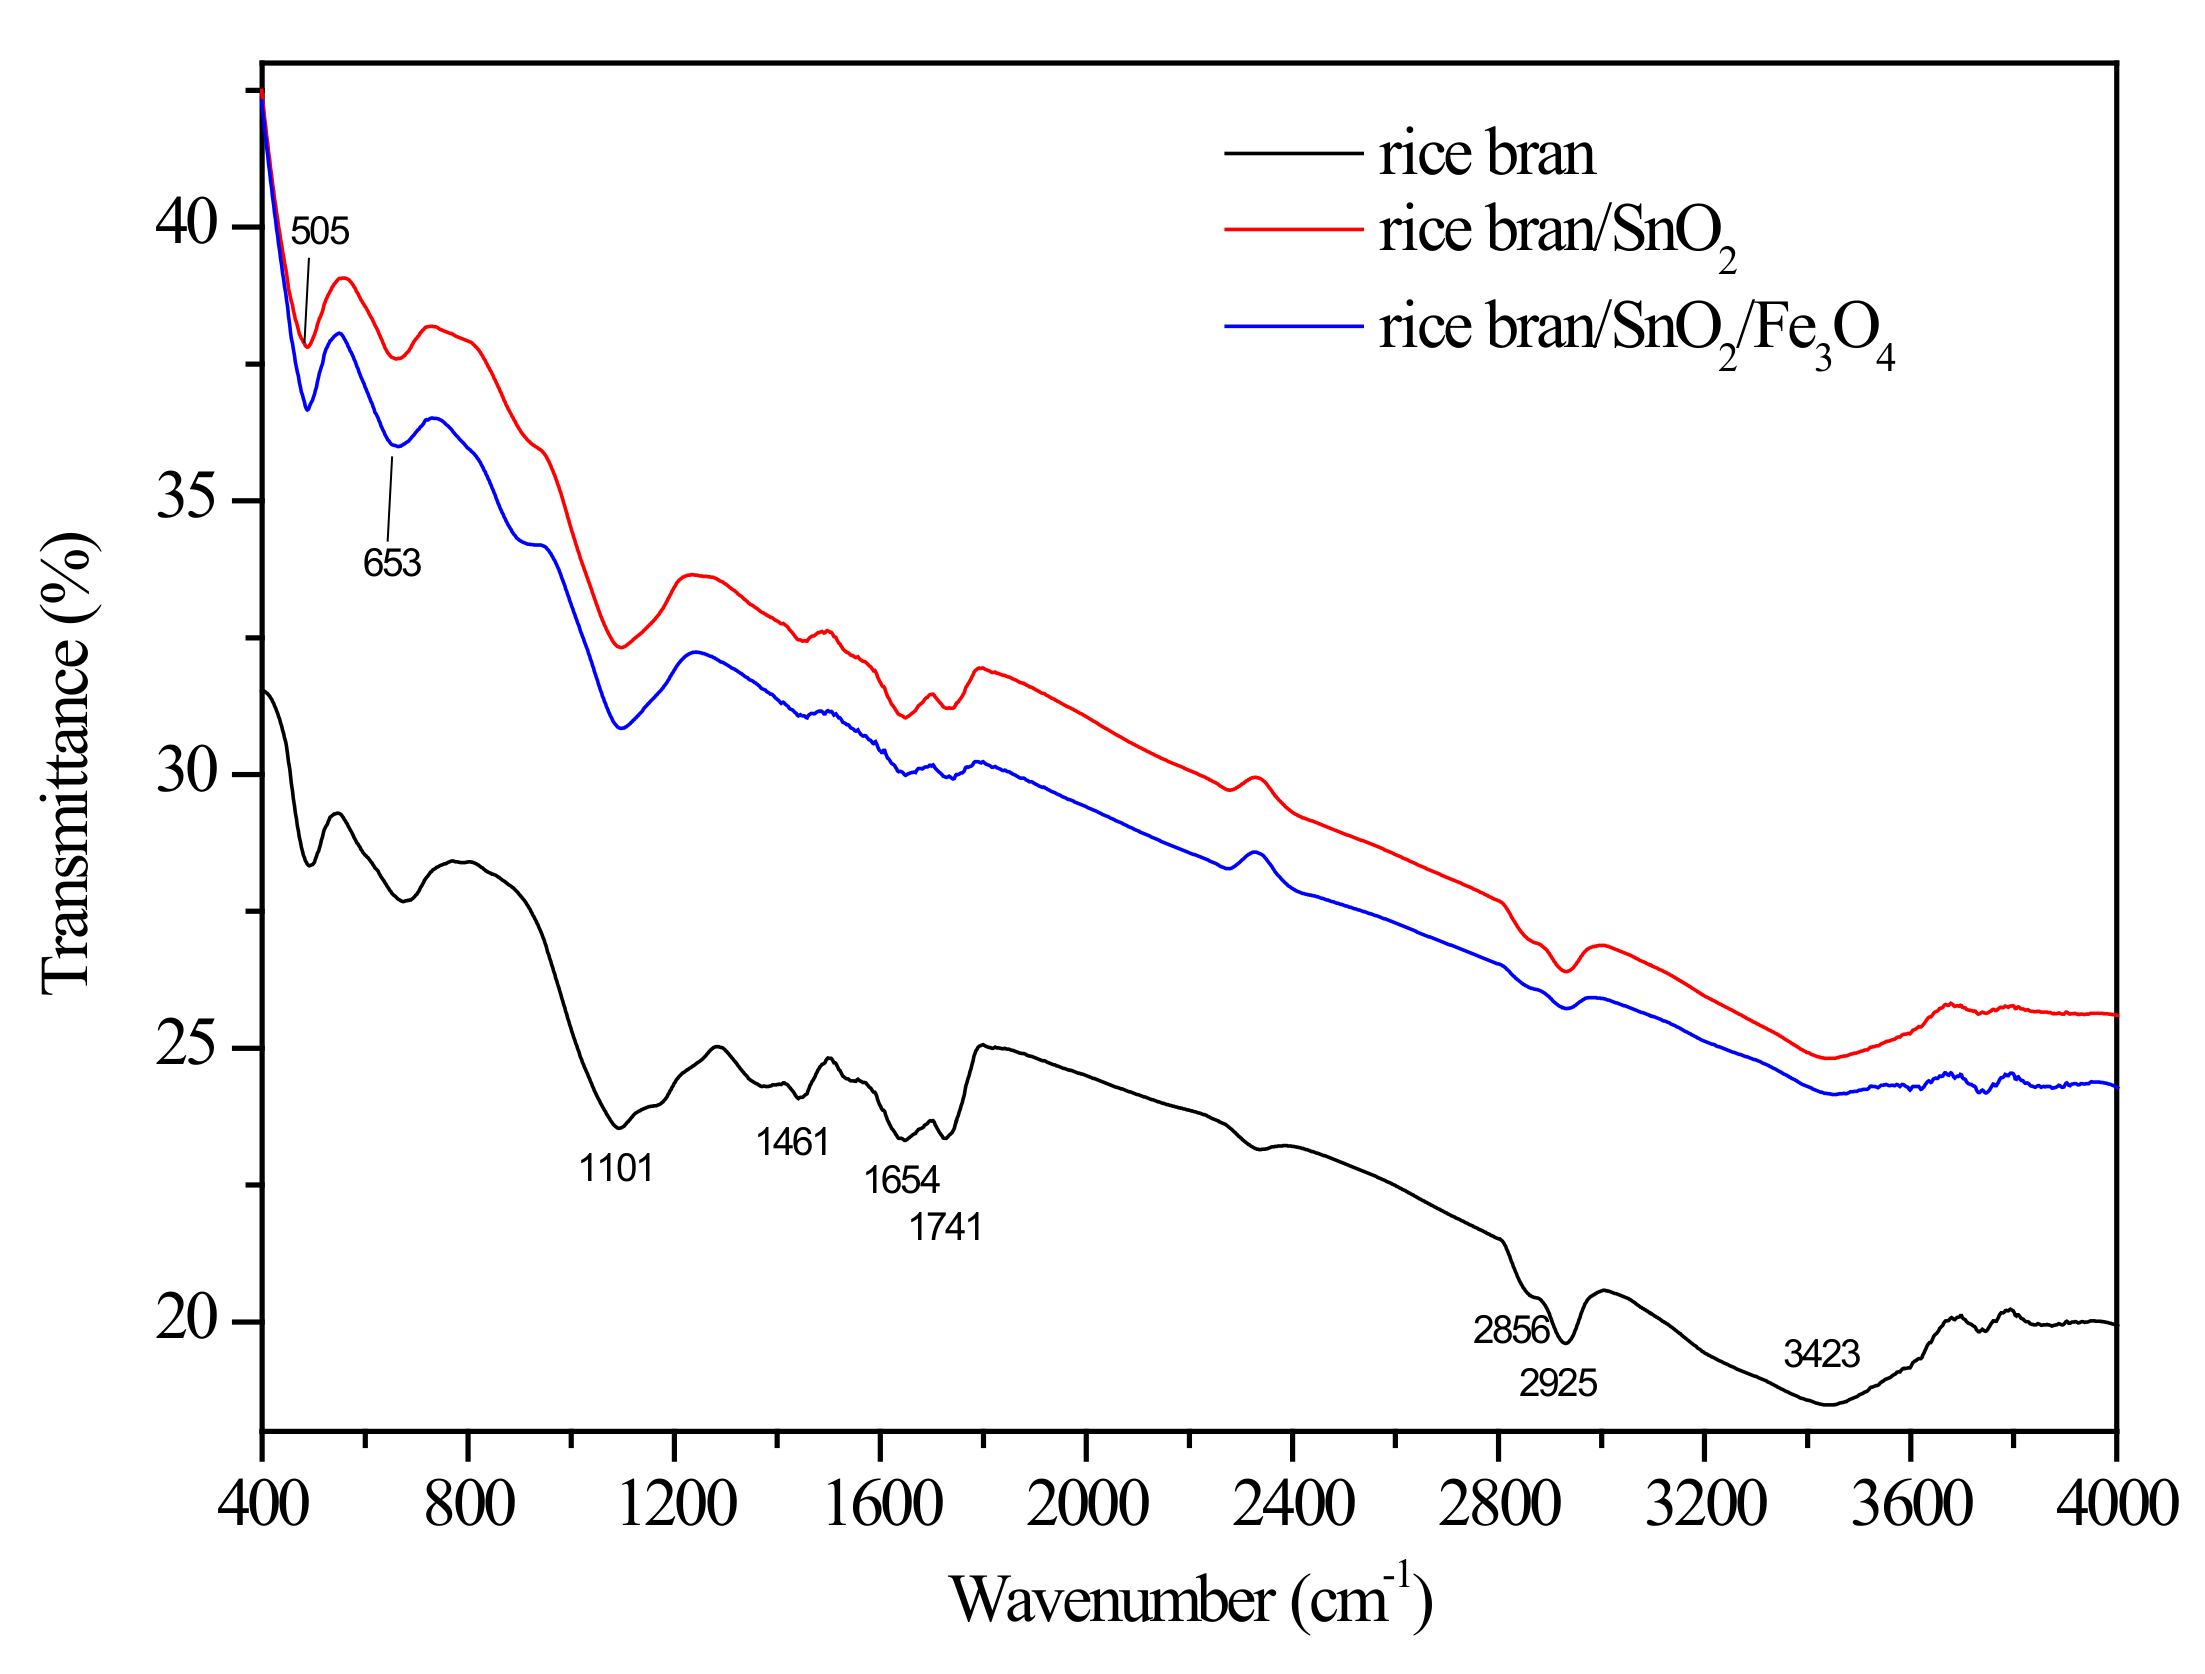
Figure 3 shows the comparison of FTIR spectra of the rice bran, rice bran/SnO2, and rice bran/SnO2/Fe3O4. The presence of rice bran evidently provided a strong and broad absorption peak vibration (-OH and -NH2) at ca. 3600–3200 cm−1, possibly combining the contributions from gamma-oryzanol, ferulic acid, cellulose, and lignin [33,34]. The peaks in the rice bran spectrum at 2925 cm−1 and 2856 cm−1 are assigned to the -CH stretching vibrations, which are likely due to the contributions of cellulose and hemicellulose [35]. Other characteristic peaks at 1741, 1654, 1640 and 1200–1100 cm−1 represent the C=O, C=C, -NH and C-O groups, respectively [36]. A new peak in the FTIR spectrum appeared at 505 cm−1 of rice bran/SnO2, which is the stretching vibration of Sn-O [37]. After the magnetization, another new peak appeared at 653 cm−1 of rice bran/SnO2/Fe3O4, which is the stretching vibration of Fe-O [4]. This also indicated that the SnO2 and Fe2O3 were indeed attached to the rice bran. After the SnO2 and magnetic particles were loaded into the surface of the rice bran, the transmittance intensity was significantly attenuated.
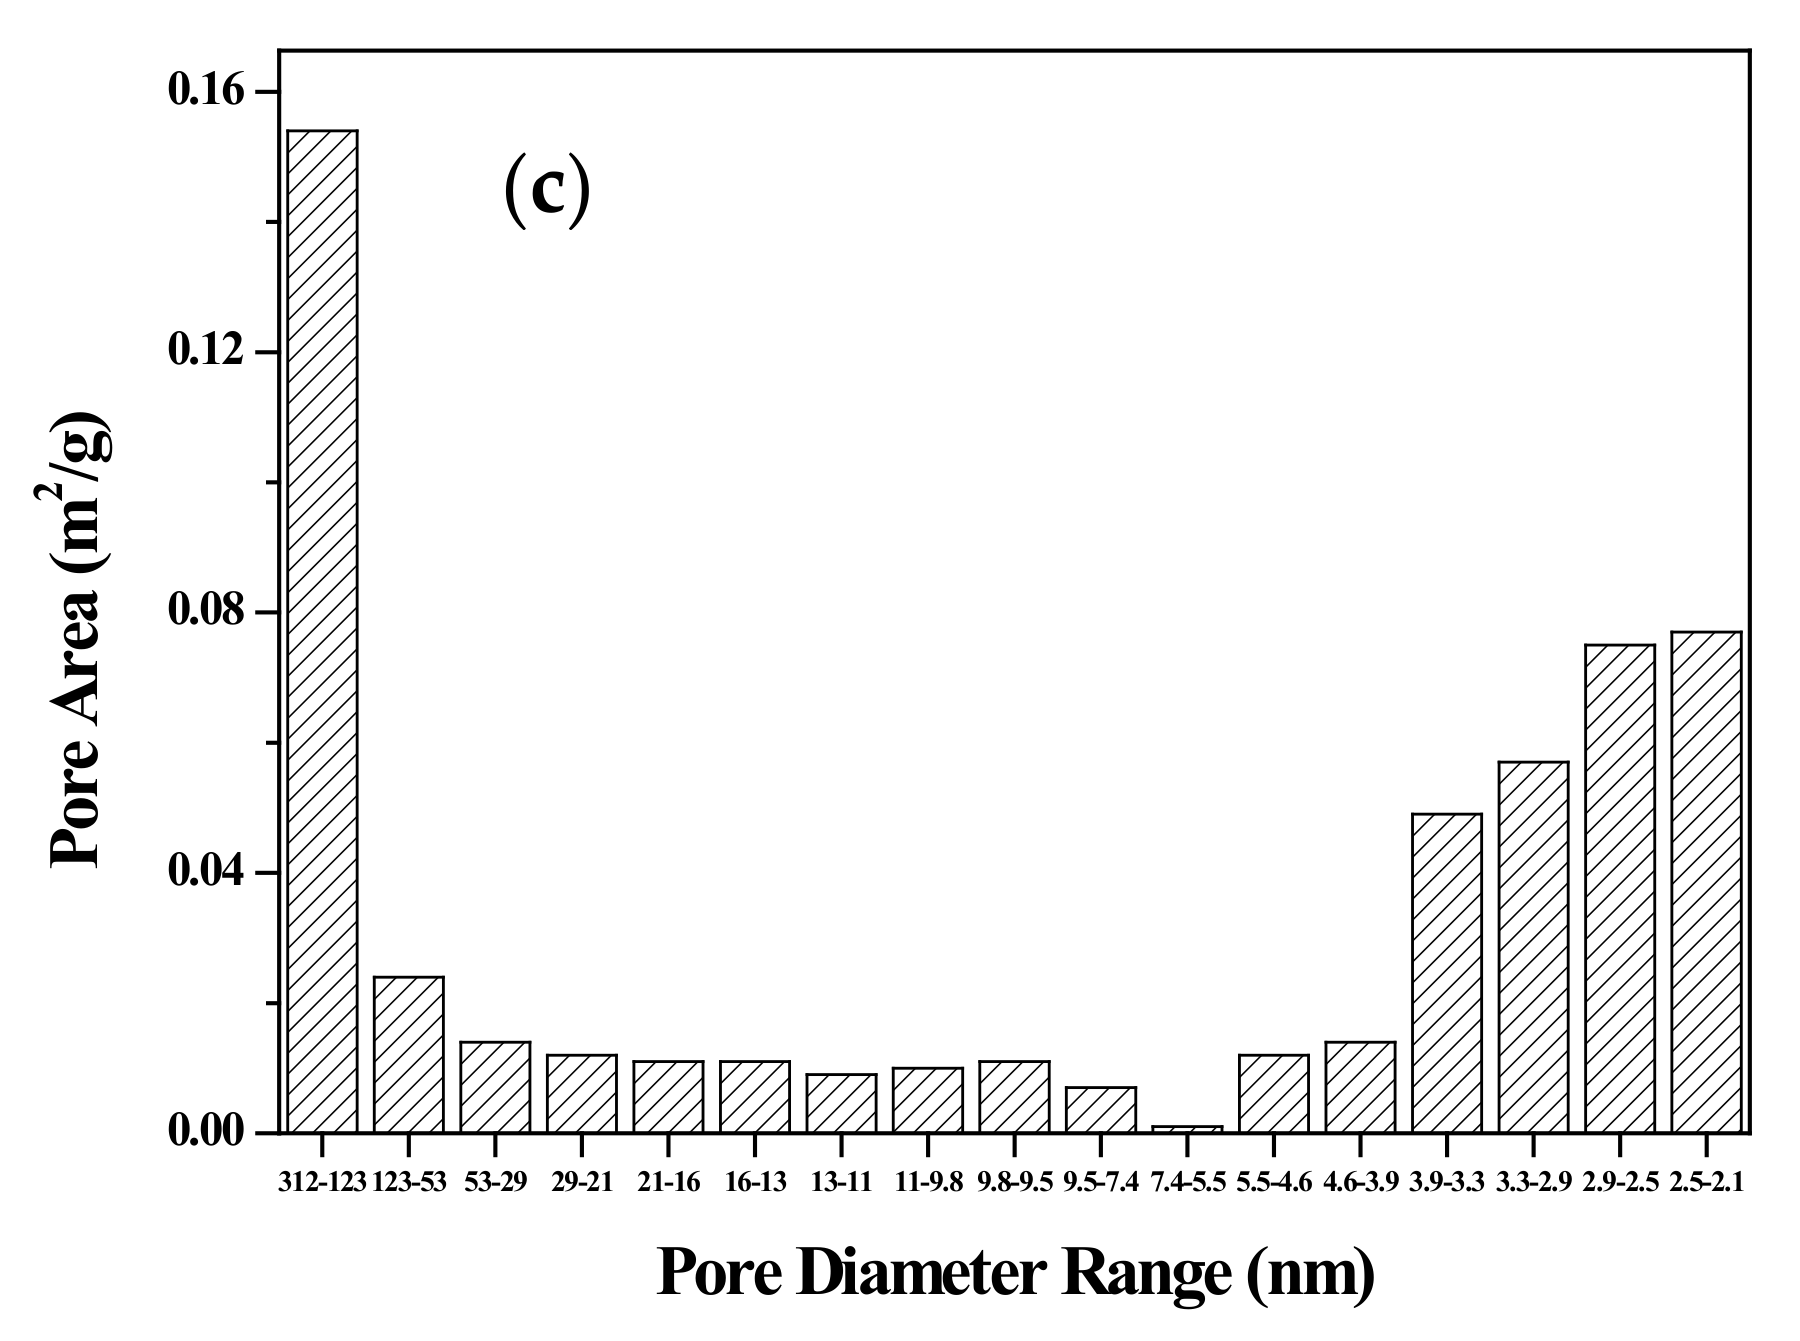
The specific surface area and porosity of the adsorbent are also characteristics of significant importance as indicators to characterize the adsorption behavior. Figure 4 shows the pore area distribution of the different pore sizes in the adsorbent. Most pore areas in the rice bran and rice bran/SnO2 (Figure 4a,b) are macropores (>50 nm). In addition, the pore areas of mesopores (2–50 nm) and micropores (<2 nm) in SnO2 are clearly higher than those in rice bran. For the rice bran/SnO2/Fe3O4 composite (Figure 4c), the pore area increased, particularly in the pore size range of 2–4 nm, which was likely due to the presence of SnO2 and magnetic particles. To provide a detailed figure of the available adsorption sites on the composite surface, BET analysis of the adsorbents was implemented, as indicated in Table 2. The BET specific surface area of the composites increased due to the presence of SnO2 and magnetic particles. The rice bran/SnO2/Fe3O4 composite had the largest specific surface area (0.746 m2/g) because of the attachment of SnO2/magnetic particles onto the surface of the rice bran. Thus, due to such a significant increase in contact area, rice bran/SnO2/Fe3O4 was anticipated to adsorb more dyes onto the surface of the adsorbent.

3.2. Effect of the Operation Condition

3.2.1. Effect of pH

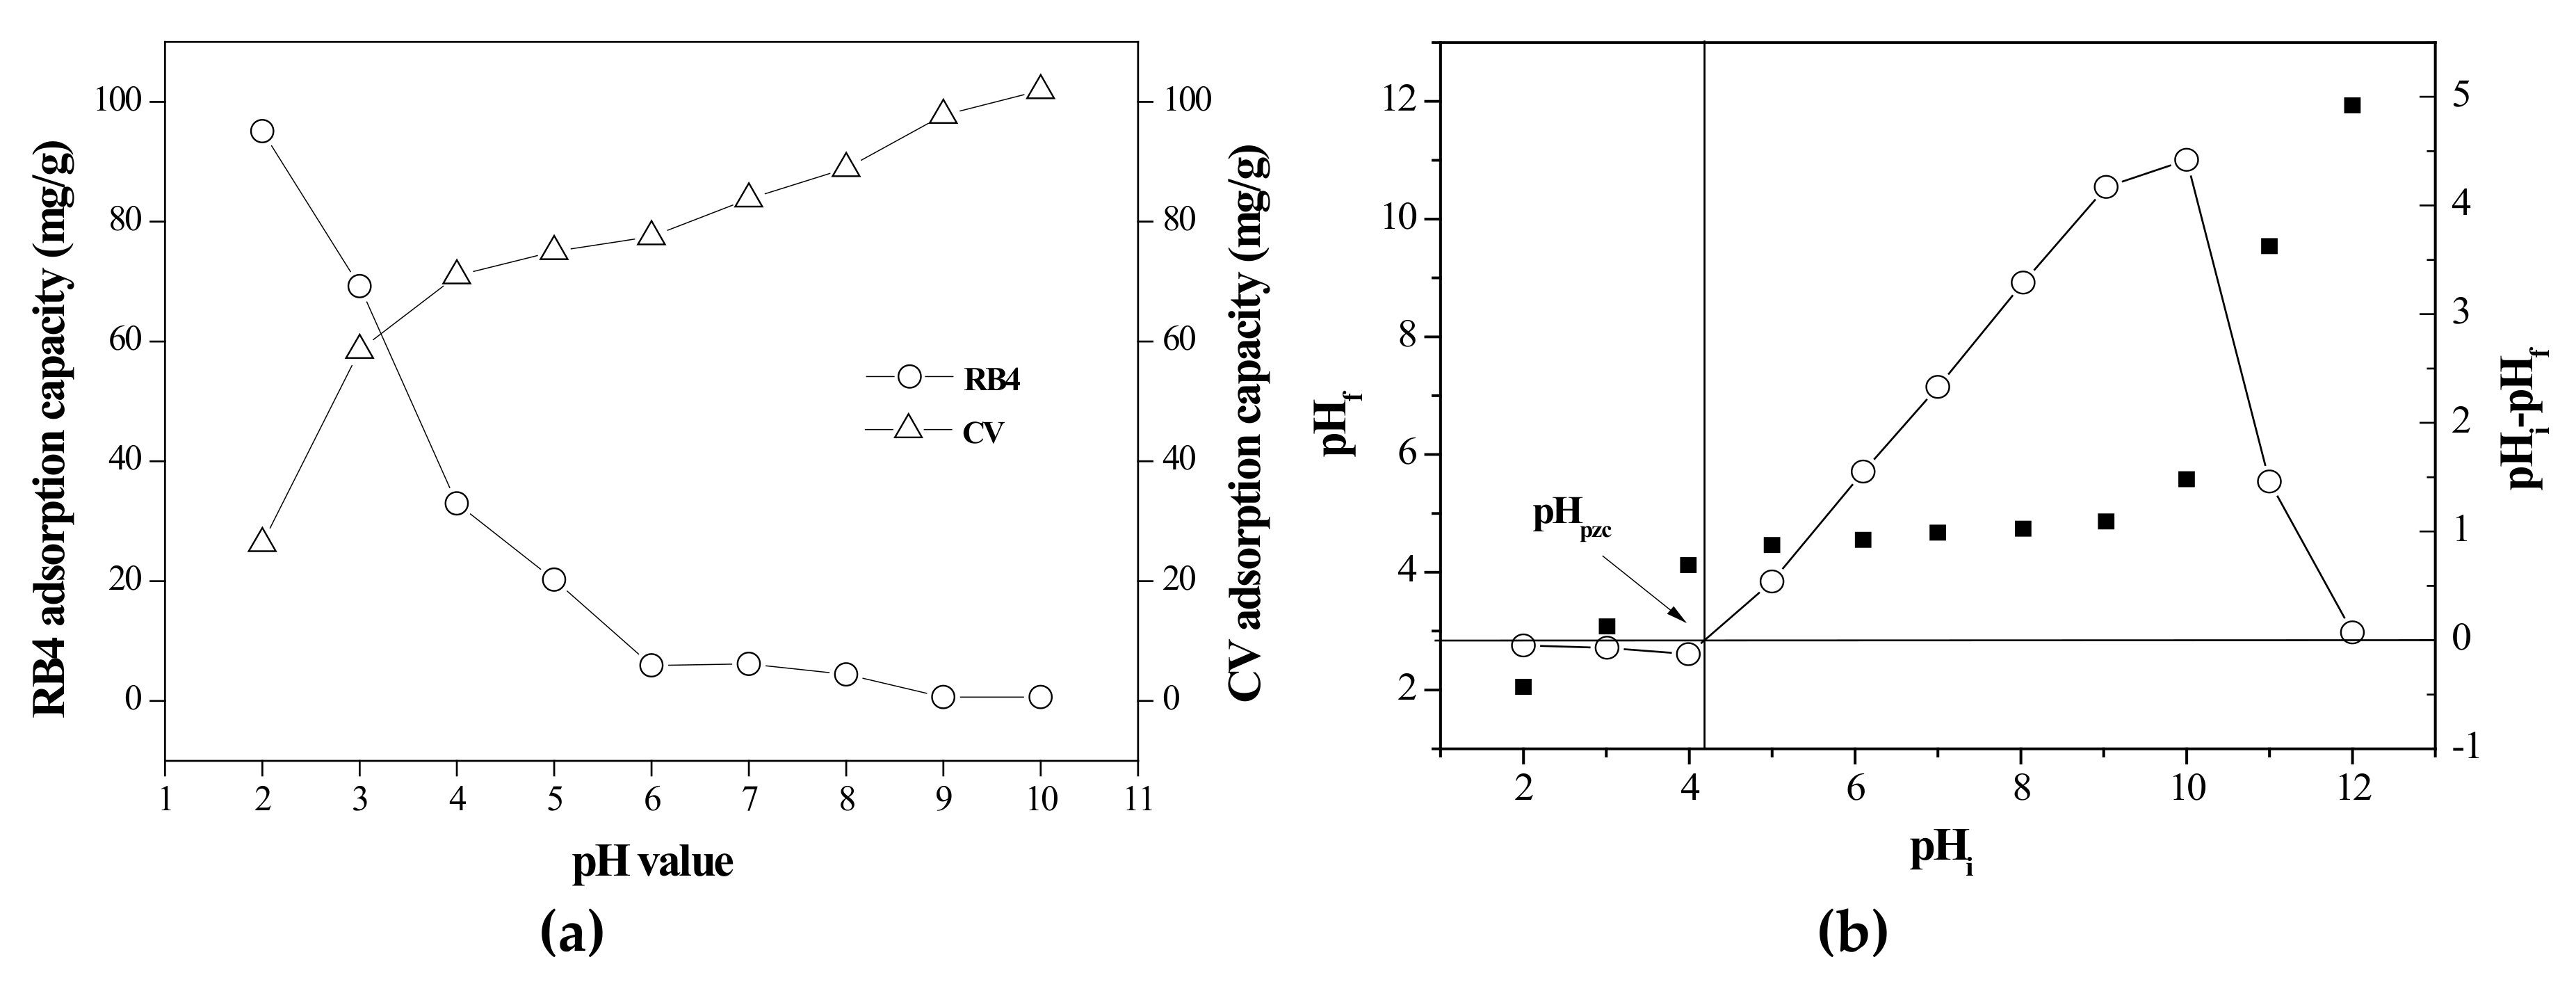
To reveal figures of absorption and desorption of prepared composites, the solution pH value is one of the most important influences on the adsorption process. The pH level affects the surface charge density between the adsorbent and the adsorbate to influence the adsorption capacity of the adsorbent. As Chakraborty et al. (2011) indicated, the surface of the adsorbent tends to be positively charged under acidic conditions, leading to a decrease in the available sites of adsorption of positively charged cationic dye due to electrostatic repulsion [10]. Munagapati and Kim (2016) reported that the number of negatively charged sites increases with the increase in the pH of the solution, and the surface of the adsorbent tends to be negatively charged under alkaline conditions. In contrast, adsorption of anion dye is not effective under higher pH conditions [11].
Figure 5a shows the effect of pH on the adsorption capacities of RB4 and CV onto the rice bran/SnO2/Fe3O4 adsorbent (2 g/L) at 30 °C for 360 min. The adsorption of RB4 decreased and that of CV rose as the pH of the aqueous dye solution increased. This could be due to on pHPZC of the adsorbent. At a low pH (<5.0), the surface of rice bran/SnO2/Fe3O4 is positively charged (pHPZC = 4.18, as shown in Figure 5b), which is due to the protonation of functional groups such as amines, carboxyls, and hydroxyls on the adsorbent. As a result, the interaction between the anion dye (RB4) and the adsorbent was favorable and the adsorption of RB4 increased. At a high pH (>5.0), the surface of the adsorbent was negatively charged. Moreover, the adsorption of the cationic dye (CV) increased with increasing pH due to the enhancement of electrostatic attraction that resulted from the increase in the negatively charged surface sites on the adsorbent [38]. This result of the pH effect was similar to those of different adsorbents based on agricultural resources as indicated elsewhere [11,12]. However, precipitation of CV was observed at pH = 10. Therefore, additional dye studies for RB4 and CV were conducted at fixed pH values of 2 and 9, respectively.

3.2.2. Effect of Adsorbent Dose

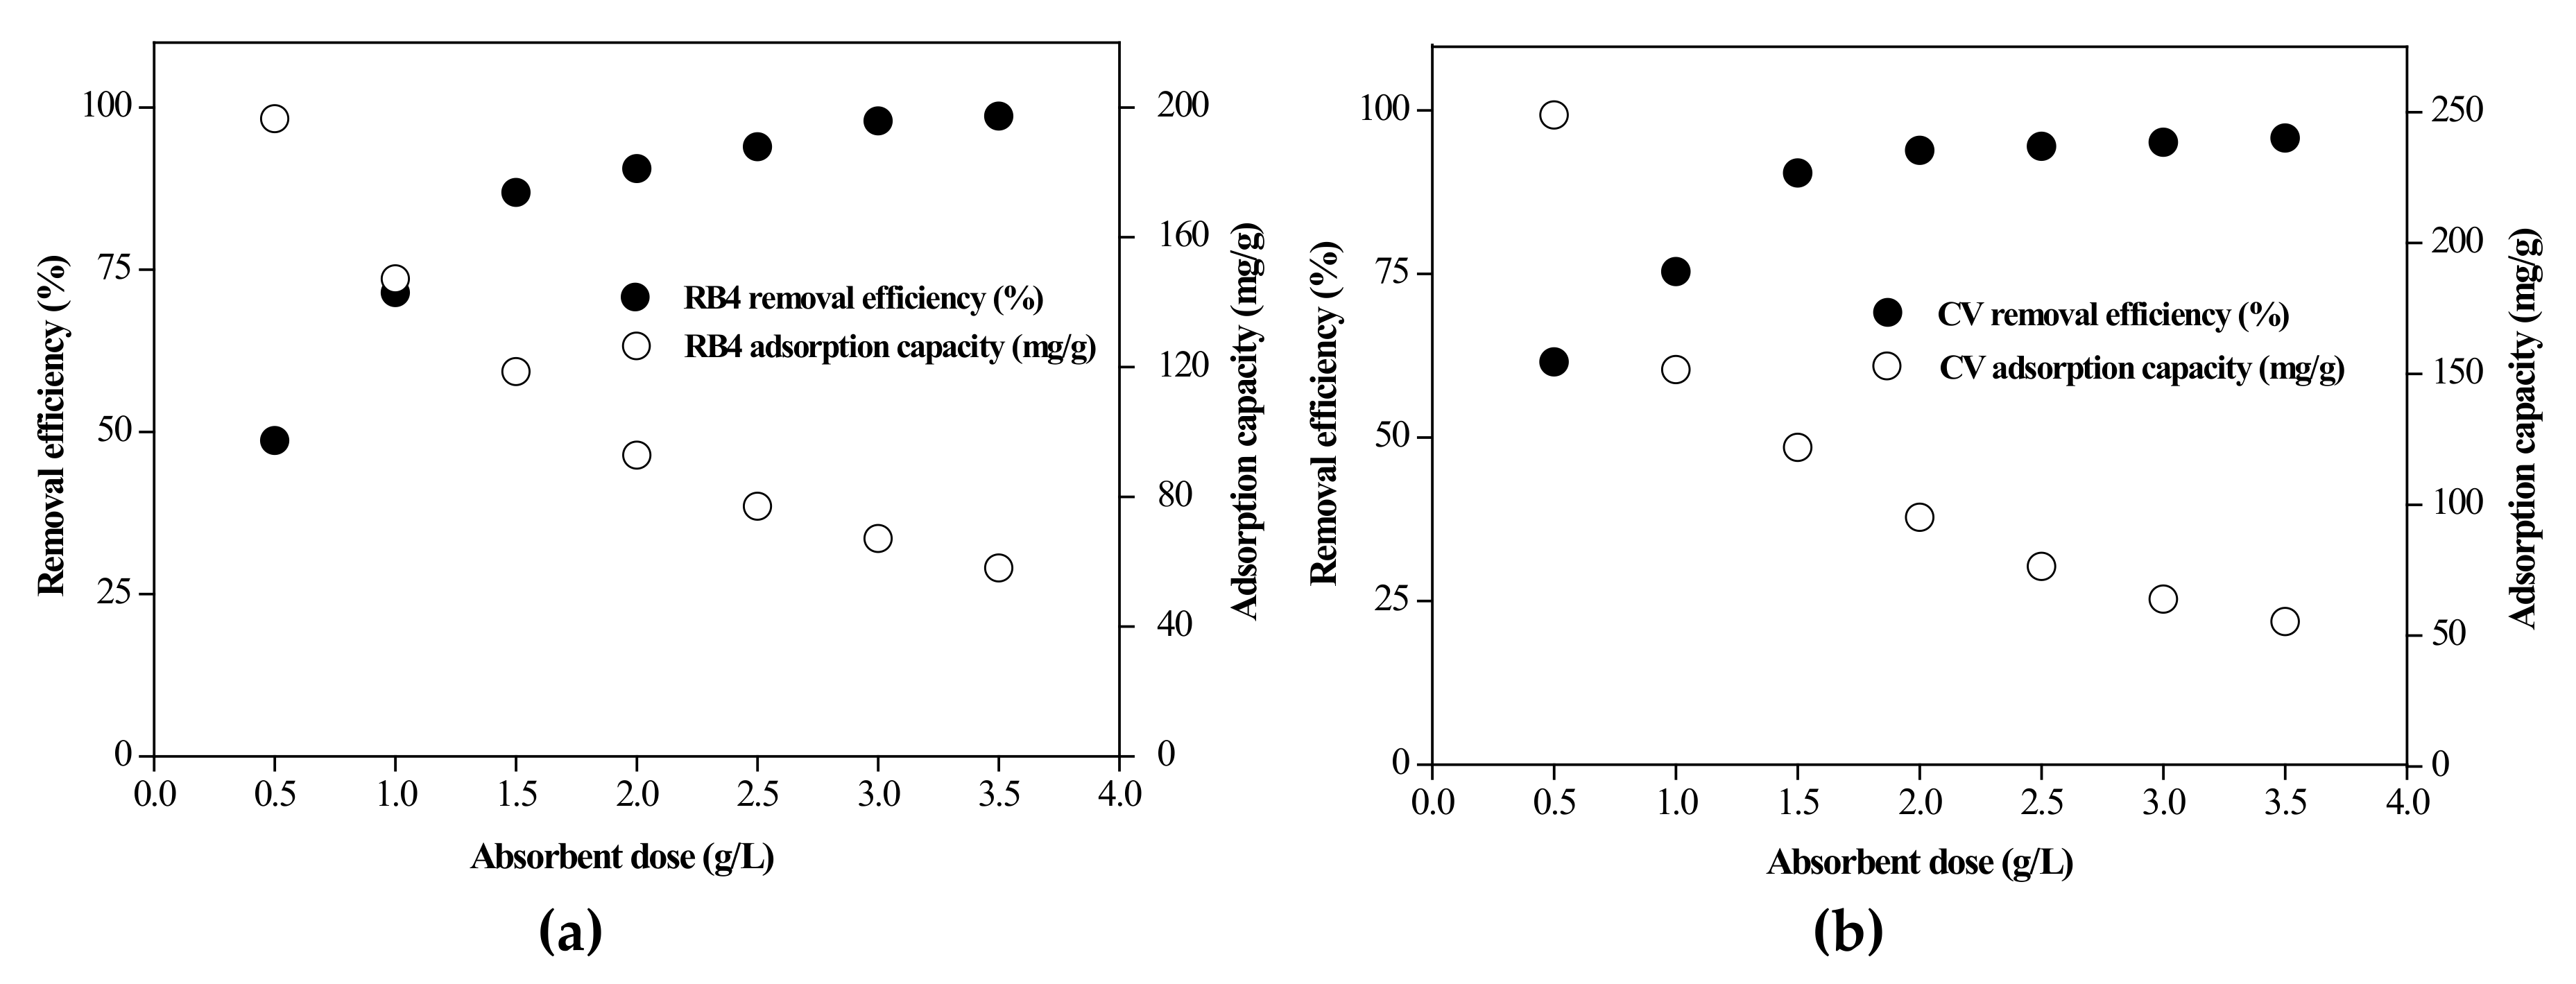
The dose of the adsorbent is also an important factor for dye adsorption, as it can determine the capability of dye removal and affect the cost of the dye solution. The effect of the adsorbent dose on the removal of the RB4 and CV dyes was evaluated over a range of 0.5–3.5 g/L. Figure 6 shows the effect of the adsorbent dose on the dye removal efficiency and the dye adsorption capacity of RB4 and CV onto the rice bran/SnO2/Fe3O4 composite. Both the RB4 and CV dye removal efficiencies were positively correlated with the adsorbent dose and gradually approached equilibrium at an adsorbent dose of 1.5 g/L. In contrast, the adsorption capacity was negatively correlated with the composite dose. The decrease in the adsorption capacity at a higher adsorbent dose may be due to aggregation [39,40]. Such aggregation decreases the surface area and available active sites of the composite and increases the diffusional path length [41]. At an adsorbent dose of 1.5 g/L, the dye removal efficiency reached approximately 90%, and dye removal was not significantly affected as the adsorbent dose was further increased. Therefore, the optimum dose for effective removal of RB4 and CV dyes was found to be 1.5 g/L.

3.2.3. Effect of Temperature

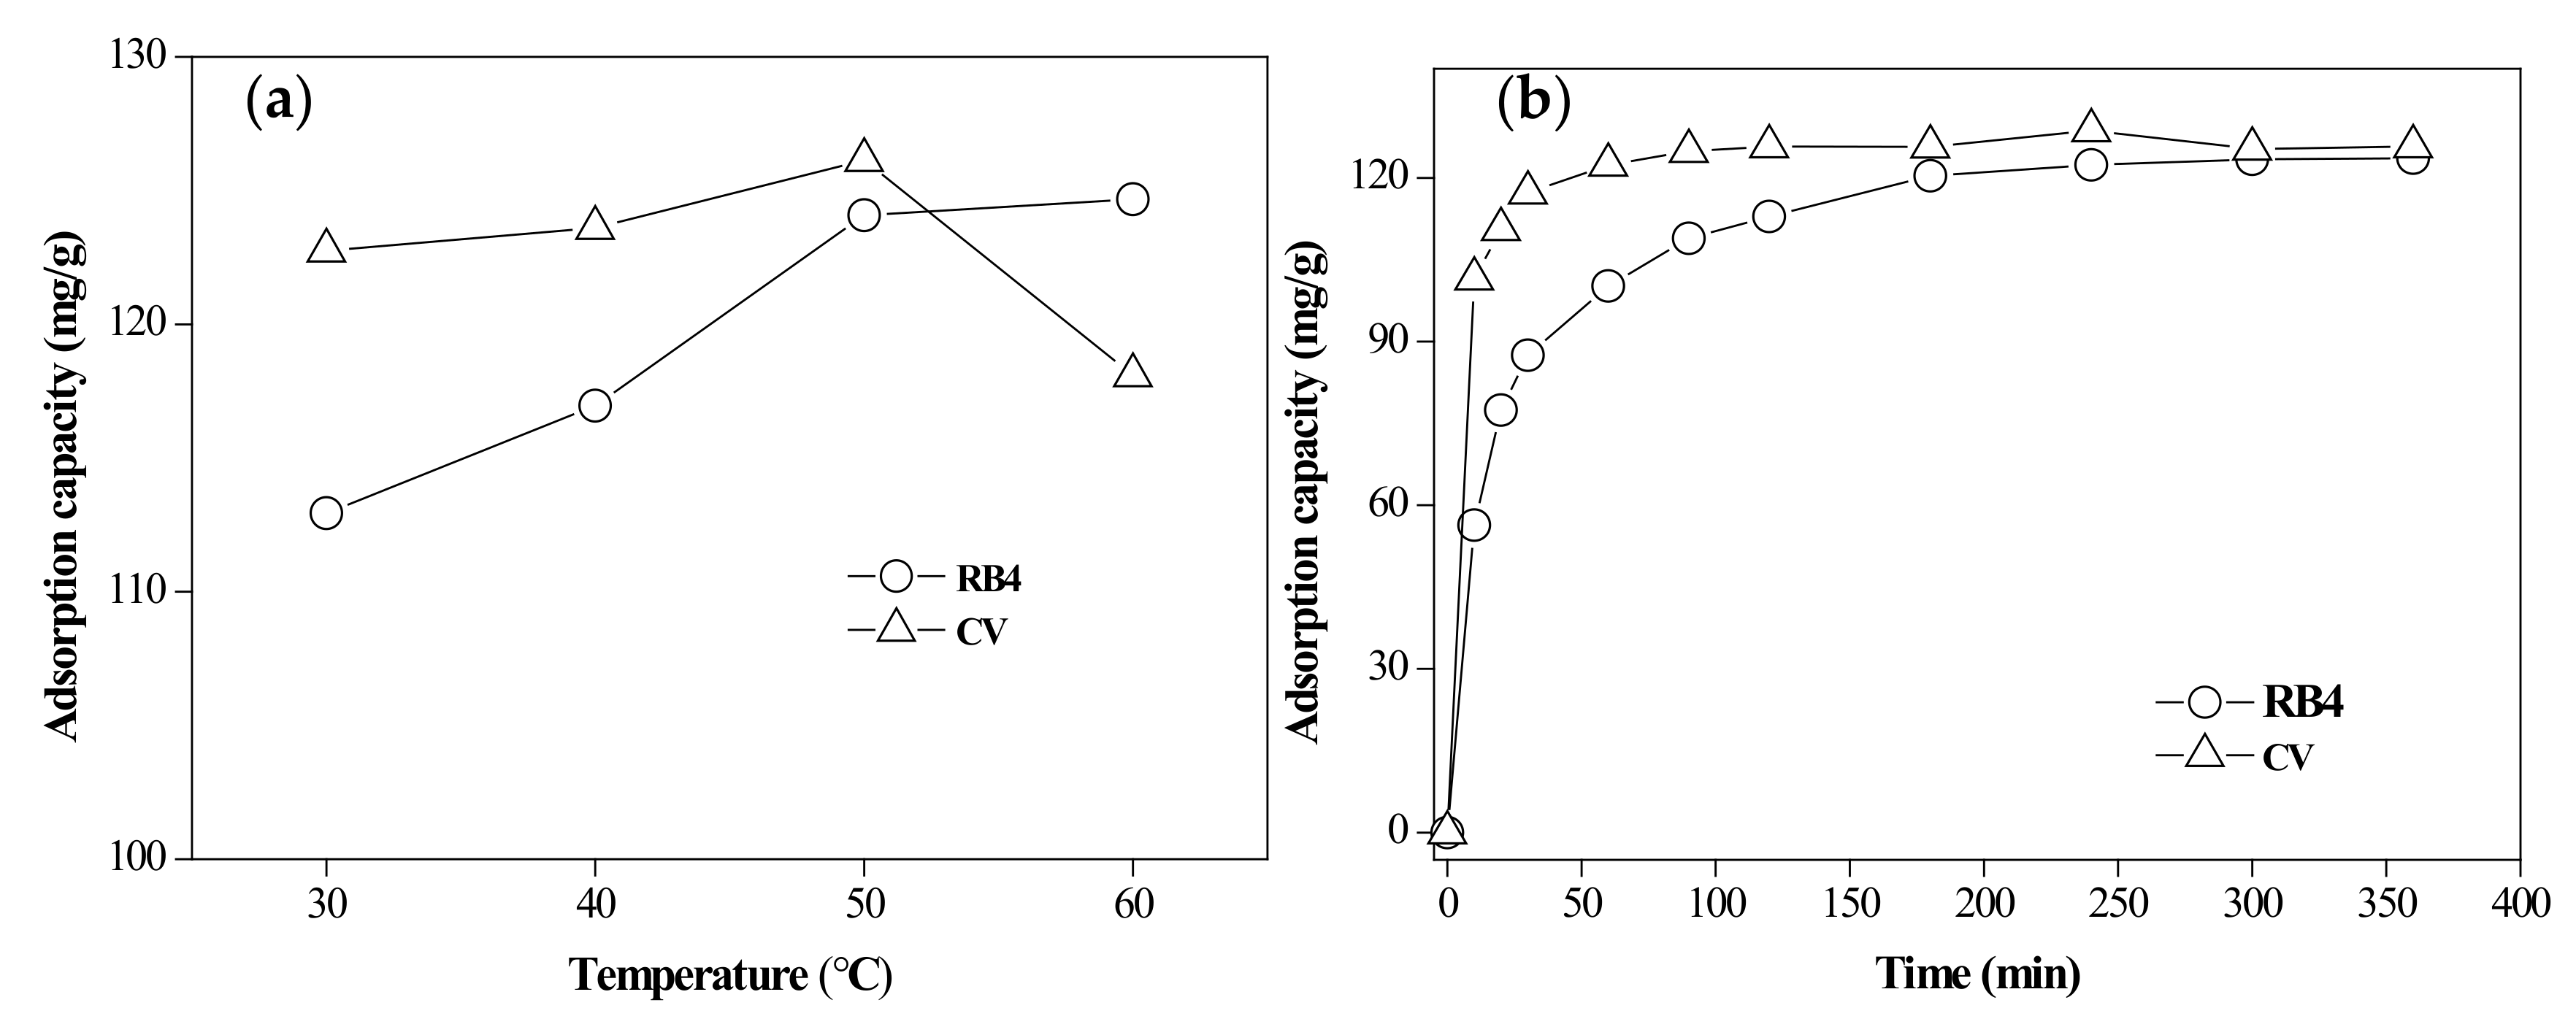
The influence of temperature on the adsorption capacity of the dyes was investigated in the range of 30–60 °C (Figure 7a). The dyes’ adsorption capacities for the adsorbent increased as the temperature increased from 30 to 50 °C. At a higher temperature, the viscosity of the solution decreased, which helped the dye molecules to rapidly penetrate the outer boundary layer and diffuse into the pores of the adsorbent. On the other hand, the increase in temperature caused the expansion of the pores and increased the contact ability between the adsorbate and the adsorbent to facilitate adsorption of the dyes. RB4 adsorption at 60 °C was not significantly changed, suggesting the stability of the composite to hold dye molecules. However, the CV adsorption at 60 °C decreased, possibly due to the damage of the active sites, which weakened the force between the active binding sites of the adsorbent and the adsorbate molecules [42,43]. Hence, the optimum adsorption temperature for dyes was found to be 50 °C in this study.

3.3. Adsorption Kinetics and Isotherm Modeling

3.3.1. Adsorption Kinetics

An investigation of the dye adsorption kinetics was carried out using the single-factor optimal conditions (RB4 dye initial concentration of 200 mg/L, temperature 60 °C, pH = 2, and adsorbent dose of 1.5 g/L; CV dye initial concentration of 200 mg/L, temperature 50 °C, pH = 9, and adsorbent dose of 1.5 g/L). Figure 7b shows the adsorption capacity for RB4 and CV for various contact times (<6 h). Evidently, the adsorption capacity increased with contact time and reached equilibrium after 6 h. The adsorption kinetics of RB4 and CV onto the rice bran/SnO2/Fe3O4 composite tended to be described by the pseudo-first-order model (PFOM) and pseudo-second-order model (PSOM), which can be presented as Equations (3) and (4), respectively [44,45]:
ln q e q t = ln q e k 1 t
t q t = 1 k 2 q e 2 + t q e
where k1 (min−1) and k2 (g/mg·min) are the adsorption rate constant of PFOM and PSOM, respectively; qt (mg/g) is the adsorption capacity at time t (min).
The results in Table 2 show that the experimental qe values seemed to be more consistent with the calculated values of the PSOM, and the linear regression coefficient (R2) is the highest among these models. Therefore, the PSOM is more suitable than the PFOM to describe the transient dynamics of the adsorbent adsorption.
In fact, the dye adsorption process on composite adsorbent was complicated, and possibly different mechanisms were involved. An intraparticle diffusion model (IPDM) can be applied to describe the diffusion mechanism of the dye molecules from the surface to bulk of the adsorbent as described elsewhere [46]:
q t = k i d t 0.5 + C
where kid (mg/g·min0.5) is the intraparticle diffusion rate constant; C is the boundary layer thickness.
The estimated parameters of the IPDM are listed in Table 3. The kinetic data might be composed of multiple linearities and two or more stages that may influence dye adsorption, and it appeared intraparticle diffusion was not the only rate-controlling step. The first stage is instantaneous adsorption (external mass transfer or boundary layer effect) when dye molecules are adsorbed onto the adsorption sites available on the surface of the adsorbent. The second stage (pore diffusion) consists of dye molecules diffusing into the bulk of the adsorbent and finally approaching the equilibrium stage. A larger intercept, C (boundary layer thickness), led to a greater boundary layer effect on the adsorption process [36]. In addition, a smaller boundary layer thickness (C) and a larger intraparticle diffusion rate constant (kid) indicated that the dye adsorption process was mostly governed by boundary layer diffusion [8].

3.3.2. Isotherm Modeling

The adsorption isotherm model can be described as the distribution of dye molecules between the liquid (dye solution) and solid (adsorbent) phases in an equilibrium state. Adsorption isotherm experiments were carried out at a constant temperature with different initial concentrations (200, 300, 400, 500, and 600 mg/L). To study the most suitable model for the adsorption of RB4 and CV dyes, the widely used Langmuir and Freundlich isotherm models were used to fit the adsorption isotherm data; these models can be expressed as Equations (6) and (7), respectively [47,48]:
C e q e = 1 q m K L + C e q m
ln q e = 1 n ln C e + ln K F
where Ce is the dye concentration (mg/L) at equilibrium; qm and KL are the maximum adsorption capacity (L/mg) and the Langmuir constant, respectively; KF and n are the Freundlich isotherm constant (mg/g) and adsorption intensity, respectively.
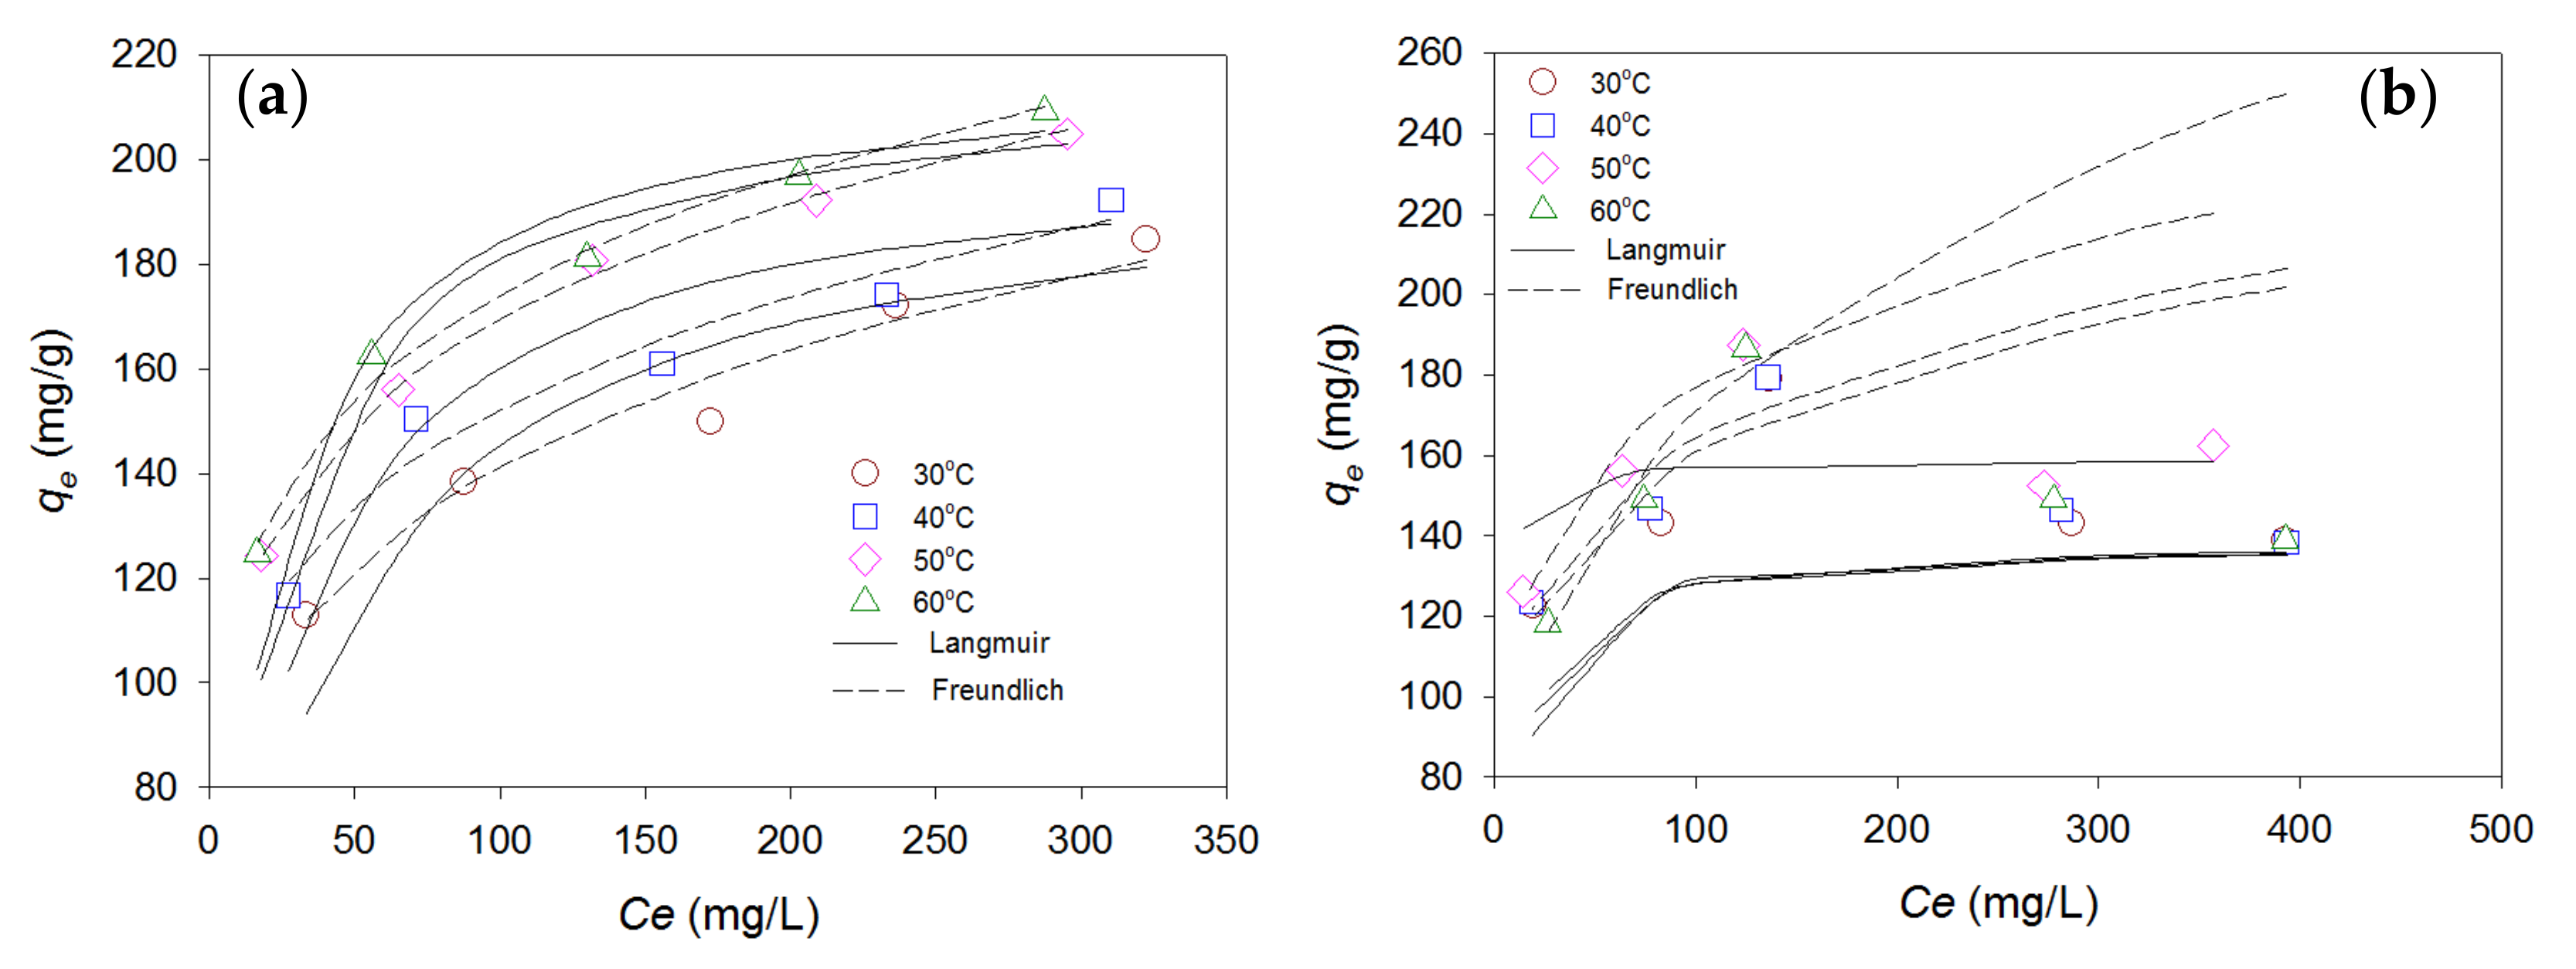
Figure 8 shows the equilibrium adsorption of RB4 and CV onto rice bran/SnO2/Fe3O4 composite adsorbent (pH = 2, adsorbent dosage of 1.5 g/L, and RB4 concentration of 200 mg/L; pH = 9, adsorbent dosage of 1.5 g/L, and CV concentration of 200 mg/L), respectively. The adsorption capacities increase at higher temperature of RB4 dye, which was consistent with previous experimental results of the temperature effect. The analysis results of the isotherm adsorption data are shown in Table 4. The isotherm adsorption data (qe and Ce) was fitted to Langmuir model and Freundlich model, as shown in Figure 8. The linear regression coefficient (R2) of the Langmuir isotherm model for both dyes was greater than the R2 value of the Freundlich model, indicating that the Langmuir isotherm model was more appropriate to describe the isotherm adsorption behavior than the Freundlich model. The Langmuir adsorption model elucidates adsorption by assuming monolayer coverage, insignificant interactions between adsorbate molecules on adjacent sites, and energetically identical sites for adsorption. Therefore, this finding may suggest that the RB4 and CV dyes were adsorbed onto a homogeneous surface of the adsorbent and formed a single layer with uniform adsorption energies. The maximum adsorption capacities of the RB4 and CV dyes were 218.82 and 159.24 mg/g, respectively. As shown in the literature, RB4 and CV dyes have been removed by adsorbents produced from different agriculture wastes [49,50,51,52,53,54]. The adsorption capacities of the composite adsorbent developed in this study compared with those of various agricultural waste adsorbents, for removal of RB4 or CV from aqueous solutions, were found to be highly promising (Table 5). The results suggest that the newly developed rice bran/SnO2/Fe3O4 composite adsorbent can provide better adsorption capacity than other adsorbents. The rice bran/SnO2/Fe3O4 composite adsorbent also has better adsorbing capacity than rice bran/Fe3O4 [12]. This new composite adsorbent can be more favorably used in removal of both cationic and anionic dyes.

3.4. Optimal Adsorption and Interactive

To determine global optimization of adsorption, optimization of the main factors and two-factor interaction should be assessed. Thus, the results of RB4 removal rate based on the CCD of the RSM are shown in Table 1. The experimental data were applied to evaluate linear, quadratic, and cubic models, and results indicated that the quadratic model was highly significant and suitable to represent the response of the RB4 dye removal. Assuming the combined interaction of more than two factors could be neglected, a second-order polynomial equation was obtained, and the calculation result of the RB4 removal rate equation was as follows:
RB 4   removal   rate = 31.41 + 7.06   ×   A + 5.68   ×   B 24.09   ×   C 0.41   ×   AB 3.97   ×   AC 3.49   ×   BC 2.32   ×   A 2 + 2.331   ×   10 5 × B 2 + 4.51   ×   C 2
where A, B, and C are contact times, temperature, and values of pH, respectively. The predicted RB4 removal rate was computed by Equation (8); results are listed in Table 1.
The ANOVA results of the quadratic model are summarized in Table 6. The F-value, p-value, and lack of fit p-value of this empirical model were 98.84, less than 0.0001, and 0.1089, respectively. The results indicated that the empirical model is statistically significant with 95% confidence level. The determination coefficient (R2) was defined as a quality of the fitted model [55]. In this study, the R2 was 0.9889, which showed that the predicted RB4 removal rate matches the experimental results. The predicted R2 is a measure of the level at which the fitted model predicts a response value. The acceptable range of the discrepancy between the adjusted R2 value and the predicted R2 value should be less than 0.20; if the numerical difference is above 2, the model is regarded as not being appropriate to fit the data [56]. In addition, the appropriate value of adequate precision should be higher than 4 [28]. In our work, the adjusted R2, predicted R2, and adequate precision were 0.9789, 0.9331, and 34.747 respectively.
The contact times (A), temperature (B), and values of pH (C) p-values were all are less than 0.05, which implied statistically significance, and indicated that the three control factors had direct effects on the RB4 removal rate. The weights of variables of A, B, and C in Equation (8) indicated that the significance effects on RB4 removal rate were ordered as follows: pH level > contact times > temperature. Furthermore, the higher F-value (as shown in Table 6) implied a larger influence and statistical significance in RB4 removal, which was unanimous with the weight of variables shown in the empirical model. Additionally, the p-values of AC, BC, A2, and C2 were all less than 0.05, and the data were found to be statistically significant for this quadratic model. According to Equation (8), both AC (contact time–pH value) and BC (temperature–pH value) had a negative influence on the RB4 adsorption efficiency.
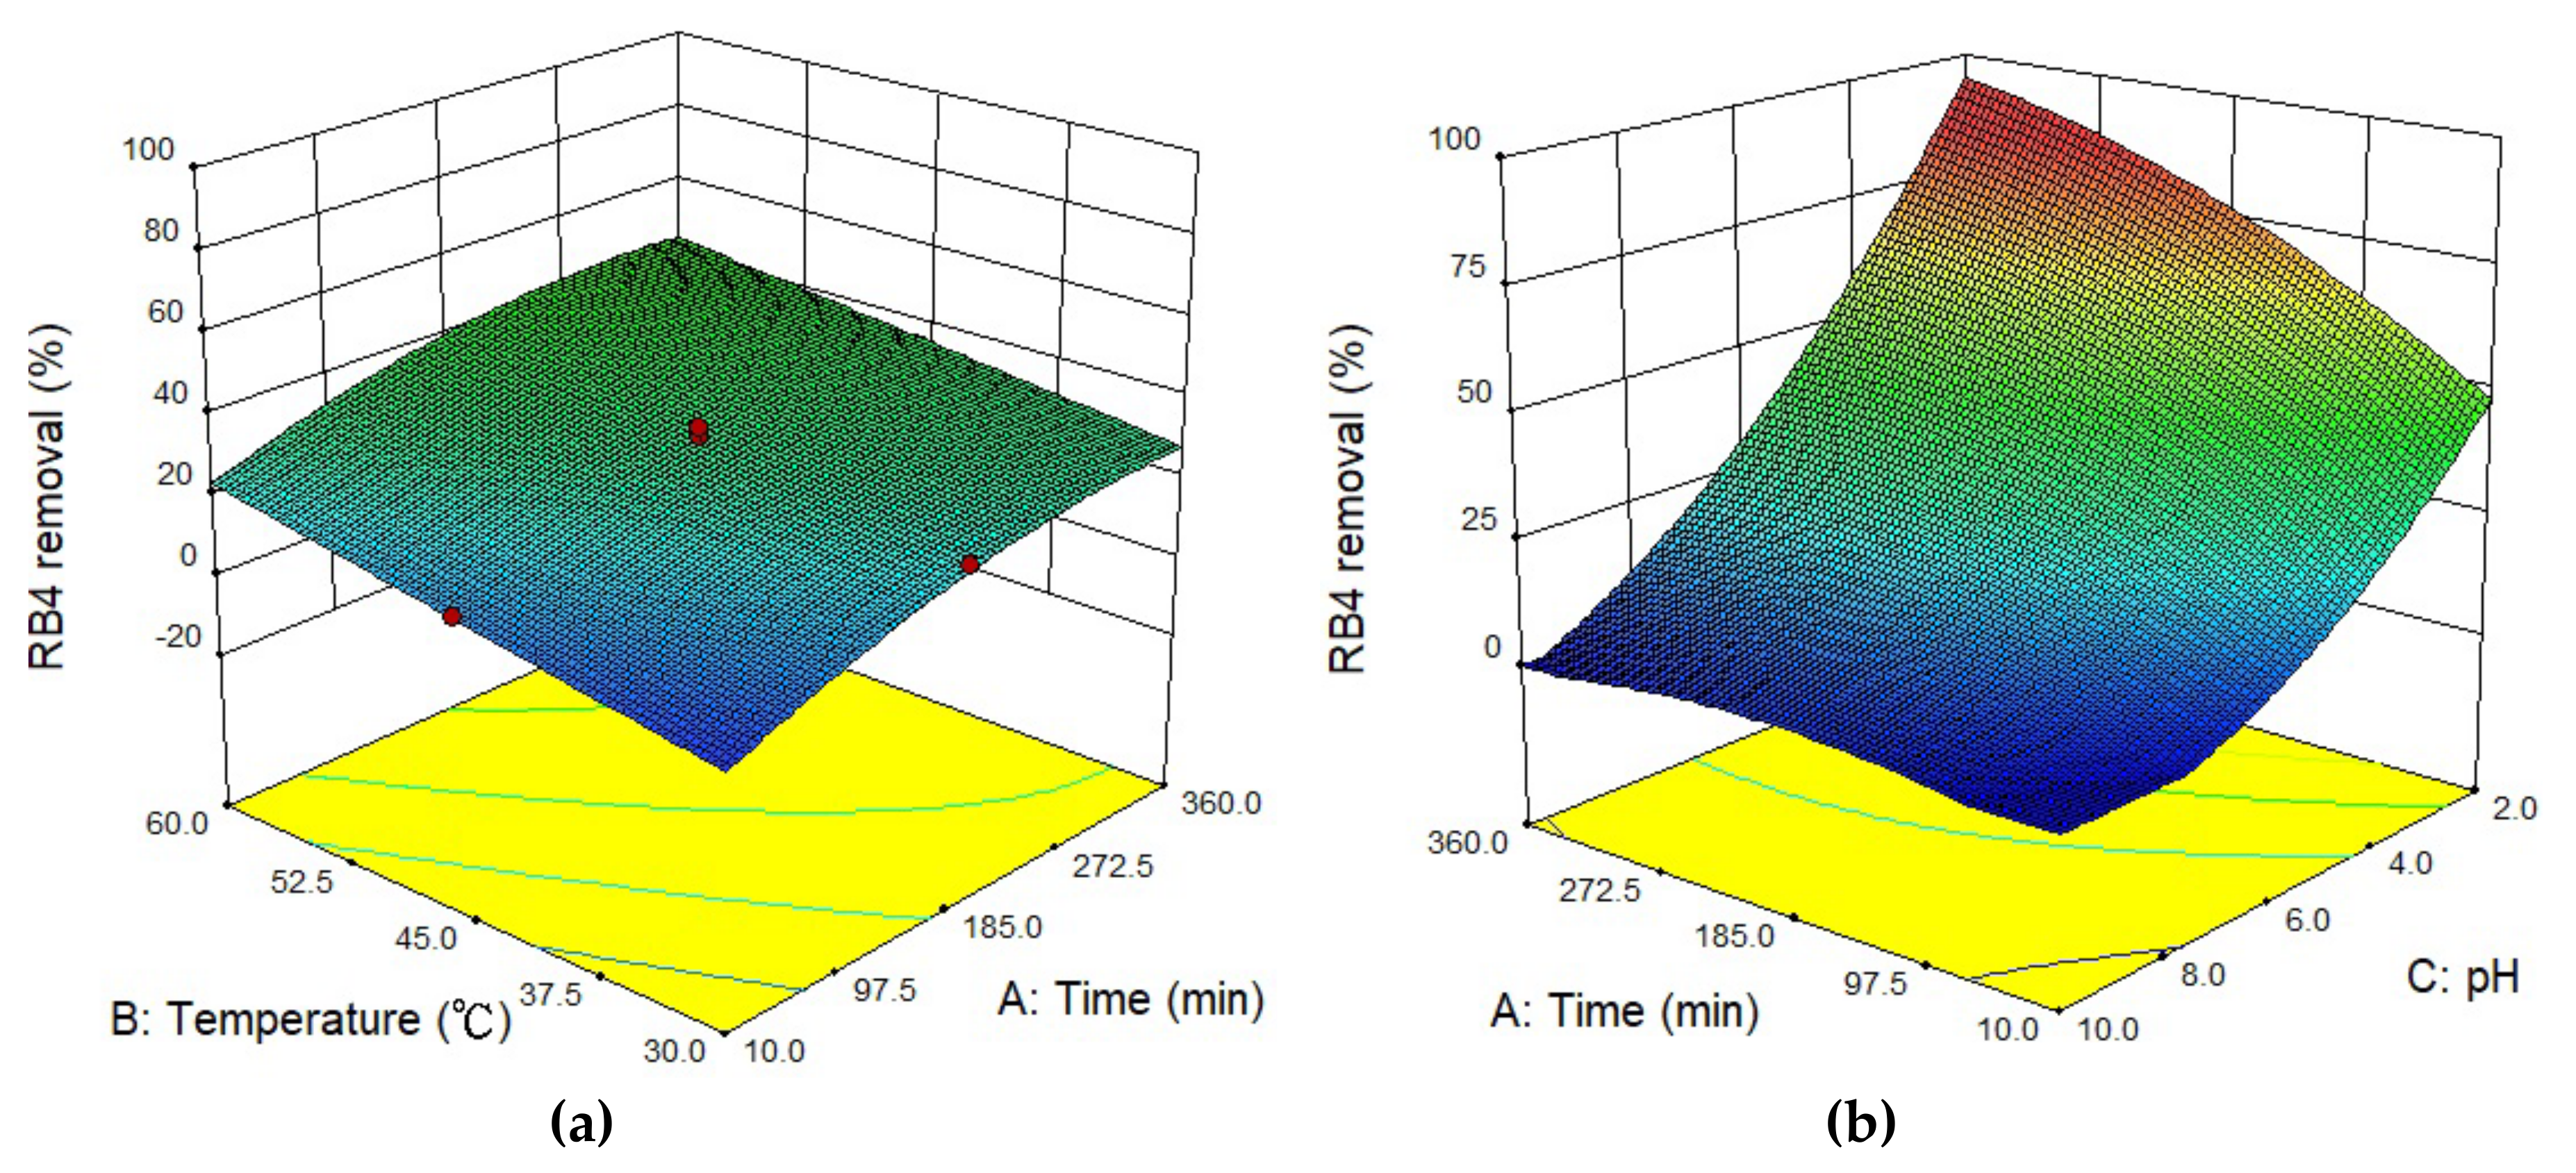
In addition, 3D response surface plots were used to investigate the interactions among contact times, temperature, and pH values. As shown in Figure 9a, the 3D response surface was almost flat. Furthermore, according to the statistical results in Table 5, the interaction between contact time and temperature was also not statistically significant. It can be concluded that, although increased contact time and temperature both affected the removal rate of RB4, there was not a significant interaction between the contact time and temperature. From Figure 9b, it can be observed that increased contact time did not significantly impact the removal rate in a high pH solution. At pH = 2, it is clearly shown that the removal rate of RB4 increased significantly as the contact time increased. Figure 9c shows the relationship between pH value of the solution and reaction temperature. The 3D plot is a distorted plane, which indicates that the pH value of the solution has a significant interaction with temperature. The results demonstrate that this RSM empirical model is a feasible approach to analyze the factor interactions of RB4 dye removal.
To confirm the feasibility of the RSM model to assess the conditions of the optimal RB4 removal rate (temperature 60 °C, pH = 2.93, and adsorption time = 360 min), comparisons of predicted values and new experimental results under the optimal operating conditions were made. The prediction result of the optimal RB4 removal rate was 100%. The RB4 adsorption finding revealed a removal rate of 98% under optimal operating conditions. The result indicated an insignificant experimental error between predicted and experimental values of the optimum removal rate. Thus, the RSM optimization implemented was reliable and achieved maximum dye adsorption removal.

3.5. Regeneration of the Adsorbent

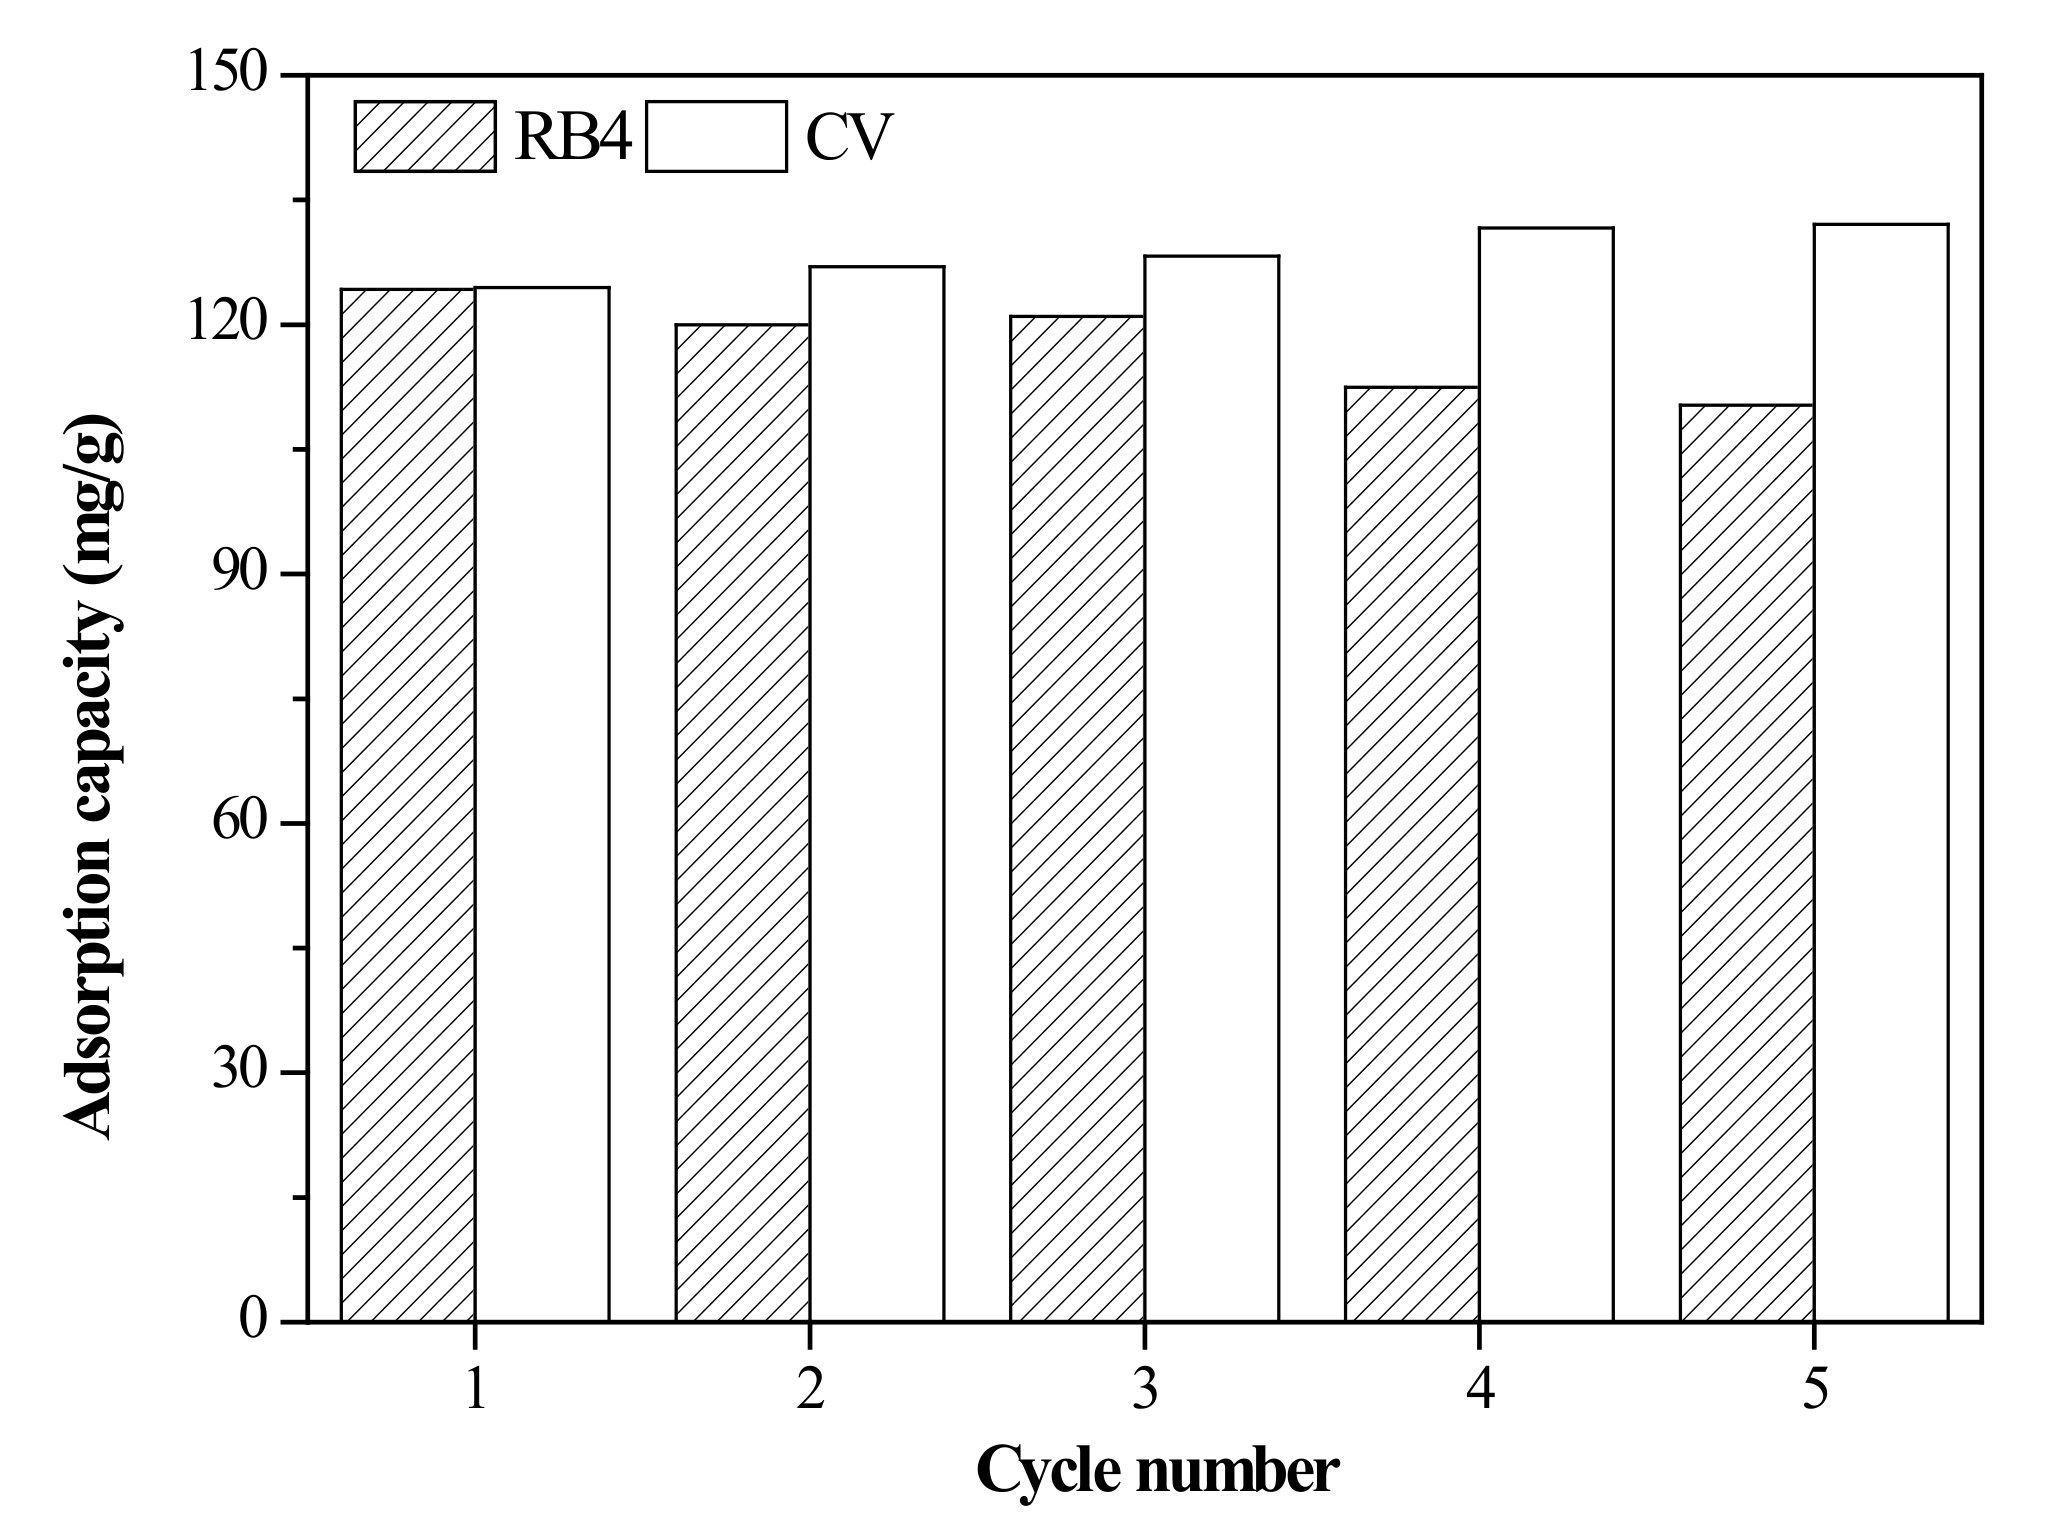
For green sustainability of the use of agricultural resources, the recycling and regenerative capacity of the adsorbent, as a crucial component of the cost-effectiveness of the water treatment process, was assessed. To investigate the reusability of the adsorbent, an acetic acid solution and a sodium hydroxide solution were used to desorb the RB4 and CV dyes. A dye-loaded adsorbent was immersed in a 0.1 M acetic acid solution and shaken for 10 min. The adsorbent was washed several times and immersed in a 0.1 M sodium hydroxide solution. Then, shaking was conducted for 10 min, and the adsorbent was then washed and dried to obtain the regenerated adsorbent. The regeneration performance of the adsorbent is shown in Figure 10. The adsorption capacity of RB4 decreased by 10% after five cycles, suggesting that the adsorbent has a very promising regeneration ability and reusability. In contrast, the adsorption capacity of CV increased by approximately 3% under the same conditions. That is, the adsorption capacity of CV was enhanced after the desorption process and was modified by the sodium hydroxide solution due to the surface characteristics of the rice bran/SnO2/Fe3O4 composite [57]. These results indicated that the rice bran/SnO2/Fe3O4 composite has a strong regeneration performance and can be reused as an adsorbent to efficiently remove RB4 and CV dyes at least five times.

4. Conclusions

The novelty of this work was the successful synthesis of a low-cost rice bran/SnO2/Fe3O4 composite and its application to the high capacity removal of RB4 and CV dyes from an aqueous solution. The adsorption performance of rice bran was enhanced by the loading of SnO2 and magnetic particles. In addition, compared to alternatives, the rice bran/SnO2/Fe3O4 composite possessed the largest specific surface area and was anticipated to adsorb more dyes onto its surface. The Langmuir isotherm model demonstrated a better fit to the isotherm adsorption, mono-layer adsorption seemed to appropriate. The results of the RSM showed that the quadratic model was suitable to represent the response of the RB4 dye removal. An optimum removal rate of 98% at 60 °C for pH = 2.93 and adsorption time = 360 min was found. Thus, the power of the model’s prediction of the optimum removal rate of RB4 dye appears to be highly promising for practical uses. In addition, the rice bran/SnO2/Fe3O4 composite showed excellent regeneration and reuse abilities. In the development and applicability of nanocomposite adsorbents, low-cost composites formed from agricultural byproducts as raw materials are economically feasible. The composite adsorbent developed in this study has the advantages of being recyclable and reusable, and has a simple preparation method, thus demonstrating its potential for the removal of dye from industrial wastewater.

Author Contributions

Conceptualization and methodology, Y.K.W., G.B.H. and C.M.M.; investigation and formal analysis, Y.K.W.; resources, G.B.H. and C.M.M.; data curation, Y.K.W.; writing—original draft preparation, Y.K.W., G.B.H. and C.M.M.; writing—review and editing, C.M.M. All authors have read and agreed to the published version of the manuscript.

Funding

This research was funded by the Ministry of Science and Technology, Republic of China, grant number MOST 108-2221-E-027-001 and MOST 105-2622-E-562-001-CC3.

Acknowledgments

The authors thank the Ministry of Science and Technology, Taiwan, for supporting this research financially.

Conflicts of Interest

The authors declare no conflict of interest. The funders had no role in the design of the study, in the collection, analyses, or interpretation of data, in the writing of the manuscript, or in the decision to publish the results.

References

  1. Robinson, T.; McMullan, G.; Marchant, R.; Nigam, P. Remediation of dyes in textile effluent: A critical review on current treatment technologies with a proposed alternative. Bioresour. Technol. 2001, 77, 247–255. [Google Scholar] [CrossRef]
  2. Angelova, R.; Baldikova, E.; Pospiskova, K.; Maderova, Z.; Safarikova, M.; Safarik, I. Magnetically modified sargassum horneri biomass as an adsorbent for organic dye removal. J. Clean. Prod. 2016, 137, 189–194. [Google Scholar] [CrossRef]
  3. Namasivayam, C.; Sangeetha, D. Recyling of agricultural solid waste, coir pith: Removal of anions, heavy metals, organics and dyes from water by adsorption onto ZnCl2 activated coir pith carbon. J. Hazard. Mater. 2006, B135, 449–452. [Google Scholar] [CrossRef] [PubMed]
  4. Ashrafi, M.; Chamjangali, M.A.; Bagherian, G.; Goudarzi, N. Application of linear and non-linear methods for modeling removal efficiency of textile dyes from aqueous solutions using magnetic Fe3O4 impregnated onto walnut shell. Spectrochim. Acta A Mol. Biomol. Spectrosc. 2017, 171, 268–279. [Google Scholar] [CrossRef] [PubMed]
  5. Wang, S.; Soudi, M.; Li, L.; Zhu, Z.H. Coal ash conversion into effective adsorbents for removal of heavy metals and dyes from wastewater. J. Hazard. Mater. 2006, B133, 243–251. [Google Scholar] [CrossRef]
  6. Belhouchat, N.; Zaghouane-Boudiaf, H.; Viseras, C. Removal of anionic and cationic dyes from aqueous solution with activated organo-bentonite/sodium alginate encapsulated beads. Appl. Clay Sci. 2017, 135, 9–15. [Google Scholar] [CrossRef]
  7. Bagheri, A.R.; Bagheri, A.R.; Ghaedi, M.; Asfaram, A.; Hajati, S.; Ghaedi, A.M.; Bazrafshan, A.; Rahimi, M.R. Modeling and optimization of simultaneous removal of ternary dyes onto copper sulfide nanoparticles loaded on activated carbon using second-derivative spectrophotometry. J. Taiwan Inst. Chem. Eng. 2016, 65, 212–224. [Google Scholar] [CrossRef]
  8. Debnath, S.; Ballav, N.; Maity, A.; Pillay, K. Competitive adsorption of ternary dye mixture using pine cone powder modified with β-cyclodextrin. J. Mol. Liq. 2017, 225, 679–688. [Google Scholar] [CrossRef]
  9. Guo, J.Z.; Li, B.; Liu, L.; Lv, K. Removal of methylene blue from aqueous solutions by chemically modified bamboo. Chemosphere 2014, 111, 225–231. [Google Scholar] [CrossRef]
  10. Chakraborty, S.; Chowdhury, C.; Saha, P.D. Adsorption of crystal violet from aqueous solution onto NaOH-modified rice husk. Carbohydr. Polym. 2011, 86, 1533–1541. [Google Scholar] [CrossRef]
  11. Munagapati, V.S.; Kim, D.S. Adsorption of anionic azo dye congo red from aqueous solution by cationic modified orange peel powder. J. Mol. Liq. 2016, 220, 540–548. [Google Scholar] [CrossRef]
  12. Hong, G.B.; Wang, Y.K. Synthesis of low-cost adsorbent from rice bran for the removal of reactive dye based on the response surface methodology. Appl. Surf. Sci. 2017, 423, 800–809. [Google Scholar] [CrossRef]
  13. Zhou, Y.; Zhang, L.; Cheng, Z. Removal of organic pollutants from aqueous solution using agricultural wastes: A review. J. Mol. Liq. 2015, 212, 739–762. [Google Scholar] [CrossRef]
  14. Grag, V.K.C.; Amita, M.; Kumar, R.; Gupta, R. Basic dye (methylene blue) removal from simulated wastewater by adsorption using Indian Rosewood sawdust: A timber industry waste. Dyes Pigm. 2004, 63, 243–250. [Google Scholar] [CrossRef]
  15. Bhatti, H.N.; Jabeen, A.; Iqbal, M.; Noreen, S.; Naseem, Z. Adsorptive behavior of rice bran-based composites for malachite green dye: Isotherm, kinetic and thermodynamic studies. J. Mol. Liq. 2017, 237, 322–333. [Google Scholar] [CrossRef]
  16. Hong, G.B.; Jiang, C.J. Biosynthesis of SnO2 nanoparticles based on response surface methodology and the study of their dye removal. J. Nanosci. Nanotechnol. 2018, 18, 5020–5025. [Google Scholar] [CrossRef]
  17. Hemmati, M.; Asghari, A.; Ghaedi, M.; Rajabi, M. Chemometric assisted sonochemical dyes adsorption in ternary solutions onto Cu nanowires loaded on activated carbon. J. Taiwan Inst. Chem. Eng. 2017, 76, 115–125. [Google Scholar] [CrossRef]
  18. Hoa, N.V.; Quyen, T.T.H.; Trung, T.S. One-step facile synthesis of mesoporous graphene/Fe3O4/chitosan nanocomposite and its adsorption capacity for a textile dye. J. Water Process Eng. 2016, 9, 170–178. [Google Scholar]
  19. Alvand, M.; Shemirani, F. Preconcentration of trace cadmium ion using magnetic graphene nanoparticles as an efficient adsorbent. Microchim. Acta 2014, 181, 181–188. [Google Scholar] [CrossRef]
  20. Moeinpour, F.; Kamyab, S.; Akhgar, M.R. NiFe2O4 magnetic nanoparticles as an adsorbent for cadmium removal from aqueous solution. J. Water Chem. Technol. 2017, 39, 281–288. [Google Scholar] [CrossRef]
  21. Bao, X.; Qiang, Z.; Chang, J.H.; Ben, W.; Qu, J. Synthesis of carbon-coated magnetic nanocomposite (Fe3O4@C) and its application for sulfonamide antibiotics removal from water. J. Environ. Sci. 2014, 26, 962–969. [Google Scholar] [CrossRef]
  22. Yarazavi, M.; Noroozian, E. A novel sorbent based on carbon nanotube/amino-functionalized sol-gel for the headspace solid-phase microextraction of α-bisabolol from medicinal plant samples using experimental design. J. Sep. Sci. 2018, 41, 2229–2236. [Google Scholar] [CrossRef] [PubMed]
  23. Guvenc, S.Y.; Okut, Y.; Ozak, M.; Haktanir, B.; Bilgili, M.S. Process optimization via response surface methodology in the treatment of metal working industry wastewater with electrocoagulation. Water Sci. Technol. 2017, 75, 833–846. [Google Scholar] [CrossRef] [PubMed]
  24. Nair, A.T.; Makwana, A.R.; Ahammed, M.M. The use of response surface methodology for modelling and analysis of water and wastewater treatment processes: A review. Water Sci. Technol. 2014, 69, 464–478. [Google Scholar] [CrossRef] [PubMed]
  25. Akkaya, G.K.; Erkan, H.S.; Sekman, E.; Top, S.; Karaman, H.; Bilgili, M.S.; Engin, G.O. Modeling and optimizing Fenton and electro-Fenton processes for dairy wastewater treatment using response surface methodology. Int. J. Environ. Sci. Technol. 2019, 16, 2343–2358. [Google Scholar] [CrossRef]
  26. Zhou, R.; Zhang, M.; Zhou, J.; Wang, J. Optimization of biochar preparation from the stem of eichhornia crassipes using response surface methodology on adsorption of Cd2+. Sci. Rep. 2019, 9, 17538. [Google Scholar] [CrossRef]
  27. Kakoi, B.; Kaluli, J.W.; Ndiba, P.; Thiongo, G. Optimization of maerua decumbent bio-coagulant in paint industry wastewater treatment with response surface methodology. J. Clean. Prod. 2017, 164, 1124–1134. [Google Scholar] [CrossRef]
  28. Cao, R.; Fan, M.; Hu, J.; Ruan, W.; Xiong, K.; Wei, X. Optimizing low-concentration mercury removal from aqueous solutions by reduced graphene oxide-supported Fe3O4 composites with the aid of an artificial neural network and genetic algorithm. Materials 2017, 10, 1279. [Google Scholar] [CrossRef] [PubMed] [Green Version]
  29. Gul, K.; Yousuf, B.; Singh, A.K.; Singh, P.; Wani, A.A. Rice bran: Nutritional values and its emerging potential for development of functional food-a review. Bioact. Carbohydr. Dietary Fibre. 2015, 6, 24–30. [Google Scholar] [CrossRef]
  30. Maity, D.; Agrawal, D.C. Synthesis of iron oxide nanoparticles under oxidizing environment and their stabilization in aqueous and non-aqueous media. J. Magn. Magn. Mater. 2007, 308, 46–55. [Google Scholar] [CrossRef]
  31. Chowdhury, S.; Mishra, R.; Saha, P.; Kushwaha, P. Adsorption thermodynamics, kinetics and isosteric heat of adsorption of malachite green onto chemically modified rice husk. Desalination 2011, 265, 159–168. [Google Scholar] [CrossRef]
  32. Shojaei, S.; Ardakani, M.A.H.; Sodaiezadeh, H.; Jafari, M.; Afzali, S.F. Simultaneous optimization of parameters influencing organic mulch test using response surface methodology. Sci. Rep. 2020, 10, 6717. [Google Scholar] [CrossRef] [PubMed] [Green Version]
  33. Patel, M.; Naik, N. Gamma-oryzanol from rice bran oil-a review. J. Sci. Ind. Res. 2004, 63, 569–578. [Google Scholar]
  34. Sahu, J.N.; Acharya, J.; Meikap, B.C. Optimization of production conditions for activated carbons from Tamarind wood by zinc chloride using response surface methodology. Bioresour. Technol. 2010, 101, 1974–1982. [Google Scholar] [CrossRef] [PubMed]
  35. Yuan, T.Q.; He, J.; Xu, F.; Sun, R.C. Fractionation and physico-chemical analysis of degraded lignins from the black liquor of eucalyptus pellita KP-AQ pulping. Polym. Degrad. Stabil. 2009, 94, 1142–1150. [Google Scholar] [CrossRef]
  36. Wang, X.; Jiang, C.; Hou, B.; Wang, Y.; Hao, C.; Wu, J. Carbon composite lignin-based adsorbents for the adsorption of dyes. Chemosphere 2018, 206, 587–596. [Google Scholar] [CrossRef]
  37. Bhattacharjee, A.; Ahmaruzzaman, M.; Sinha, T. A novel approach for the synthesis of SnO2 nanoparticles and its application as a catalyst in the reduction and photodegradation of organic compounds. Spectrochim. Acta A 2015, 136, 751–760. [Google Scholar] [CrossRef]
  38. Kumar, P.S.; Kumar, P.S.; Ramalingam, S.; Senthamarai, C.; Niranjanaa, M.; Vijayalakshmi, P.; Sivanesan, S. Adsorption of dye from aqueous solution by cashew nut shell: Studies on equilibrium isotherm, kinetics and thermodynamics of interactions. Desalination 2010, 261, 52–60. [Google Scholar] [CrossRef]
  39. Rashid, A.; Bhatti, H.N.; Iqbal, M.; Noreen, S. Fungal biomass composite with bentonite efficiency for nickel and zinc adsorption: A mechanistic study. Ecol. Eng. 2016, 91, 459–471. [Google Scholar] [CrossRef]
  40. Cinar, S.; Kaynar, U.H.; Aydemir, T.; Kaynar, S.C.; Ayvacikli, M. An efficient removal of RB5 from aqueous solution by adsorption onto nano-ZnO/chitosan composite beads. Int. J. Biol. Macromol. 2017, 96, 459–465. [Google Scholar] [CrossRef]
  41. Hamzeh, Y.; Ashori, A.; Azadeh, E.; Abdulkhani, A. Removal of acid orange 7 and remazol black 5 reactive dyes from aqueous solutions using a novel biosorbent. Mater. Sci. Eng. 2012, C32, 1394–1400. [Google Scholar] [CrossRef] [PubMed]
  42. Chowdhury, S.; Saha, P. Sea shell powder as a new adsorbent to remove basic green 4 (malachite green) from aqueous solutions: Equilibrium, kinetic and thermodynamic studies. Chem. Eng. J. 2010, 164, 168–177. [Google Scholar] [CrossRef]
  43. Nadeem, R.; Manzoor, Q.; Iqbal, M.; Nisar, J. Biosorption of Pb (II) onto immobilized and native mangifera indica waste biomass. J. Ind. Eng. Chem. 2016, 35, 184–195. [Google Scholar] [CrossRef]
  44. Trivedi, H.C.; Patel, V.M.; Patel, R.D. Adsorption of cellulose triacetate on calcium silicate. Eur. Polym. J. 1973, 9, 525–531. [Google Scholar] [CrossRef]
  45. Ho, Y.S.; Mckay, G. Pseudo-second order model for sorption processes. Process. Biochem. 1999, 34, 451–465. [Google Scholar] [CrossRef]
  46. Weber, W.J., Jr.; Morris, J.C. Kinetics of adsorption on carbon from solution. J. Sanit. Eng. Div. Proceed. Am. Soc. Civil. Eng. 1963, 89, 31–59. [Google Scholar]
  47. Langmuir, I. The adsorption of gases on plane surfaces of glass, mica and platinum. J. Am. Chem. Soc. 1918, 40, 1361–1403. [Google Scholar] [CrossRef] [Green Version]
  48. Ong, S.T.; Lee, C.K.; Zainal, Z. Removal of basic and reactive dyes using ethylenediamine modified rice hull. Bioresour. Technol. 2007, 98, 2792–2799. [Google Scholar] [CrossRef]
  49. Parab, H.; Sudersanan, M.; Shenoy, N.; Pathare, T.; Vaze, B. Use of agroindustrial wastes for removal of basic dyes from aqueous solutions. Clean (Weinh) 2009, 37, 963–969. [Google Scholar]
  50. Pavan, F.A.; Camacho, E.S.; Lima, E.C.; Dotto, G.L.; Branco, V.T.A.; Dias, S.L.P. Formosa papaya seed powder (FPSP): Preparation, characterization and application as an alternative adsorbent for the removal of crystal violet from aqueous phase. J. Environ. Chem. Eng. 2014, 2, 230–238. [Google Scholar] [CrossRef]
  51. Madrakian, T.; Afkhami, A.; Ahmadi, M. Adsorption and kinetic studies of seven different organic dyes onto magnetite nanoparticles loaded tea waste and removal of them from wastewater samples. Spectrochim. Acta A 2012, 99, 102–109. [Google Scholar] [CrossRef] [PubMed]
  52. Ibrahim, S.; Shuy, W.Z.; Ang, H.M.; Wang, S. Preparation of bioadsorbents foreffective adsorption of a reactive dye in aqueous solution. Asia Pac. J. Chem. Eng. 2010, 5, 563–569. [Google Scholar] [CrossRef]
  53. Aguayo-Villarreal, I.A.; Ramirez-Montoya, L.A.; Bonilla-Petriciolet, A.; Hernandez-Montoya, V.; Montes-Moran, M.A.; Ramirez-Lopez, E.M. Sorption mechanism of anionic dyes on pecannut shells (Carya illinoinensis) using batch and continuous systems. Ind. Crops. Prod. 2013, 48, 89–97. [Google Scholar] [CrossRef]
  54. Tanyildizi, M.S. Modeling of adsorption isotherms and kinetics of reactive dye from aqueous solution by peanut hull. Chem. Eng. J. 2011, 168, 1234–1240. [Google Scholar] [CrossRef]
  55. Fakhri, A. Application of response surface methodology to optimize the process variables for fluoride ion removal using maghemite nanoparticles. J. Saudi Chem. Soc. 2014, 18, 340–347. [Google Scholar] [CrossRef]
  56. Mourabet, M.; Rhilassi, A.E.; Boujaady, H.E.; Bennani-Ziatni, M.; Hamri, R.E.; Taitai, A. Removal of fluoride from aqueous solution by adsorption on hydroxyapatite (HAp) using response surface methodology. J. Saudi Chem. Soc. 2015, 19, 603–615. [Google Scholar] [CrossRef] [Green Version]
  57. Zhao, B.; Xiao, W.; Shang, Y.; Zhu, H.; Han, R. Adsorption of light green anionic dye using cationic surfactant-modified peanut husk in batch mode. Arab. J. Chem. 2017, 10, 3595–3602. [Google Scholar] [CrossRef]
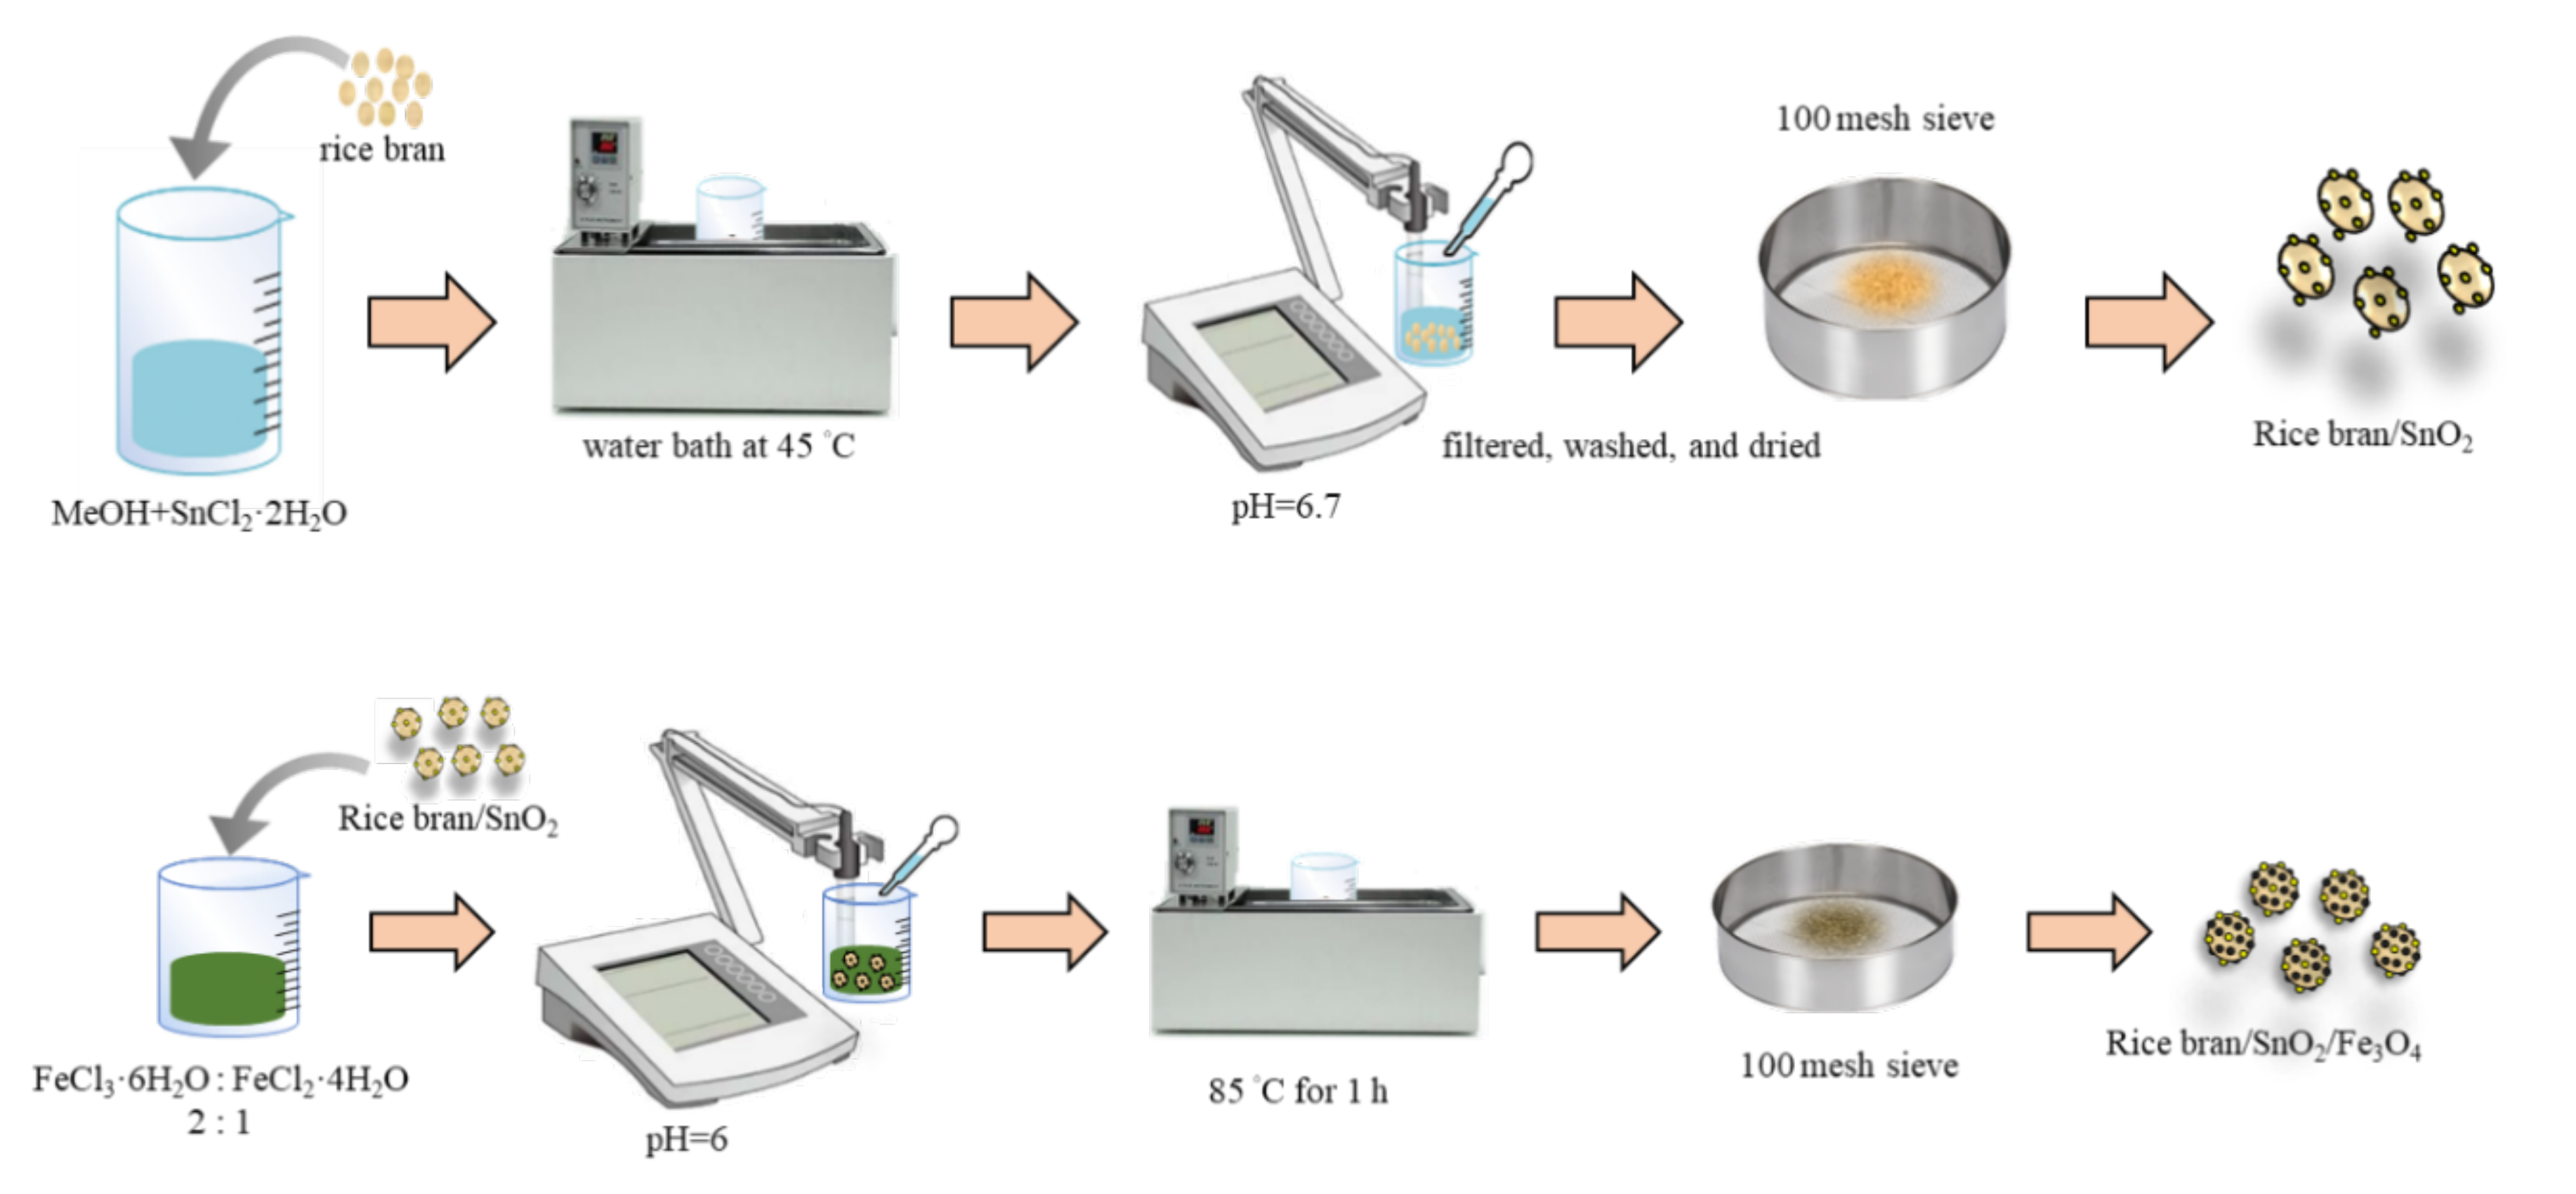
Figure 1. Preparation schematic diagram of rice bran/SnO2/Fe3O4 composite.
Materials 13 02764 g001
Figure 2. Scanning electron microscopy (SEM) images of the adsorbents: (a) rice bran, (b) rice bran/SnO2, and (c) rice bran/SnO2/Fe3O4; and (d) energy-dispersive X-ray (EDX) spectrum of rice bran/SnO2/Fe3O4.
Materials 13 02764 g002aMaterials 13 02764 g002b
Figure 3. FTIR spectra of the rice bran, rice bran/SnO2, and rice bran/SnO2/Fe3O4.
Materials 13 02764 g003
Figure 4. Pore area distribution of different pore size ranges on the adsorbent: (a) rice bran, (b) rice bran/SnO2, and (c) rice bran/SnO2/Fe3O4.
Materials 13 02764 g004aMaterials 13 02764 g004b
Figure 5. (a) pH effect on dye removal in rice bran/SnO2/Fe3O4 and (b) the determination of pHpzc of rice bran/SnO2/Fe3O4.
Materials 13 02764 g005
Figure 6. Effect of adsorbent dosage on the removal of (a) RB4 and (b) crystal violet (CV).
Materials 13 02764 g006
Figure 7. (a) Effect of temperature on removing dyes; (b) effect of contact time on removing dyes.
Materials 13 02764 g007
Figure 8. Adsorption capacity at various temperature of dye adsorption onto rice bran/SnO2/Fe3O4 composite adsorbent: (a) RB4; (b) CV.
Materials 13 02764 g008
Figure 9. The 3D response surface plots of the removal rate of RB4 predicted by the response surface methodology (RSM) for (a) contact time and temperature, (b) contact time and pH, (c) pH and temperature.
Materials 13 02764 g009aMaterials 13 02764 g009b
Figure 10. Regeneration performance of rice bran/SnO2/Fe3O4.
Materials 13 02764 g010
Table 1. Central composite design matrix and reactive blue 4 (RB4) dye removal.
RunIndependent VariablesResponses (RB4 Removal) (%)Remark
A: Contact TimesB: TemperatureC: pHPredictedExperimental
1185 (0)60 (1.68)6 (0)40.9536.36axial point
2360 (1.68)45 (0)6 (0)36.7233.58axial point
381 (−1)54 (1)3.6 (−1)56.2456.33level point
4185 (0)30 (−1.68)6 (0)21.8723.66axial point
5290 (1)54 (1)3.6 (−1)77.4880.28level point
6185 (0)45 (0)10 (1.68)3.680.13axial point
7185 (0)45 (0)2 (−1.68)84.6185.41axial point
8185 (0)45 (0)6 (0)31.4130.21center point
9185 (0)45 (0)6 (0)31.4135.32center point
10290 (1)54 (1)8.4 (1)14.3817.7level point
11185 (0)45 (0)6 (0)31.4130.01center point
1281 (−1)36 (−1)8.4 (1)3.823.00level point
13290 (1)36 (−1)3.6 (−1)59.9658.82level point
1410 (−1.68)45 (0)6 (0)13.0013.33axial point
1581 (−1)54 (1)8.4 (1)9.0212.14level point
16185 (0)45 (0)6 (0)31.4132.79center point
1781 (−1)36 (−1)3.6 (−1)37.0835.75level point
18185 (0)45 (0)6 (0)31.4131.4center point
19290 (1)36 (−1)8.4 (1)10.8212.73level point
20185 (0)45 (0)6 (0)31.4129.21center point
Table 2. Brunauer–Emmett–Teller (BET) surface area of the adsorbents.
SampleBET Surface Area
(m2/g)
Average Pore Volume (cm3/g)
rice bran0.5880.0058
rice bran/SnO20.6990.0028
rice bran/SnO2/Fe3O40.7460.0028
Table 3. Kinetic parameters for the adsorption of dyes onto rice bran/SnO2/Fe3O4 at 50 °C.
DyeRB4CV
qexp (mg/g)123.58125.71
PFOM
k1 (1/min)0.008918.8
qe (mg/g)59.10.007
R20.8880.487
PSOM
k2 (g/mg·g)6.62 × 10−44.99 × 10−3
qe (mg/g)127.55126.58
R20.9990.999
IPDM (stage 1)
kid (g/mg·min0.5)17.4126.09
C0.29664.3046
R20.9990.909
IPDM (stage 2)
kid (g/mg·min0.5)4.741.92
C62.46106.96
R20.9760.972
Table 4. Isotherm parameters for dye adsorption onto rice bran/SnO2/Fe3O4.
DyeRB4CV
Temperature (°C)3040506030405060
Langmuir
qm (mg/g)200.40204.08217.39218.82138.31138.50159.24139.28
KL (L/g)0.0270.0370.0480.0540.1170.1030.5670.103
R20.9880.9920.9970.9970.9930.9920.9930.990
Freundlich
KF (mg/g) (L/mg)1/n53.4864.3774.1177.4371.7873.7977.8045.81
n4.745.345.575.675.785.815.653.52
R20.9740.9650.9980.9920.8590.9170.9710.968
Table 5. Comparison of dye adsorption onto different adsorbents.
AdsorbentDyeConcentration (mg/L)pHAdsorbent Dose (g/L)T
(K)
qm
(mg/g)
Reference
rice huskCV508130344.87[10]
SawdustCV100-430037.83[49]
papaya seedCV5081229885.99[50]
tea wasteCV20101298113.64[51]
rice bran/SnO2/Fe3O4CV20091.5323159.24This study
Barley strawRB41003229831.5[52]
Pecan shellsRB410006.5103035.0[53]
peanut hullRB450–3500.5133355.55[54]
rice branRB420021.532378.0This study
rice bran/Fe3O4RB420021.5303185.19Prior study [12]
rice bran/SnO2/Fe3O4RB420021.5333218.82This study
Table 6. Analysis of variance (ANOVA) for the empirical model.
SourceRB4 Removal (%)
SSDFMSF Valuep-Value
Model9677.1691075.2498.84<0.0001significant
A679.991679.9962.50<0.0001significant
B439.901439.9040.44<0.0001significant
C7927.3717927.37728.69<0.0001significant
AB1.3511.350.120.7317not significant
AC125.851125.8511.570.0068significant
BC97.51197.518.960.0135significant
A277.40177.407.110.0236significant
B27.831× 10−917.831× 10−97.198 × 10−101.0000not significant
C2293.301293.3026.960.0004significant
Residual108.791010.88
Lack of Fit83.40516.683.280.1089not significant
Note: R2 = 0.9889, Adj R2 = 0.9789, Pred R2 = 0.9311, and adequate precision = 34.747.