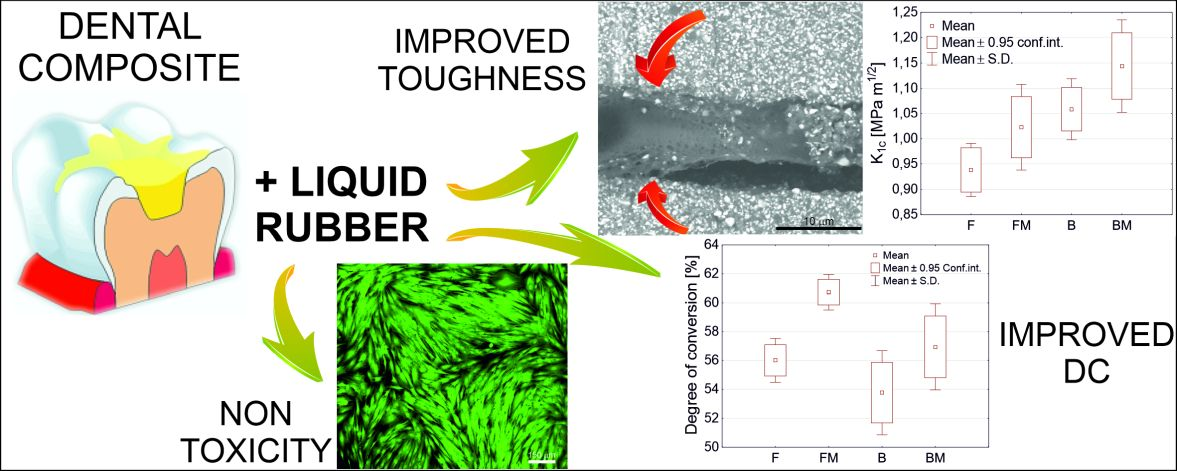
Improved Fracture Toughness and Conversion Degree of Resin-Based Dental Composites after Modification with Liquid Rubber

 , ,
, , 
Abstract

1. Introduction
2. Materials and Methods
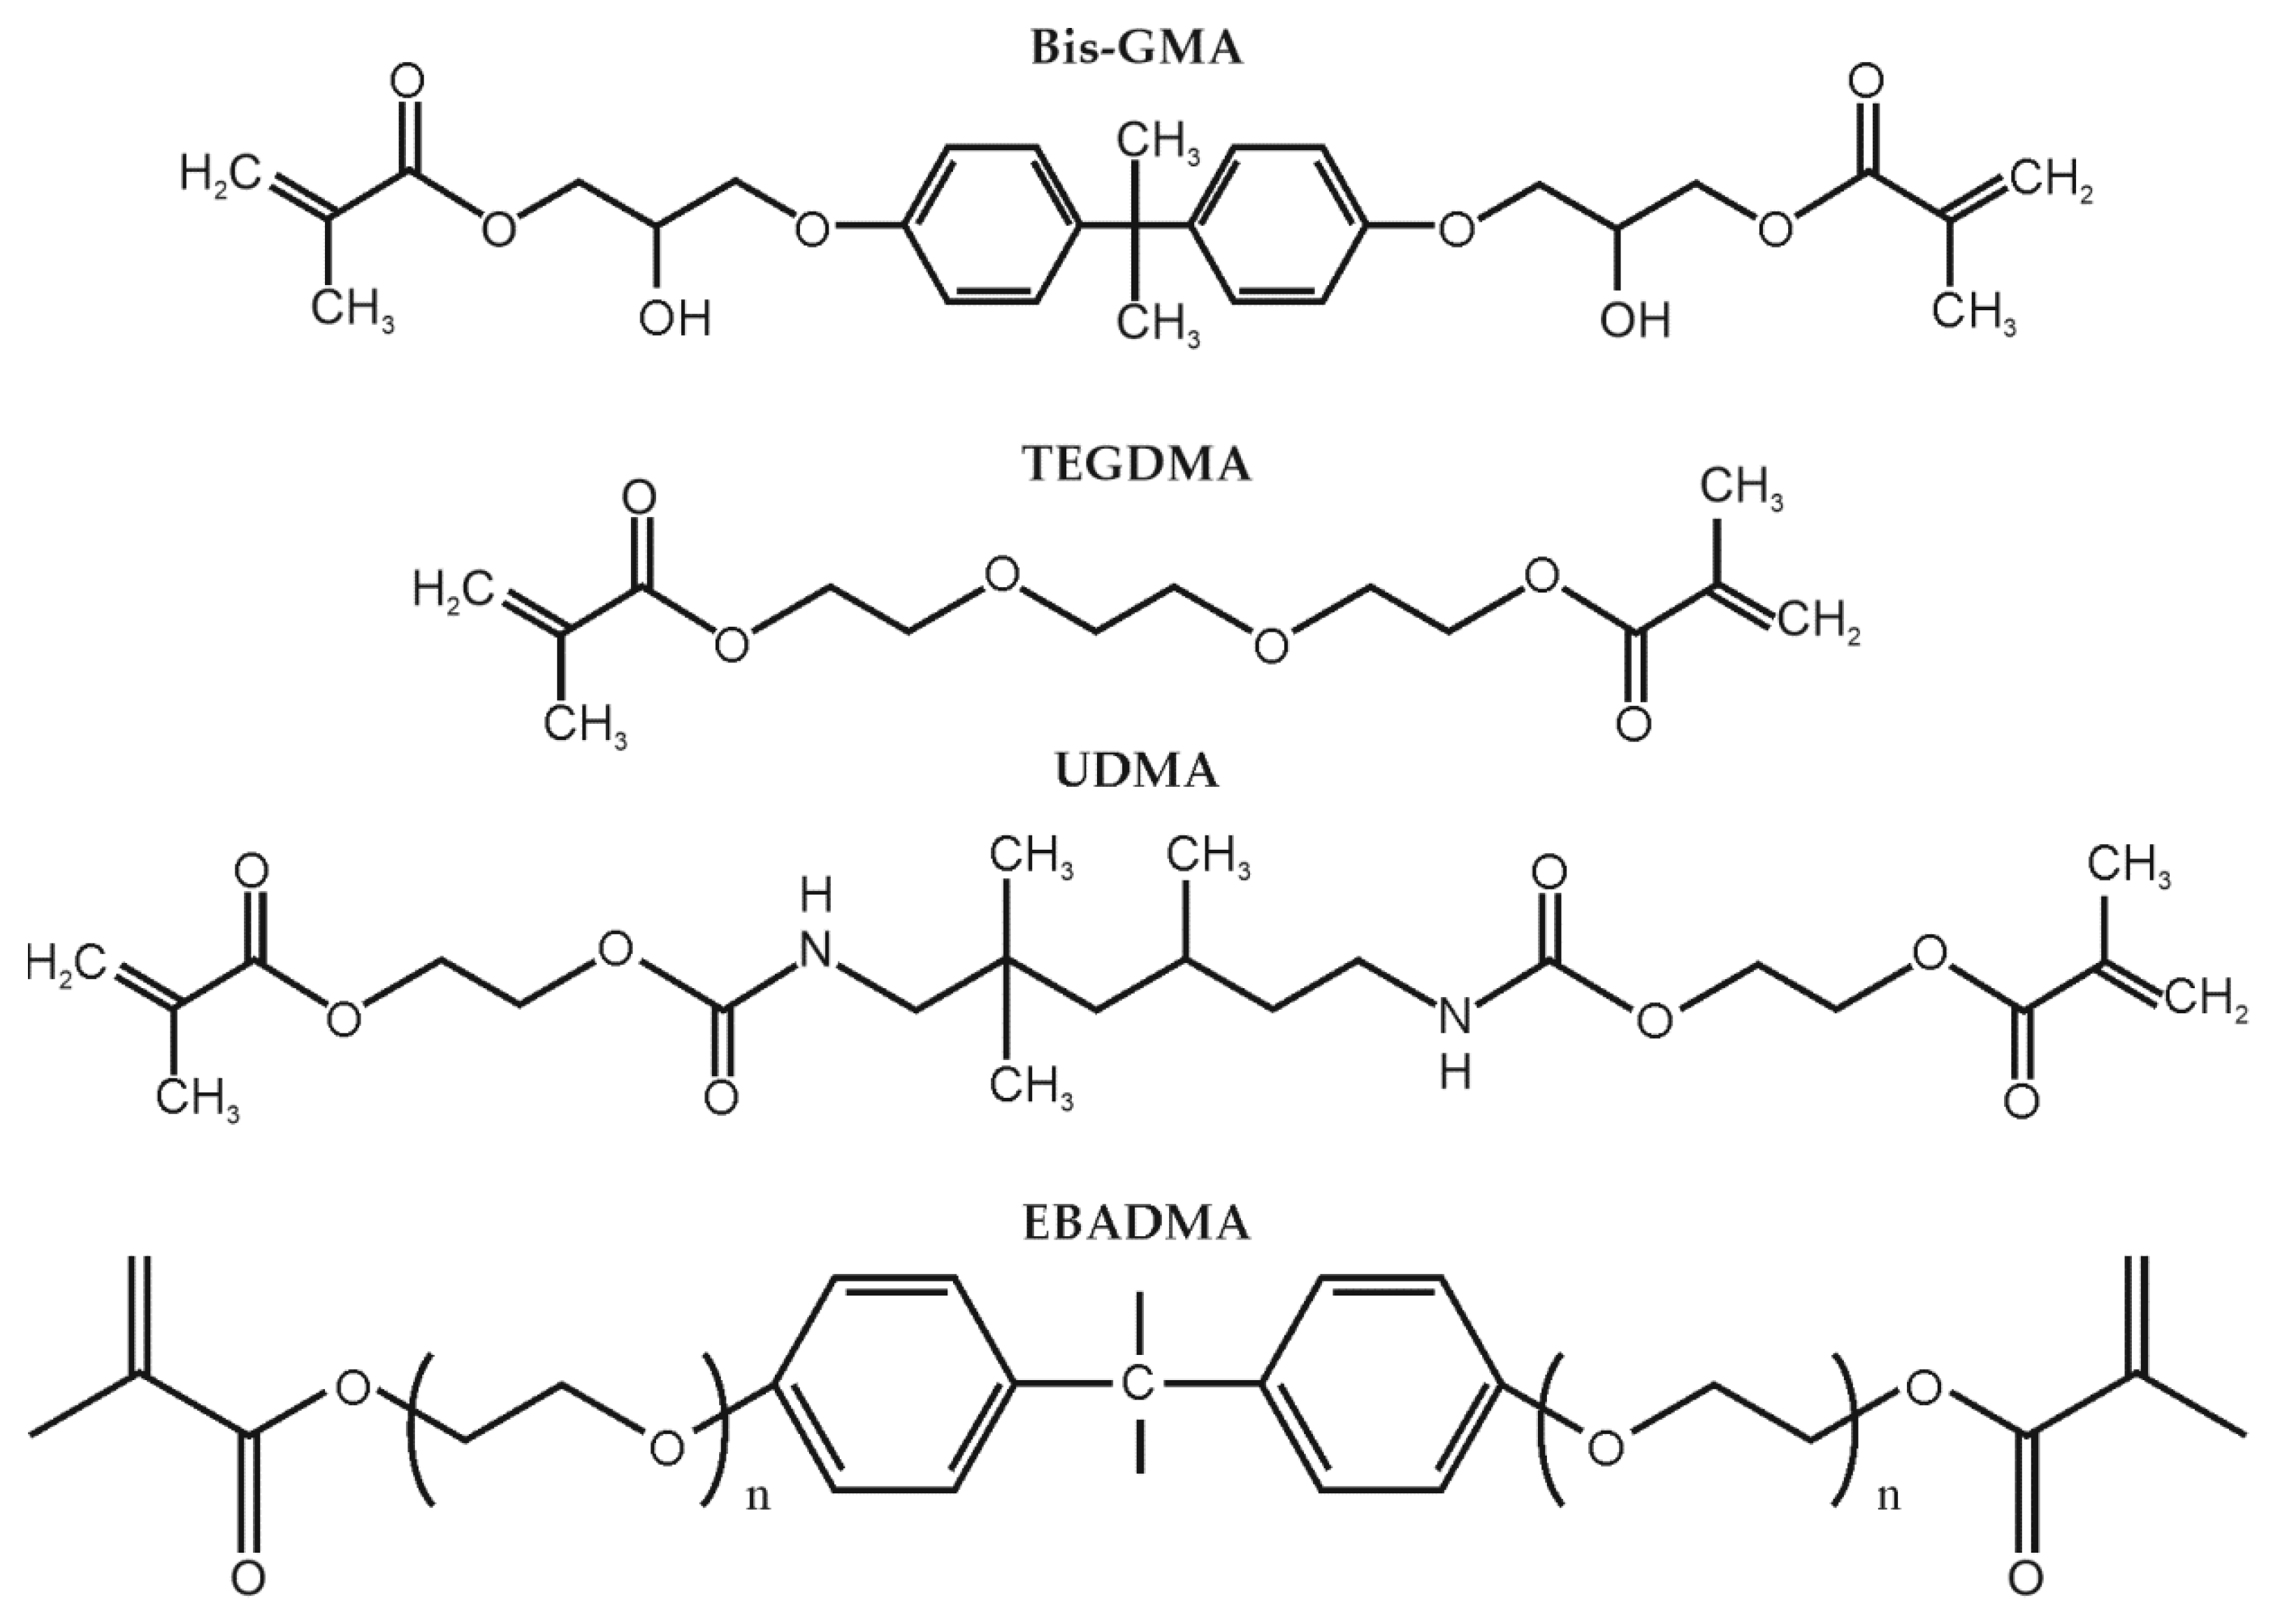
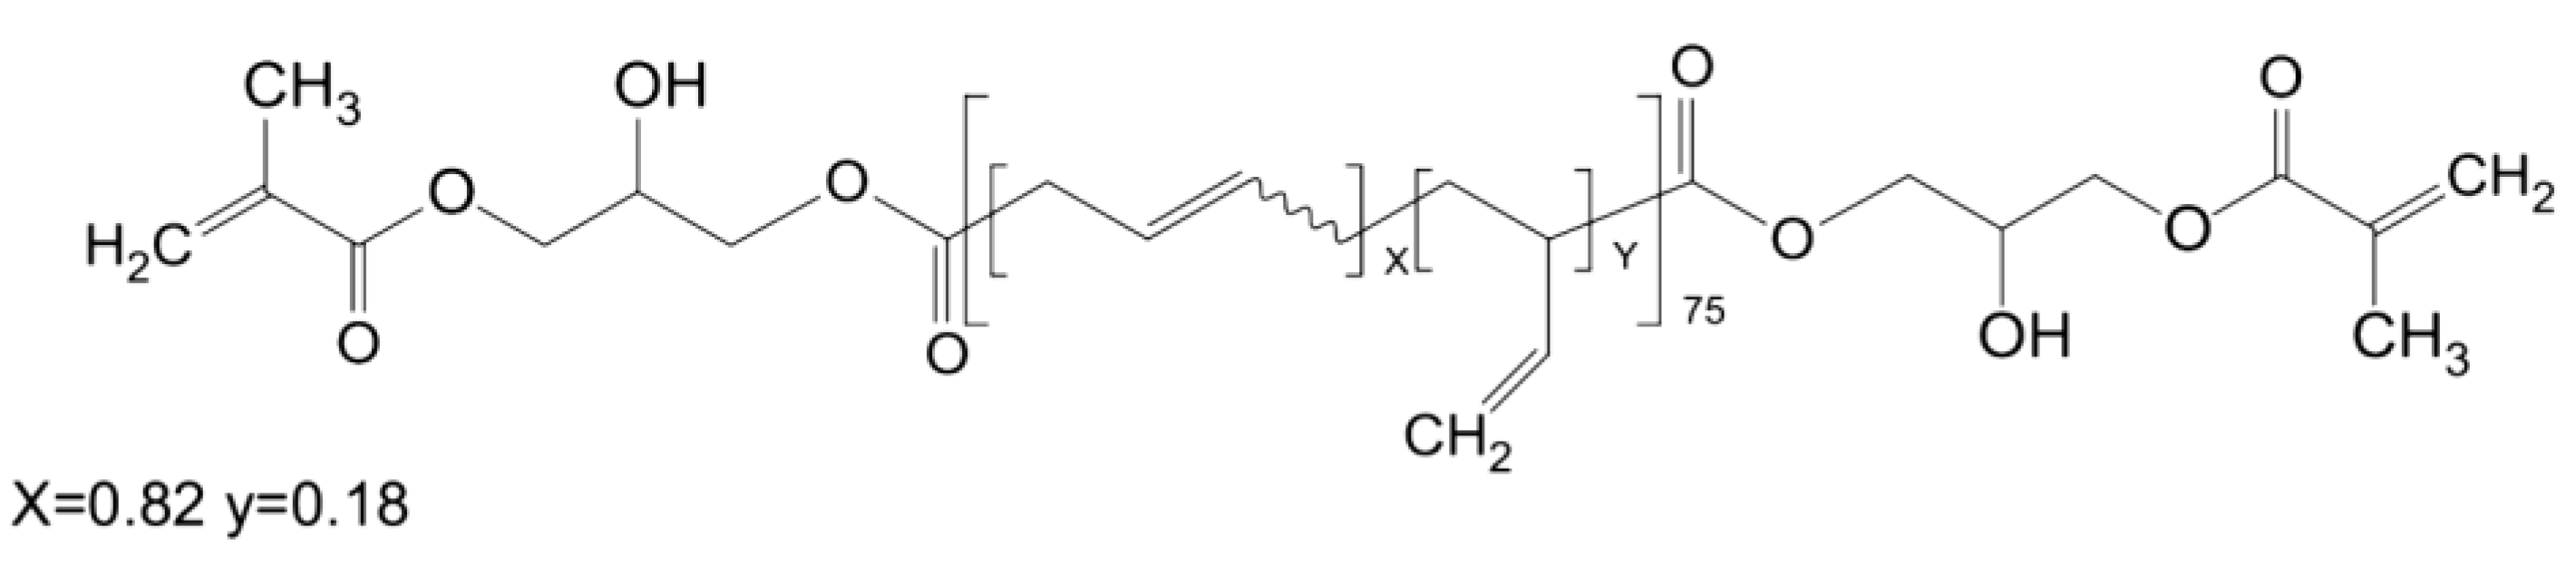
2.1. Fabrication of Dental Composites
2.2. Mechanical Properties
2.3. SEM Analysis
2.4. Degree of Conversion
2.5. Viscosity
2.6. Cytotoxicity Evaluation According to ISO 10993-5
2.7. Statistical Evaluation
3. Results
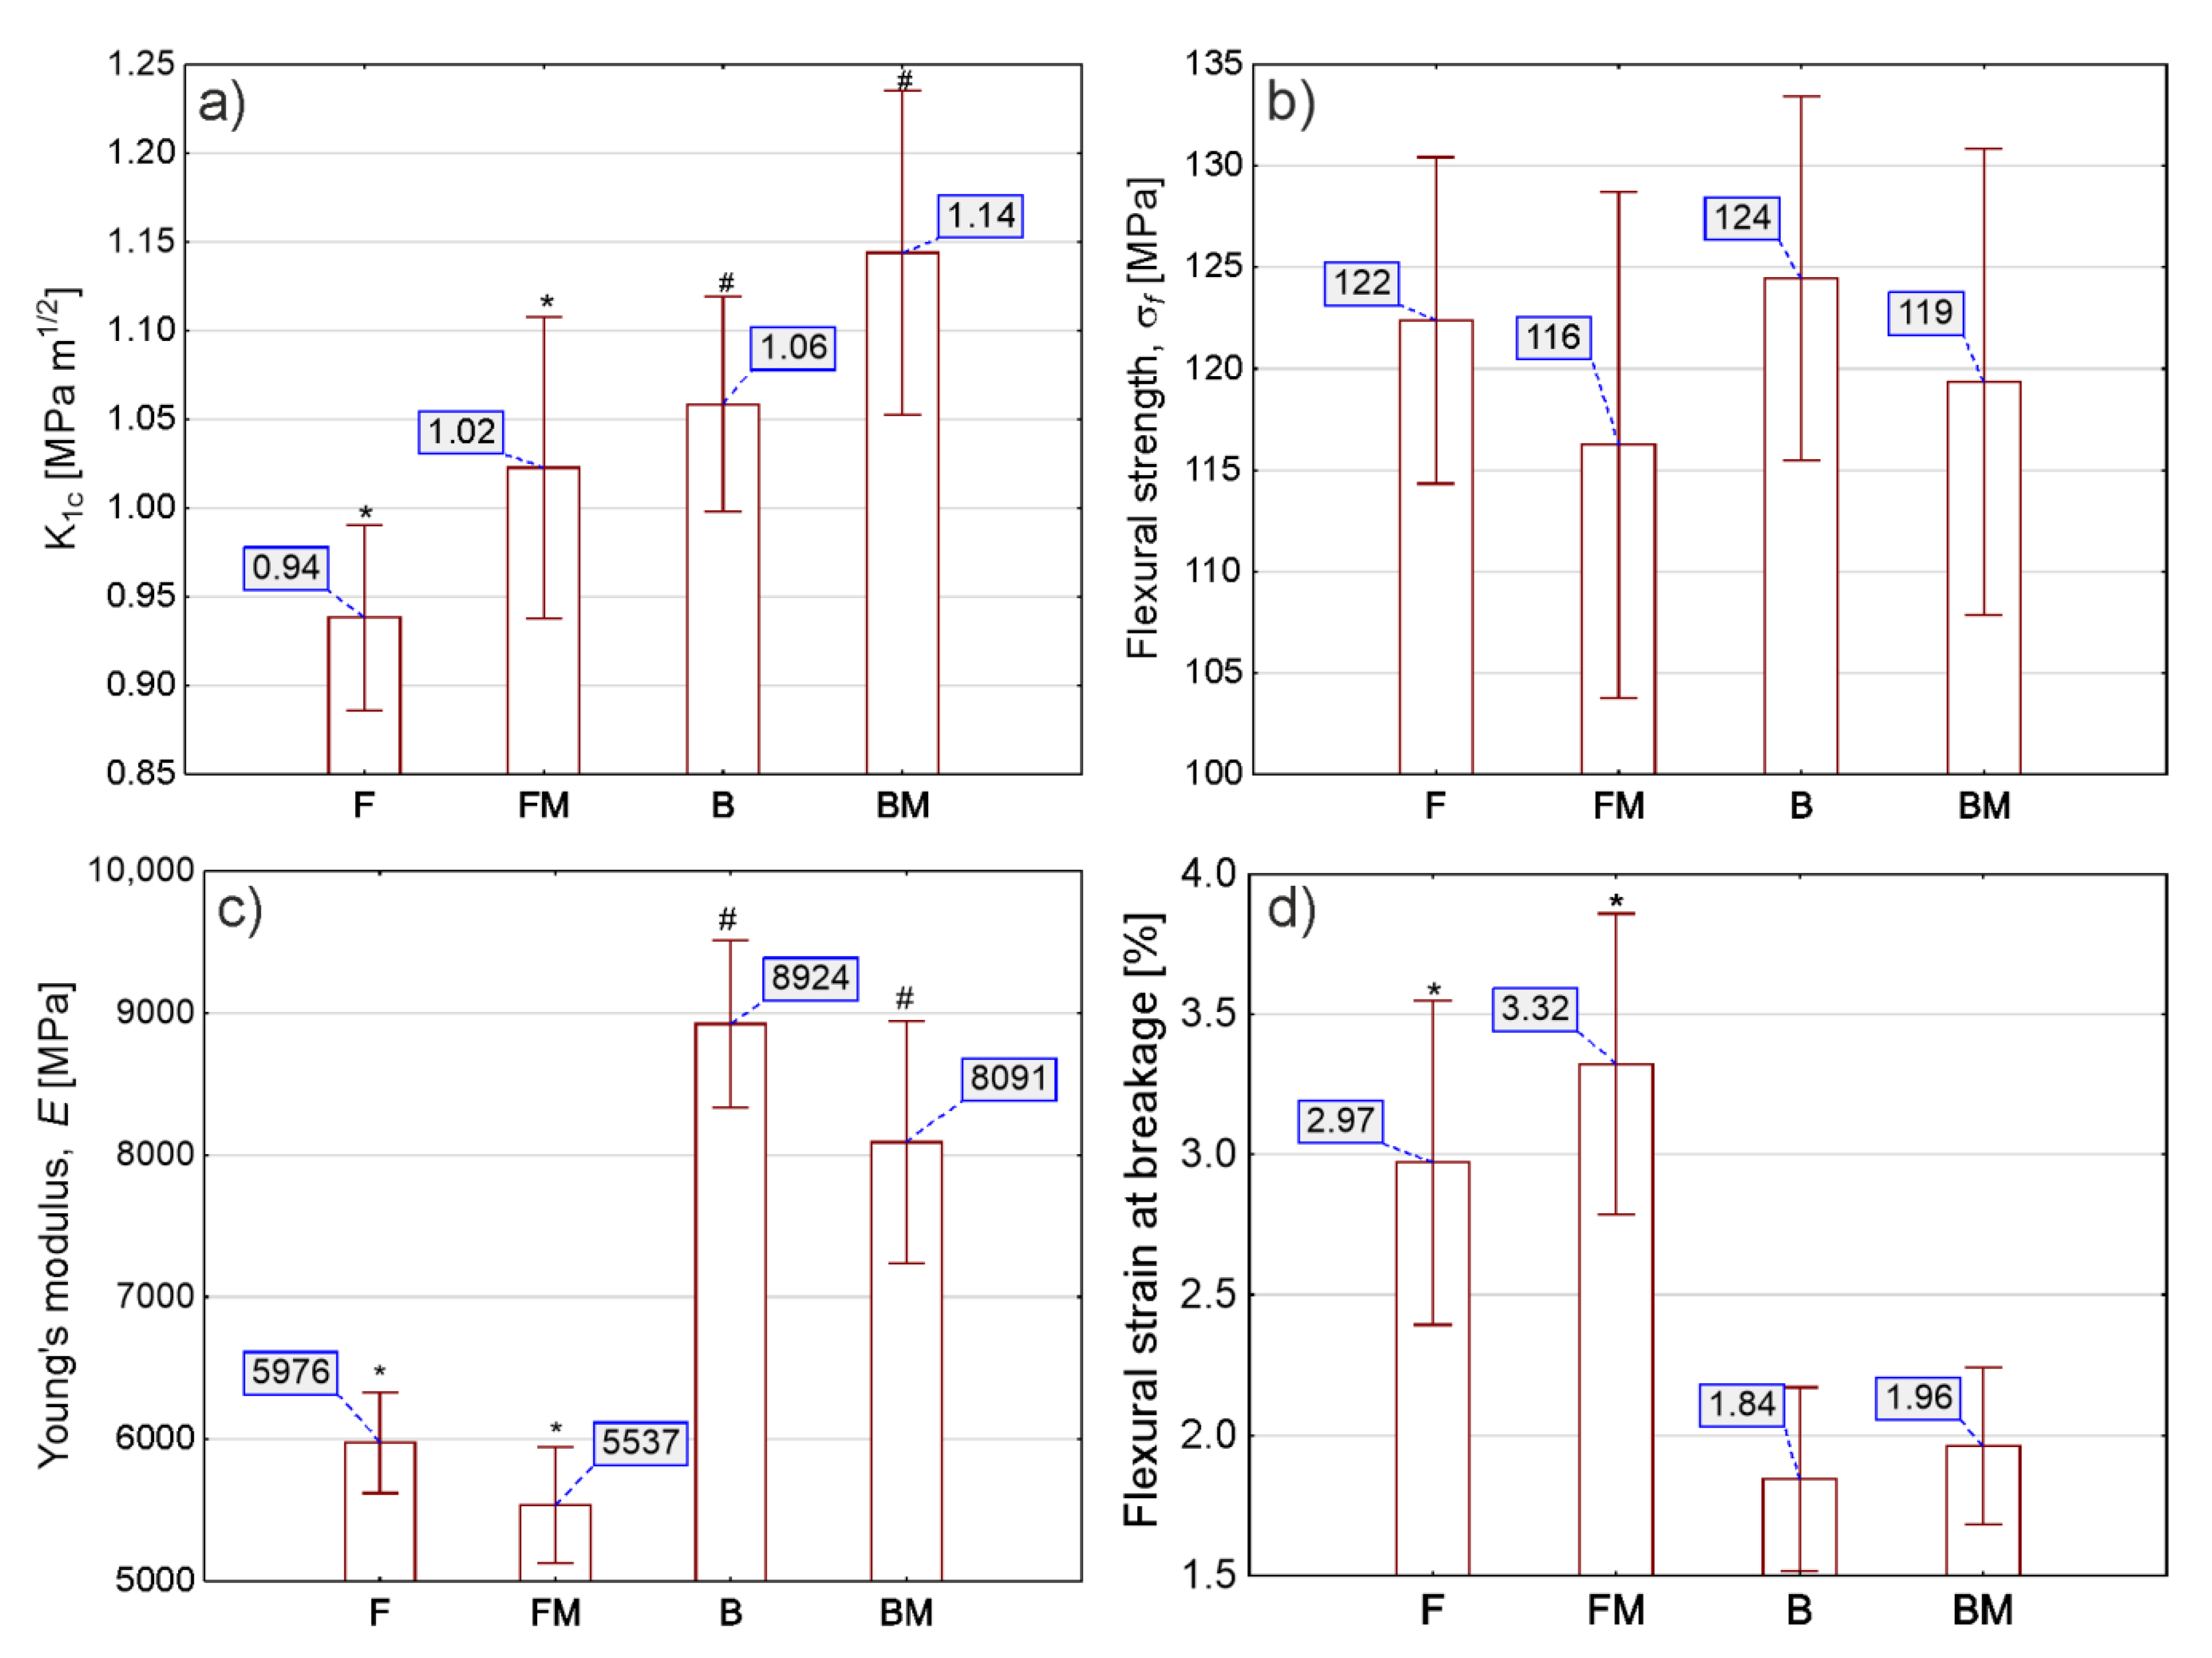
3.1. Mechanical Properties
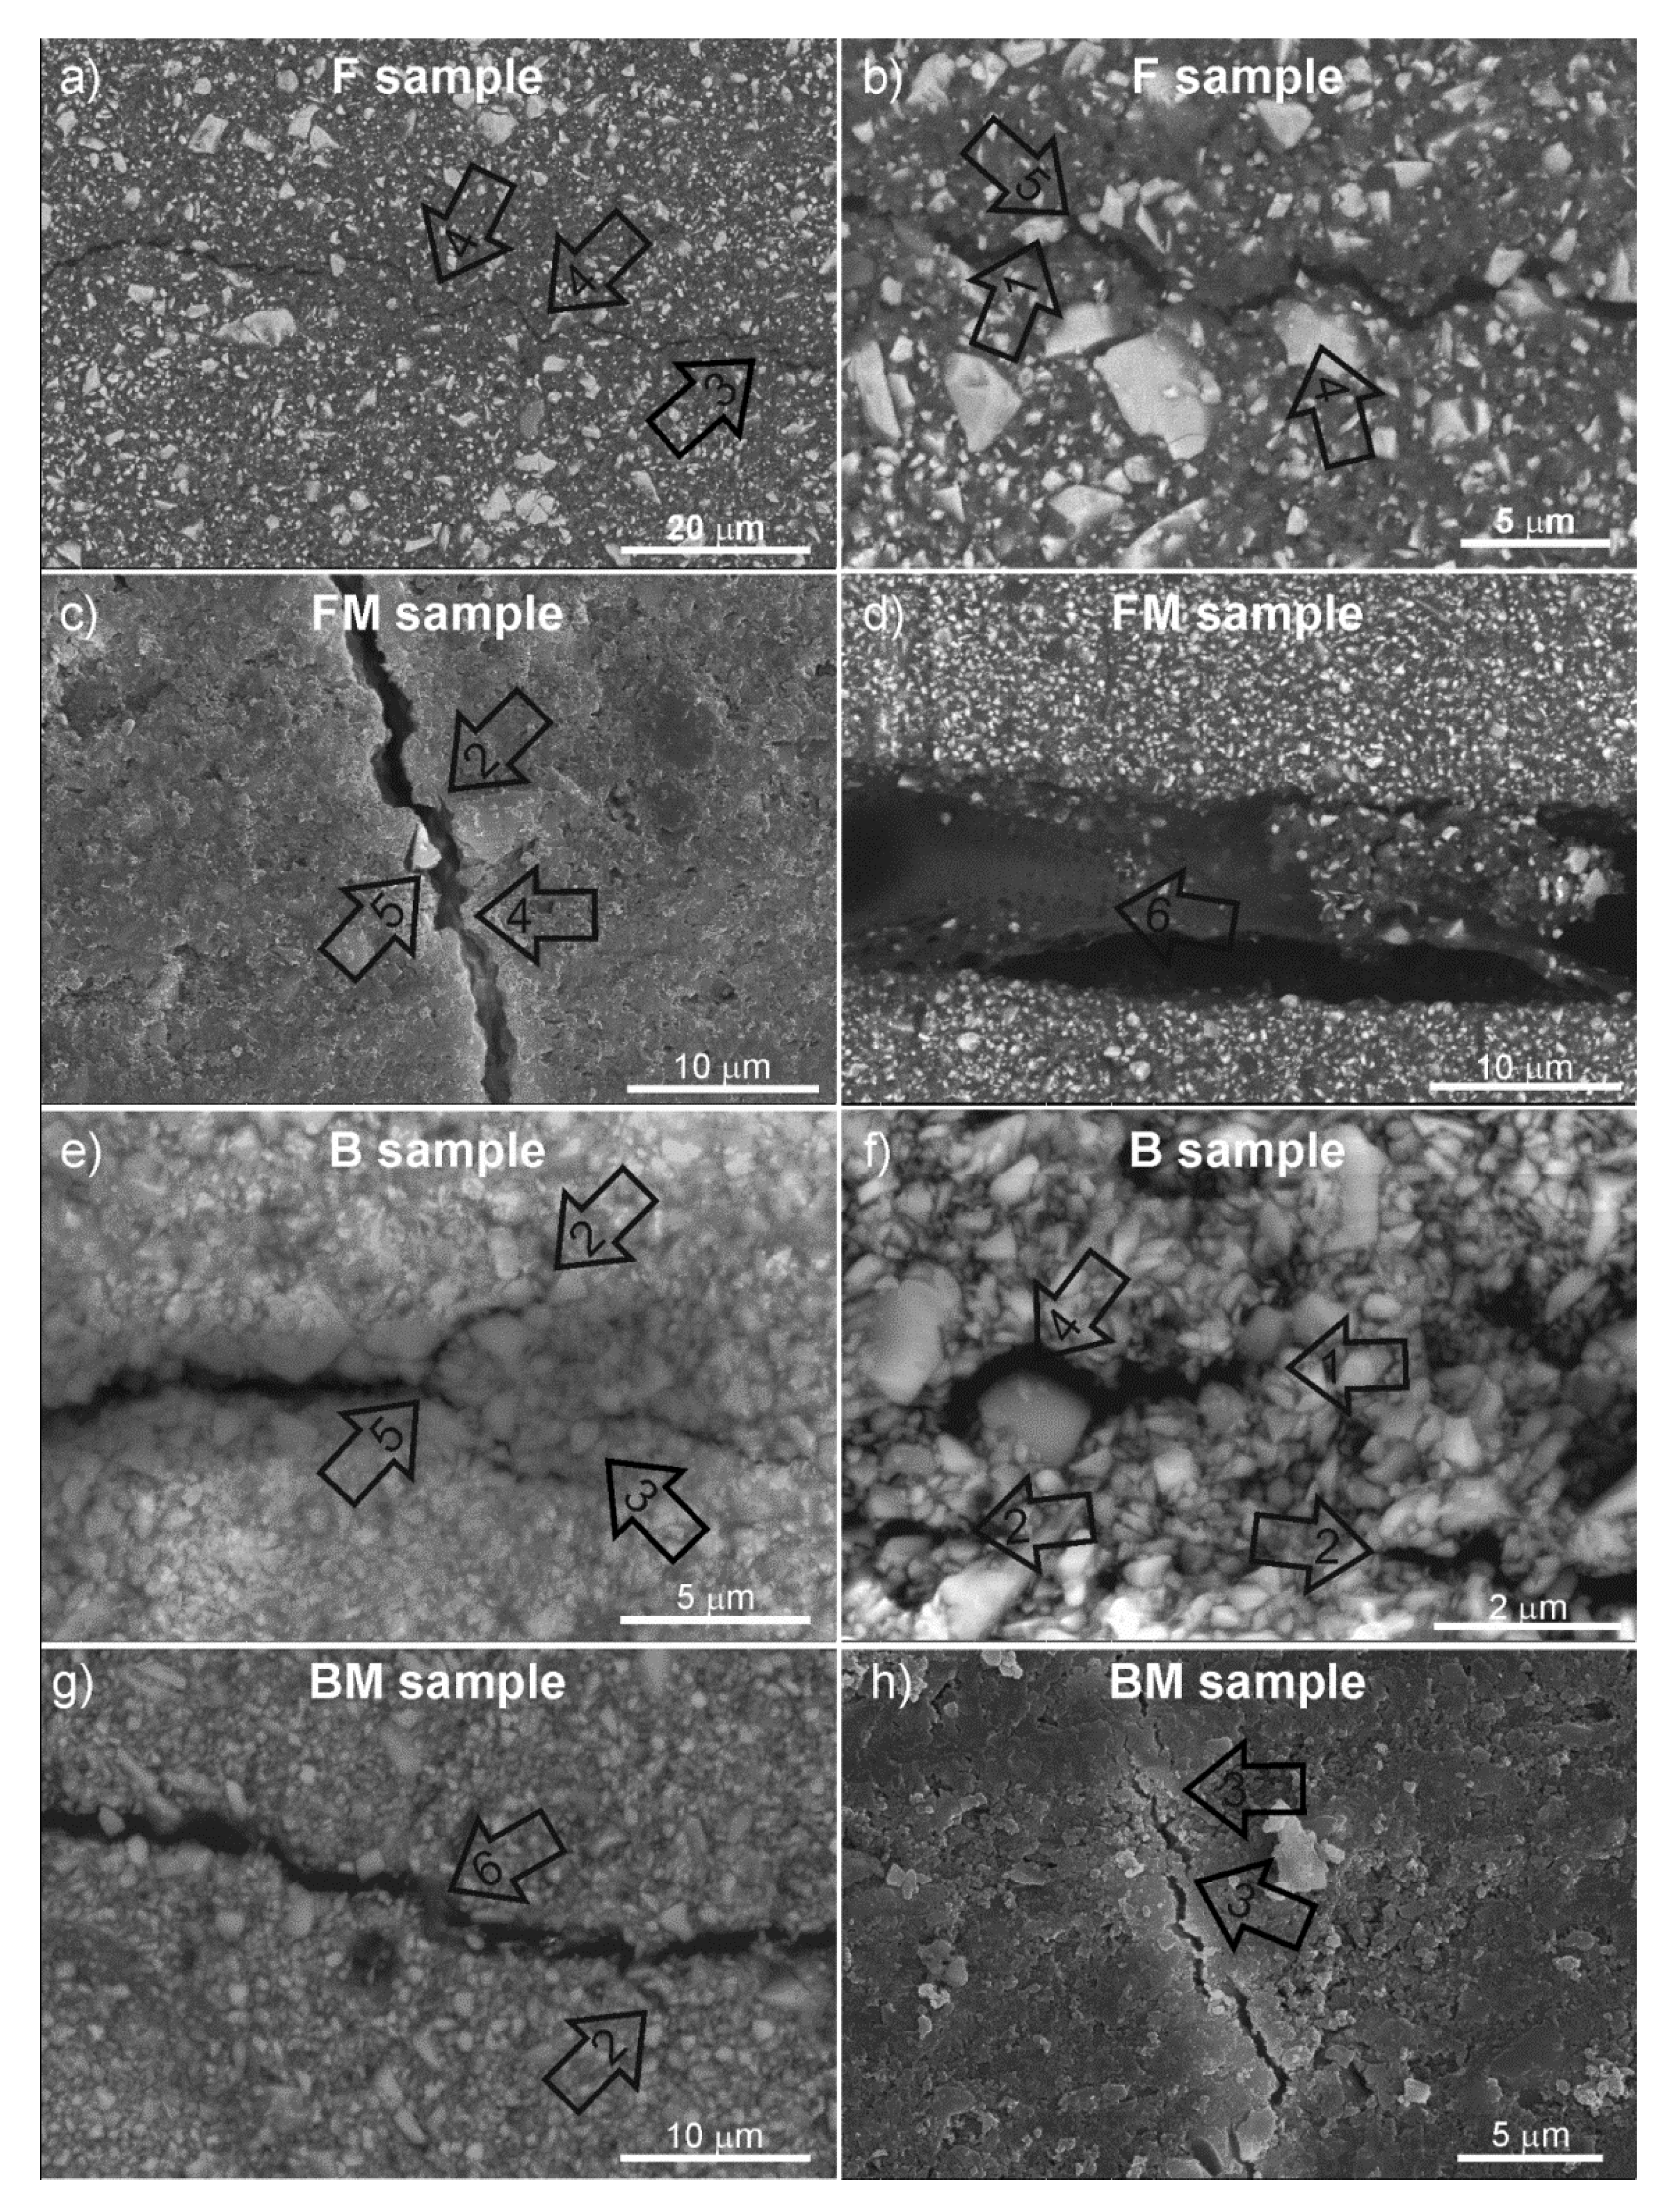
3.2. SEM Microscopy
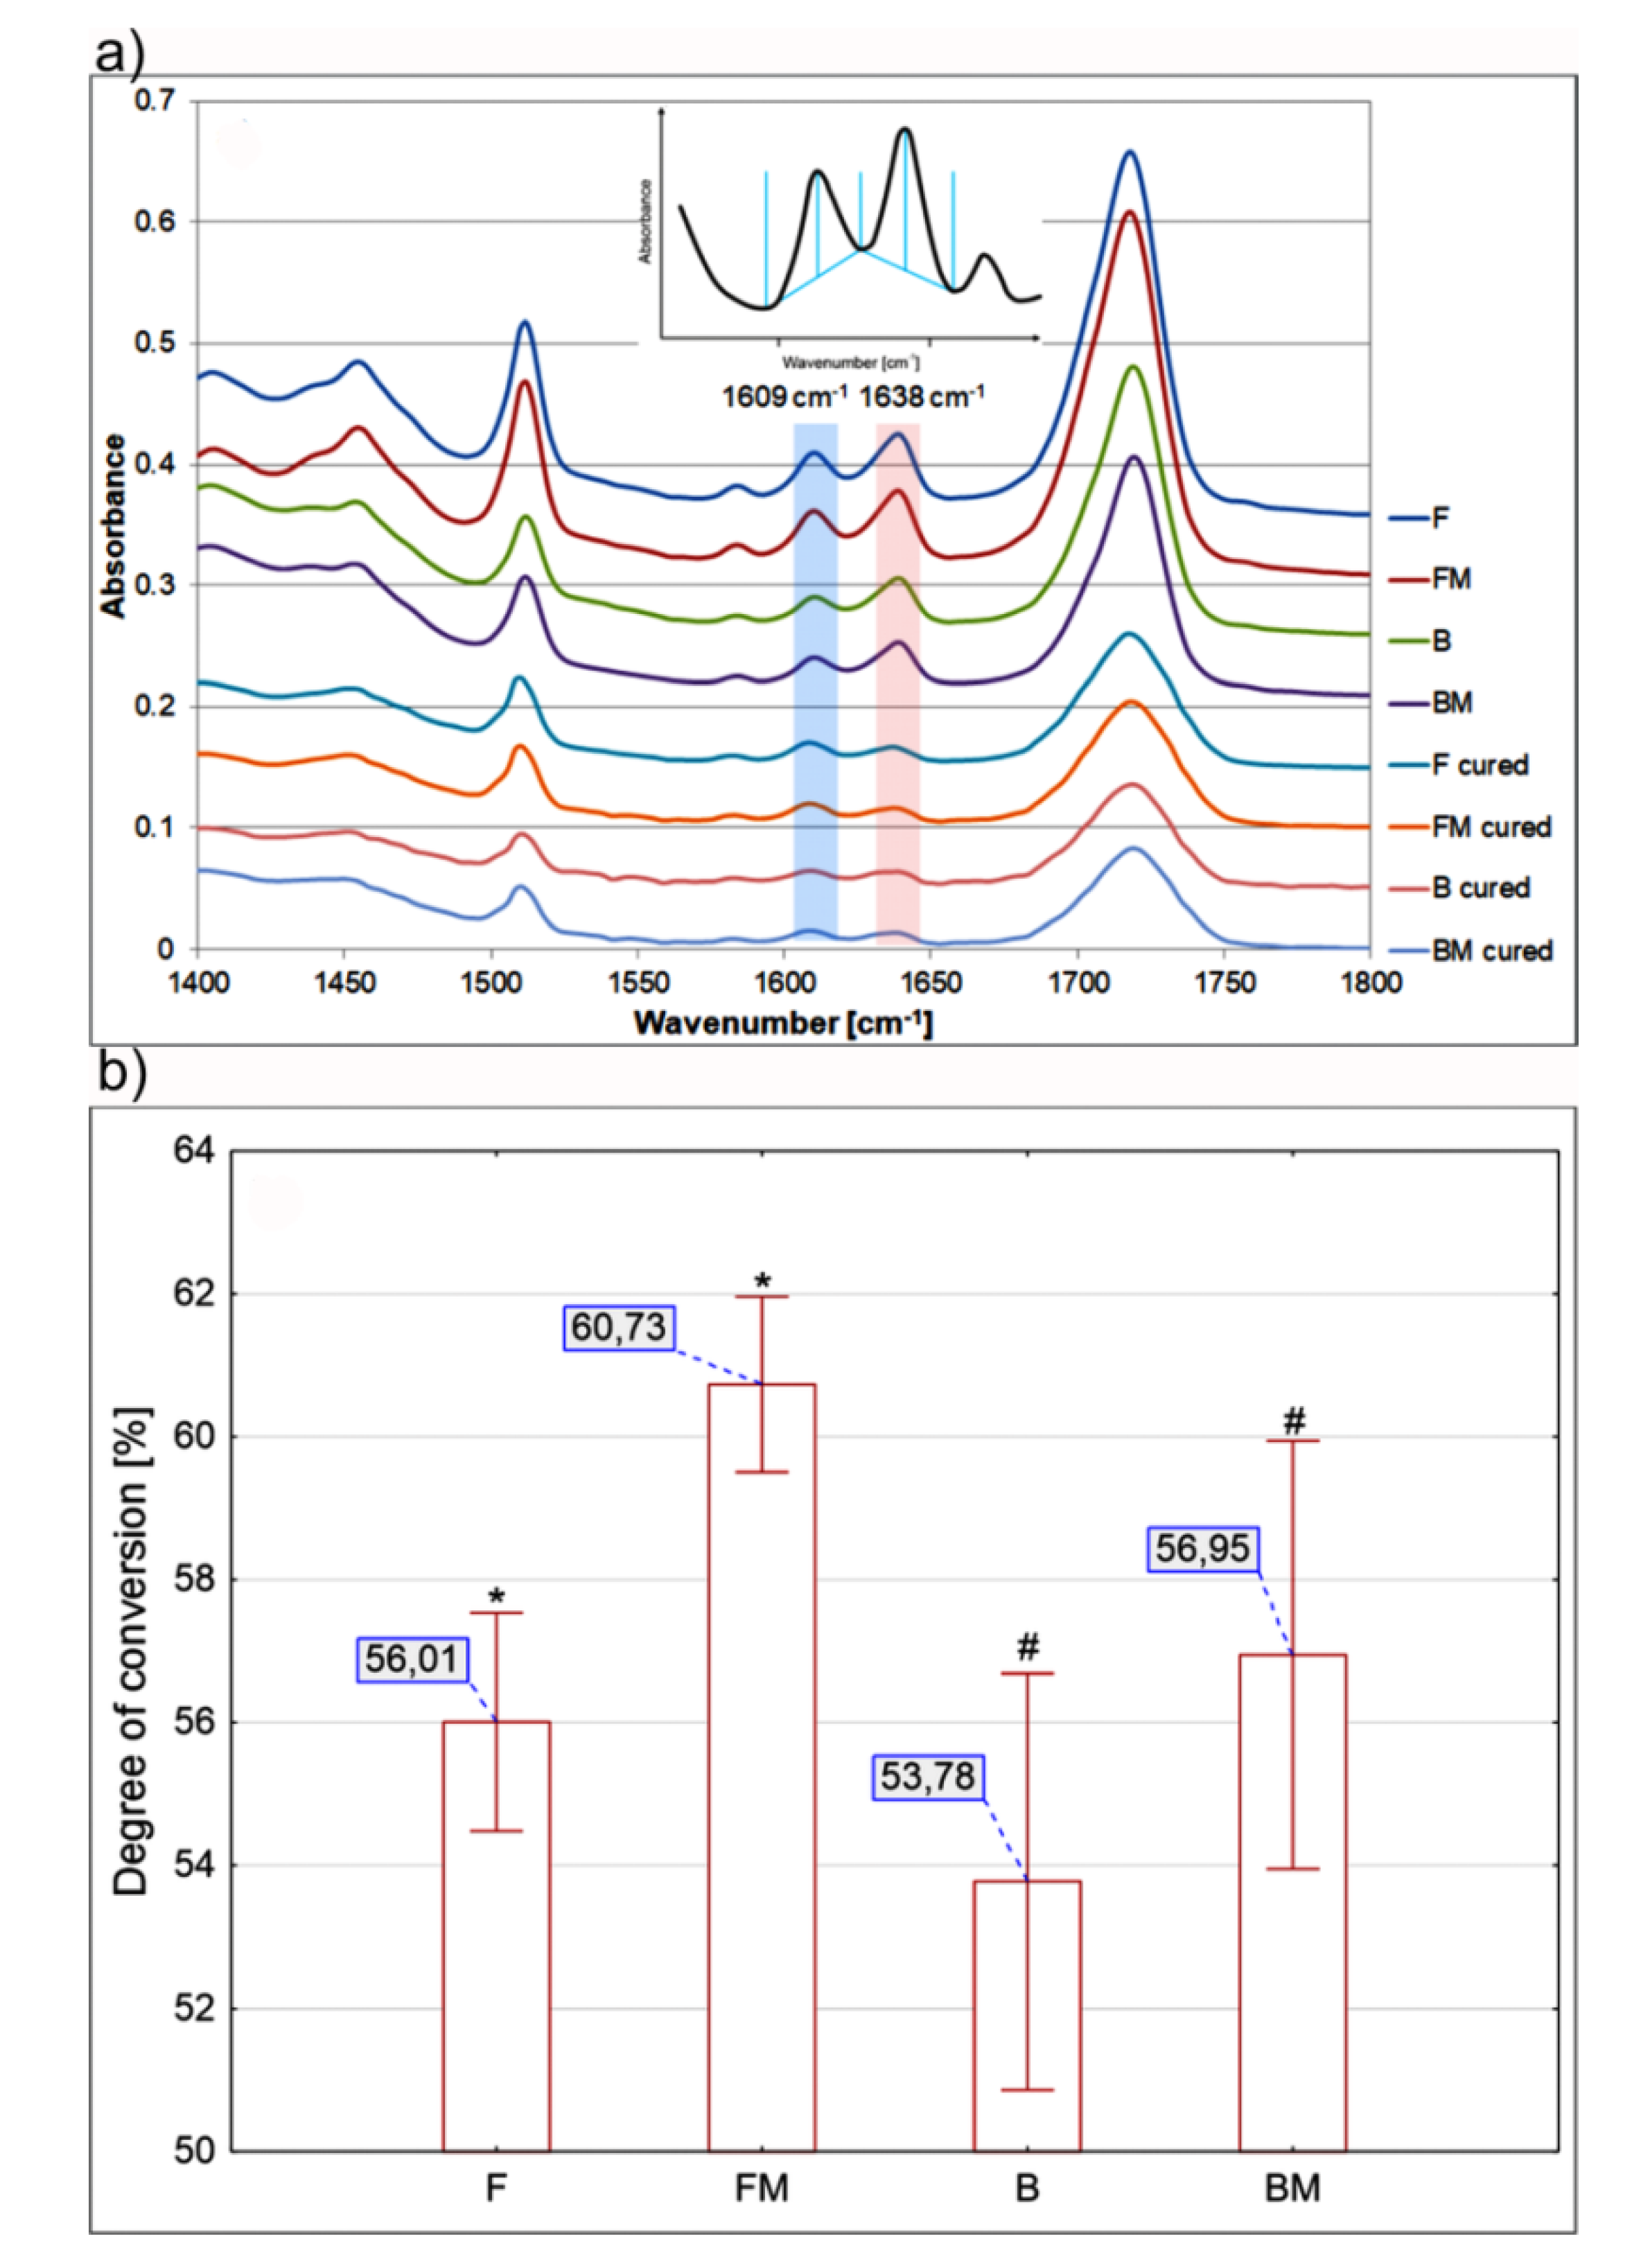
3.3. Degree of Conversion
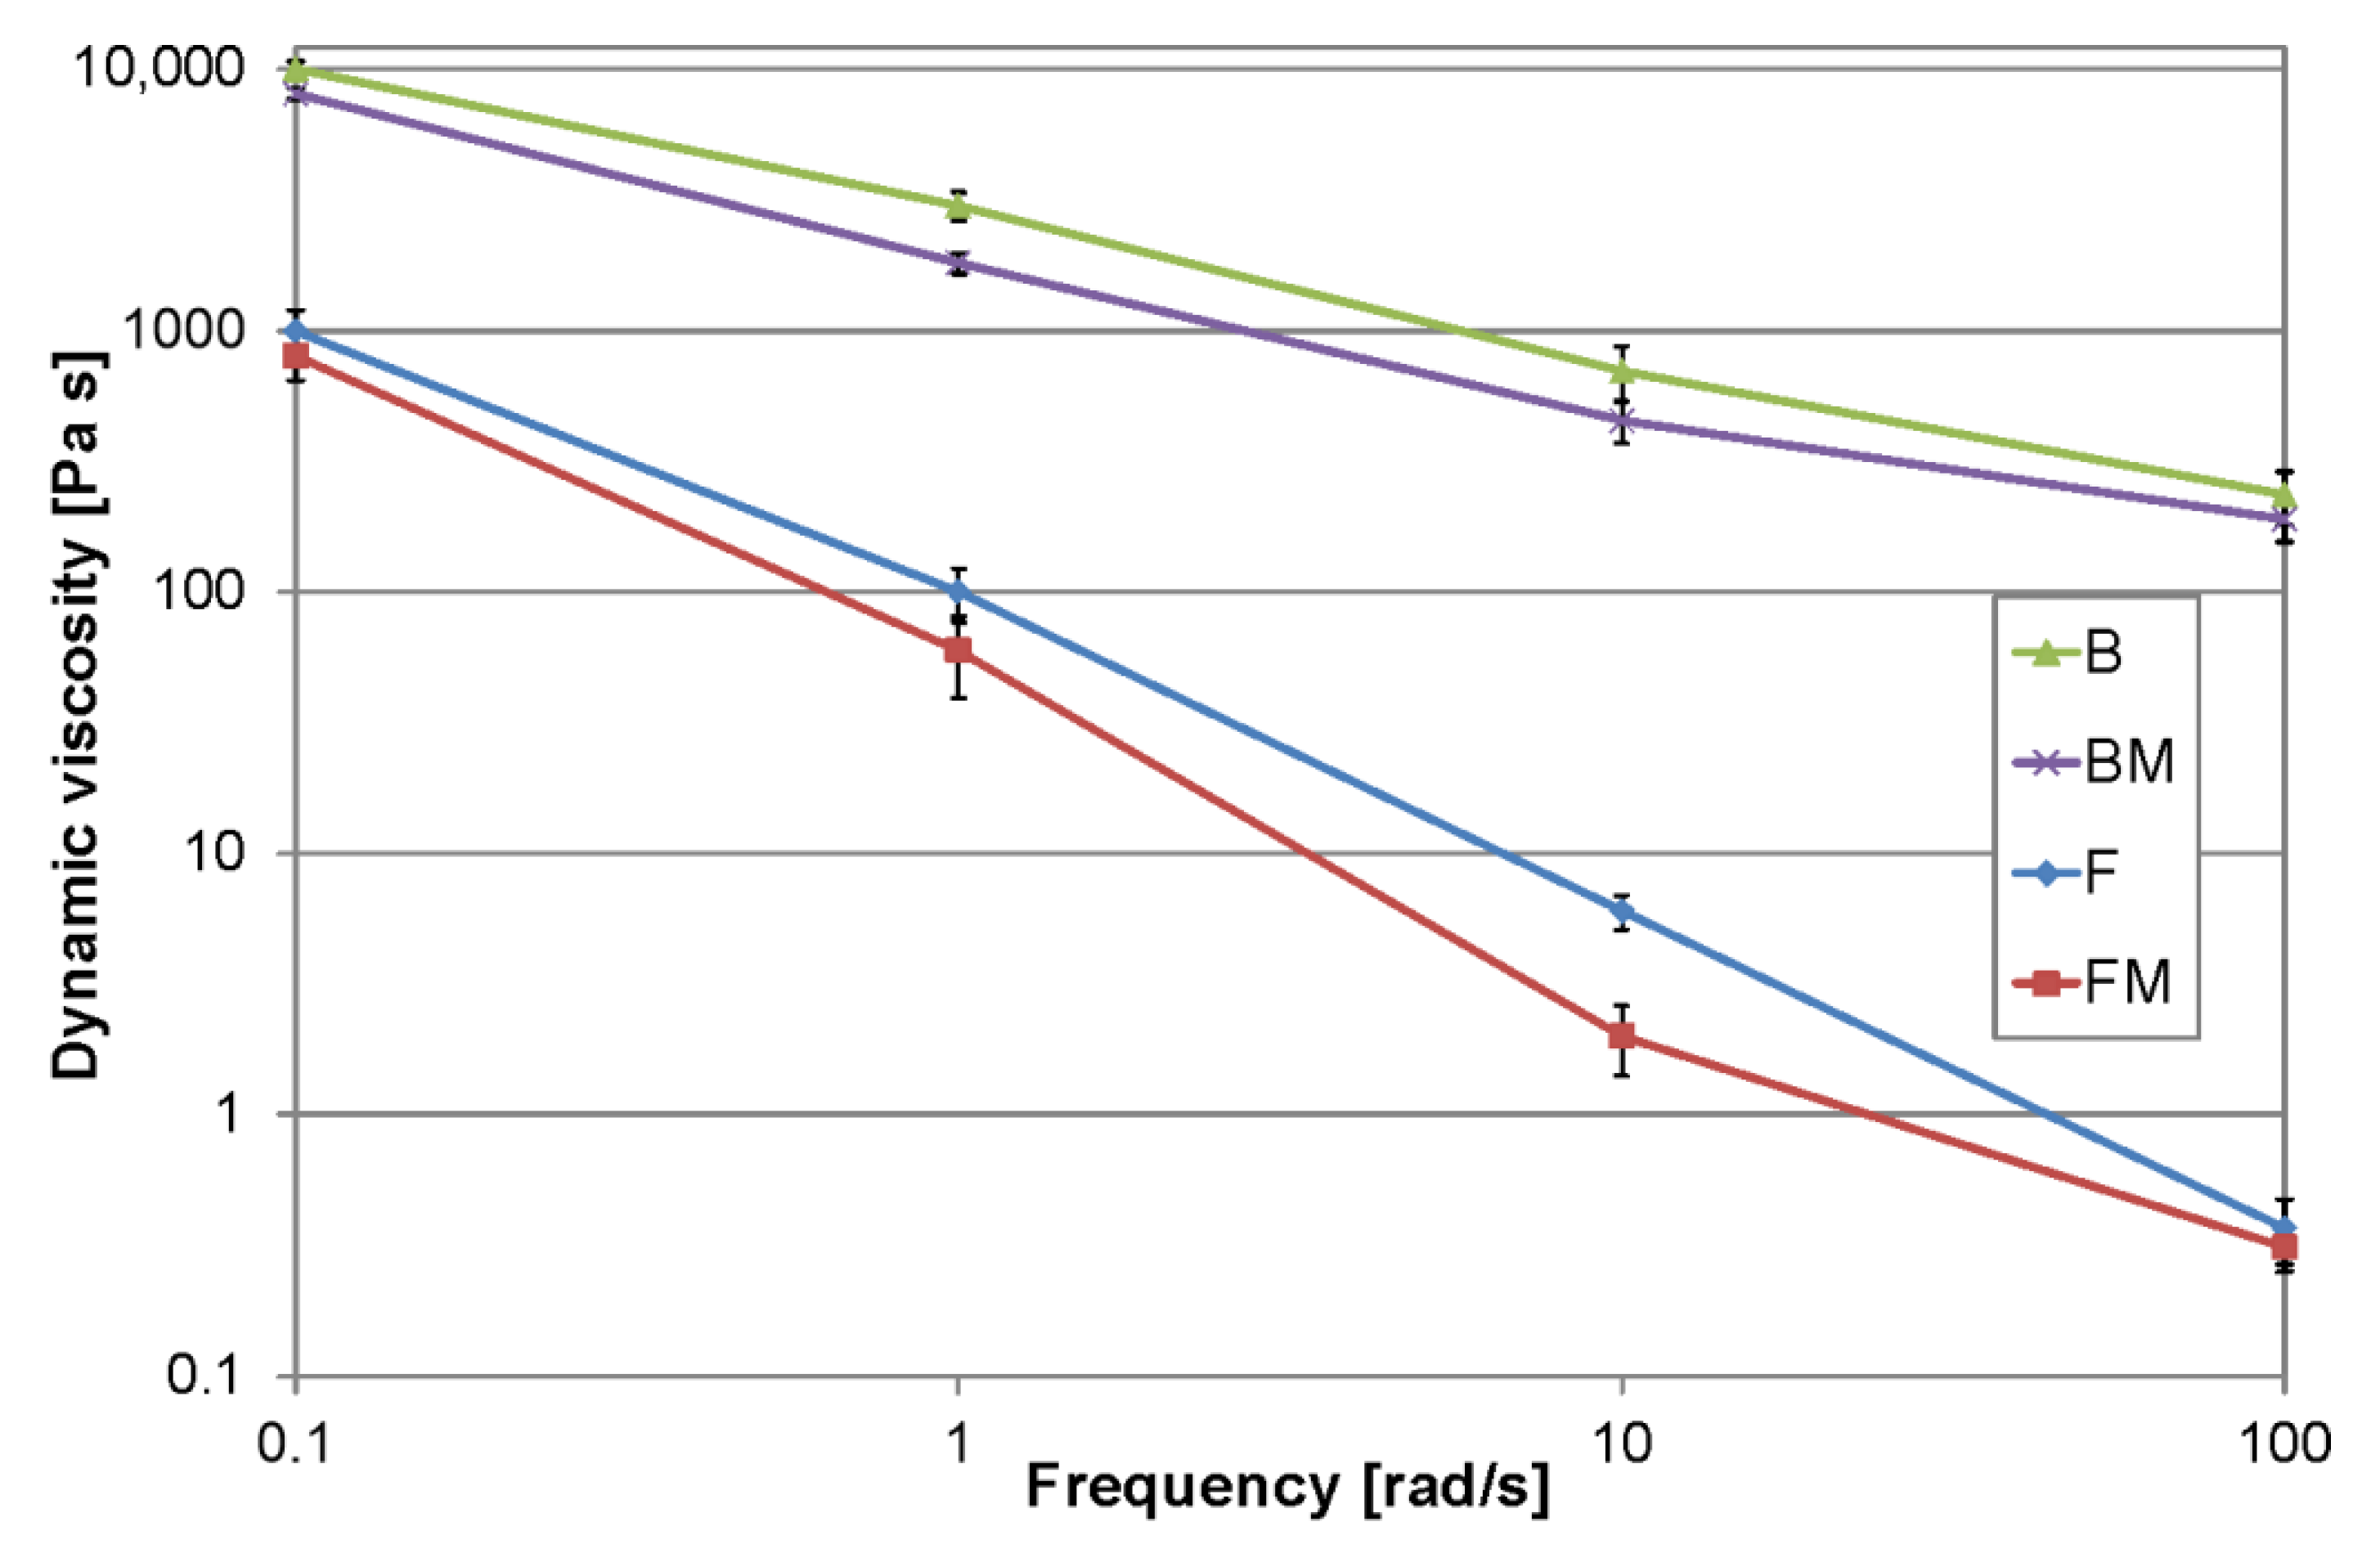
3.4. Viscosity
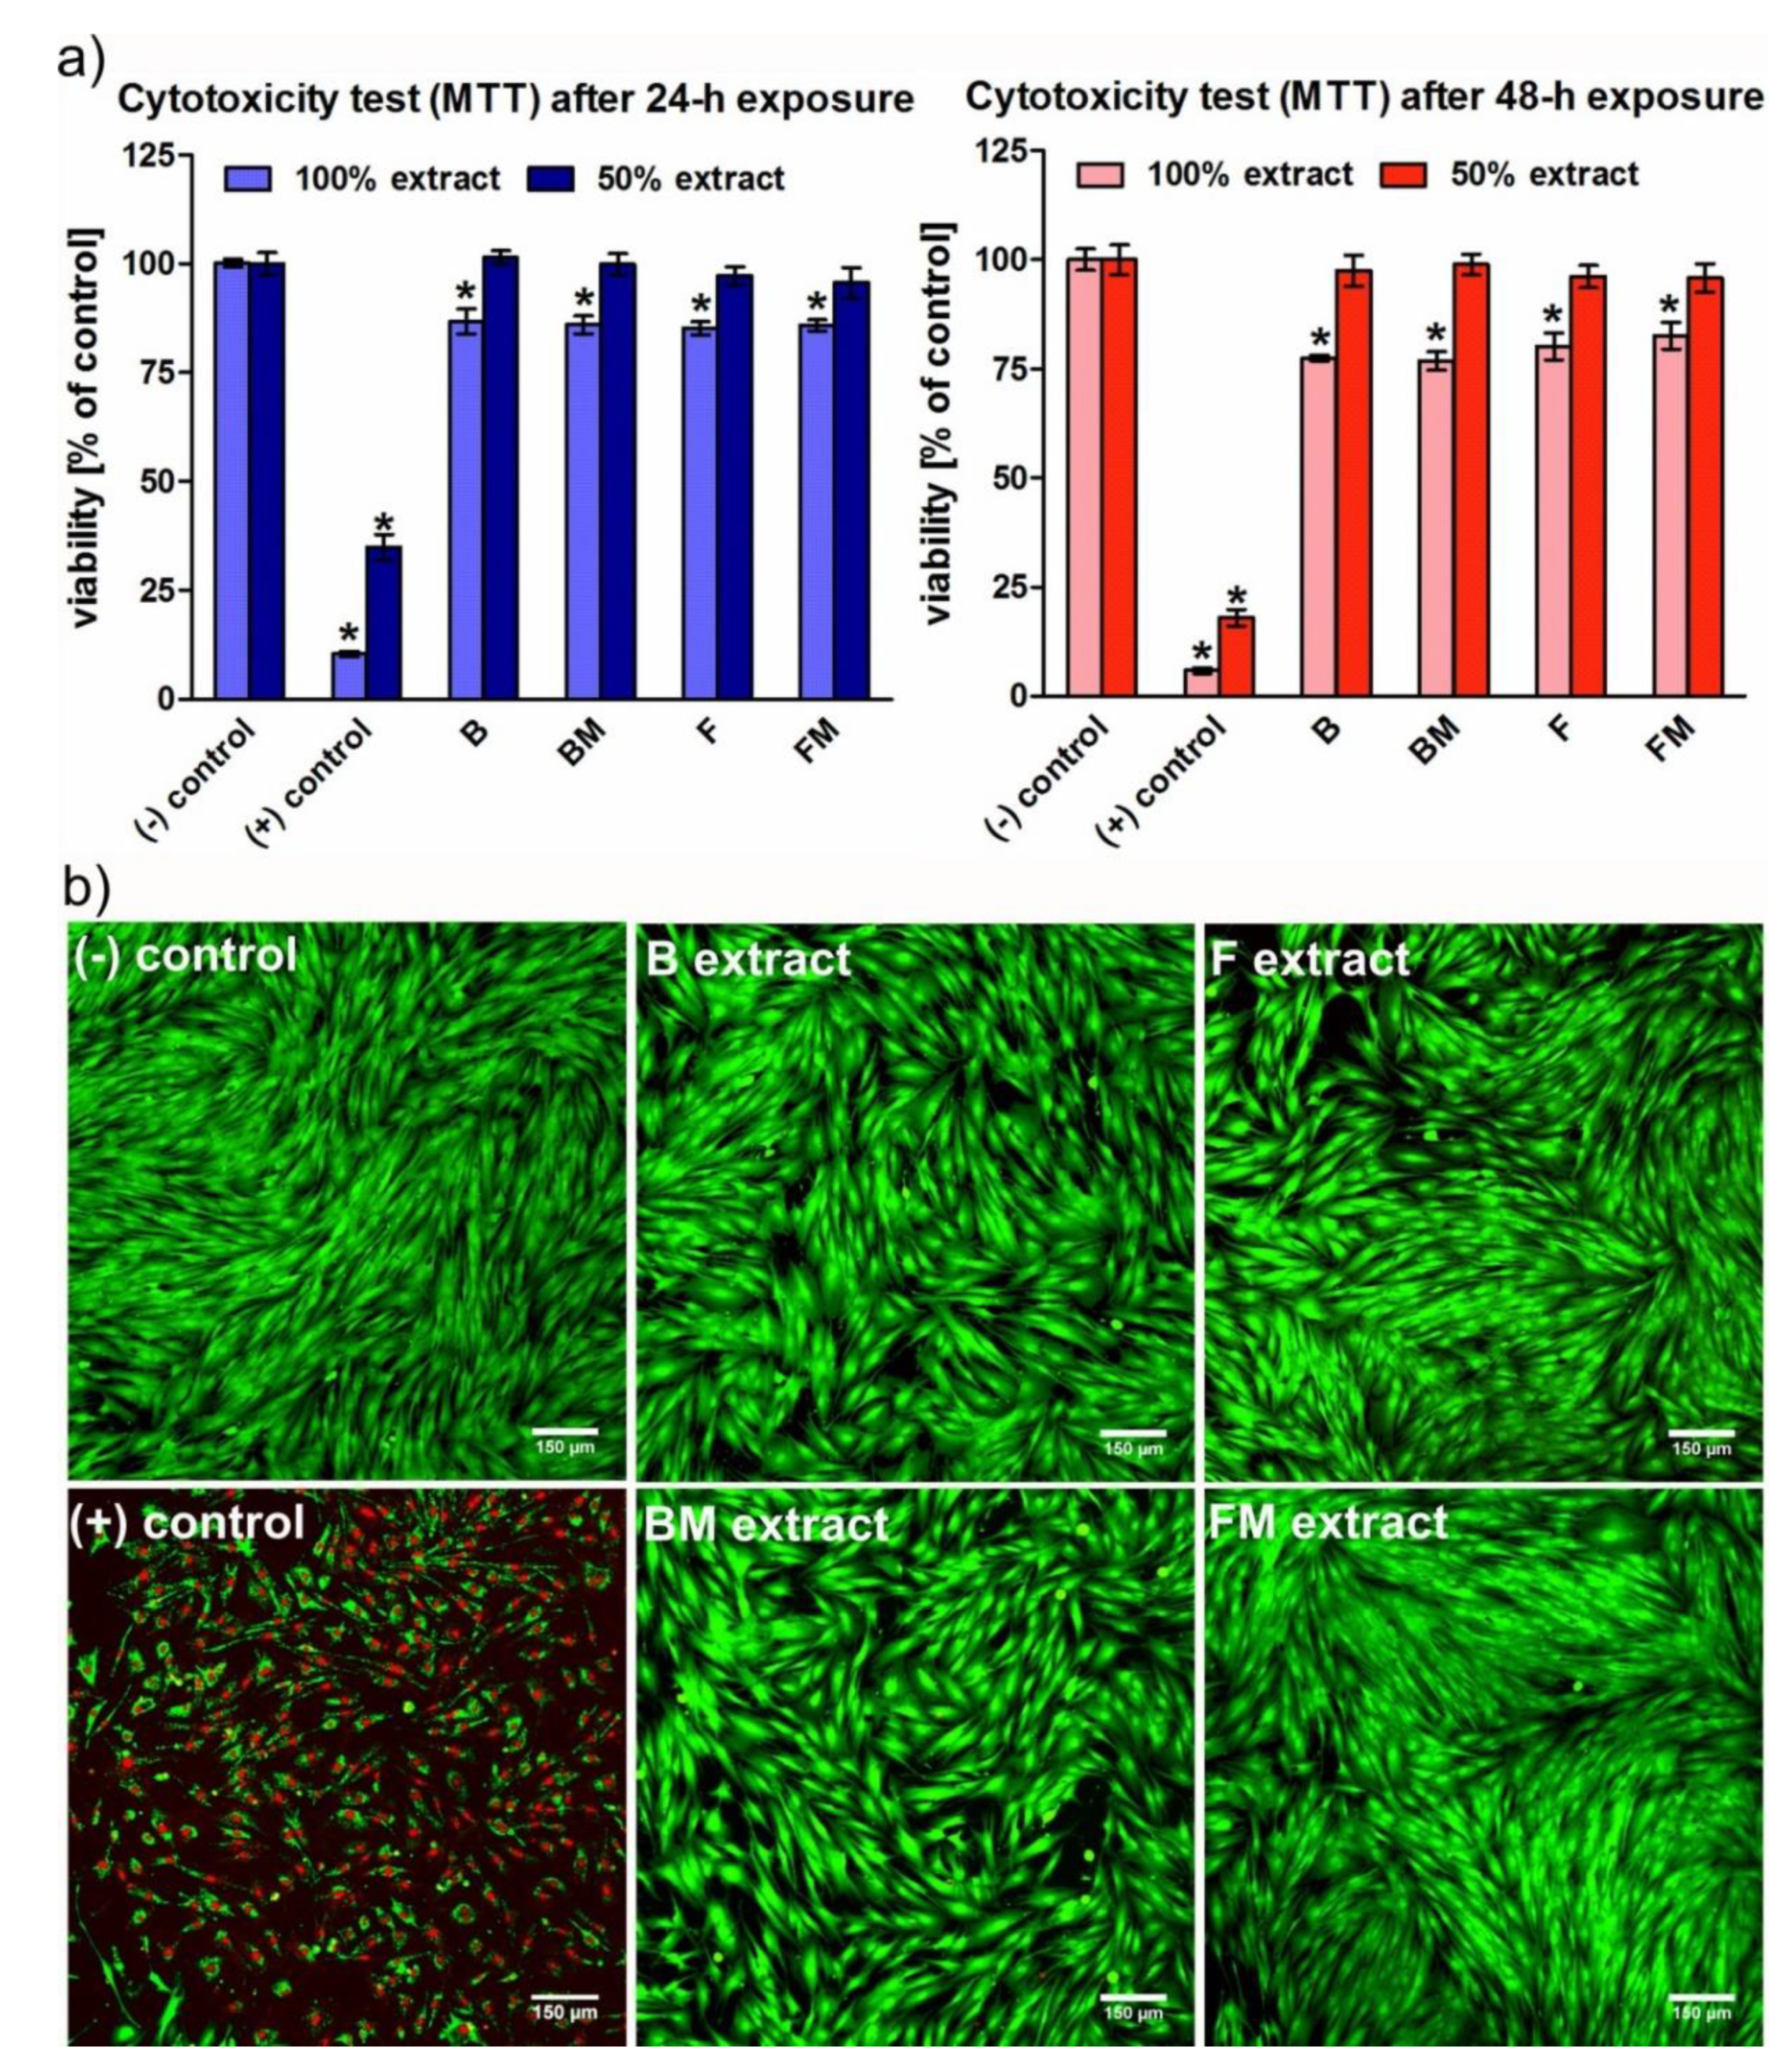
3.5. Cytotoxicity
4. Discussion
5. Conclusions
6. Patents
Author Contributions
Funding
Conflicts of Interest
References
- Rueggeberg, F.A. State-of-the-art: Dental photocuring—A review. Dent. Mater. 2011, 27, 39–52. [Google Scholar] [CrossRef] [PubMed]
- Ferracane, J.L. Resin composite—State of the art. Dent. Mater. 2011, 27, 29–38. [Google Scholar] [CrossRef] [PubMed]
- Chen, M.-H. Update on dental nanocomposites. J. Dent. Res. 2010, 89, 549–560. [Google Scholar] [CrossRef] [PubMed]
- Matsukawa, S.; Hayakawa, T.; Nemoto, K. Development of high-toughness resin for dental applications. Dent. Mater. 1994, 10, 343–346. [Google Scholar] [CrossRef]
- Kim, K.; Ong, J.; Okuno, O. The effect of filler loading and morphology on the mechanical properties of contemporary composites. J. Prosthet. Dent. 1992, 87, 642–649. [Google Scholar] [CrossRef]
- Xu, H.H.K.; Quinn, J.B.; Smith, D.T.; Giuseppetti, A.A.; Eichmiller, F.C. Effects of different whiskers on the reinforcement of dental resin composites. Dent. Mater. 2003, 19, 359–367. [Google Scholar] [CrossRef]
- Elbishari, H.; Satterthwaite, J.; Silikas, N. Effect of filler size and temperature on packing stress and viscosity of resin-composites. Int. J. Mol. Sci. 2011, 12, 5330–5338. [Google Scholar] [CrossRef]
- Lee, V.A.; Cardenas, H.L.; Rawls, H.R. Rubber-toughening of dimethacrylate dental composite resin. J. Biomed. Mater. Res. B Appl. Biomater. 2010, 94, 447–454. [Google Scholar] [CrossRef]
- Kerby, R.E.; Tiba, A.; Knobloch, L.A.; Schricker, S.R.; Tiba, O. Fracture toughness of modified dental resin systems. J. Oral Rehabil. 2003, 30, 780–784. [Google Scholar] [CrossRef]
- Rodford, R.A. Further development and evaluation of high impact strength denture base materials. J. Dent. 1990, 18, 151–157. [Google Scholar] [CrossRef]
- Mante, F.K.; Wadenya, R.O.; Bienstock, D.A.; Mendelsohn, J.; LaFleur, E.E. Effect of liquid rubber additions on physical properties of Bis-GMA based dental resins. Dent. Mater. 2010, 26, 164–168. [Google Scholar] [CrossRef] [PubMed]
- Robinette, E.J.; Ziaee, S.; Palmese, G.R. Toughening of vinyl ester resin using butadiene-acrylonitrile rubber modifiers. Polymer 2004, 45, 6143–6154. [Google Scholar] [CrossRef]
- Auad, M.L.; Frontini, P.M.; Borrajo, J.; Aranguren, M.I. Liquid rubber modified vinyl ester resins: Fracture and mechanical behavior. Polymer 2001, 42, 3723–3730. [Google Scholar] [CrossRef]
- Dusek, K.; Lednicky, F.; Lunak, S.; Mach, M.; Duskova, D. Toughening of epoxy resins with reactive polybutadienes. In Advances in Chemistry Series, 208; Riew, C.K., Gillham, J.K., Eds.; American Chemical Society: Washington, DC, USA, 1984; pp. 27–35. ISBN 084120828X. [Google Scholar]
- ASTM E 399-20 Standard Test Method for Linear-Elastic Plane-Strain Fracture Toughness of Metallic Materials; American Society for Testing and Materials: West Conshohocken, PA, USA, 2020.
- ISO 4049:2019 Dentistry—Polymer-Based Restorative Materials; International Organization for Standardization: Geneva, Switzerland, 2019.
- ASTM D790-17 Standard Test Methods for Flexural Properties of Un-reinforced and Reinforced Plastics and Electrical Insulating Materials; ASTM International: West Conshohocken, PA, USA, 2017.
- Arrais, C.A.G.; Rueggeberg, F.A.; Waller, J.L.; de Goes, M.F.; Giannini, M. Effect of curing mode on the polymerization characteristics of dual-cured resin cement systems. J. Dent. 2008, 36, 418–426. [Google Scholar] [CrossRef] [PubMed]
- Ferracane, J.L.; Greener, E.H. Fourier transform infrared analysis of degree of polymerization in unfilled resins—Methods comparison. J. Dent. Res. 1984, 63, 1093–1095. [Google Scholar] [CrossRef]
- Ruyter, I.E.; Györösi, P.P. An infrared spectroscopic study of sealants. Eur. J. Oral Sci. 1976, 84, 396–400. [Google Scholar] [CrossRef]
- Habib, E.; Wang, R.; Zhu, X.X. Correlation of resin viscosity and monomer conversion to filler particle size in dental composites. Dent. Mater. 2018, 34, 1501–1508. [Google Scholar] [CrossRef]
- ISO/EN10993-5 Biological Evaluation of Medical Devices—Part 5: Tests for In Vitro Cytotoxicity; International Organization for Standardization: Geneva, Switzerland, 2009.
- Przekora, A.; Benko, A.; Nocun, M.; Wyrwa, J.; Blazewicz, M.; Ginalska, G. Titanium coated with functionalized carbon nanotubes—A promising novel material for biomedical application as an implantable orthopaedic electronic device. Mater. Sci. Eng. C 2014, 45. [Google Scholar] [CrossRef]
- Kolmas, J.; Pajor, K.; Pajchel, L.; Przekora, A.; Ginalska, G.; Oledzka, E.; Sobczak, M. Fabrication and physicochemical characterization of porous composite microgranules with selenium oxyanions and risedronate sodium for potential applications in bone tumors. Int. J. Nanomed. 2017, 12. [Google Scholar] [CrossRef]
- De Souza, J.A.; Goutianos, S.; Skovgaard, M.; Sørensen, B.F. Fracture resistance curves and toughening mechanisms in polymer based dental composites. J. Mech. Behav. Biomed. Mater. 2011, 4, 558–571. [Google Scholar] [CrossRef]
- Pionteck, J.; Müller, Y.; Häußler, L. Reactive epoxy-CTBN rubber blends: Reflection of changed curing mechanism in cure shrinkage and phase separation behaviour. Macromol. Symp. 2011, 306–307, 126–140. [Google Scholar] [CrossRef]
- Shah, M.B.; Ferracane, J.L.; Kruzic, J.J. R-curve behavior and toughening mechanisms of resin-based dental composites: Effects of hydration and post-cure heat treatment. Dent. Mater. 2009, 25, 760–770. [Google Scholar] [CrossRef] [PubMed]
- Ozturk, B.; Cobanoglu, N.; Cetin, A.R.; Gunduz, B. Conversion degrees of resin composites using different light sources. Eur. J. Dent. 2013, 7, 102–109. [Google Scholar] [PubMed]
- Geurtsen, W. Substances released from dental resin composites and glass ionomer cements. Eur. J. Oral Sci. 1998, 106, 687–695. [Google Scholar] [CrossRef] [PubMed]


© 2020 by the authors. Licensee MDPI, Basel, Switzerland. This article is an open access article distributed under the terms and conditions of the Creative Commons Attribution (CC BY) license (http://creativecommons.org/licenses/by/4.0/).
Share and Cite
Pałka, K.; Kleczewska, J.; Sasimowski, E.; Belcarz, A.; Przekora, A. Improved Fracture Toughness and Conversion Degree of Resin-Based Dental Composites after Modification with Liquid Rubber. Materials 2020, 13, 2704. https://doi.org/10.3390/ma13122704
Pałka K, Kleczewska J, Sasimowski E, Belcarz A, Przekora A. Improved Fracture Toughness and Conversion Degree of Resin-Based Dental Composites after Modification with Liquid Rubber. Materials. 2020; 13(12):2704. https://doi.org/10.3390/ma13122704
Chicago/Turabian StylePałka, Krzysztof, Joanna Kleczewska, Emil Sasimowski, Anna Belcarz, and Agata Przekora. 2020. "Improved Fracture Toughness and Conversion Degree of Resin-Based Dental Composites after Modification with Liquid Rubber" Materials 13, no. 12: 2704. https://doi.org/10.3390/ma13122704
APA StylePałka, K., Kleczewska, J., Sasimowski, E., Belcarz, A., & Przekora, A. (2020). Improved Fracture Toughness and Conversion Degree of Resin-Based Dental Composites after Modification with Liquid Rubber. Materials, 13(12), 2704. https://doi.org/10.3390/ma13122704