Abstract
Concrete structure joints are filled in mainly in the course of sealing works ensuring protection against the influence of water. This paper presents the methodology of testing the mechanical properties of ESD pseudoplastic resins (E-elastic deformation, S-strengthening control, D-deflection control) recommended for concrete structure joint fillers. The existing standards and papers concerning quasi-brittle cement composites do not provide an adequate point of reference for the tested resins. The lack of a standardised testing method hampers the development of materials universally used in expansion joint fillers in reinforced concrete structures as well as the assessment of their properties and durability. An assessment of the obtained results by reference to the reference sample has been suggested in the article. A test stand and a method of assessing the mechanical properties results (including adhesion to concrete surface) of pseudoplastic resins in the axial tensile test have been presented.
1. Introduction
Expansion joints in building structures move in various directions. The most frequent direction of displacement is the direction perpendicular to the edge of the expansion joint. Depending on temperature changes, we observe either the opening, expansion or the narrowing, and closing down of the expansion joint gap [1,2,3]. The widening of the expansion joint gap directly causes the elongation of the material filling in the joint, and if the strength limits of the filler material are exceeded, it results in the irreversible damage causing the loss of sealing reliability. The increasing width of the expansion gap may also result in the filler material breaking off from the concrete surface, which also causes the loss of water tightness. The material can be fed by gravity pouring or by means of pressure injection pumps. The reacting resin hardens and sets, becoming permanently flexible mass, which during the cyclic work of the expansion joint should expand or shrink depending on the changes in expansion joint width, as shown in Figure 1.
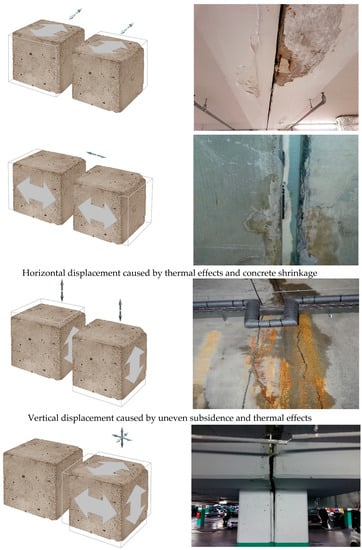
Figure 1.
Models showing possible displacements of structural members at expansion joint.
Numerous papers have emphasised the dependence of physical and mechanical properties of tested resins on ambient temperature [4,5,6]. The discrepancy of the obtained results has also been attributed to the impact of resins’ adhesion to materials [7]. It has been found that the substrate’s humidity has a significant influence on test results, which makes it necessary to ensure strict control of the testing conditions [8,9]. A review of relevant literature shows that resin tests are carried out on various test stands [10,11,12], which indicates the need to modify the standards to correspond to the scope of conducted tests. The lack of standardised procedures taking into account the possibility of assessing properties makes it impossible to compare the results obtained at various research centres [13,14,15].
The materials showing elastic properties are subjected to tests that provide data regarding the maximum elongation of the material in question or the maximum breaking force. A lot of standards enable the basic test to be carried out, i.e., the axial tensile test [16,17,18,19,20,21,22,23,24,25,26]. It is worth noting that none of the current standards is dedicated to expansion joint quasi-plastic filler materials, and the existing methods of assessment of the adhesion to the substrate do not refer to pseudoplastic behaviour under load.
In the course of research [27,28], an analysis has been conducted with respect to curves obtained in a static tensile test taking into account multi-axial stress and strain of elastic materials. The paper [29] described a methodology of tests of elastomeric bearings in complex states of strain according to the requirements of the standards PN-EN 1337-3 [30] and PN-ISO 37 [16]. The authors presented a design for a modern stand for biaxial tensile test for elastomers exceeding the scope of application of the aforementioned standards. The conducted tests cannot be adapted for the purposes of assessment of mechanical properties of pseudoplastic resins intended to be used as expansion joint fillers, including their adhesion to the concrete substrate.
The method of conducting tests and assessment of the deformation capacity dedicated to quasi-brittle cement composites that is proposed in numerous standards and papers [31,32,33,34,35,36] is not sufficient for the assessment of the mechanical properties of pseudoplastic resins functioning as expansion joint fillers. The existing hyperelastic models for the description of the behaviour of non-elastic materials (including hyperelastic resins) do not, however, take into account the impact of a large number of variables determining the usefulness of ESD materials (E-elastic deformation, S-strengthening control, D-deflection control) as expansion joint fillers. There is no information on the adhesion of materials to concrete substrates, and in particular on the strengthening control and deflection control areas [37,38].
The method proposed in [31,32,33] for the assessment of ESD quasi-brittle cement composites has been used in our own work. Those works present a possibility of assessing the mechanical properties of materials based on the stress–strain correlation in any case of the loads recording the values (force, deformation and absorbed energy), but do not include information regarding changes in the width of gaps in expansion joints during an axial tensile test.
In this work, the aforementioned method has been modified for the purpose of assessing the mechanical properties of ESD quasi-plastic resins in the tensile strength tests—taking into account the assessment of their adhesion to the concrete surface.
2. Testing
2.1. Materials Used for Tests
In this article, the following specimens has been prepared for testing the mechanical properties of ESD pseudoplastic resins recommended as concrete structure joint fillers:
- specimen 0C—standard, reference cement mortar with the following composition and parameters: cement CEM I 32.5, compressive strength fc = 4.48 MPa, mortar class M4, three-point bending tensile strength ftb = 0.14 MPa (distance between supports 150 mm).
- resins used as a filler in the expansion joint model, as presented in Table 1:
 Table 1. Resin specimens—tensile strength ft elongation at break ε, density, viscosity and pH.
- 1A—resin based on thixotropic acrylic for injections,
- 2A—resin based on acrylic mixed with water,
- 3A—resin based on polyurethane mixed with water,
- 4A—polyurethane-based resin,
- 5A—resin based on elastic epoxy,
- 6A—bitumen-based resin.
As shown in Table 1, six types of resins have been selected for tests. Those resins are universally used and available on the construction market and, more importantly, are used as expansion joint fillers. Each resin is characterised by different properties and technical parameters. The resins were fed into the gaps of the expansion joint model by means of the so-called gravity pouring. Subsequently, the expansion joint models were put aside until the resins hardened, i.e., for a period of 24 h. The entire testing process was divided into several series of tests. Each series of tests was conducted for a different resin. In total, tests for six different filler resins were carried out.
The axial tensile test for resins has been conducted in accordance with PN-EN ISO 37 standard [16] using the Instron 33R strength testing machine.
The testing procedure included the proper preparation of specimens. Resins in Table 2 were placed on a flat surface 400 × 300 mm, circa 5 mm thick. Afterwards, with the use of a template, shaped elements were cut out—the so-called “oars”—which were then placed, one by one, in the strength testing machine, as shown in Figure 2.
Table 2.
Results from the axial tensile test for the analysed resins according to PN-EN ISO 37 [16].
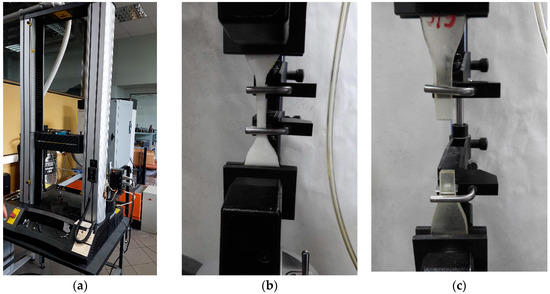
Figure 2.
Resin testing according to [16]—axial tensile test: (a) view of the strength testing machine—test stand, (b) view of the shaped resin elements, the so-called “oars”, placed in the clamps and (c) view of the completed test at the moment of breaking of the resin specimen.
The testing was carried out until the moment of breaking of the resin specimens for which the results of maximum elongation at break and maximum breaking force were obtained.
Examples of diagrams of stress as a function of deformation in axial tensile test—5 samples of resin 1 (Table 2) are presented in Figure 3.
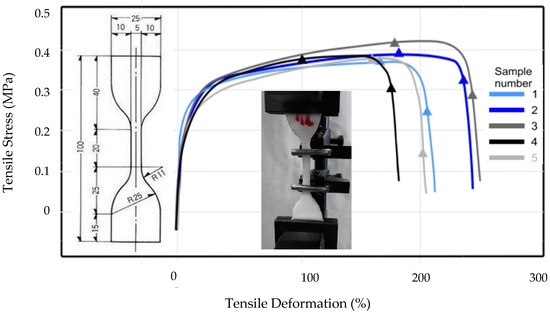
Figure 3.
The tensile stress-deformation curves as a function of deformation in axial tensile test of resin 1, Table 2 (5 samples - based on thixotropic acrylic) according to PN-EN ISO 37 [16].
The obtained results of the axial tensile test for the analysed resins according to PN-EN ISO 37 [16] are presented in Table 2.
2.2. Preparation of Specimens for Tests
The expansion joint model prepared for the tests was a model in which class C37 concrete specimens with 100 × 100 × 100 mm dimensions were used. The tests were carried out in laboratory conditions, with a temperature of 20 °C and stable air humidity. The preparation of the expansion joint model consisted in arranging two concrete specimens in parallel with each other, Figure 4.
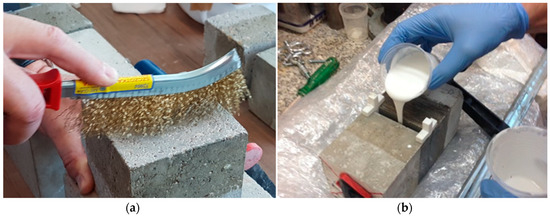
Figure 4.
Preparation of a specimen for tests: (a) cleaning the surface and (b) pouring the resin into the expansion joint.
For all expansion joint model specimens, a 10-mm-wide gap was prepared, and each of the resins and the reference cement mortar was then poured into that gap. In the case of all the fillers, there was the same method of preparation - mechanical cleaning of the concrete specimens surface (1A,2A,3A,4A,5A,6A–Table 1) and pouring the resin into the expansion joint.
2.3. Description of the Test Stand
The expansion joint model specimens were tested using a Hounsfield 10K-S strength testing machine (Tinius Olsen TMC-United States) and the Horizon numerical processing software (ver.1). The adopted crosshead speed was 5 mm/min. A view of the test stand is presented in Figure 5.
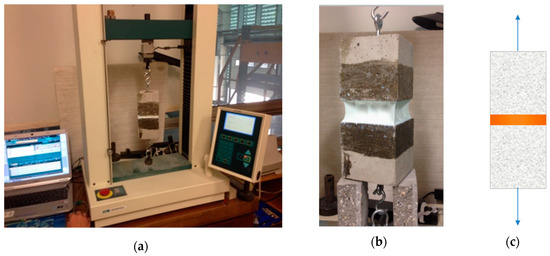
Figure 5.
A view of the test stand: (a) testing machine, (b) close-up of a specimen during testing and (c) the adopted tension method.
Owing to the use of clamps on a harness (jointed system)—the expansion joint model displacement in one direction, perpendicular to the side surfaces of the gap, was simulated. The expansion joint model tension reflects the actual behaviour of filler materials in repaired reinforced concrete structures. The displacements in perpendicular direction are smaller and are not the main cause of destruction of pseudoplastic fillers in expansion joints.
The aim of the tests of expansion joint models filled with sealing resins was to determine the force–deformation correlation serving as the basis for the assessment of the usefulness of resins as expansion joint fillers. The test was based on the measurement of the displacement of crosshead. The stress–strain tests took into account the weight of the lower concrete cube. After the test, the resin condition after the break and the percentage degree of the resin adhesion to the concrete substrate were assessed visually.
Figure 6 shows an exemplary load–deformation curve for an expansion joint model specimen marked as 1AR5 (resin 1, humidity or contamination of the substrate A: dry, substrate cleaned manually R, specimen 5) with photographs depicting the testing process. Manual cleaning concrete surface results in less resin adhesion (than mechanical cleaning).
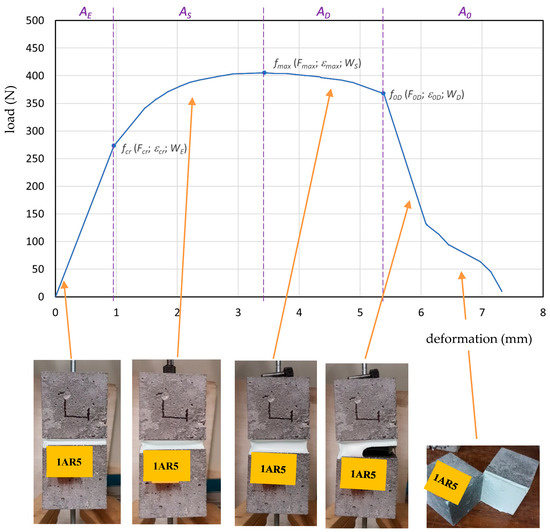
Figure 6.
An exemplary diagram of the load–deformation curve for an expansion joint model specimen AR5 with photographs depicting the testing process—manual cleaning surface.
2.4. Diagram of Properties Assessment for ESD Pseudoplastic Materials
Figure 7 shows a diagram for the assessment of mechanical properties based on the load–deformation curve of ESD pseudoplastic materials (E-elastic deformation, S-strengthening control, D-deflection control) in an axial tensile test according to [31,32,33].
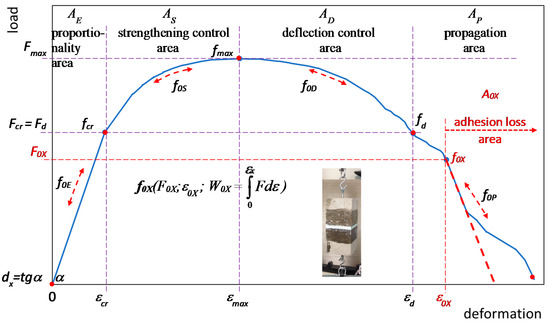
Figure 7.
A diagram for the assessment of mechanical properties based on the load–deformation curve of ESD pseudoplastic materials in an axial tensile test.
The drawing outlines the adhesion loss area A0X in which the resin has been pull off from the concrete surface.
Characteristic areas have been determined: AE-elastic deformation (fcr, the proportionality range-Hooke’s law), AS-strengthening control (the area between fcr, and the occurrence of maximum stress fmax), AD-deflection control (the area between fmax and fd) and AP-propagation area.
Point fd corresponds to the ability to carry stress fcr and is a determinant of the optimum ESD pseudoplastic filler.
Any point fX(FX,εX,WX) on the load–deformation curve has been defined with the use of a corresponding force FX, deformation εX and absorbed energy WX (area under the curve).
The characteristic points fX ending each of the areas AX marked respectively: fcr, fmax, fd.
What has been identified is the pulling off or breaking off of the pseudoplastic filler at any point f0X(F0X,ε0X,W0X) and the correlating area A0X (point f0E in the proportionality area A0E, point f0S in the strengthening area A0S and point f0D in the deflection control area A0D—additionally point f0P in the propagation area A0P).
Point f0X, where the pull off/destruction of the material was recorded, was considered to be the end point of the deformation capacity assessment. If there was no pulling off the resin, point fd ending the deflection control range served as the determinant of the end of the test.
The assessment of the deformation capacity of the materials used in the Hooke’s law range has been determined as dx = tgα.
3. Test Results
The presentation of the results of 0C1, 0C2, 0C3—a model with M4 cement mortar filler-and the averaged result serving as the reference 0C for the tested resins, is shown in Figure 8.
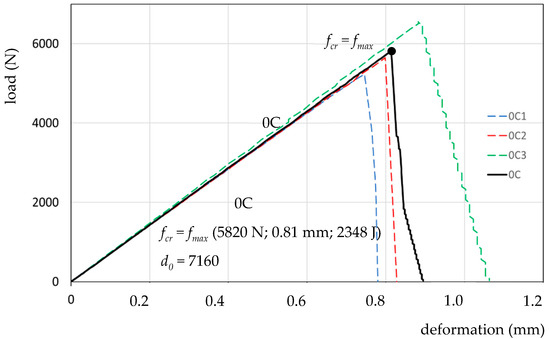
Figure 8.
Presentation of load–deformation curves for expansion joint model specimens 0C1, 0C2, 0C3 and the reference specimen 0C in the axial tensile test.
For the averaged reference specimen 0C, the following have been determined: fcr(force-Fmax; deformation-εmax; absorbed energy-Wmax), and deformation capacity d0. Also fcr = fmax (5820 N; 0.81 mm; 2348 J) and d0 = 7160 (tgα force-deformation correlation from the Hooke’s law range) have been determined. The results are presented in Table 3.
Table 3.
Presentation of the results (characteristic points on the force–deformation curve) for the reference specimen 0C and tested resins 1A, 2A, 3A, 4A, 5A, 6A.
Figure 9 shows a diagram for the reference specimen and the “strongest” resin 5A (based on elastic epoxide). Specimen 5A shows slightly higher deformation capacity d0 = 6509 (lower tgα than the reference specimen d0 = 7160), a larger proportionality area fcr and, additionally, a significant strengthening control area to point f0S, at which there was a catastrophic, rapid break of the resin.
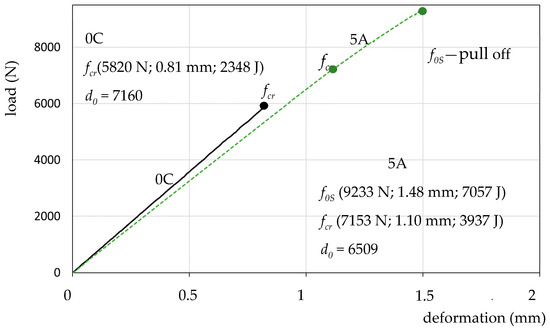
Figure 9.
The load–deformation curve for specimen 5A and specimen 0C.
Figure 10 presents collective curves for resins 1A, 2A, 3A, 4A, 5A, 6A and the reference specimen 0C. Each resin was tested on at least three specimens, out of which the most representative one was selected for comparison purposes. It was not necessary to average the diagrams due to the deformation of the moment of resin destruction.
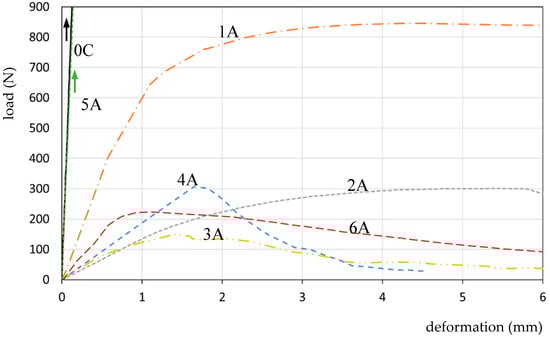
Figure 10.
The load–deformation curves for specimens 1A, 2A, 3A 4A 5A, 6A and the reference specimen 0C.
For each of the presented resins, characteristic points fX and f0X (moment of destruction/pulling off the resin) were determined, which is shown in Table 3.
The obtained data show more precisely the behaviour of expansion joint filler materials in a tensile test, enabling the assessment and comparison of various resins. The presented data enable the assessment of the behaviour of resins in each of the proportionality, strengthening control and deflection control areas. A tabular presentation of data enables the characteristic points fx from a number of tests to be averaged for the purpose of the assessment of ESD pseudoplastic materials.
Figure 11 is a presentation of load–deformation curves for the reference specimen 0C and resins 1A, 2A, comparing the obtained values of mechanical properties with the defined reference specimen.
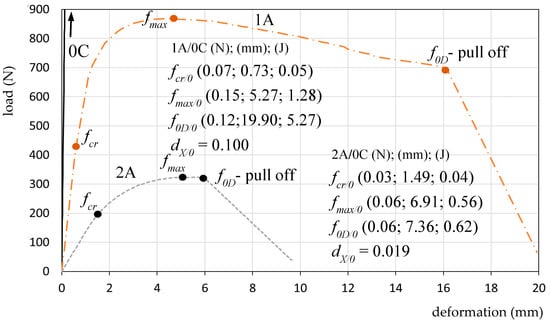
Figure 11.
The load–deformation curves for specimens 1A, 2A and specimen 0C.
Table 4 contains a comparison of the obtained values of the mechanical properties of the tested resins 1A, 2A, 3A, 4A, 5A and 6A in relation to the reference specimen 0C.
Table 4.
Resins 1A, 2A, 3A, 4A, 5A and 6A compared with the reference specimen 0C.
Table 5 presents the results of resins 1A, 2A, 3A, 4A, 5A, and 6A compared to the linear correlation of specimen 5A, with the largest Hooke’s law area.
Table 5.
Resins 1A, 2A, 3A, 4A, 5A and 6A compared to the linear correlation of specimen 5A.
The proposed method of describing points on the force–deformation curve enables the comparison of any selected points fx1 (or areas AX1) and their comparison with any selected points fx2 (areas AX2) chosen for the analysis of the obtained effects: fx1/fx2(FX1/FX2,εX 1/εX2,WX1/WX2).
The results presented in Table 4 and Table 5 indicate the possibility of juxtaposing freely the data selected for analysis, enabling the comparison of multiples of the achieved effects on various test stands. However, it is recommended to quickly introduce a standardised testing procedure that will enable an accurate comparison of the results obtained at various research centres.
Examples of deformations of resins 1A, 2A and 3A filling the expansion joints before and after the loss of adhesion to the substrate (point f0X) in an axial tensile test is presented in Figure 12.
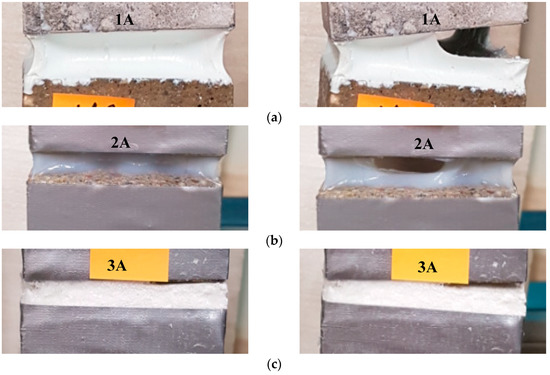
Figure 12.
Examples of specimens of resins filling the expansion joints before and after the loss of adhesion to the surface (point f0X) in an axial tensile test: (a) resin 1A, (b) resin 2A and (c) resin 3A.
A linear decrease in the load–deformation correlation in an axial tensile test of the presented model indicates the pulling off the fillers from the substrate. That process may be more or less dynamic. In the case of resin 5A, there was a catastrophic break.
Resins 2A and 1A were characterised by a less rapid loosening process—as seen in the diagram. Resins 4A, 3A and 6A, after a partial loosening, were characterised by the greatest capacity for deformation and energy absorption in the destruction propagation area. In that area, the loss of tightness of the joints occurs, which is why that range is not taken into consideration when interpreting the obtained results.
4. Discussion of the Results
The assessment of tensile tests of a model of an expansion joint filled with ESD resin mass is made possible by the recording of data: force/stress, corresponding deformation and work-as the quantity of absorbed energy (surface area under the stress–strain curve), Figure 7. The characteristics of each point fx on the load–deformation curve are presented in the form of fx (force/load; deformation; absorbed energy), Figure 8, Figure 9, Figure 10 and Figure 11.
The proportionality area AE determines the quality of the filler, whereas the areas of strengthening control AS and deflection control AD (characterised by a greater ability to carry stress than the Hooke’s law proportionality area) contribute to the improvement of durability of sealants in the expansion joints of concrete structures, and constitute an additional safety range.
The characteristics of ESD pseudoelastic resins serving as sealants in expansion joint gaps indicate an increased deformation capacity in areas AS and AD—resulting in a considerable quantity of absorbed energy compared to the proportionality area AE. The strengthening control area AS is more significant in that type of fillers (it does not generate a destruction of the filler structure).
The deflection control area AD, with loads greater than those occurring in the proportionality area and comparable to those in the strengthening control area, additionally enables an effective implementation of the applicability range of the ESD resin material in expansion joints. That effect is also controlled by the possible appearance of the first forms of destruction of the structure on the side surface of the pulled material (it usually cannot be seen with a naked eye).
The area of propagation, weakening AP, with the decreasing stress and increasing deformation, is characterised by the moment of the resin specimen being pulled off from the concrete surface together with the absorption of another portion of energy in the resin structure destruction process. The area of propagation (of carrying stress that is lower than the critical one) is not recommended for ESD pseudoplastic sealing resins (it may also be assessed).
The area of the loss of adhesion A0 (Figure 7), with the decreasing stress and increasing deformation, is characterised by the moment of the resin specimen being pulled off from the concrete surface together with the destruction of the resin structure. The deformations breaking and destroying the structure of the material result in a significant linear decrease in stress (linear decrease in the force–deformation correlation). What determines the maintenance of reliability of the whole system, i.e., the expansion joint gap filled with sealing resin, is the adhesion control area A0. The loosening of the resin from the concrete surface is considered an emergency situation. The loss of adhesion of the sealing resin in the expansion joint is, from the perspective of the maintenance of the sealant’s reliability, the moment when water tightness is lost. At that moment, the water influencing the whole system is able to permeate through the filled expansion joint.
From the perspective of the sealant’s reliability, it is assumed that the loss of adhesion should occur as late as possible. The breaking off, loosening of ESD pseudoplastic resins should take place in the propagation area AP, which is not significant as regards the values of carried stress.
What is an important component of the analysis of the obtained results is the correct determination of the Hooke’s law range (fcr). The linear correlation should be determined on large-scale diagrams. It should be noted that the correlation should be determined from a section between 50% fcr and fcr. The force-deformation correlation in the initial range is not linear due to the specimen’s arrangement on the slings and, therefore, should not be taken into account (when interpreting the test results).
A need to standardise the testing procedure has been emphasised. Because the tests are conducted on differing test stands (e.g., with different crosshead speed, ambient temperature, etc.), the obtained data cannot be compared with one another. Until relevant standard provisions are adopted, it is proposed to compare the results as a multiple of the established reference item. It may be a specimen with defined parameters or e.g., the Hooke’s law range of the best of the tested materials.
The obtained results of the tests of resins presented in Table 3 enable a preliminary assessment of the possibility of using them as expansion joint fillers. Depending on the obtained deformations, an appropriate filler can be selected for a specific case of an expansion joint on a structural element. Thus:
- If the expansion joint gaps expand by 5% in relation to the original width, then practically all the resins can be used as fillers for such a joint. All resins 1A, 2A, 3A, 4A, 5A and 6A meet that condition in area AE.
- If the expansion joint gaps expand by 10% in relation to the original width, then practically all the resins can be used as fillers for such a joint. Resins 2A, 4A and 5A meet that condition in area AE, and resins 1A, 3A and 6A—in area AS.
- If the expansion joint gaps expand by 15% in relation to the original width, resin 5A cannot be used to fill such a joint. Resins 1A, 2A. 3A and 4A meet that condition in area AS, and resin 6A—in area AD.
- If the expansion joint gaps expand by 50% in relation to the original width, resins 3A, 4A, 5A and 6A cannot be used to fill such a joint. Resin 2A meets that condition in area AS, and resin 1A—in area AD.
- If the expansion joint gaps expand by 100% in relation to the original width, then only resin 1A can be used as a filler for such a joint. Resin 1A meets that condition in area AD.
A comparison of the tested resins with the reference specimen 0C (Table 4) confirms the conclusions presented above. An analysis of the results in relation to a predefined reference item, based on a multiple of changes, enables a comparison of the results obtained at various research centres—until an applicable standard (norm) is established. In summary, it should be noted that only specimens 1A and 2A could be classified as ESD pseudoplastic resins. Specimen 1A shows lower deformation capacity (dx = 715) in comparison with specimen 2A (dx = 135), with a much greater ability to carry stress and higher quantity of absorbed energy in the areas: elasticity, strengthening control and deflection control.
What is worth noting is the comparison of the results of the proposed testing method with the traditional method of assessing the mechanical properties of resins presented in Figure 3 and Table 2. The presented data show that resin 1 (Figure 3) has different ESD mechanical parameters compered to resin 1A (Figure 11), which leads to various conclusions regarding the assessment of the usefulness of pseudoplastic materials proposed as fillers in working elements of concrete structures—taking into account the assessment of their adhesion to the concrete surface.
The comparison of Figure 11 and Figure 6 shows that mechanical cleaning of the concrete surface 1A results in better resin adhesion than manual preparation of the concrete surface 1AR5.
As mentioned above, the existing hyperelastic models used for a description of the correlation of non-elastic materials (including hyperelastic resins) do not take into account the impact of a large number of variables determining the usefulness of ESD materials as expansion joint fillers. In particular, they do not take into consideration the materials’ adhesion to concrete surfaces and the strengthening control and deflection control areas.
5. Conclusions
An assessment has been proposed of the mechanical properties of ESD pseudoplastic materials for working joints of concrete structures, by means of a description fX (force, deformation and absorbed energy) on a force–deformation curve, in an axial tensile test.
It has been suggested that there is a need for a standardised test stand together with a reference specimen to enable a comparison of the obtained values of mechanical properties with a multiple of the established reference specimen. Such an assessment enables a comparison of the results of tests carried out at various research centres.
Quasi-plastic ESD fillers are recommended for joints in working concrete structures. The proportionality area (the range of stress, deformation and absorbed energy) determines the quality of the filler, whereas the strengthening control and deflection control areas contribute to the improvement of durability of concrete fillers and serve as an additional protection for sealants.
For ESD materials, it is not recommended to assess the destruction propagation area as that range generates too large deformation of pseudoplastic materials—with abilities to carry stress lower than fcr (Hooke’s law range).
Based on the proposed tests and analyses, it has been found that resin 1A—based on thixotropic acrylic—is the best ESD pseudoplastic specimen.
Author Contributions
K.S. conceived and designed the experimental work and completed the experiments; D.L. analysed the test results and performed editing; and K.W. prepared the specimens and analysed the test results. All authors have read and agreed to the published version of the manuscript.
Funding
This research received no external funding.
Conflicts of Interest
The authors declare no conflict of interest.
References
- Hajduk, P. Design of expansion joints in industrial floors and the most frequent causes of their damage-part I. Build. Eng. 2016, 1, 1–4. (In Polish). Available online: http://www.inzynierbudownictwa.pl/technika,materialy_i_technologie,artykul,projektowanie_dylatacji_podlog_przemyslowych_oraz_najczestsze_przyczyny_ich_uszkodzen___cz_i,8806 (accessed on 7 May 2020).
- Lohmeyer, G.; Eberling, K. Betonbóden fur Produktions- und Lagerhallen: Planung, Bemessung, Ausfuhrung. Verl. Bud Tech. 2012, 608. Available online: https://shop.verlagbt.de/bauplanung-ausfuehrung/betonboeden-fuer-produktions-und-lagerhallen.html (accessed on 7 May 2020).
- ACI 360R-10. Guide to Design of Slabson Ground, Reported by ACI Committee 360. Available online: https://www.concrete.org/Portals/0/Files/PDF/Previews/360R-10web.pdf (accessed on 7 May 2020).
- Ferrier, E.; Rabinovitch, O.; Michel, L. Mechanical behaviour of concrete resin/adhesive–FRP structural assemblies under low and high temperatures. Constr. Build. Mat. 2016, 127, 1017–1028. [Google Scholar] [CrossRef]
- Firmo, J.P.; Correia, J.R.; Pitta, D.; Tiago, C.; Arruda, M.R.T. Experimental characterization of the bond between externally bonded reinforcement (EBR) CFRP strips and concrete at elevated temperatures. Cem. Concr. Compos. 2015, 60, 44–54. [Google Scholar] [CrossRef]
- Patterson, B.A.; Busch, C.E.; Bratcher, M.; Cline, J.; Harris, D.E.; Masser, K.A.; Fleetwood, A.L.; Knorr, D.B., Jr. Influence of temperature dependent matrix properties on the high-rate impact performance of thin glass fiber reinforced composites. Compos. Part B 2020, 192. [Google Scholar] [CrossRef]
- Savaş Erdem, S.; Dawson, A.R.; Thom, N.H. Impact load-induced micro-structural damage and micro-structure associated mechanical response of concrete made with different surface roughness and porosity aggregates. Cem. Concr. Res. 2012, 42, 291–305. [Google Scholar] [CrossRef]
- Ozturk, H. Fracture mechanics interpretation of thin spray-on liner adhesion tests. Int. J. Adhes. Adhes. 2012, 34, 17–23. [Google Scholar] [CrossRef]
- Lee, A.T.; Michel, M.; Ferrier, E.; Benmokrane, B. Influence of curing conditions on mechanical behaviour of glued joints of carbon fibre-reinforced polymer composite/concrete. Constr. Build. Mater. 2019, 227, 116385. [Google Scholar] [CrossRef]
- Hassan, S.A.; Gholami, M.; Ismail, Y.S.; Sam, A.R.M. Characteristics of concrete/CFRP bonding system under natural tropical Climate. Constr. Build. Mat. 2015, 77, 297–306. [Google Scholar] [CrossRef]
- Du, J.; Bu, Y.; Shen, Z. Interfacial properties and nanostructural characteristics of epoxy resin in cement matrix. Constr. Build. Mat. 2018, 164, 103–112. [Google Scholar] [CrossRef]
- Li, Y.; Peng, S.; Miao, J.-T.; Zheng, L.; Zhong, J.; Wua, L.; Weng, Z. Isotropic stereolithography resin toughened by core-shell particles. Chem. Eng. J. 2020, 394, 124873. [Google Scholar] [CrossRef]
- Opelt, C.V.; Coelho, L.A.F. On the pseudo-ductility of nanostructured epoxy resins. Polym. Test. 2019, 78, 105961. [Google Scholar] [CrossRef]
- Gao, Y.; Romero, P.; Zhang, H.; Huang, M.; Lai, F. Unsaturated polyester resin concrete: A review. Constr. Build. Mat. 2019, 228, 116709. [Google Scholar] [CrossRef]
- Bellini, C.; Polini, W.; Sorrentino, L.; Turchetta, S. Mechanical performances increasing of natural stones by GFRP sandwich structures. Proced. Struct. Integr. 2018, 9, 179–185. [Google Scholar] [CrossRef]
- Norma ISO 37:2017. Rubber, Vulcanized or Thermoplastic—Determination of Tensile Stress-Strain Properties, Szwajcaria. Available online: https://www.iso.org/standard/68116.html (accessed on 7 May 2020).
- Norma AS 1145.1-2001, Determination of Tensile Properties of Plastics Materials General Principles, Australia. Available online: https://www.standards.org.au/standards-catalogue/sa-snz/manufacturing/pl-010/as--1145-dot-1-2001 (accessed on 7 May 2020).
- Norma, JIS K 6251. Rubber, Vulcanized or Thermoplastic-Determination of Tensile Stress-Strain Properties, Japonia. 2017. Available online: https://global.ihs.com/doc_detail.cfm?document_name=JIS%20K%206251&item_s_key=00256583 (accessed on 7 May 2020).
- Norma AS/NZS 1660.2.3:1998. Test Methods for Electric Cables, Cords and Conductors Insulation, Extruded Semi-Conductive Screens and Non-Metallic Sheaths—Methods Specific to PVC and Halogen Free Thermoplastic Materials, Australia. Available online: https://www.saiglobal.com/PDFTemp/Previews/OSH/as/as1000/1600/16603.pdf (accessed on 7 May 2020).
- Norma DIN 53504. Testing of Rubber—Determination of Tensile Strength at Break, Tensile Stress at Yield, Elongation at Break and Stress Values in a Tensile Test, Niemcy. 2017. Available online: https://global.ihs.com/doc_detail.cfm?document_name=DIN%2053504&item_s_key=00028732 (accessed on 7 May 2020).
- Norma ASTM D412-16. Standard Test Methods for Vulcanized Rubber and Thermoplastic Elastomers—Tension, USA. 2016. Available online: https://global.ihs.com/doc_detail.cfm?rid=BSD&document_name=ASTM%20D412 (accessed on 7 May 2020).
- Norma ISO 6259-3:2015. Thermoplastics Pipes—Determination of Tensile Properties—Part 3: Polyolefin Pipes, Szwajcaria. 2015. Available online: https://www.iso.org/standard/62421.html (accessed on 7 May 2020).
- Norma BS 2782-3:Methods 320A to 320F:1976. Methods of Testing Plastics. Mechanical Properties. Tensile Strength, Elongation and Elastic Modulus, Wielka Brytania. 1976. Available online: https://shop.bsigroup.com/ProductDetail?pid=000000000000037491 (accessed on 7 May 2020).
- Norma ASTM D882-18. Standard Test Method for Tensile Properties of Thin Plastic Sheeting, USA. 2018. Available online: https://www.astm.org/Standards/D882 (accessed on 7 May 2020).
- Norma ASTM D412-16. Standard Test Methods for Vulcanized Rubber and Thermoplastic Elastomers-Tension, USA. 2016. Available online: https://www.astm.org/Standards/D412 (accessed on 7 May 2020).
- Norma ISO 1798:2008. Flexible Cellular Polymeric Materials—Determination of Tensile Strength and Elongation at Break, Szwajcaria. 2008. Available online: https://www.iso.org/standard/41059.html (accessed on 7 May 2020).
- Sułowski, M.; Ciesielka, M.; Jurczak-Kaczor, P. Tension curve analysis in technical education. In Proceedings of the III Conference e-Technologies in Engineering Education eTEE’2016, Stanisław Staszic AGH University of Science and Technology, Krakow, Poland, 11 April 2016; (In Polish). Available online: http://yadda.icm.edu.pl/yadda/element/bwmeta1.element.baztech-704015f0-eed1-4406-9703-bade596497b2/c/ZN_WEiA_PG_48-13.pdf (accessed on 7 May 2020).
- Ziobro, J. Multiaxial stress and strain analysis for rubber based on natural rubber NR. Science Journals of Rzeszów University of Technology 288. Mechanics 2013, 85, 197–206. (In Polish). Available online: http://oficyna.prz.edu.pl/download/hGKmo6Cj9JUSAlejUodH9BIX4-NEpbd299dEd_LWQoIk99NiUALQ,rVIXoyCjMyG2EefjUfODQ6dih5MgJHLSw1LhMsZTY6MQdoIG1AcTJaPA/mech-85-02-13-pw-1.pdf (accessed on 7 May 2020).
- Lechman, M.; Mazurczuk, R.; Fedorczyk, Z. Tests of elastomers in complex states of strain. ITB Q. 2010, 152. (In Polish). Available online: http://yadda.icm.edu.pl/yadda/element/bwmeta1.element.baztech-article-BTB2-0060-0060/c/Lechman.pdf (accessed on 7 May 2020).
- Norma PN-EN 1337-3:2005. Structural Bearings–Elastomeric Bearings. (In Polish). Available online: https://sklep.pkn.pl/pn-en-1337-3-2005d.html (accessed on 7 May 2020).
- Logoń, D. FSD cement composites as a substitute for continuous reinforcement. In Eleventh International Symposium on Brittle Matrix Composites BMC-11; Andrzej, M., Ed.; Brandt Warsaw: Institute of Fundamental Technological Research: Warsaw, Poland, 28–30 September 2015; pp. 251–260. Available online: http://www.ippt.pan.pl/en/home/72-aktualnosci/ippt-info/1436-brittle-matrix-composites-bmc-12-at-ippt-pan.html (accessed on 7 May 2020).
- Logoń, D. Identification of the Destruction Process in Quasi Brittle Concrete with Dispersed Fibers Based on Acoustic Emission and Sound Spectrum. Materials 2019, 12, 2266. [Google Scholar] [CrossRef] [PubMed]
- Norma ASTM 1018. Standard Test Method for Flexural Toughness and First Crack Strength of Fiber–Reinforced Concrete. Philadelphia, USA Vol.04.02. 1992. Available online: https://www.astm.org/Standards/C1018.htm (accessed on 7 May 2020).
- Norma EN 14651. Test Method for Metallic Fibre Concrete. Measuring the Flexural Tensile Strength (Limit of Proportionality (LOP), Residual). Available online: https://shop.bsigroup.com/ProductDetail/?pid=000000000030160504 (accessed on 11 July 2005).
- JCI. Japan Concrete Institute Standard. Method of Test for Bending Moment–Curvature Curve of Fiber-Reinforced Cementitious Composites, S-003-2007. (2003) Method of Test for Load-Displacement Curve of Fiber Reinforced Concrete by Use of Notched Beam. (2003) Method of Test for Fracture Energy of Concrete by Use of Notched Beam. Available online: https://www.jci-net.or.jp/j/jci/study/jci_standard/JCI-S-003-2007-e.pdf (accessed on 7 May 2020).
- Logoń, D. Hybrid reinforcement in SRCC concrete. In Proceedings of the Third International Conference on Sustainable Construction Materials and Technologies SCMT3, Kyoto, Japan, 18–21 August 2013; paper ID: e154. Available online: http://www.claisse.info/2013%20papers/data/e154.pdf (accessed on 7 May 2020).
- Bergstrom, J. Mechanics of Solid Polymers Theory and Computational Modeling; Elsevier: Amsterdam, The Netherlands, 2015; p. 520. Available online: https://www.elsevier.com/books/mechanics-of-solid-polymers/bergstrom/978-0-323-31150-2 (accessed on 7 May 2020).
- Zhao, Z.; Mu, X.; Du, F. Modeling and Verification of a New Hyperelastic Model for Rubber-Like Materials. Math. Probl. Eng. 2019. [Google Scholar] [CrossRef]
© 2020 by the authors. Licensee MDPI, Basel, Switzerland. This article is an open access article distributed under the terms and conditions of the Creative Commons Attribution (CC BY) license (http://creativecommons.org/licenses/by/4.0/).