Article

Preparation and Characterization of Paramagnetic Bis (8-Hydroxyquinoline) Manganese Crystals

The Mathematics and Physical Science Centre, Dalian University of Technology, 2 Dagong Road, Liaodongwan New District, Panjin 124221, China
*
Author to whom correspondence should be addressed.
Materials 2020, 13(10), 2379; https://doi.org/10.3390/ma13102379
Submission received: 30 December 2019 / Revised: 16 May 2020 / Accepted: 19 May 2020 / Published: 21 May 2020
(This article belongs to the Special Issue 2D Materials for Energy Storage and Conversion)

Abstract

:
The magnetic properties of π-conjugated bis (8-hydroxyquinoline) manganese (Mnq2) crystals are investigated. Rod-shaped Mnq2 crystals are prepared by using the physical vapor deposition method. Field emission scanning electronic microscopy spectra show that the Mnq2 nanorods have perfect plane quadrangular ends. Energy dispersive spectrometer and X-ray photoelectron spectroscopy analysis demonstrates that the powders and nanorods are the same compound with a high purity. X-ray diffraction analysis shows the high crystal quality of the prepared Mnq2 nanorods. The magnetic measurement, using alternating gradient magnetometer and magnetic property measurement system superconducting quantum interference device vibrating sample magnetometer, indicates that the prepared Mnq2 nanorods show a paramagnetic property at room temperature. First-principles density functional theory (DFT) calculations are used to study the electronic structure and magnetic properties of the prepared Mnq2 crystals. DFT calculations show that the magnetic moment of the Mnq2 isolated molecule is 5 μB, which mainly comes from the localized Mn 3d orbital. The energy difference between the antiferromagnetic and ferromagnetic states of the Mnq2 monoclinic cell is only 0.1 meV, which may explain the paramagnetic property observed in the prepared Mnq2 nanorods and also indicates the difficulty of preparing intrinsic ferromagnetic Mnq2 crystals.

1. Introduction

The π-conjugated 8-hydroxyquinoline metal complexes have been widely used in organic light-emitting devices and organic solar cells due to their excellent optoelectronic properties [1,2,3,4]. Moreover, the well-known tris (8-hydroxyquinoline) aluminum (Alq3) has been found to have a wide application in organic spintronic devices because of its large spin relaxation length [5,6]. Since the discovery of giant magnetoresistance in multilayered devices which use Alq3 as the spin transporting layer, there has been increasing interest in 8-hydroxyquinoline-based organic magnets owing to their special properties, for example, the conductivity matching and lattice matching between the organic transporting layer and the electrode in organic spintronic devices [6,7,8].
Compared with its organic, semiconducting and photoelectric properties, scarce research on the magnetic properties of 8-hydroxyquinoline small molecules has been reported, which is mainly because the commonly used 8-hydroxyquinoline small molecules, such as Alq3 and Gaq3, generally do not exhibit magnetic behavior [9,10]. In 2008, Baik et al., introduced ferromagnetism into Alq3 molecules by doping Co metal [11]. Our research group prepared several 8-hydroxyquinoline-based magnets by coevaporating organic materials and dopants [10,12,13]. For 8-hydroxyquinoline transition metal complexes Mqx (M = Mn, Fe, Co, etc., and x = 2 or 3), the 3d orbital of the transition metals can provide the local magnetic moment. In 2011, Monzon et al. systematically researched the magnetic properties of several 8-hydroxyquinoline transition metal complexes existing in the form of powder or film and found that all of the researched 8-hydroxyquinoline transition metal complexes exhibited weak paramagnetic properties [14]. In powder or film state, the organic materials are amorphous and long-range disordered. It is difficult to form an effective ferromagnetic exchange coupling between the local magnetic moments. Due to the size and surface effects, the crystalline nanostructure may change the properties of the materials [15,16,17]. However, the effect of a crystalline structure on the magnetic properties of 8-hydroxyquinoline transition metal complexes has not been reported before. In this work, Mnq2 crystals were prepared by using a double-zone tubular furnace, and the electronic structure and magnetic properties of Mnq2 crystals were studied experimentally and theoretically.

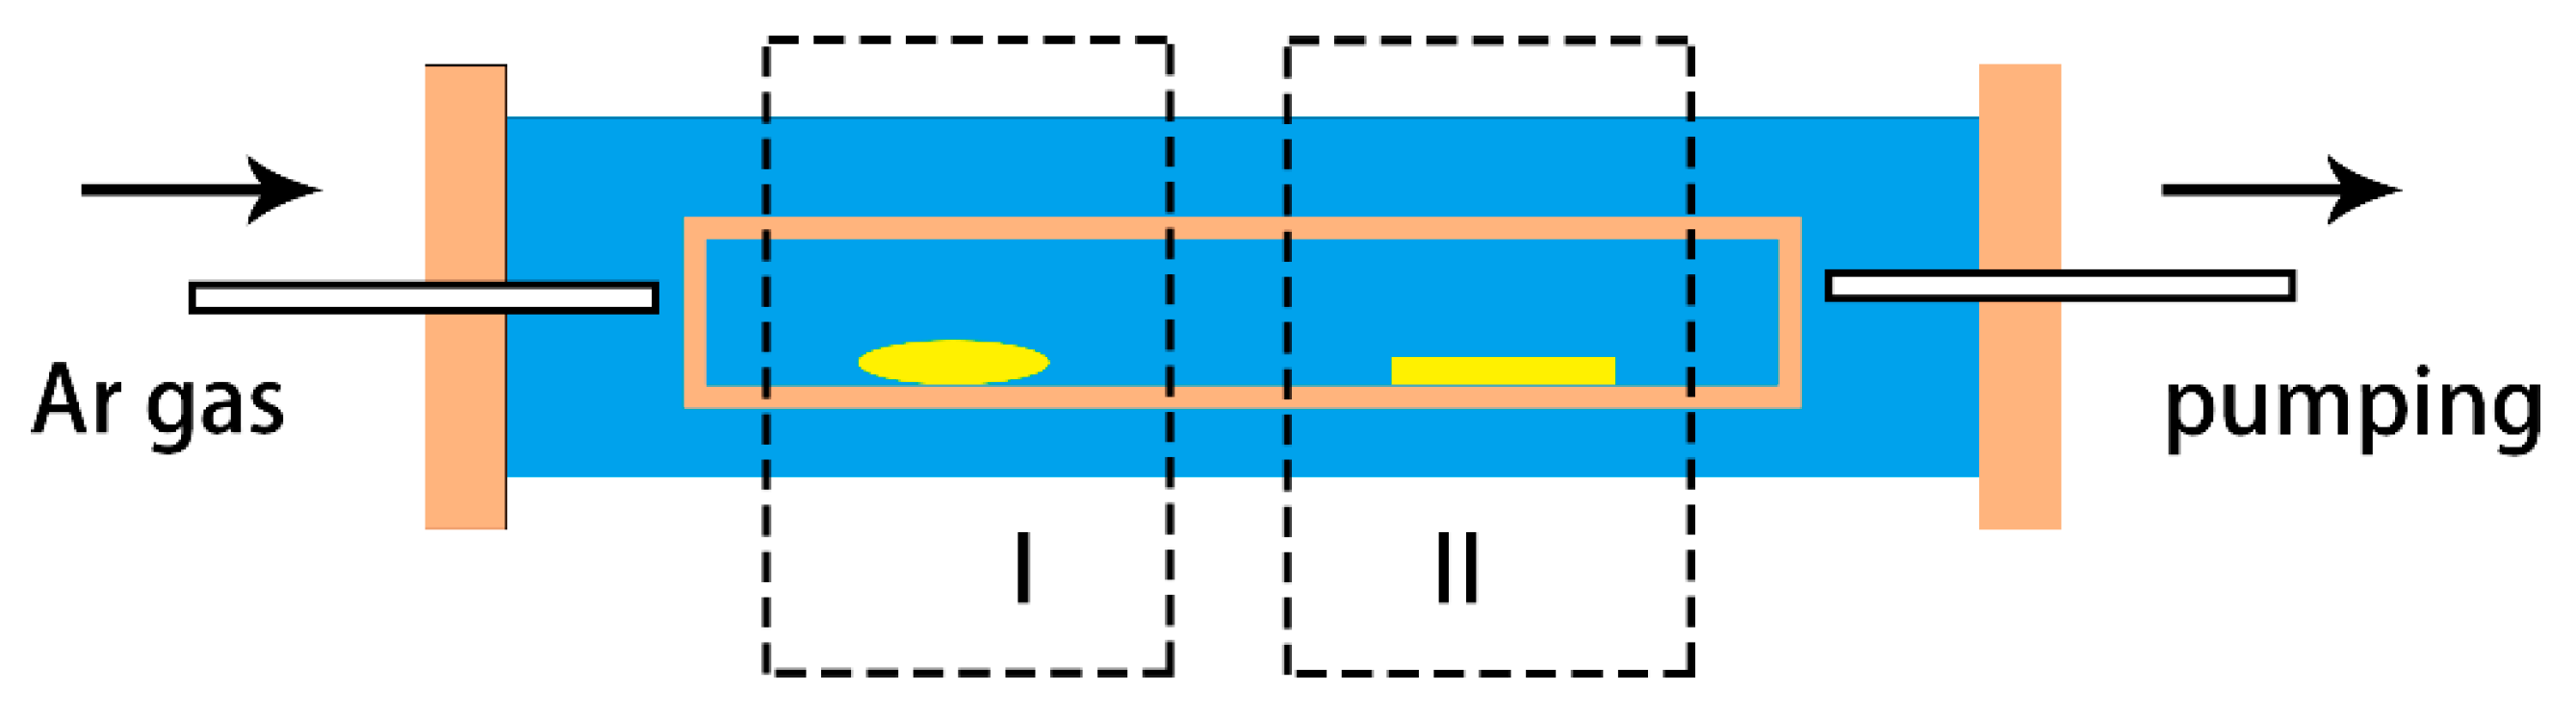
2. Experimental Details

Mnq2 crystals were prepared by using the physical vapor deposition (PVD) method in an OTF-1200X-II dual-zone tubular furnace. Figure 1 shows the diagrammatic sketch of the tubular furnace, where region I is the sublimation zone and region II is the crystalline zone. Resistance wires surrounded the quartz tube at equal distance in order to obtain a uniform temperature distribution. The temperatures of the two zones were constantly monitored by using a thermocouple, and the temperature upgrade speeds were set to be 10 °C/min. The temperatures of the sublimation and the crystalline zones were 425 °C and 275 °C, respectively. The crystal growth time was 300 min, then the two zones were cooled down to room temperature naturally. The flow rate of Ar carrier gas (99.999%) was 0.35 L/min. The Ar gas plays the role of carrier gas and protective gas from the air and moisture. The Mnq2 powders (99%, purchased from Nichem company, Taiwan, Taiwan) were placed in the sublimation zone, and the Si (100) substrate was placed in the crystalline zone. The Si substrate was cleaned by ultrasonic cleaning in deionized water and absolute alcohol for 15 min in turn, then it was degreased in acetone. Before the preparation, the tubular furnace was washed with Ar gas three times to remove the air and moisture in case the Mnq2 molecules decomposed into 8-hydroxyquinoline at high temperature [18,19]. The surface morphology of the samples was characterized by field emission scanning electronic microscopy (FESEM nona nano450, FEI company, Hillsboro, OR, USA). The chemical composition of the powders and the crystals was investigated using an energy dispersive spectrometer (EDS, ATMETEK, Inc., Berwyn, PA, USA) and X-ray photoelectron spectroscopy (XPS ESCALAB 250xi, Thermo Fisher Scientific, Waltham, MA, USA). The structure of Mnq2 crystals was investigated by using X-ray diffraction (XRD, RigakuUltima IV X-ray diffractometer with Cu kα1 radiation, Rigaku Corporation, Tokyo, Japan). The room-temperature magnetic properties of the Mnq2 powders and crystals were measured using an alternating gradient magnetometer (AGM, MicroMag 2900, Lake Shore Cryotronics Inc., Westerville, OH, USA). The magnetic properties at different temperatures were measured using magnetic property measurement system superconducting quantum interference device vibrating sample magnetometer (MPMS SQUID VSM, Quantum Design company, Santiago, CA, USA).

3. Computational Methods

The calculations were performed using the CASTEP code. Generalized gradient approximation applied by Perdew−Burke−Ernzerhof [20] was adopted to estimate the exchange-correlation function. The cut-off energy was set at 450 eV and the valence configuration of Mn was 3d54s2. The lattice parameters used for the calculation of the monoclinic cell which contains two Mnq2 molecules are a = 10.930 Å, b = 4.885 Å, c = 15.184 Å, α = 90.000, β = 121.210, γ = 90.000 [21]. For the Brillouin zone sampling, 1 × 1 × 1 Monkhorst−Pack [22] k mesh was used for the isolated Mnq2 molecule while 1 × 3 × 1 Monkhorst−Pack k mesh was used for the Mnq2 monoclinic cell. The structure relaxation was fully carried out until the forces on each ion were less than 0.01 eV/Å.

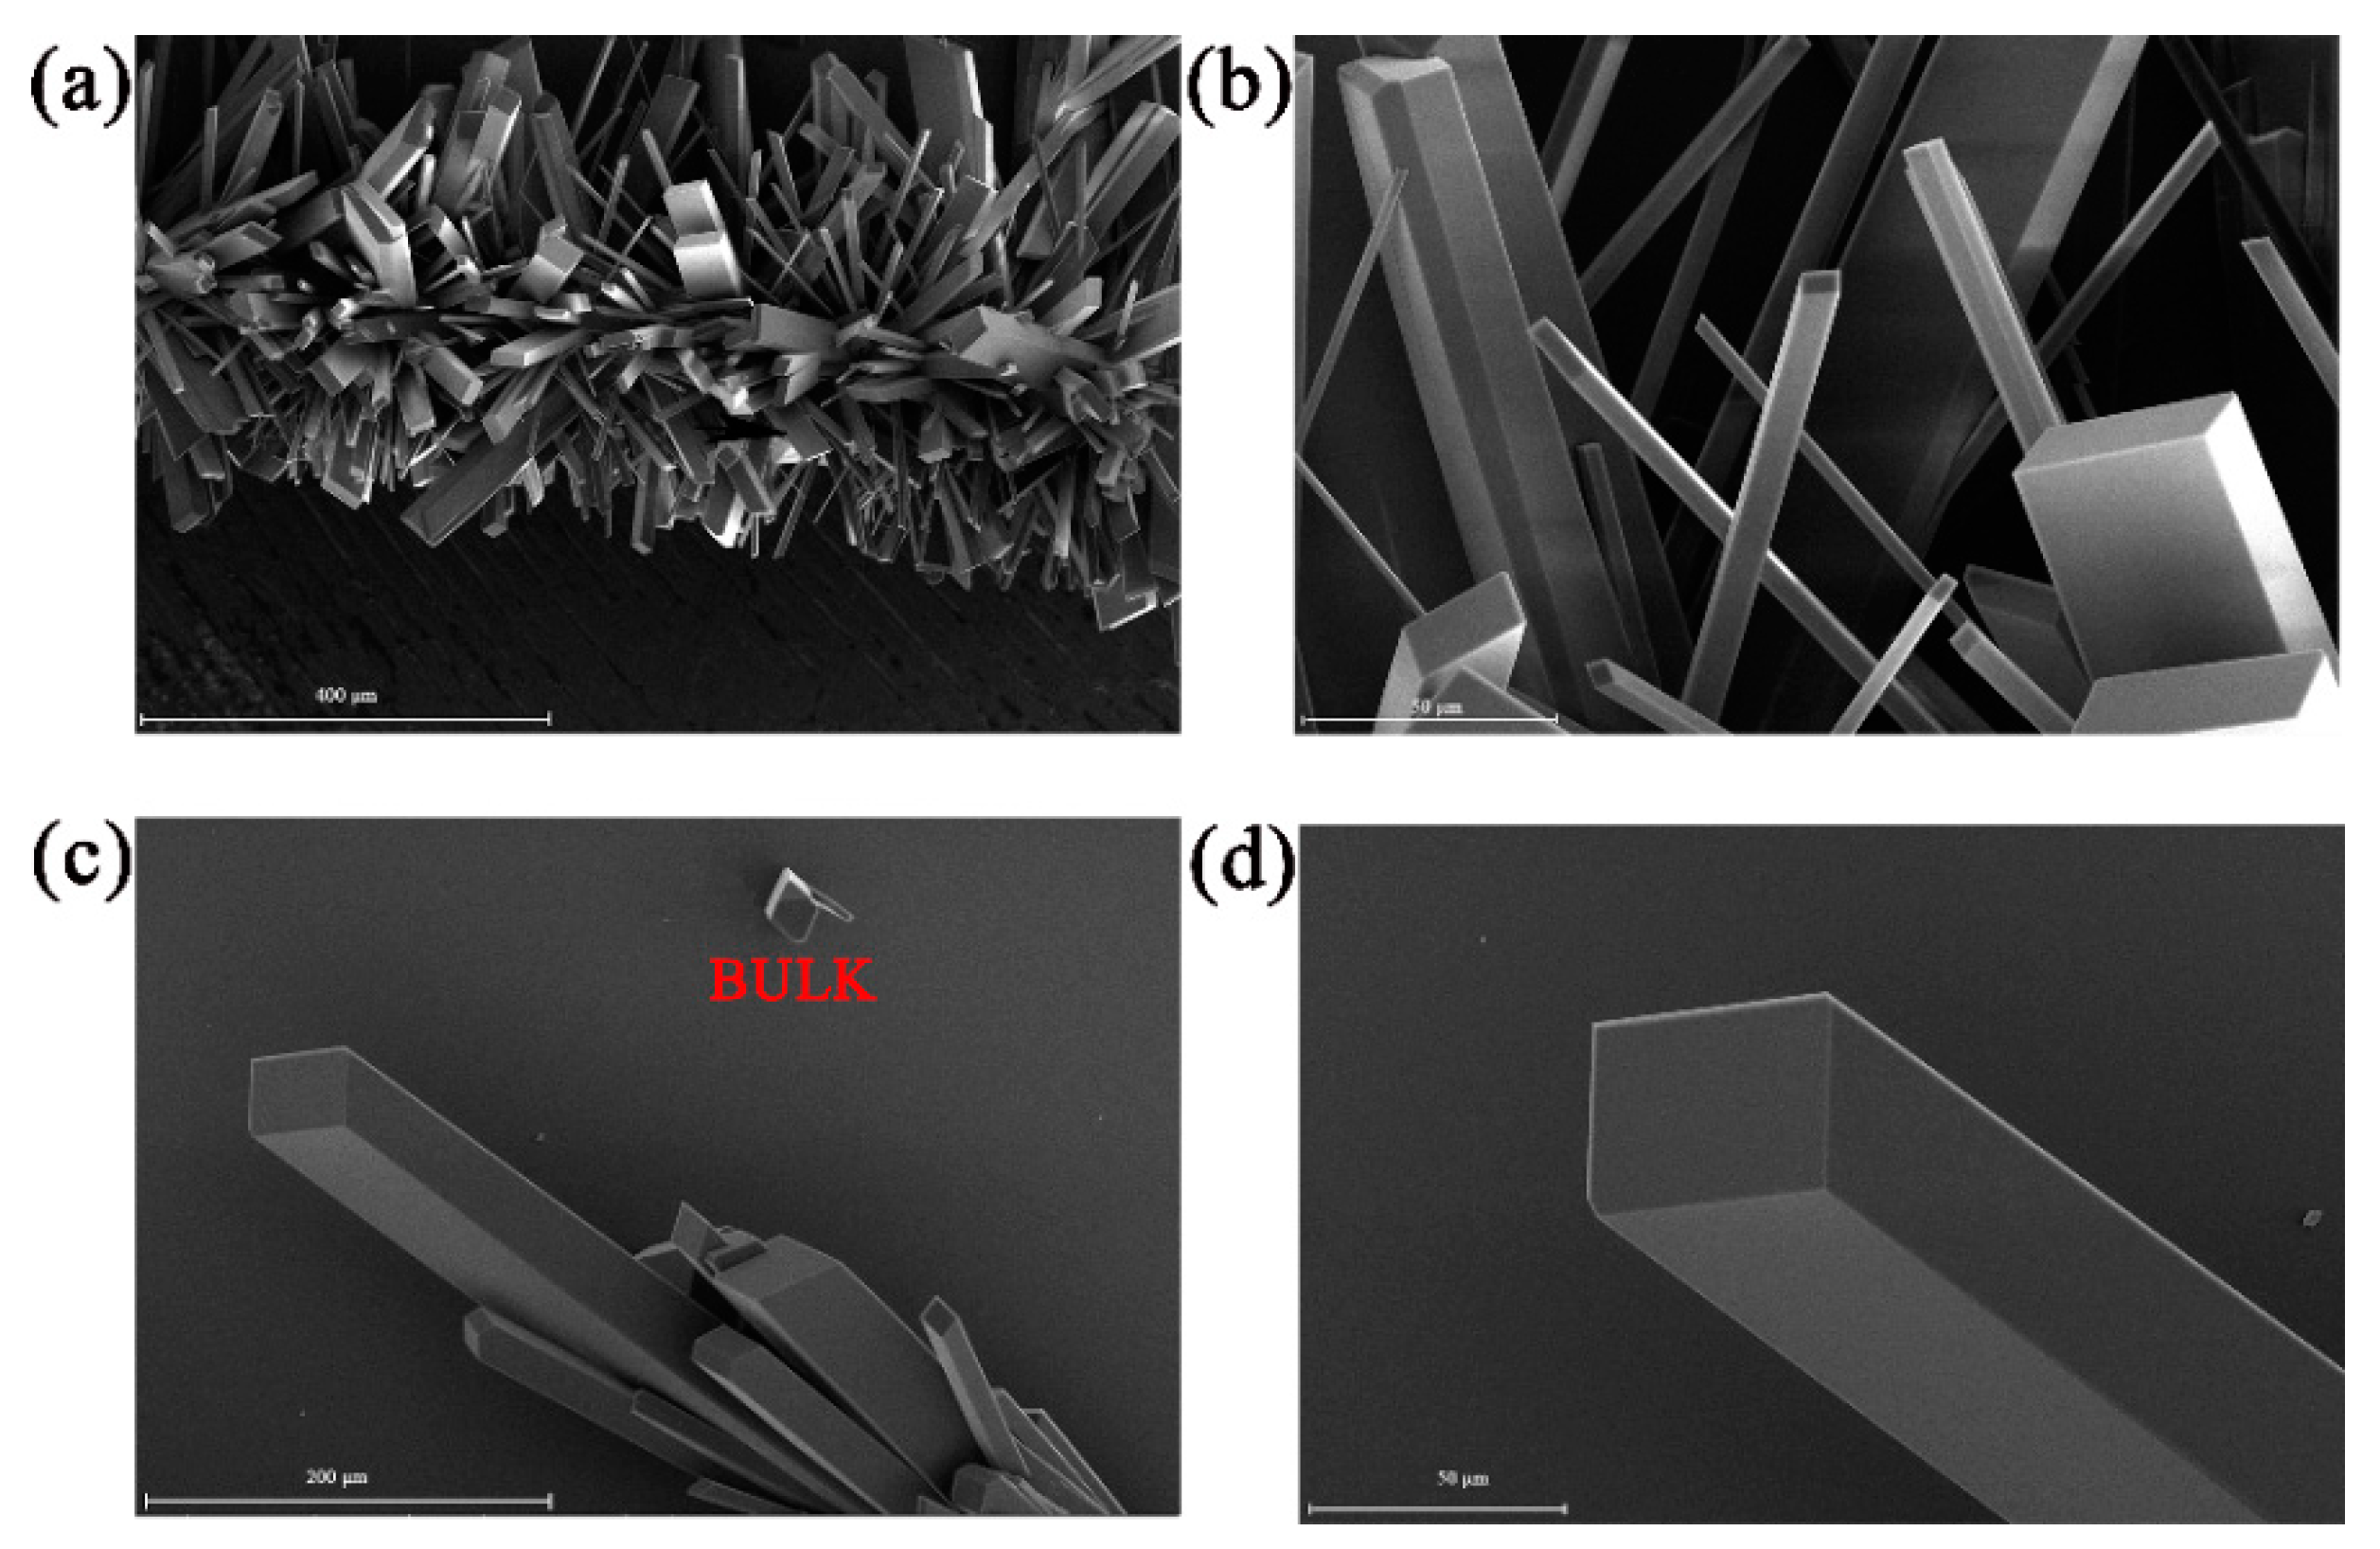
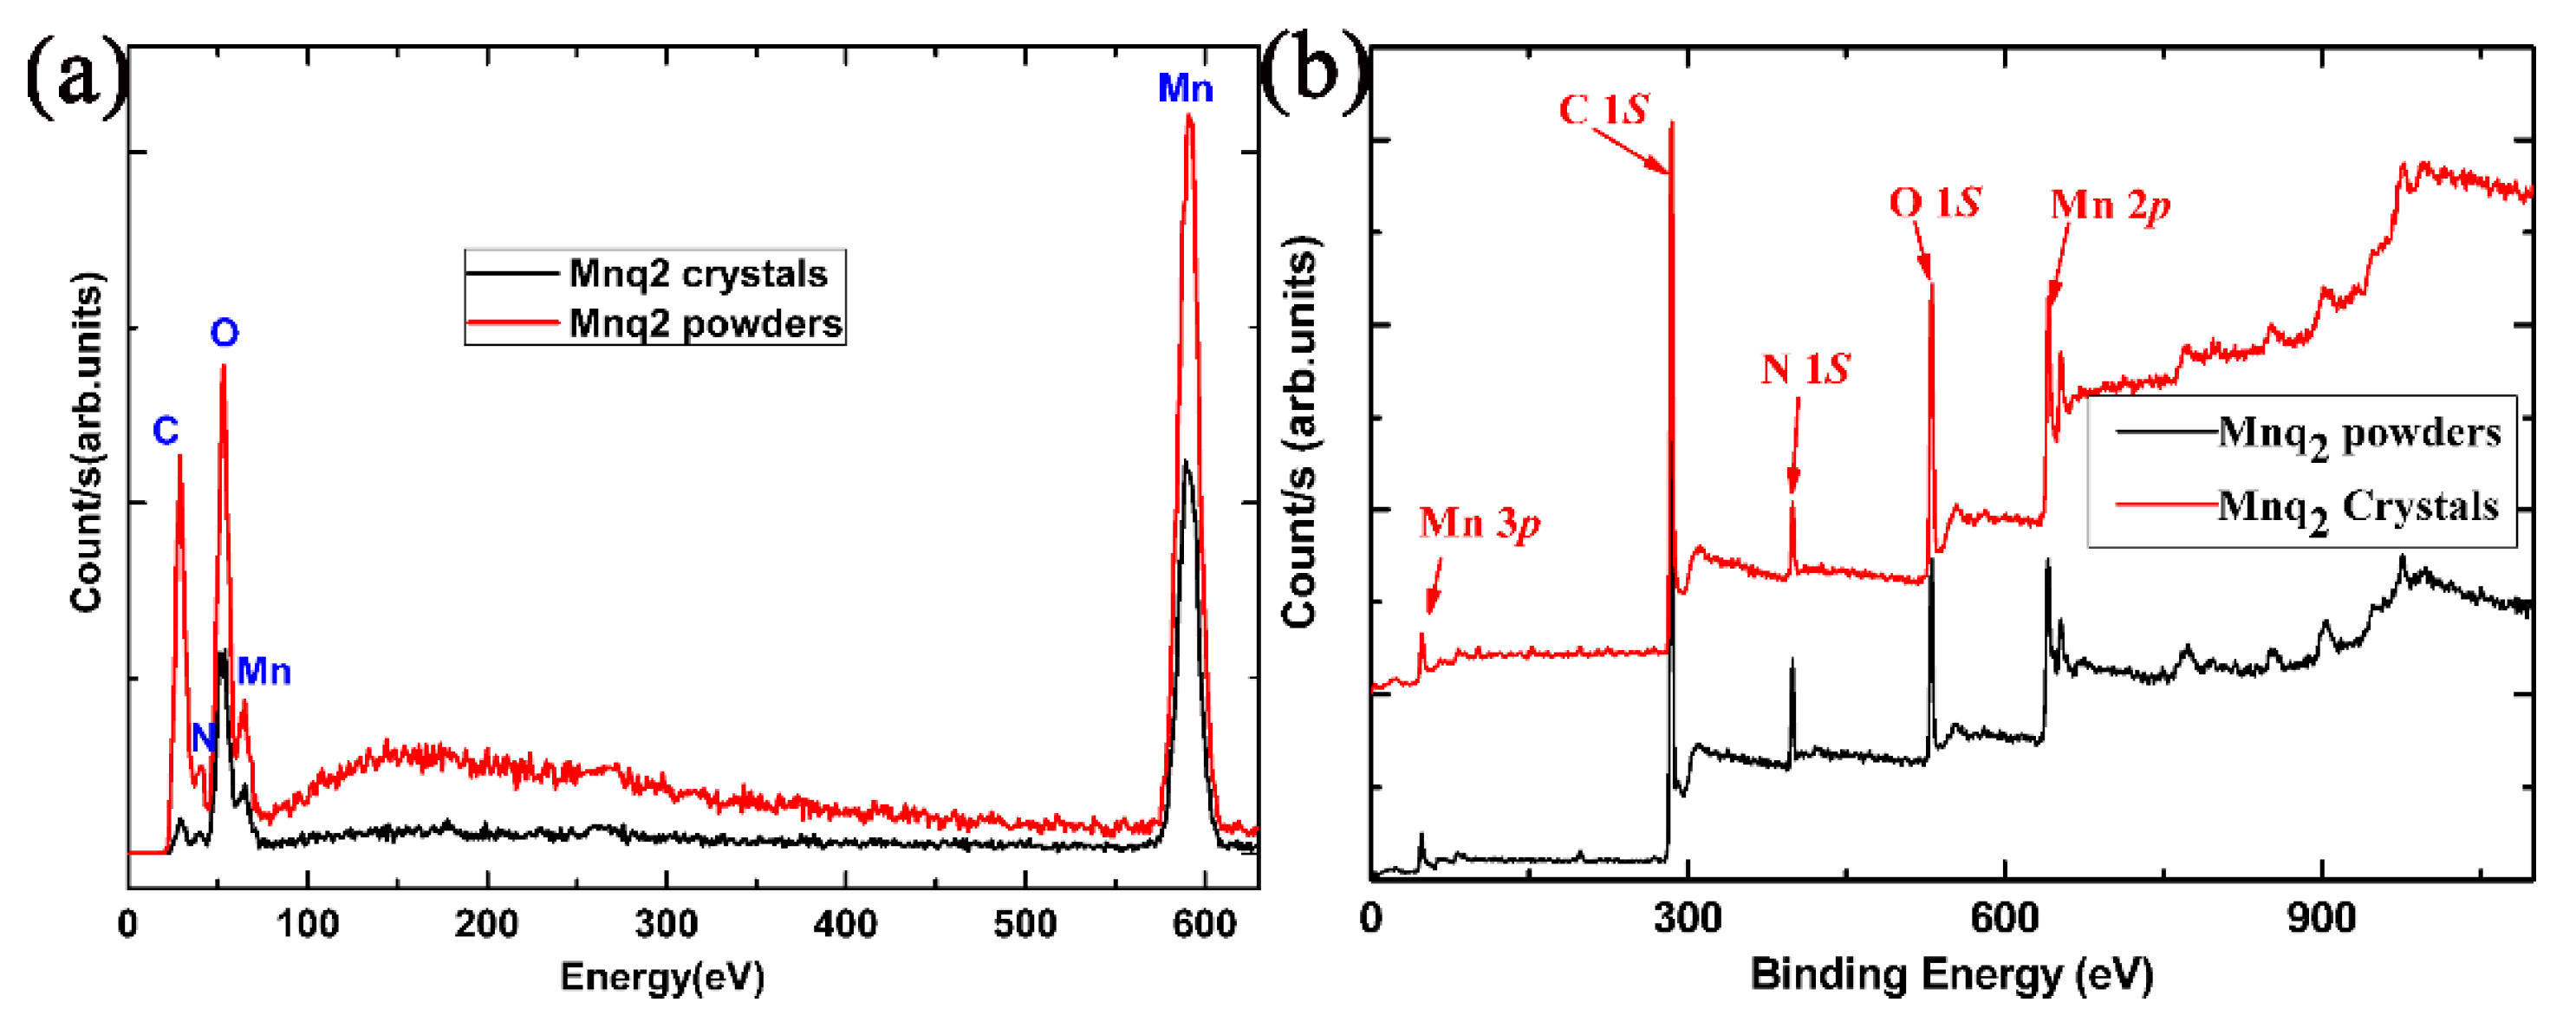
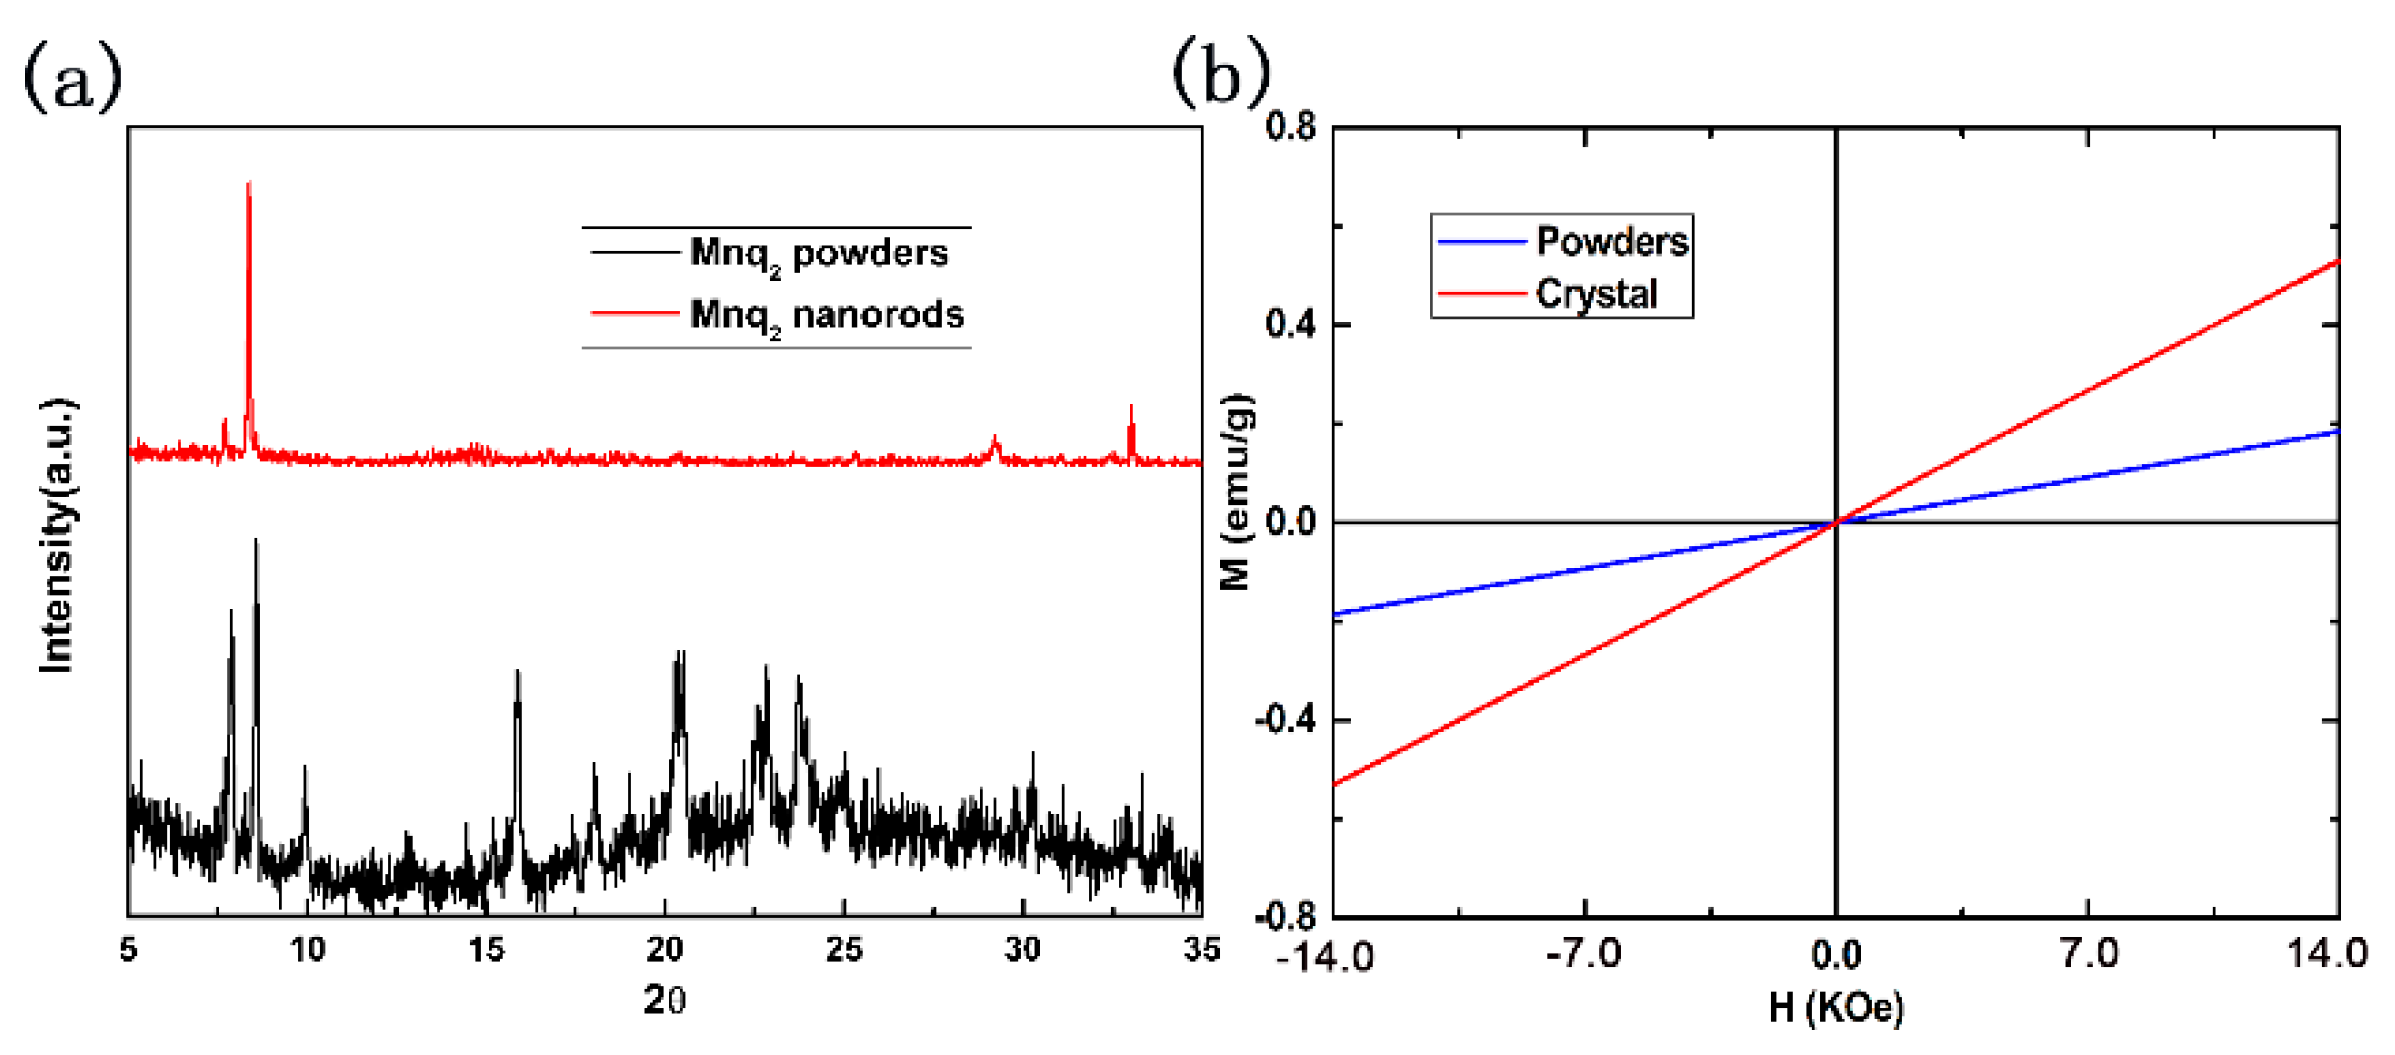
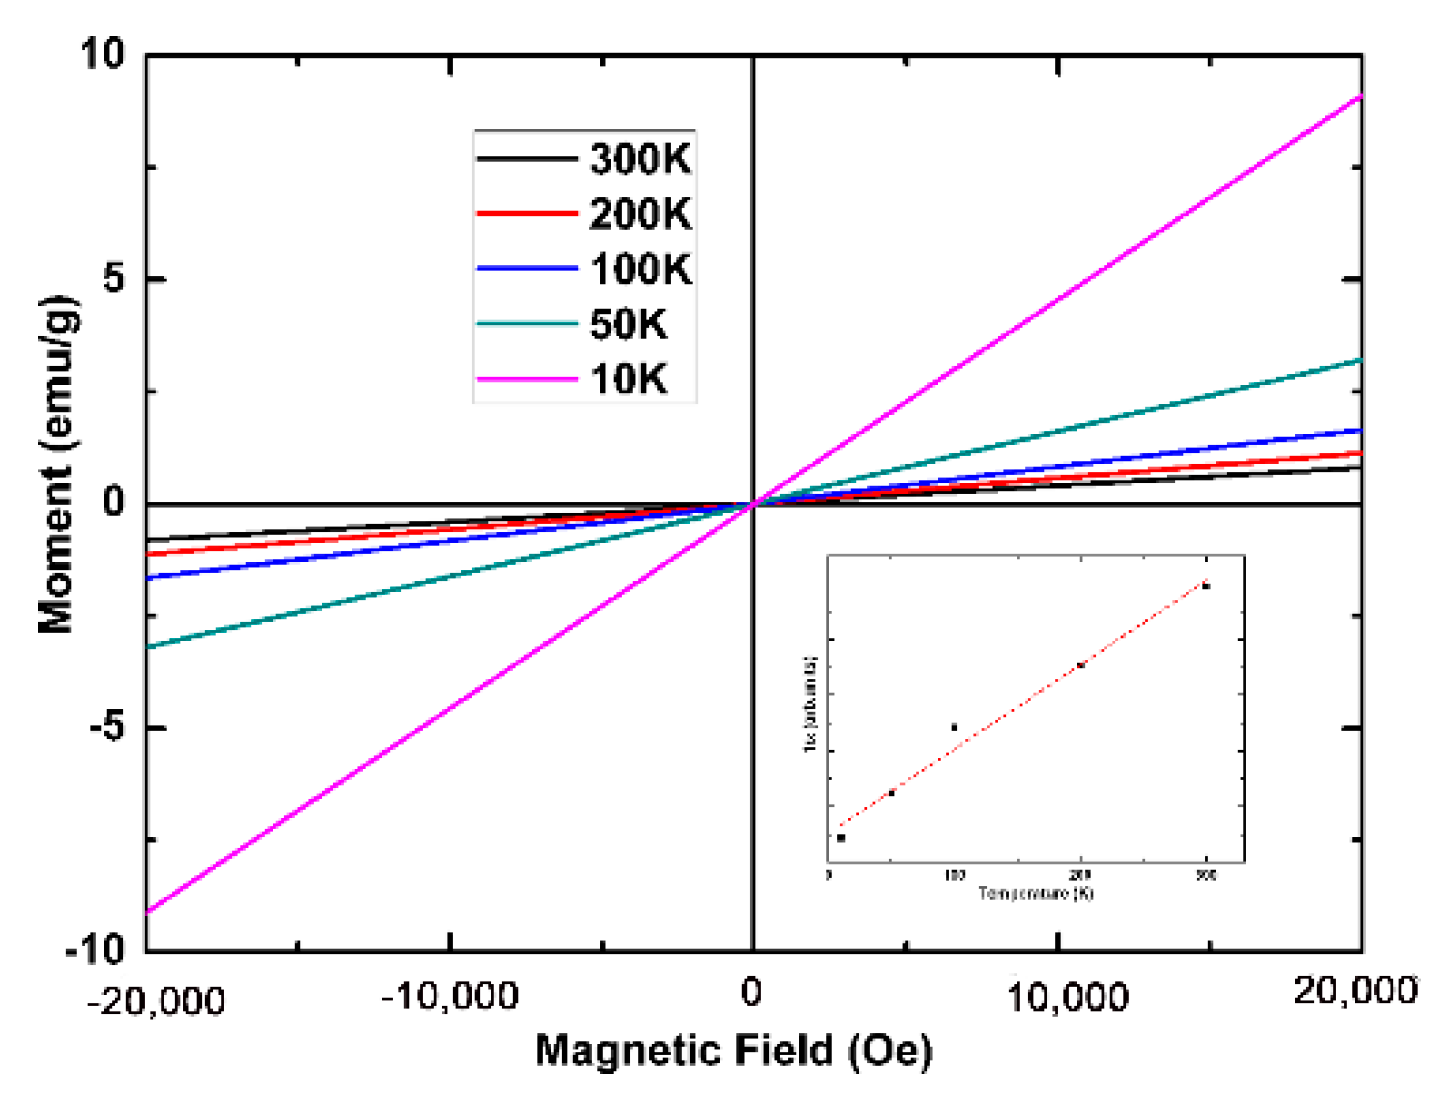
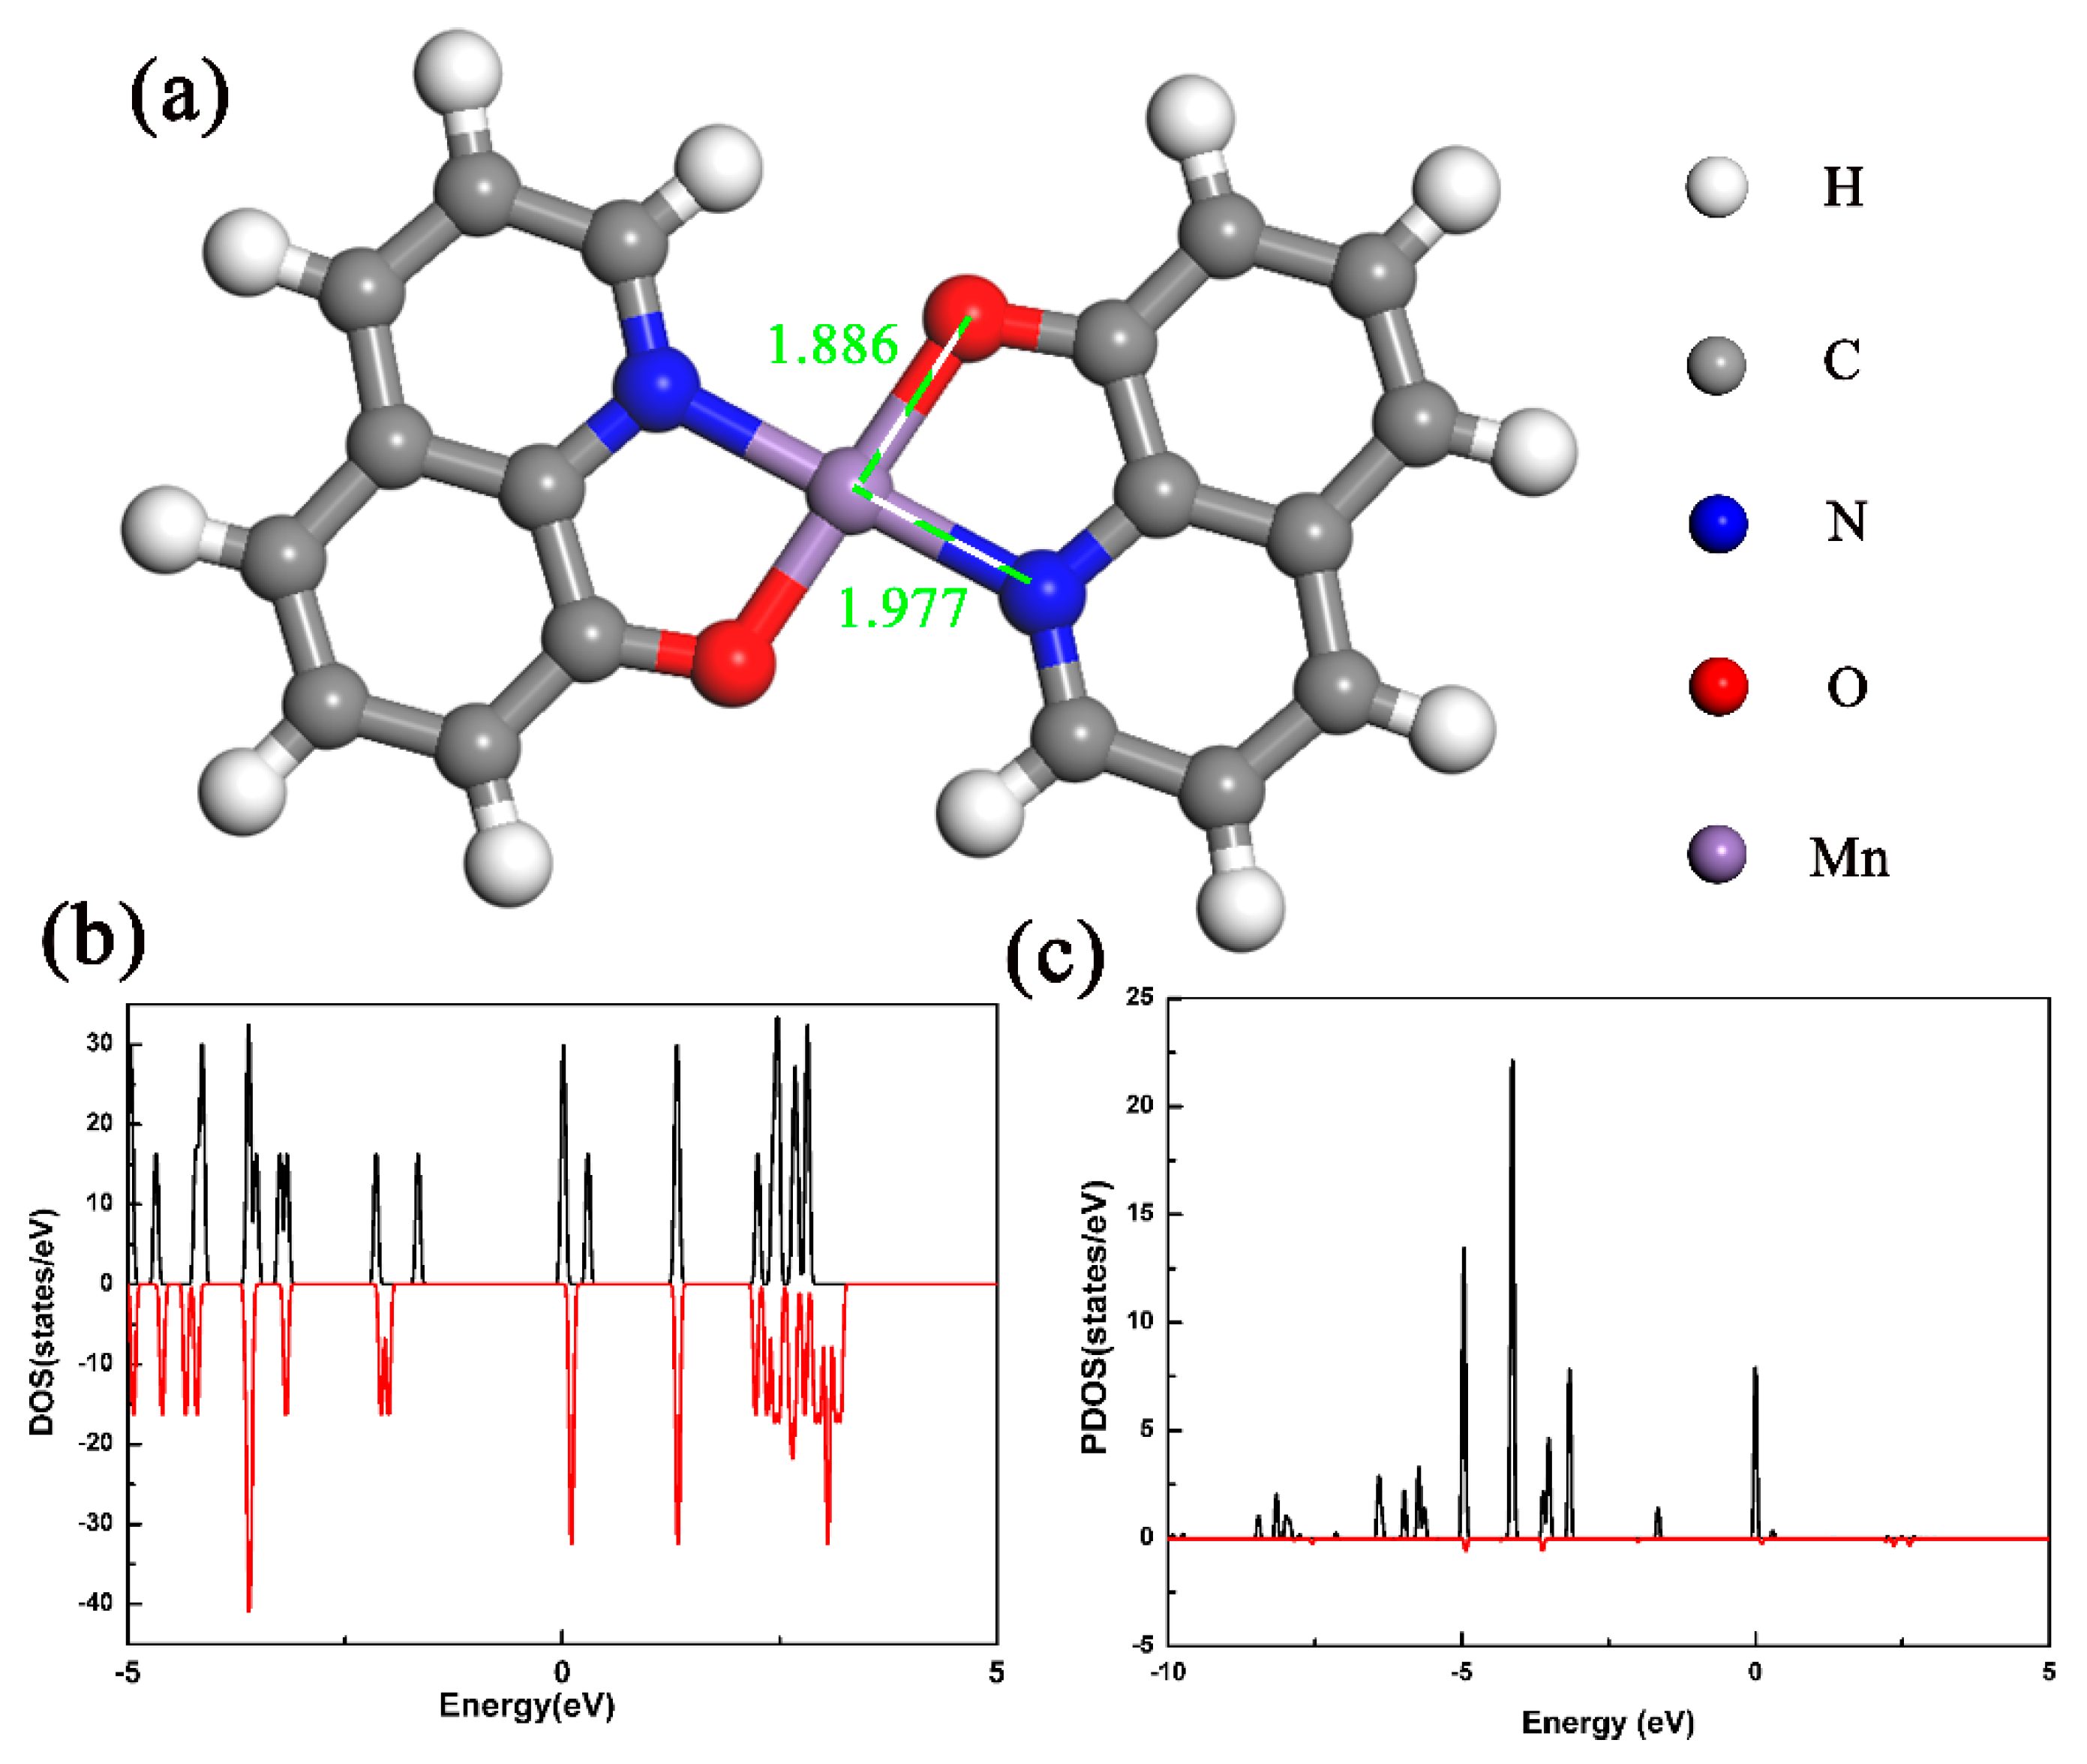
4. Results and Discussion

Figure 2 shows the SEM images of the prepared Mnq2 crystals. Regular rod-shaped Mnq2 crystals with random distribution could be observed from the SEM images. Most of the prepared Mnq2 nanorods had perfect plane quadrangular ends, as shown in Figure 2a,b. The end size of the Mnq2 nanorods was dozens of microns, and most of their lengths exceeded 200 microns. There were no obvious defects on the surface of the Mnq2 nanorods as shown in the SEM images, implying high crystal quality of the prepared Mnq2 nanorods. The excellent crystal quality might be caused by the low crystal growth rate, the pure growth conditions and the weak perturbation [23]. As shown in Figure 2c,d, there were small numbers of crystalline bulks on the surface of the Si substrate. The mechanism of crystal growth might be that the Mnq2 molecules carried by Ar gas aggregated to form a nucleation around the residual impurity or the root of the formed Mnq2 nanorods. As the process continued, the strong π-π interaction between pairs of quinoline ligands of the depositive Mnq2 and the gaseous Mnq2 molecules led to the formation and growth of Mnq2 nanorods along a special direction [24].
Figure 3a shows the EDS spectra of the Mnq2 powders and prepared Mnq2 nanorods. The peaks which stood for C, N, O, Mn elements existed in both the powders’ and nanorods’ spectra. Beyond that, there were no peaks appearing in either of the two spectra, showing that the Mnq2 powders and prepared Mnq2 nanorods had the same chemical composition, and there were almost no impurities in either the powders or the nanorods. Figure 3b is the XPS spectra of survey for the Mnq2 powders and nanorods. From the survey spectra in Figure 3b, the peak positions which stood for the C 1s, N 1s, O 1s and Mn 2p core levels located at 285, 399, 532 and 641 eV, respectively, could be found in both the powders and the nanorods. The EDS and XPS measurements demonstrated that the powders and nanorods were the same compound and both were of good purity.
Figure 4a shows the XRD diffractogram of the Mnq2 powders and prepared Mnq2 nanorods. The number of diffraction peaks in the XRD patterns of Mnq2 powders was large, and the baseline was not straight. Compared with the XRD spectra of the powders, the baseline of the Mnq2 nanorods was almost horizontal, and the full width at half maximum of the diffraction peak was smaller, indicating that the prepared Mnq2 nanorods had a high crystal quality. Four sharp diffraction peaks appeared at 2θ = 7.7, 8.3, 29.2 and 32.9˚. These four diffraction peaks also existed in the XRD diffractogram of the Mnq2 powders. Beyond these four diffraction peaks, there were a number of diffraction peaks at different angles in the XRD diffractogram of the Mnq2 powders and the XRD diffractogram of Mnq2 powders was broad. This result showed that there existed the same crystalline phase in the Mnq2 powders as in the prepared Mnq2 crystals. Beyond that, there existed other crystalline phase(s) with a quantity of amorphous powders in the Mnq2 powders [25]. The XRD diffractogram indicated that the growth process increased the degree of crystallinity of Mnq2.
Figure 4b shows the magnetization curves of Mnq2 powders and nanorods with the same weight (1.36 mg) measured by AGM at room temperature. The Mnq2 powders exhibited paramagnetic properties at room temperature, which was consistent with the previous report [14]. The magnetization was 0.18 emu/g at 14,000 Oe. Transition from Mnq2 powders to Mnq2 nanorods did not change the magnetic property of the sample. The Mnq2 nanorods still exhibited a paramagnetic property. The difference is that the magnetization of Mnq2 nanorods was much larger than that of Mnq2 powders with the same weight, which was 0.53 emu/g at 14,000 Oe. As shown in the SEM image and XRD diffractogram, the Mnq2 nanorods had a higher degree of crystallinity than the Mnq2 powders. The larger crystalline grain size of Mnq2 nanorods reduced the degree of magnetic moment confusion on the surface, so the loss of magnetic moment caused by surface magnetic moment was reduced. On the other hand, the higher degree of crystallinity for the Mnq2 nanorods may have brought about a stronger crystalline field, making the magnetic moments more orderly. These factors increased the magnetization of Mnq2 nanorods.
Figure 5 shows the magnetization curves of the prepared Mnq2 nanorods at different temperatures measured by MPMS SQUID VSM. The weight of the test sample was 11.03 mg. The magnetization of the nanorods at 20,000 Oe was 0.81 emu/g at 300 K. The Curie constant was calculated to be 4.17 emu K/mol. The Curie constant was very close to the value given by one Mn (II) ion per mole of a compound (about 4.38 emu K/mol). The intensity of magnetization increased as temperature decreased, as shown in Figure 5. The reciprocal of magnetic susceptibility for the nanorods as a function of temperature is shown in the inset of Figure 5. The susceptibility was almost linear with temperature. This conformed to the rule of paramagnetic materials.
First-principles density functional theory (DFT) calculations were used to study the electronic structure and magnetic properties of the sample. There is no structure information for the Mnq2 molecule, so we used the structure of Cuq2 molecule [21], replacing the intermediate Cu atom with a Mn atom, as shown in Figure 6a. The Mnq2 isolated molecule was placed in a sufficiently large cell (a vacuum space of 20 Å) to avoid interaction with images reproduced by periodic boundary conditions [26]. Figure 6a shows the structure of Mnq2 isolated molecules after full relaxation. Unlike the Alq3 molecule which had different Al-O and Al-N bond lengths [24], the Mnq2 molecule had planar structure, and the two quinoline ligands were symmetrical about the middle Mn atom. The two Mn-O bonds and the two Mn-N bonds had equal bond lengths, which were 1.886 and 1.977 Å, respectively. The different bond lengths of Mn-O and Mn-N bonds implied that the central Mn atom bonded more tightly with the adjacent O atoms than the N atoms. This result was in good accordance with the previous reports calculated by using the Vienna ab initio simulation package [27].
If a system is magnetic, the local magnetic moment ought to exist. The magnetic properties of the Mnq2 isolated molecule were calculated after full relaxation. Figure 6b shows the total density of states (DOS) of the Mnq2 isolated molecule. The total DOS exhibited obvious exchange splitting between the majority and minority spin channels around the Fermi level. The total magnetic moment was 5 μB, which was mainly localized on the Mn atom (4.94 μB). There was a transfer of 1.78 electrons from the Mn 4s orbital to the quinolone ligands, leaving the 4s orbital with 0.22 electrons, while the 3d orbital had 5.04 electrons. Figure 6c shows the partial DOS (PDOS) of Mn 3d orbital in the isolated Mnq2 molecule. Most of the Mn 3d electrons occupied spin-up state, which conformed to Hund’s rules. The 3d orbital of the corresponding Mn ion was partially occupied. The different electron occupations of majority and minority spins led to a net local magnetic moment. The adjacent nonmetal atoms (C, N and O atoms) gave little contribution to the magnetic moments, due to the nearly closed shell of the nonmetal atoms and the somewhat delocalized characteristics of the corresponding ions [26].
To study the magnetic interaction between the local magnetic moments, the Mnq2 monoclinic cell was studied by DFT calculation. After full relaxation, the lattice parameters of the Mnq2 monoclinic cell which contained two Mnq2 molecules were a = 11.425 Å, b = 5.433 Å, c = 16.358 Å, α = 90.000, β = 118.55711, γ = 90.000. The energy differences between antiferromagnetic (AFM) and ferromagnetic (FM) states of the Mnq2 cell were calculated after full relaxation. The energy differences (ΔE) and the magnetic coupling of the four different initial spin configurations on Mn atoms of the Mnq2 monoclinic cell are shown in Table 1. As shown in Table 1, the FM states had lower energy than the AFM states, implying that the FM state was the ground state magnetic order. ΔEL was the energy difference between the current state and the ground state. However, the energy difference between the FM and AFM states was only 0.1 meV, which was much smaller than the room-temperature thermal energy (about 26 meV) [28]. These calculation results show that it is difficult to prepare intrinsic ferromagnetic Mnq2 crystals, and these results also explain the paramagnetism of the prepared Mnq2 nanorods. The distance between the two Mn atoms changed from 7.975 to 8.618 Å after full relaxation. The long distance made it difficult to form an effective ferromagnetic coupling between the two local magnetic moments.

5. Conclusions

Mnq2 nanorods are prepared by using the PVD method. The SEM and XRD analyses indicate the high crystal quality of the prepared samples. The AGM test shows that Mnq2 nanorods exhibit paramagnetic behavior, and the magnetic field response of the Mnq2 nanorods is much stronger than that of the powders. First-principles DFT calculations show that the Mnq2 isolated molecule has planar structure, and the magnetic moment is 5 μB, which mainly localizes on the 3d orbital of the Mn atom. The energy difference between FM and AFM states was only about 0.1 meV, indicating that it was difficult to prepare intrinsic ferromagnetic Mnq2 crystals, and explaining the experimental paramagnetic behavior of the prepared Mnq2 nanorods.

Author Contributions

Conceptualization, F.J. and Y.W.; methodology, F.J.; software, J.S.; validation, M.D.; formal analysis, F.J. and J.S.; investigation, M.D.; data curation, F.J. and J.S.; writing—original draft preparation, F.J.; writing—review and editing, F.J. and Y.W.; visualization, F.J.; supervision, F.J. and Y.W.; project administration, F.J.; funding acquisition, F.J. and Y.W. All authors have read and agreed to the published version of the manuscript.

Funding

This research was funded by National Natural Science Foundation of China, grant number 11804043 and the Fundamental Research Funds for the central universities, grant number DUT18RC(4)056 and DUT18RC(3)081.

Conflicts of Interest

The authors declare no conflict of interest.

References

  1. Tang, C.W.; VanSlyke, S.A. Organic electroluminescent diodes. Appl. Phys. Lett. 1987, 51, 913–915. [Google Scholar] [CrossRef]
  2. Su, Z.S.; Li, W.L.; Chu, B.; Li, T.L.; Zhu, J.Z.; Zhang, G.; Yan, F.; Li, X.; Chen, Y.R.; Lee, C.S. High response organic ultraviolet photodetector based on blend of 4,4′,4″-tri-(2-methylphenyl phenylamino) triphenylaine and tris-(8-hydroxyquinoline) gallium. Appl. Phys. Lett. 2008, 93, 3. [Google Scholar] [CrossRef]
  3. Kim, H.S.; Kim, C.H.; Ha, C.S.; Lee, J.K. Organic solar cell devices based on PVK/porphyrin system. Synth. Met. 2001, 117, 289–291. [Google Scholar] [CrossRef]
  4. Cai, E.; Wang, S.; Wang, B.; Wang, S.; Zhao, E.; Cheng, J.; Chi, Z.; Xie, W. Facile solution synthesis of tris (8-hydroxyquinoline) gallium crystalline nanostructures and their optical properties. Opt. Mater. Express 2018, 8, 2670–2676. [Google Scholar] [CrossRef]
  5. Xiong, Z.H.; Wu, D.; Valy Vardeny, Z.; Shi, J. Giant magnetoresistance in organic spin-valves. Nature 2004, 427, 821–824. [Google Scholar] [CrossRef]
  6. Dediu, V.; Hueso, L.E.; Bergenti, I.; Riminucci, A.; Borgatti, F.; Graziosi, P.; Newby, C.; Casoli, F.; De Jong, M.P.; Taliani, C.; et al. Room-temperature spintronic effects in Alq3-based hybrid devices. Phys. Rev. B 2008, 78, 115203. [Google Scholar] [CrossRef] [Green Version]
  7. Majumdar, S.; Majumdar, H.S.; Laiho, R.; Osterbacka, R. Comparing small molecules and polymer for future organic spin-valves. J. Alloy. Compd. 2006, 423, 169–171. [Google Scholar] [CrossRef]
  8. Yoo, J.W.; Chen, C.Y.; Jang, H.W.; Bark, C.W.; Prigodin, V.N.; Eom, C.B.; Epstein, A.J. Spin injection/detection using an organic-based magnetic semiconductor. Nat. Mater. 2010, 9, 638–642. [Google Scholar] [CrossRef]
  9. Muhammad, F.F.; Abdul Hapip, A.I.; Sulaiman, K. Study of optoelectronic energy bands and molecular energy levels of tris (8-hydroxyquinolinate) gallium and aluminum organometallic materials from their spectroscopic and electrochemical analysis. J. Organomet. Chem. 2010, 695, 2526–2531. [Google Scholar] [CrossRef]
  10. Jiang, F.; Pang, Z.Y.; Yuan, H.M.; Wei, Z.X.; Xie, W.F.; Wu, Z.Y.; Han, S.H. Room temperature ferromagnetic properties of dysprosium-doped tris (8-hydroxyquinoline) aluminum: Experimental and theoretical investigation. RSC Adv. 2016, 6, 43780–43785. [Google Scholar] [CrossRef]
  11. Baik, J.M.; Shon, Y.; Lee, S.J.; Jeong, Y.H.; Kang, T.W.; Lee, J.L. Electronic Structure and Magnetism in Transition Metals Doped 8-Hydroxy-Quinoline Aluminum. J. Am. Chem. Soc. 2008, 130, 13522–13523. [Google Scholar] [CrossRef] [PubMed] [Green Version]
  12. Jiang, F.; Wei, F.F.; Yuan, H.M.; Xie, W.F.; Pang, Z.Y.; Zhang, X.J. Room temperature ferromagnetic properties of Al-doped bis (8-hydroxyquinoline) cobalt (Coq(2)) molecules. J. Magn. Magn. Mater. 2015, 387, 155–158. [Google Scholar] [CrossRef]
  13. Jiang, F.; Yuan, H.M.; Xie, W.F.; Pang, Z.Y.; Han, S.H. Effect of oxygen on the magnetic property of Bis (8-hydroxyquinoline) copper (CuQ (2)): An experimental and theoretical study. Int. J. Mod. Phys. B 2015, 29, 6. [Google Scholar] [CrossRef]
  14. Monzon, L.M.A.; Burke, F.; Coey, J.M.D. Optical, Magnetic, Electrochemical, and Electrical Properties of 8-Hydroxyquinoline-Based Complexes with Al3+, Cr3+, Mn2+, Co2+, Ni2+, Cu2+, and Zn2+. J. Phys. Chem. C 2011, 115, 9182–9192. [Google Scholar] [CrossRef]
  15. Wang, Z.L. Characterizing the structure and properties of individual wire-like nanoentities. Adv. Mater. 2000, 12, 1295–1298. [Google Scholar] [CrossRef]
  16. Li, G.H.; Li, R.C.; Zhou, W.J. A Wire-Shaped Supercapacitor in Micrometer Size Based on Fe3O4 Nanosheet Arrays on Fe Wire. Nano Micro Lett. 2017, 9, 8. [Google Scholar] [CrossRef] [Green Version]
  17. Xu, P.; Wei, B.Q.; Cao, Z.Y.; Zheng, J.; Gong, K.; Li, F.X.; Yu, J.Y.; Li, Q.W.; Lu, W.B.; Byun, J.H.; et al. Stretchable Wire-Shaped Asymmetric Supercapacitors Based on Pristine and MnO2 Coated Carbon Nanotube Fibers. ACS Nano 2015, 9, 6088–6096. [Google Scholar] [CrossRef]
  18. Xie, W.; Pang, Z.; Zhao, Y.; Jiang, F.; Yuan, H.; Song, H.; Han, S. Structural and optical properties of ε-phase tris (8-hydroxyquinoline) aluminum crystals prepared by using physical vapor deposition method. J. Cryst. Growth 2014, 404, 164–167. [Google Scholar] [CrossRef]
  19. Kao, F.H.; Lin, K.Y.; Jan, D.J.; Tang, S.J.; Yang, C.C.; Lin, C.H.; Yeh, J.M.; Chiu, K.C. Re-condensation and decomposition of Tris (8-hydroxyquinoline)-aluminum in a vapor transport ampoule. J. Cryst. Growth 2012, 357, 9–14. [Google Scholar] [CrossRef]
  20. Perdew, J.P.; Burke, K.; Ernzerhof, M. Generalized gradient approximation made simple. Phys. Rev. Lett. 1996, 77, 3865–3868. [Google Scholar] [CrossRef] [Green Version]
  21. Petit, S.; Coquerel, G.; Perez, G.; Louer, D.; Louer, M. Synthesis, Characterization, and Ab-Initio Structure Determination from Powder Diffraction Data of a New X’ Form of Anhydrous Copper (Ii) 8-Hydroxyquinolinate Doped with Amine—Modeling of the Polymorphic Transformation to the Stable Anhydrous Beta “Form”. Chem. Mat. 1994, 6, 116–121. [Google Scholar] [CrossRef]
  22. Monkhorst, H.J.; Pack, J.D. Special Points for Brillouin-Zone Integrations. Phys. Rev. B 1976, 13, 5188–5192. [Google Scholar] [CrossRef]
  23. Kloc, C.; Simpkins, P.G.; Siegrist, T.; Laudise, R.A. Physical vapor growth of centimeter-sized crystals of alpha-hexathiophene. J. Cryst. Growth 1997, 182, 416–427. [Google Scholar] [CrossRef]
  24. Brinkmann, M.; Gadret, G.; Muccini, M.; Taliani, C.; Masciocchi, N.; Sironi, A. Correlation between molecular packing and optical properties in different crystalline polymorphs and amorphous thin films of mer-tris (8-hydroxyquinoline) aluminum (III). J. Am. Chem. Soc. 2000, 122, 5147–5157. [Google Scholar] [CrossRef]
  25. Jiang, F.; Pang, Z.; Yuan, H.; Wei, Z.; Xie, W.; Han, S. Effect of Low-Temperature Annealing on Structure and Optical Properties of Amorphous Tris (8-Hydroxyquinoline) Aluminum Films. Surf. Rev. Lett. 2019, 26, 1850183. [Google Scholar] [CrossRef]
  26. Wang, F.; Pang, Z.; Lin, L.; Fang, S.; Dai, Y.; Han, S. Magnetism in Co-doped tris-8-hydroxyquinoline aluminum studied by first-principles calculations. Appl. Phys. Lett. 2010, 96, 053304. [Google Scholar] [CrossRef]
  27. Yuan, H.; Jiang, F.; Xie, W.; Zhang, X.; Pang, Z.; Han, S. Structural, electronic and magnetic properties of 8-hydroxyquinoline-based small molecules TMQx (TM = Cr, Mn, Fe, Co, Ni, Cu, Zn, and x = 2 or 3). Phys. E 2015, 70, 77–83. [Google Scholar] [CrossRef]
  28. Wang, F.; Pang, Z.; Lin, L.; Fang, S.; Dai, Y.; Han, S. Magnetism in undoped MgO studied by density functional theory. Phys. Rev. B 2009, 80, 144424. [Google Scholar] [CrossRef]
Figure 1. A diagrammatic sketch of the dual-zone tubular furnace.
Materials 13 02379 g001
Figure 2. The SEM micrographs of the prepared Mnq2 crystals. Rod-shaped microstructures with (a) 400 μm and (b) 50 μm scale. Rod-shaped and nubby microstructures with (c) 200 μm and (d) 50 μm scale.
Materials 13 02379 g002
Figure 3. (a)The EDS spectra of the Mnq2 powders and prepared Mnq2 nanorods. (b) The XPS survey spectra for the Mnq2 powders and nanorods.
Materials 13 02379 g003
Figure 4. (a) XRD of Mnq2 powders and nanorods. (b) The M-H curves of Mnq2 powders and nanorods measured by alternating gradient magnetometer (AGM) at room temperature.
Materials 13 02379 g004
Figure 5. The M-H curves of Mnq2 nanorods measured by SQUID VSM at different temperatures, with the plot of susceptibility vs. temperature in the inset.
Materials 13 02379 g005
Figure 6. (a) The molecular structure of Mnq2 molecule after full relaxation. (b)The total DOS of the Mnq2 isolated molecule. (c) The PDOS of the Mn 3d orbital in the Mnq2 isolated molecule.
Materials 13 02379 g006
Table 1. The energy difference between antiferromagnetic (AFM) and ferromagnetic (FM) states, and the corresponding magnetic coupling of different initial spin configurations on Mn atoms of the Mnq2 monoclinic cell.
Initial Direction∆EL (meV)Magnetic Coupling
Mn1Mn2
0FM
0.1AFM
0.1AFM
0FM

