Abstract
To quantify the influence of the fuel medium on the fatigue performance of fuel tank materials, a comparative study was performed on the vibration fatigue characteristics of parent material specimens in fuel and air media. A fluid–solid coupling model was established based on the virtual mass method. Meanwhile, vibration fatigue tests of Q235BF specimens were performed in fuel and air media. The quantitative relation of the fatigue life of specimens in the air medium and that in the fuel medium was obtained. Fracture observation and energy spectrum analysis revealed the influence law of fuel on notches of specimens. The modal analysis of the finite element model proves that the stress of the specimens in the fuel medium is larger than that in the air medium. In this condition, they have shorter life. Finally, four approaches were used to calculate the fatigue life of the specimens to compare with the test life. The reasonable fatigue life prediction method was obtained in the case of fuel and air media.
1. Introduction
Fuel tanks are key components of the energy supply system for vehicles, such as diesel locomotives, automobiles, airplanes, and ships, and are under complex loads in operation. Owing to the vibration of the fuel inside the fuel tank, the fuel tank will be deformed under the action of the fuel load, which, in turn, will affect the size and distribution of the fuel load [1]. The fuel tank of a diesel locomotive is welded and fixed to the fuel tank hanger on the bottom beam and hangs on the bottom of the locomotive [2]. It has to withstand not only the impact and vibration generated by the track irregularity, but also the fluid–solid coupling effect caused by fuel vibration. The coupling between fuel and the tank is a highly nonlinear and stochastic process, presenting a very complex dynamic problem [3]. Under complicated loading conditions, stress is likely to be concentrated at the weld seam or other weak positions of the fuel tank and these parts will undergo fatigue cracking; hence, it is necessary to perform vibration fatigue analysis.
The commonly used material for diesel fuel tanks of a diesel locomotive is Q235BF. Owing to the large volume and mass of the diesel fuel tanks, studies on fatigue characteristics are mainly performed on the materials and scale models. For the fatigue test of fuel tank material, Wang et al. [4] conducted a three-point bending test on Q235 specimens and studied the fatigue characteristics of specimens with different-sized notches. The results showed that the fracture ductility varied with the notch size and was almost constant under elastic ultimate load. The bearing capacity of the structure was estimated using the relationship between the crack stress intensity factor and the fracture criterion. Han et al. [5] conducted low-cycle torsion and multi-axial fatigue tests on welded thin-walled Q235B specimens under different loading paths. The results showed that there was a significant non-proportional additional strengthening effect at a 90° out-of-phase loading path, and the authors proposed energy-based fatigue parameters that could better predict the fatigue life of Q235B steel structures under torsional and multi-axial loads. Pan [6] established a fatigue damage assessment model based on the fusion of magnetic-thermal characteristic data and verified the feasibility of the model via the axial tensile fatigue tests of Q235 specimens, accurately predicting the fatigue life of Q235 support rods. Gao [7] performed uniaxial tension and compression fatigue tests, torsional fatigue tests, and three-stage variable-amplitude loading fatigue tests on Q235 steel under different cyclic loading conditions and studied the correlation of fatigue damage to mechanical parameters such as specimen elongation, area reduction, tensile failure elongation, and ultimate tensile strength.
In terms of the influence of different media environments on material characteristics, Lynch [8] compared the scanning electron microscope (SEM) images of fatigue fracture of aluminum alloys in air, vacuum, and liquid environments, pointing out that more ductile cracks were formed in air and severe fracture passivation occurred in vacuum. There was no striation, and the liquid environment was more likely to cause the formation of brittle cracks. Bogdański [9] studied the comparison of quasi-static and hydrodynamic modelling of liquid-solid interaction in 3D squat-type cracks. The hydrodynamic interaction was modeled by coupling the 3D finite element model of a squat-type crack and the theoretical squeeze fluid film model of liquid contained in the crack interior. The squeeze fluid film in the central plane perpendicular to the crack front was modeled on the basis of the one-dimensional Reynolds equation derived for compressible fluid with pressure dependent viscosity. An opinion about the ability of “sucking in” a liquid (for instance oil or water) into the crack interior during single cycle of opening was verified. Bogdański [10] used the iterative numerical procedure to estimate the 3D crack front loading enhancements due to the action of the “liquid entrapment mechanism” (LEM). The 3D shallow angle, semi-elliptical, surface breaking crack inclined at 20° to the horizontal was FE modeled and used for analysis. The histories of modes I, II, and III stress intensity factors (SIFs) and corresponding fatigue growth rates were determined for the selected points of the crack front. The obtained loading enhancements were compared with those estimated earlier by the authors and others on the basis of the 2D model of LEM. Sun et al. [11] used a simplified submarine-stern model as the research object and established the relationship between the excited vibration and radiated noise of the model in air and water media.
The problems commonly encountered in fluid–solid coupling mainly include the dam–water coupling problem in civil engineering, the problem of fluid-induced pipeline vibration, the ship–water coupling problem, and the oscillation problem of liquid storage container [12]. The classical methods to solve the fluid–solid coupling problem consist of analytical methods and semi-analytical methods. With the advancement of computational techniques, numerical methods such as finite element methods and boundary element methods have been widely used [1]. There are many finite element methods for fluid–solid coupling problems, including the fluid–solid coupling method, hydroelastic fluid unit method, virtual mass method [13,14,15,16], fluid element method [17], central mass method [15], and acoustic–solid coupling method [16]. In particular, the virtual mass method simplifies the combined element equation of liquid–solid coupling to a structural finite element equation containing an attached mass matrix of the liquid, which has the advantages of high solution precision and small calculation load. Liu [18] studied the relationship between the maximum tank natural frequencies of dry modes and wet modes for different baffle positions using the virtual mass method, and the results provided a numerical basis for designing fuel tank structure and improving performance. Mantecón et al. [19] modeled fluids using ANSYS CFX software, modeled nuclear fuel plates using software ANSYS Mechanical, and then performed fluid–solid coupling analysis, proposing a numerical method for fluid–solid coupling analysis of nuclear fuel plates under axial flow conditions. Costarelli [20] proposed a Navier–Stokes solver based on Cartesian structured finite volume discretization with embedded bodies and adopted an explicit partitioned strategy to realize fluid–solid coupling.
The above studies mainly focused on the conventional fatigue characteristics of materials, the effects of gas and liquid media, fluid–solid coupling analysis, and simulation methods. However, there have been no studies on the vibration fatigue characteristics of fuel tank materials in fuel and air media.
In this study, a fluid–solid coupling model of a small-scale fuel tank for a certain type of diesel locomotive was established using the virtual mass method. The validity of the model was verified using a frequency sweep test, and then comparative tests were performed on the vibration fatigue of specimens made of fuel tank materials under multi-stage loading in fuel and air media. Based on this, a fluid–solid coupling model was established for finite element simulation, and four fatigue calculation methods were compared, revealing the fatigue life calculation methods suitable for different media. The findings would provide a reference for predicting the fatigue life of fuel tank materials. The flowchart of the research method for comparing the vibration fatigue performance of fuel tank materials in the fuel and the air medium is shown in Figure 1.
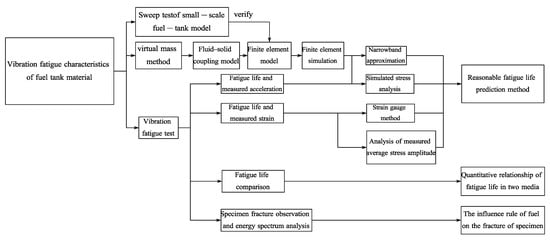
Figure 1.
Flowchart of research method.
2. Fluid–Solid Coupling Model and Verification
2.1. Fluid–Solid Coupling Model
When solving fluid–solid coupling problems, the virtual mass method has the advantages of high solution precision and small calculation load. In this study, the virtual mass method was used to study the effects of mutual coupling between fuel and specimens in fuel tanks. With the consumption of fuel, the total mass of the fuel tank of a diesel locomotive is continuously reduced, and the natural frequency constantly changes. If the frequency of the fuel tank is close to the excitation frequency of the engine and the motor, resonance will occur.
The calculation of natural frequency and vibration mode is a typical eigenvalue problem. The eigenvalue corresponds to the natural frequency, and the eigenvector corresponds to the vibration mode. The typical forced vibration equation with N degrees of freedom is [1]:
In Equation (1), [M] is a mass matrix, [C] is a damping matrix, [K] is a stiffness matrix, F is the external load, and {u} is a displacement vector.
If the equation ignores the effects of damping and external load, assuming that the deformation of the fuel tank is within the linear elastic range of the material, the equation becomes [21]:
A simple harmonic excitation as shown in Equation (3) is applied to the specimen in the fuel tank:
In Equation (3), ϕ is an amplitude vector of the simple harmonic excitation, ω is the frequency, and t is time.
Under the action of simple harmonic excitation, the specimens and fuel in the fuel tank are subjected to acceleration, and the specimens in the fuel medium are more accelerated than the specimens in the air medium:
In Equation (4), is the mass of the fuel attached to the specimens in the fuel tank.
The core of the virtual mass method is to achieve the effect of an incompressible fluid on the structure by introducing an attached mass and stiffness matrix in Equation (2). The finite element calculation equation for the vibration mode of the structure in the fuel medium is [14,15,16,18]:
In Equation (5), MA is the attached mass matrix produced by the fluid to the structure, with and u as the acceleration and displacement vectors, respectively.
Substitution of Equation (3) into Equation (5) yields:
As Equation (6) holds at any time, one obtains:
The prerequisite for Equation (7) to have a non-zero solution is that the characteristic determinant is zero:
A series of eigenvalues ωi can be obtained from Equation (8), each corresponding to an eigenvector satisfying Equation (7). Each eigenvalue and the corresponding eigenvector satisfy Equation (9), wherein the eigenvalue corresponds to a natural frequency, and the eigenvector corresponds to a vibration mode [22]:
As shown by Equation (5), on the one hand, the attached mass matrix changes with the state of the fluid, and the vibration of the structure is a state function of the fluid flow; on the other hand, the vibration of the structure affects the fluid flow state through boundary deformation, and the fluid and fuel tank form a closed fluid–solid coupling system. As the stiffness KA imposed by the fluid on the fuel tank is small relative to the stiffness of the fuel tank itself, it can be ignored. Consequently, the attached mass matrix MA is the main research object.
The following three assumptions are made to solve the equation of attached mass matrix MA [15,18]:
- The liquid is an isotropic, incompressible, non-viscous liquid;
- The influence of gravity on the surface of the structure can be ignored;
- The motion speed of the structure is very low.
According to the continuity, motion, and energy equations of fluid mechanics, assuming that and are, respectively, the fluid velocity and fluid acceleration calculated via the boundary element method at point rj (a virtual source) on the boundary of the fluid domain, the flow velocity and pressure pi at another position ri on the boundary of the fluid are expressed, respectively, by Equations (10) and (11) [23]:
In Equations (10) and (11), is the velocity vector at any node; Aj is the area of a microelement on the surface of the structure; is the flow velocity vector at node j; eij is the unit vector from node j to node i; pi is the pressure on an arbitrary surface Aj; is the fluid density.
Integration of Equations (10) and (11) yields Equations (12) and (13) [24]:
where and are integral coefficient matrices; F is the force exerted by the fluid on the structure.
According to Newton’s second law, Equations (12) and (13) can be converted into Equation (14):
namely:
According to Equation (15), the attached mass matrix MA can be obtained, which is substituted in Equation (5) to solve the equation for eigenvalues and eigenvectors, which are the natural frequencies and vibration modes of the fluid–solid coupling system, respectively.
2.2. Model Validation
Frequency sweep tests were performed on a small-scale fuel-tank model of a diesel locomotive with different fuel levels. The test results were compared with the simulation results obtained based on the virtual mass method to verify the validity of the fluid–solid coupling model.
The small-scale fuel-tank model was installed on a multi-axial synchronous vibration platform for a sinusoidal frequency sweep test. The test platform and model installation are shown in Figure 2.
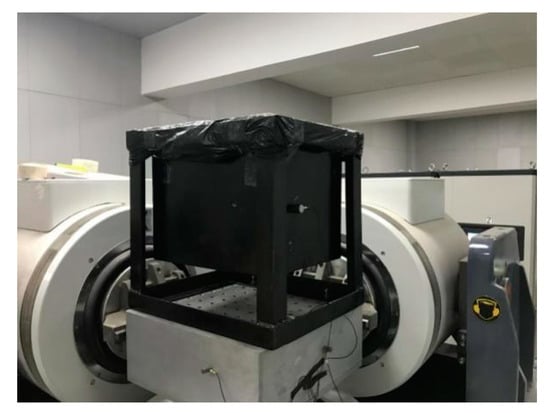
Figure 2.
Schematic diagram of the test platform and model installation.
Acceleration sensors were arranged on the two side plates and the bottom plate of the model. The lower and upper frequency limits of the sweep test were set to 5 Hz and 160 Hz in the vibration control system, respectively, with the sweep rate set to 1 oct/min.
The small-scale fuel-tank model was subjected to a sinusoidal frequency sweep test at 0/4, 1/4, 2/4, 3/4, and 4/4 of the full fuel level, which provided the first-order resonance frequency at each fuel level. When using the virtual mass method to simulate fluid–solid coupling of the small-scale fuel-tank model, the first step was to establish a local coordinate system at the bottom of the tank, and the second step was to define the fluid characteristics and the characteristics of fluid–solid coupling elements by modifying the MFLUID and ELIST control cards in the Msc Nastran 2010 software. The MFLUID and ELIST control cards can set the numbers of the continuous wetted elements, attribute and depth of the fluid. For example, ZFS defines the depth of the fluid, RHO defines the density of a fluid, E1 represents the number of the initial wetted elements and E3 represents the number of the terminal wetted elements. The parameters of the MFLUID and ELIST control cards are shown in Table 1.

Table 1.
Parameters of the MFLUID and ELIST control cards.
The small-scale fuel-tank finite element model and its modes at 1/4 of the full fuel level are shown in Figure 3a,b.
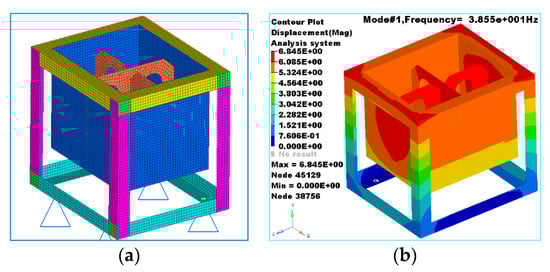
Figure 3.
(a) Finite element model of the fuel-tank structure and (b) simulation results at 1/4 of full fuel level.
The results of the frequency sweep test of the small-scale fuel-tank model and the modal simulation results based on the virtual mass method are shown in Table 2.
Table 2.
Small-scale model test results and modal simulation results.
The results show that, with the increase in fuel height, the first-order frequency gradually decreased, which was attributed to the fact that the fluid mass was treated as the attached mass MA and absorbed in the mass matrix in the calculation. As shown by Equation (8), with the increase in MA, the eigenvalue ωi decreased gradually, that is, the natural frequency of the system gradually decreased. The test and simulation results are consistent with the theoretical solution of the fluid–solid coupling model.
The simulation results of the fluid–solid coupling model based on the virtual mass method are very close to those of the frequency sweep test, showing a maximum relative deviation of only 5.73%. This indicates that it is feasible to conduct fluid–solid coupling simulation based on the virtual mass method, thereby verifying the accuracy of the model. The virtual mass method greatly reduces the difficulty of modeling because it does not need to establish fluid grid cells, thereby making it more suitable for the fluid–solid coupling simulation of large fuel tanks, such as those of diesel locomotives, airplanes, and ships.
3. Vibration Fatigue Test
3.1. Test Process
During the operation of the diesel locomotive, the fuel tank has to withstand not only the impact and vibration generated by the external load, but also the fluid-solid coupling effect caused by fuel vibration. Therefore, the multiaxial stress state occurred at the bottom and sides of the fuel tank. To study the influence of fuel and air media on the fatigue behavior and vibration fatigue characteristics of a fuel tank, parent material specimens were designed for the fuel tank of a type of diesel locomotive and subjected to vibration fatigue tests. The support and the mounting base were rigidly welded to ensure that the specimens would not be loose and the acceleration remained constant. In order to speed up the test and magnify the influence of fuel on fuel tank materials, the specimens were installed as cantilever beam structure to carry out the fully-reversed uniaxial bending tests. The geometry of the specimens is shown in Figure 4.
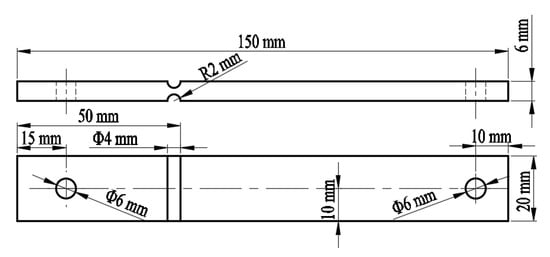
Figure 4.
Schematic diagram of the specimen structure.
The circular hole (Φ6 mm diameter) on the left side is used for assembly, and the circular hole (Φ6 mm diameter) on the right side is used to install the counterweight block. The specimen material was Q235BF. The chemical composition and physical and mechanical properties of Q235BF specimens are shown in Table 3.
Table 3.
The chemical composition and physical and mechanical properties of Q235BF specimens.
The mounting support is shown in Figure 5, and the connection diagram between the specimen and the vibration platform is shown in Figure 6a,b.
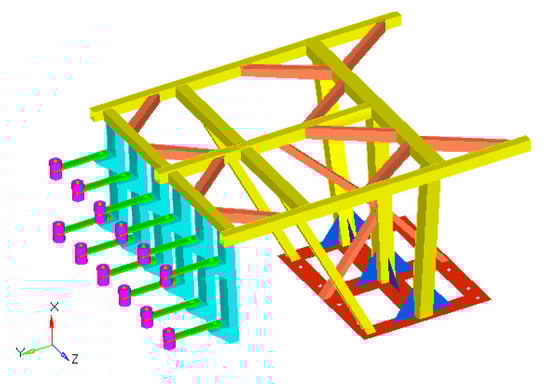
Figure 5.
Finite element model.
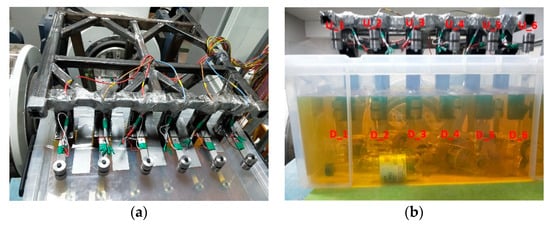
Figure 6.
(a) Specimen support setup and (b) specimen numbering.
A total of 12 specimens were tested, six of which were in the air medium and six in the fuel medium. The acceleration was applied to rigid support in vertical direction (x-direction) through the surface of the multi-axial vibration platform. Then the acceleration was applied to the specimens through the support. The acceleration sensor was attached at the root of the specimens to feed back the acceleration information so that the acceleration could be kept constant. To make the input frequencies of the vibration platform different from the natural frequencies of the specimens and to determine the range of the input acceleration, simulation was first performed to identify structural modes and static strength.
The modes and static strength identified via modal simulation are shown in Table 4.
Table 4.
Simulation results of structural mode and static strength.
The results show that the first-order resonance frequency of the structure was 29.22 Hz. To avoid resonance, the input frequency of the vibration platform should avoid selecting 29.22 Hz. From the S–N curves [25,26] of Q235BF-grade notched specimens, the corresponding stress amplitude at the life of 106 cycles was 180 MPa. When the acceleration was 10.88 g, the first principal stress at the specimen notch was 179.9 MPa. If the test input frequency was 20 Hz, the test duration was expected to be approximately 13.89 h. In order to control the test duration reasonably and avoid resonance, the input frequency of the vibration platform was selected to be 20 Hz.
Most of the traditional multi-stage loading tests use the second- and third-stage blocks in the order of high, low, and high loading or in the order of low, high, and low loading [27]. Chu [28] analyzed the cumulative strengthening effect of the loading sequence on fatigue strength by conducting three-stage loading fatigue tests with different loading sequences, determining that the cumulative strengthening effect of training loading on fatigue strength was the highest when loading in the order of low to high magnitudes, and that the cumulative strengthening effect was similar to the additive strengthening effect of three stages of independent loading. To maximize the cumulative strengthening effect of exercise load on the fatigue strength and make the loading contain the main vibration state of the fuel tank, the input acceleration of the vibration platform was set to three-stage constant-amplitude sinusoidal excitation (5.18 g, 8.55 g, and 13.45 g), with the load applied in the order of small to large magnitudes.
The specimens in the air medium were attached with a resistance strain gauge at a position 8 mm from the left side of the notch and an acceleration sensor was installed to the mounting base of specimen support. The measured strain could be used to calculate the stress at the notch. The strain gauge can be affected by the fuel, and cannot measure stress accurately. Thus, the stress values of the specimens in the fuel medium were obtained by finite element simulation. The specimens in the air medium were named U_1–U_6 from left to right, and the specimens in the fuel medium were named D_1–D_6 from left to right. To facilitate the observation of the real-time state of the specimens during the test, a transparent plastic fuel tank was used to hold the fuel, and the specimens in the fuel medium were placed 60 mm below the fuel level.
3.2. Test Results
First, the test was performed for 7 h under a load of 5.18 g. The test results, as shown in Table 5, indicated that there was no specimen fracture at this stage.
Table 5.
Test results at an acceleration of 5.18 g.
Subsequently, the test was continued for 72.25 h under a loading of 8.55 g. The test results, as shown in Table 6, indicate that the number of specimens fractured in the fuel medium was higher than that in the air medium, with the former showing a shorter life.
Table 6.
Test results at an acceleration of 8.55 g.
Finally, the test was continued under a loading of 13.45 g until the remaining specimens were all fractured. The test results, as shown in Table 7, indicate that, except for the sixth group, the other five groups of specimens showed a significantly longer life in the air medium than in the fuel medium.
Table 7.
Test results at an acceleration of 13.45 g.
Based on the results in Table 4, the S–N curves of Q235BF-grade notched specimens [25,26] and the Miner’s cumulation rule (N = Ni/NfI), the test life at accelerations of 5.18 g and 13.45 g was converted to that at an acceleration of 8.55 g (Table 8).
Table 8.
Life at an acceleration of 8.55 g converted from the test life at accelerations of 5.18 g and 13.45 g.
4. Fracture Observation and Energy Spectrum Analysis
4.1. Fracture Observation
In the vibration fatigue tests, as the input loading was a constant-amplitude sinusoidal acceleration, the specimens in the air medium were subjected to pure bending loading under the action of the counterweight block, and the specimens in the fuel medium were also mainly subjected to bending loading under the composite action of the counterweight block and fuel pressure. Consequently, the macroscopic fracture morphology of the specimens was the same. It was observed that the fatigue fracture occurred in a short time after the crack source was generated in the test. Thus, the fatigue life is mainly controlled by the crack source. As shown in Figure 7, the specimens were all fractured at the smallest section of the notch, and the fracture planes were perpendicular to the specimen axial direction.
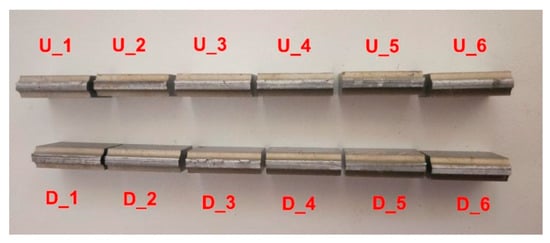
Figure 7.
Macroscopic fracture morphology of all specimens.
To analyze the expansion pattern of fatigue cracking of the specimens and their initial defects further, the specimen fracture was observed under an SEM. Figure 8a–d and Figure 9a–d present the SEM diagrams of fracture morphology in the air and fuel media for the typical specimens U_1 and D_1, respectively. Figure 8a and Figure 9a,b represents the crack source zone, c represents the crack propagation zone, and d represents the instantaneous fracture zone.
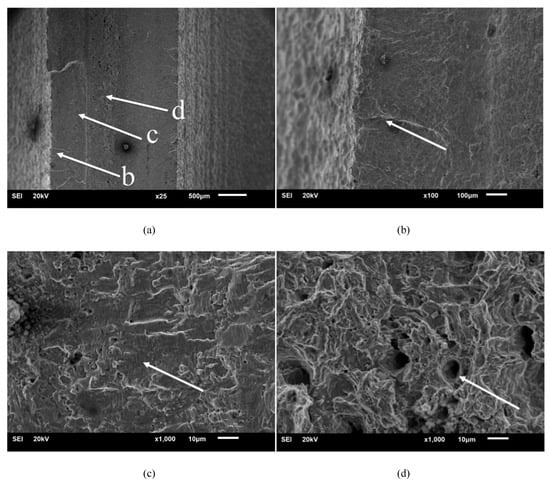
Figure 8.
Fracture morphology of the U_1 specimen. (a) Macroscopic fracture, (b) crack source zone, (c) crack propagation zone, and (d) instantaneous fracture zone.
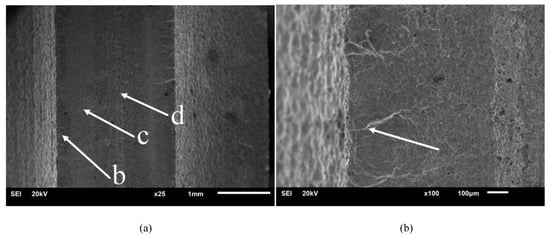
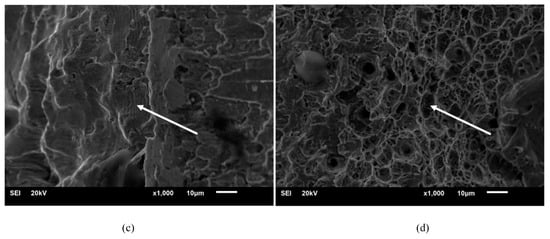
Figure 9.
Fracture morphology of the D_1 specimen. (a) Macroscopic fracture, (b) crack source zone, (c) crack propagation zone and (d) instantaneous fracture zone.
A comparison between Figure 8a–d and Figure 9a–d reveals that, as the specimens were mainly subjected to bending loading in the air and fuel media, they had the same macroscopic fracture morphology, which was characterized by a typical failure of multi-crack source, with the crack sources concentrated on the left and right sides and expanding in a radial manner. Most of the instantaneous fracture zone was located in the center of the fracture, and the crack propagation zone was located between the crack source zone and the instantaneous fracture zone. However, the crack propagation zone of the specimen in the fuel medium was apparently more scratched and worn with fewer fatigue striations than that in the air medium, and the fatigue fringe is less. This was attributed to the fact that the compressive stress of the fuel in the process of crack tip opening and closing increased the stress intensity factor, which aggravated plastic sharpening, resulting in a relatively high crack propagation rate, fewer fatigue striations, and severe fracture wear. In this regard, Lynch [8] pointed out that, compared with an air environment, specimens in a liquid environment show greater crack propagation increments, lesser passivation, fewer fatigue striations, and smaller plastic zones with a higher possibility to generate split cracks. The mechanism of crack propagation in a liquid environment is shown in Figure 10 [8].
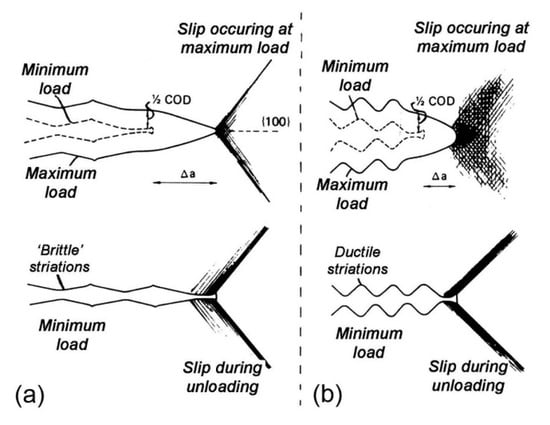
Figure 10.
Crack propagation mechanism in a liquid environment [8]. (a) Liquid-metal environment producing brittle striations; (b) inert environments producing ductile striations.
In addition, the dimples of the instantaneous fracture zone of the specimens in the fuel medium were significantly shallower and less irregular than those in the air medium. This is because, when the material ductility is high, the size of micro-dimples is large and deep [29].
Notably, as mentioned in Section 2.2, the sixth group of specimens had a shorter life in the air medium than in the fuel medium. Fracture observation and energy spectrum analysis revealed that there were obvious foreign bodies on the fracture of the U_6 (Figure 11) specimen and the results of the energy spectrum analysis revealed that the chemical composition of the foreign bodies is quite different from that of the base mental.
Figure 11.
SEM diagrams of the dark gray zone of the U_6 specimen under 2five-fold and 50-fold magnification.
Thus, the foreign bodies should be manufacturing defects. Therefore, the test results of this group were excluded from further analysis. Based on the test data of the first five groups of specimens in Table 8, the average ratio of converted life in the air medium to converted life in the fuel medium was calculated to be 10.03.
4.2. Energy Spectrum Analysis
To determine whether there was fuel corrosion and whether the crack source zone underwent chemical reactions with the fuel in the specimen fatigue process in the fuel medium, energy spectrum analysis was performed on the crack source zones of typical specimens. For each specimen, four measurement points were selected, and the results of energy spectrum analysis are shown in Figure 12.
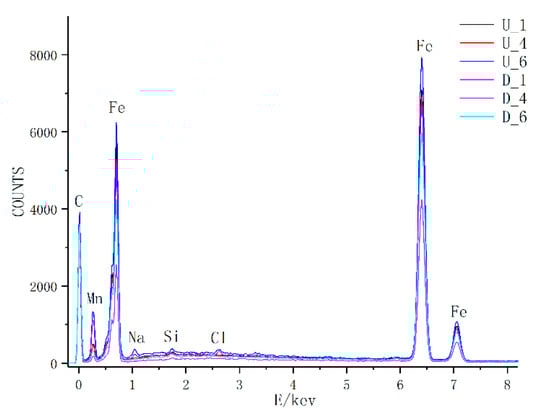
Figure 12.
Results of energy spectrum analysis at a set of fixed measurement points.
As shown in Figure 12 (U_1–U_6 in the label are the specimens in the air medium, D_1–D_6 in the label are the specimens in the fuel medium), there was no significant difference between the air and fuel media in the energy spectrum analysis results of crack source zone, and the two media showed similar elemental composition and distribution in the specimens. This indicates that the crack source zone of the specimens in the fuel medium did not undergo chemical reactions with the fuel. The formation and propagation of cracks did not result from fuel erosion but resulted from the superposition of the bending stress at the crack tip with the compressive stress of the fuel.
5. Modal and Fatigue Life Comparison
5.1. Modal Comparison
To make the simulation test accurate, a fluid–solid coupling model of the specimen was established in a 1:1 ratio using the virtual mass method. The specimen, support, and fuel tank were discretized by the body element and the shell element, respectively. The fuel was simulated by establishing a local coordinate system on the bottom of the fuel tank and defining the MFLUID and ELIST control cards. The wetted elements were renumbered to become continuous. The normal directions of the wetted elements were adjusted to point to the fuel, and the serial numbers of the wetted elements were defined in the ELIST control card.
In the tests, the distance from the upper surface of the specimens in the fuel medium to the bottom of the fuel tank was 200 mm; hence, 200 mm was used as the baseline level for fuel filling. The wet modes of the structure at the filled fuel level of 200–300 mm were simulated via the virtual mass method, and the results were compared with the dry modes of the structure at a fuel level of 0 mm. The simulation results of frequency and modal displacement are shown in Figure 13a,b.
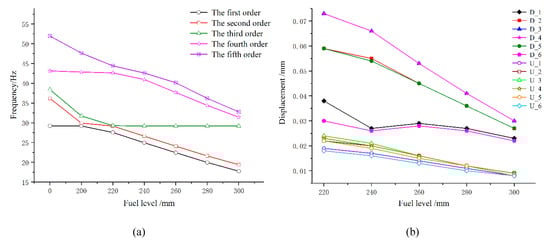
Figure 13.
Modal frequency and displacement of the structure. (a) Modal frequency and (b) modal displacement.
Vibration theory states that the frequency of a structure mode is related to its mass, with a higher mass leading to a lower frequency. As shown in Figure 13a, with the increase in filled fuel level, the modal frequency of the structure remarkably decreased, which was due to the attached mass MA of the fuel. Figure 13b shows that, with the increase in filled fuel level, the modal displacement of the same specimen gradually decreased, and the modal displacement in the fuel medium was significantly larger than that in the air medium. The larger the modal displacement of the specimen, the larger is the stress amplitude and, hence, the specimen life in the fuel medium would be shorter than that in the air medium, which was consistent with the test results. The large modal displacement of the specimen in the fuel medium was due to the attached mass MA of the fuel. At the same acceleration, a specimen in the fuel medium would be subjected to a larger force owing to the attached mass MA than in the air medium; hence, the specimen in the fuel medium had a larger vibration amplitude with a shorter life.
5.2. Comparison of Fatigue Life Calculation Methods
The support in the test was rigid, and the 12 specimens did not affect each other when tested simultaneously. The stiffness value of the support material in the finite element model is very large, and the mass values of the specimens are small. Therefore, when a specimen failed, the vibration mode of the overall structure hardly changed. Based on the test and finite element simulation results, the specimen life was calculated using four approaches: narrowband approximation, simulated stress analysis, strain gauge method, and the analysis of measured average stress amplitude, and the calculation results were compared with the test results.
(1) Narrowband approximation
The probability density function P(Sa) of the stress amplitude under sinusoidal excitation is equal to the probability density function P(Sp) of the peak values, both obeying the Rayleigh distribution; hence, sinusoidal excitation generates a narrowband distribution. Narrowband distribution can be expressed by Equation (16) [30]:
where is the root mean square of the stress process.
First of all, the harmonic response of the specimen fluid–solid coupling finite element model was calculated using a frequency range of 5–50 Hz. Then the acceleration-time course measured at the root of the air-medium specimen at an input acceleration of 8.55 g was converted to acceleration power spectral densities (PSDs). The harmonic response result was multiplied by the acceleration spectral density to obtain the stress spectral density. Then the stress spectral density function was calculated according to the narrow band distribution expression of the sinusoidal excitation. Finally, based on the fatigue life of the specimens obtained through Miner’s linear fatigue damage cumulation rule, the specimen life N1 are as shown in Table 9.
Table 9.
Predicted life N1 of specimens under narrowband distribution.
(2) Simulated stress analysis
The virtual mass method was employed to establish fluid–solid coupling models of the specimens for finite element simulation, which revealed the maximum stress at the specimen notch. Subsequently, the predicted life N2 of the specimens was obtained using the S–N curves of Q235-grade notched specimens [25,26], as shown in Table 10.
Table 10.
Predicted life N2 derived from simulated stress analysis.
(3) Strain gauge method
In the vibration fatigue tests, the strain of each specimen was measured using the strain gauge. The simulated stress at the specimen notch was approximately 9.5 times the stress at the gauge position; hence, the strain-time course at the gauge position was corrected for baseline drift and then multiplied by 9.5 to obtain the strain-time course at the specimen notch. Subsequently, the rainflow cycle counting method and linear damage theory were used to obtain the specimen life N3, as shown in Table 11.
Table 11.
Predicted life N3 derived from measured strain.
(4) Analysis of measured average stress amplitude
For the measured strain-time course, the average of the peak and trough values was calculated and then the average stress amplitude at the specimen notch was obtained. The predicted lifetime N4 of the specimens was obtained from the S–N curves of Q235-grade notch specimens by average stress amplitudes [25,26]. The S–N curves contained the elastic part and the plastic part, which took into account the effects of elasticity and plasticity, respectively. The average stress amplitude and the predicted lifetime N4 are shown in Table 12.
Table 12.
Measured average stress amplitude and predicted life N4.
As shown in Table 9 and Table 10, the predicted lives N1 and N2 had the same relative deviation with respect to the test life, and the relative deviation of the life of most of the fuel-medium specimens was small. As shown in Table 11 and Table 12, the predicted life N3 of the air-medium specimens had smaller relative deviation with respect to the test life than the predicted life N4 did.
In the double-logarithmic coordinate system, the predicted life was used as the abscissa and the test life was used as the ordinate, which generated relationship plots of real life versus predicted life for all the specimens, as shown in Figure 14 (the red solid lines represent the five-fold life range, the dashed line represents that the predicted life is equal to the real life).
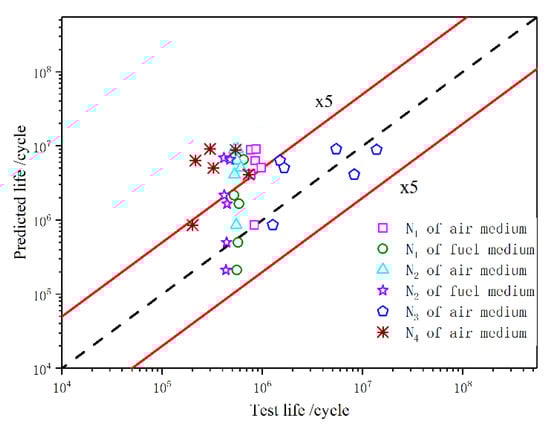
Figure 14.
Real life and predicted life of the specimens.
Generally, the prediction performance of a life calculation method is evaluated by the threshold ratio of 5 between the predicted life and test life, that is, if the data points of specimen life fall within the five-fold life range, a strong correlation is present [31]. As shown in Figure 14, all the predicted lives N3 fell within the five-fold life range, indicating that N3 was close to the true life. Most of the N4 data points were outside the five-fold life range, indicative of a large difference between the predicted life and real life. The predicted lives N1 and N2 of the fuel-medium specimens were mostly in the five-fold life range, indicating that, from the perspective of engineering practicality, it is possible to use narrowband approximation and simulated stress analysis to predict component fatigue life in a fuel medium.
6. Conclusions
In order to research the quantitative relationship between the fuel media and fatigue performance of the fuel tank material, the fluid-solid coupling finite element model was established based on the virtual mass method. The fatigue performance of the fuel tank, the fatigue life calculation methods and the influence of fuel on notch were studied through the fluid-solid coupling test under multi-stage loading and finite element simulation of the fuel tank base material. Based on the results obtained, it can be concluded that:
- Under multi-stage loading, the life of Q235BF specimens in the air medium was significantly longer than that in the fuel medium, approximately 10 times as high as that in the fuel medium.
- The specimens in pure bending tests were subject to the superposition of bending stress and compressive stress of the fuel at the crack tip. Compared with the air medium, the compressive stress of the fuel medium in the process of crack tip opening and closing led to higher crack propagation rates and fewer fatigue striations with severe fracture wear; the dimples in the instantaneous fracture zone were smaller and shallower, with higher irregularity in distribution, which provides reference for the calculation of the stress intensity factor at the crack tip of Q235BF specimens in the fuel media.
- The energy spectrum analysis results of the crack source zone of the specimens in the air and fuel media indicated that this zone was not subject to fuel corrosion. In a short time the formation and propagation of cracks did not result from fuel erosion but resulted from the superposition of the bending stress at the crack tip with the compressive stress of the fuel.
- The modal analysis indicates that the modal frequency and displacement of the structure gradually decreased with the increase in filled fuel level due to the influence of the attached mass MA. And the modal displacement of the fuel-medium specimens was larger than that of the air-medium specimens, which proves that the stress of the specimens in the fuel medium is larger than that in the air medium. In this condition, they have shorter life.
- Comparing the four fluid–solid coupling model calculation methods, the predicted life derived from the measured strain of the air-medium specimens was close to the test life. Narrowband approximation and simulated stress analysis could well predict specimen life in the fuel medium which provides some reference for predicting the fatigue life of the fluid-solid model of the fuel tank.
Due to the limitation of experimental conditions, the stress intensity factor and crack propagation rate at the crack tip of the specimens in the fuel media have not been studied in depth. In addition, further research should be conducted to establish a crack propagation model by the crack propagation law to predict fatigue life.
Author Contributions
Investigation: L.Y., B.Y., S.D., X.H., and S.L.; project administration: G.Y. and B.Y.; supervision: G.Y.; writing—original draft: L.Y.; writing—review and editing: G.Y. and B.Y. All authors have read and agreed to the published version of the manuscript.
Funding
This research was funded by the Union Project of National Natural Science Foundation of China (no. U1534209), the National Natural Science Foundation of China (no. 51675446).
Acknowledgments
The authors would like to thank Zhanjiang Wei and Yifan Li at Southwest Jiaotong University for her help during the experiment.
Conflicts of Interest
The authors declare no conflict of interest.
References
- Zhang, A.M.; Dai, S.S. Fluid-Solid Coupling Dynamics; National Defence Industry Press: Beijing, China, 2011. [Google Scholar]
- Zhao, L.; Zhang, Z.; Wang, S.; Zhang, H.W. Finite Element Analysis of Strength and Fatigue of Fuel Tank Hanger Welds. Comput. Aided Eng. 2015, 24, 7–11. [Google Scholar]
- Li, W.F. Analysis of Vibration and Vibration Fatigue of Aircraft Fuel Tank; Nanjing University of Aeronautics and Astronautics: Nanjing, China, 2014. [Google Scholar]
- Wang, L.M.; Feng, Y.; Chen, F.X. Elasto-Plastic Test of Q235 Steel Bending Beam with Cracking Resistance. J. Iron Steel Res. Int. 2013, 20, 57–66. [Google Scholar] [CrossRef]
- Han, Q.H.; Wang, P.P.; Lu, Y. Low-cycle multiaxial fatigue behavior and life prediction of Q235B steel welded material. Int. J. Fatigue 2019, 127, 417–430. [Google Scholar] [CrossRef]
- Pan, Z.Y. Q235 Fatigue Damage Assessment Based on Magnetic-Thermal Characteristic Data Fusion; Anhui Jianzhu University: Shenyang, China, 2017. [Google Scholar]
- Gao, L. Study on Uniaxial Tensile Mechanical Properties of Q235 Steel Under Different Tension and Compression Cycles; Guangxi University: Nanning, China, 2016. [Google Scholar]
- Lynch, S.P. Some Fractographic Contributions to Understanding Fatigue Crack Growth. Int. J. Fatigue 2017, 104, 12–26. [Google Scholar] [CrossRef]
- Bogdański, S. Quasi-static and Dynamic Liquid Solid Interaction in 3d Squat-type Cracks. Wear 2014, 314, 20–27. [Google Scholar] [CrossRef]
- Bogdański, S. 3D Model of Liquid Entrapment Mechanism for Rolling Contact Fatigue Cracks in Rails. Wear 2008, 265, 9–10. [Google Scholar] [CrossRef]
- Sun, G.S.; Shao, H.L.; Zhang, G.L.; Hu, X.H. Study on the Stimulated Vibration and Acoustic Radiation Characteristics of a Ribbed Truncated Conical Shell in Air and Water Media. Ship Sci. Technol. 1997, 5, 57–61. [Google Scholar]
- Su, H.D. A New Method for Analyzing Fluid-Structure Coupled Vibration and Its Application; Huazhong University of Science and Technology: Wuhan, China, 2006. [Google Scholar]
- Yang, Z.; Zhang, R.; Ren, W.S. Analysis of Vibration Durability of Automotive Fuel Tank Based on Fluid-Structure Coupling. Automob. Pract. Technol. 2017, 15, 54–57. [Google Scholar]
- MSC/NASTRAN Advanced Dynamics Analysis User’s Guide; MSC. Software Corporation: Santa Ana, CA, USA, 2007.
- Cui, G.W.; Hong, L.Y.; Zhang, D.M. Application of Virtual Quality Method in Modal Analysis of Launch Vehicle. Strength Environ. 2013, 40, 43–47. [Google Scholar]
- Xue, J.; He, S.L.; Du, D.H.; Li, F. Study on fluid-solid coupling modal simulation analysis of liquid-filled container. J. Railw. Investig. 2015, 41, 90–97. [Google Scholar]
- Ma, C.; Wei, C.; Tang, L.; Zhao, Y. Modeling method of absolute node coordinate column fluid element and its application in liquid sloshing problem. Eng. Mech. 2015, 32, 58–67, 83. [Google Scholar]
- Liu, X.H.; Shi, X.F.; Yi, Y.; Liang, Y.; Yan, H.; Xue, H. Modal Analysis of Fuel Tank of Underwater Vehicle Based on Virtual Mass Method. J. Underw. Unmanned Syst. 2018, 26, 23–27. [Google Scholar]
- Mantecón, J.G.; Neto, M.M. Numerical methodology for fluid-structure interaction analysis of nuclear fuel plates under axial flow conditions. Nucl. Eng. Des. 2018, 333, 76–86. [Google Scholar] [CrossRef]
- Costarelli, S.D.; Garelli, L.; Cruchaga, M.A. An embedded strategy for the analysis of fluid structure interaction problems. Comput. Methods Appl. Mech. Eng. 2015, 300, 106–128. [Google Scholar] [CrossRef]
- He, K.D.; Fang, Z.F.; Yan, N.; Yang, W.H. The Dynamic Response Analysis of Fluid-Solid coupling Properties for Underwater Buoy Based on Virtual Mass. Sci. Technol. Eng. 2013, 13, 7496–7500. [Google Scholar]
- Li, Q.H.; Liu, G.M.; Xue, K. Free vibration analysis of circular thin plates under arbitrary elastic boundary conditions. J. Ship Mech. 2015, 1, 162–168. [Google Scholar]
- Yang, J.; Zhang, P.; Chen, H.H. New MD Nastran Finite Element Example Tutorial; China Machine Press: Beijing, China, 2008. [Google Scholar]
- Gao, S.Y. The Vibro-Acoustic Calculation and Characteristic Analysis of the Underwater Shell Structures Based on Virtual Mass Method; Harbin Engineering University: Harbin, China, 2015. [Google Scholar]
- Editorial Committee of "Mechanical Engineering Material Performance Data Manual". Mechanical Engineering Material Performance Data Manual; Machinery Industry Press: Beijing, China, 1995. (In Chinese) [Google Scholar]
- Erwin, H. Analytical Strength Assessment of Components in Mechanical Engineering, 5th ed.; FKM Guideline: Frankfurt/Main, Germany, 2003. [Google Scholar]
- Huang, H.X. Random Loading Fatigue Test and its Life Estimation; Guangxi University: Nanning, China, 2014. [Google Scholar]
- Chu, J.; Zheng, S.L. Preliminary Study on Quantitative Evaluation of Load Order Effect under Spectral Load. Chin. Mech. Eng. 2015, 26, 365–368, 378. [Google Scholar]
- Wang, M.X.; Li, Y.X.; Qin, C. Analysis of Fatigue Fracture Morphology of 35CrNiMo Induction Hardened Gear. Mech. Des. Res. 2016, 32, 56–59. (In Chinese) [Google Scholar]
- Bendat, J.S.; Piersol, A.G. Random Data: Analysis and Measurement Procedures; John Wiley & Sons: New York, NY, USA, 2011. [Google Scholar]
- Kang, H.T.; Wu, X.; Khosrovaneh, A.K. Data Processing Procedure for Fatigue Life Prediction of Spot-Welded Joints Using a Structural Stress Method. ASTM Int. 2017, 17, 198–211. [Google Scholar]
© 2020 by the authors. Licensee MDPI, Basel, Switzerland. This article is an open access article distributed under the terms and conditions of the Creative Commons Attribution (CC BY) license (http://creativecommons.org/licenses/by/4.0/).