Strengthening of Bent LVL Beams with Near-Surface Mounted (NSM) FRP Reinforcement


Abstract
:1. Introduction
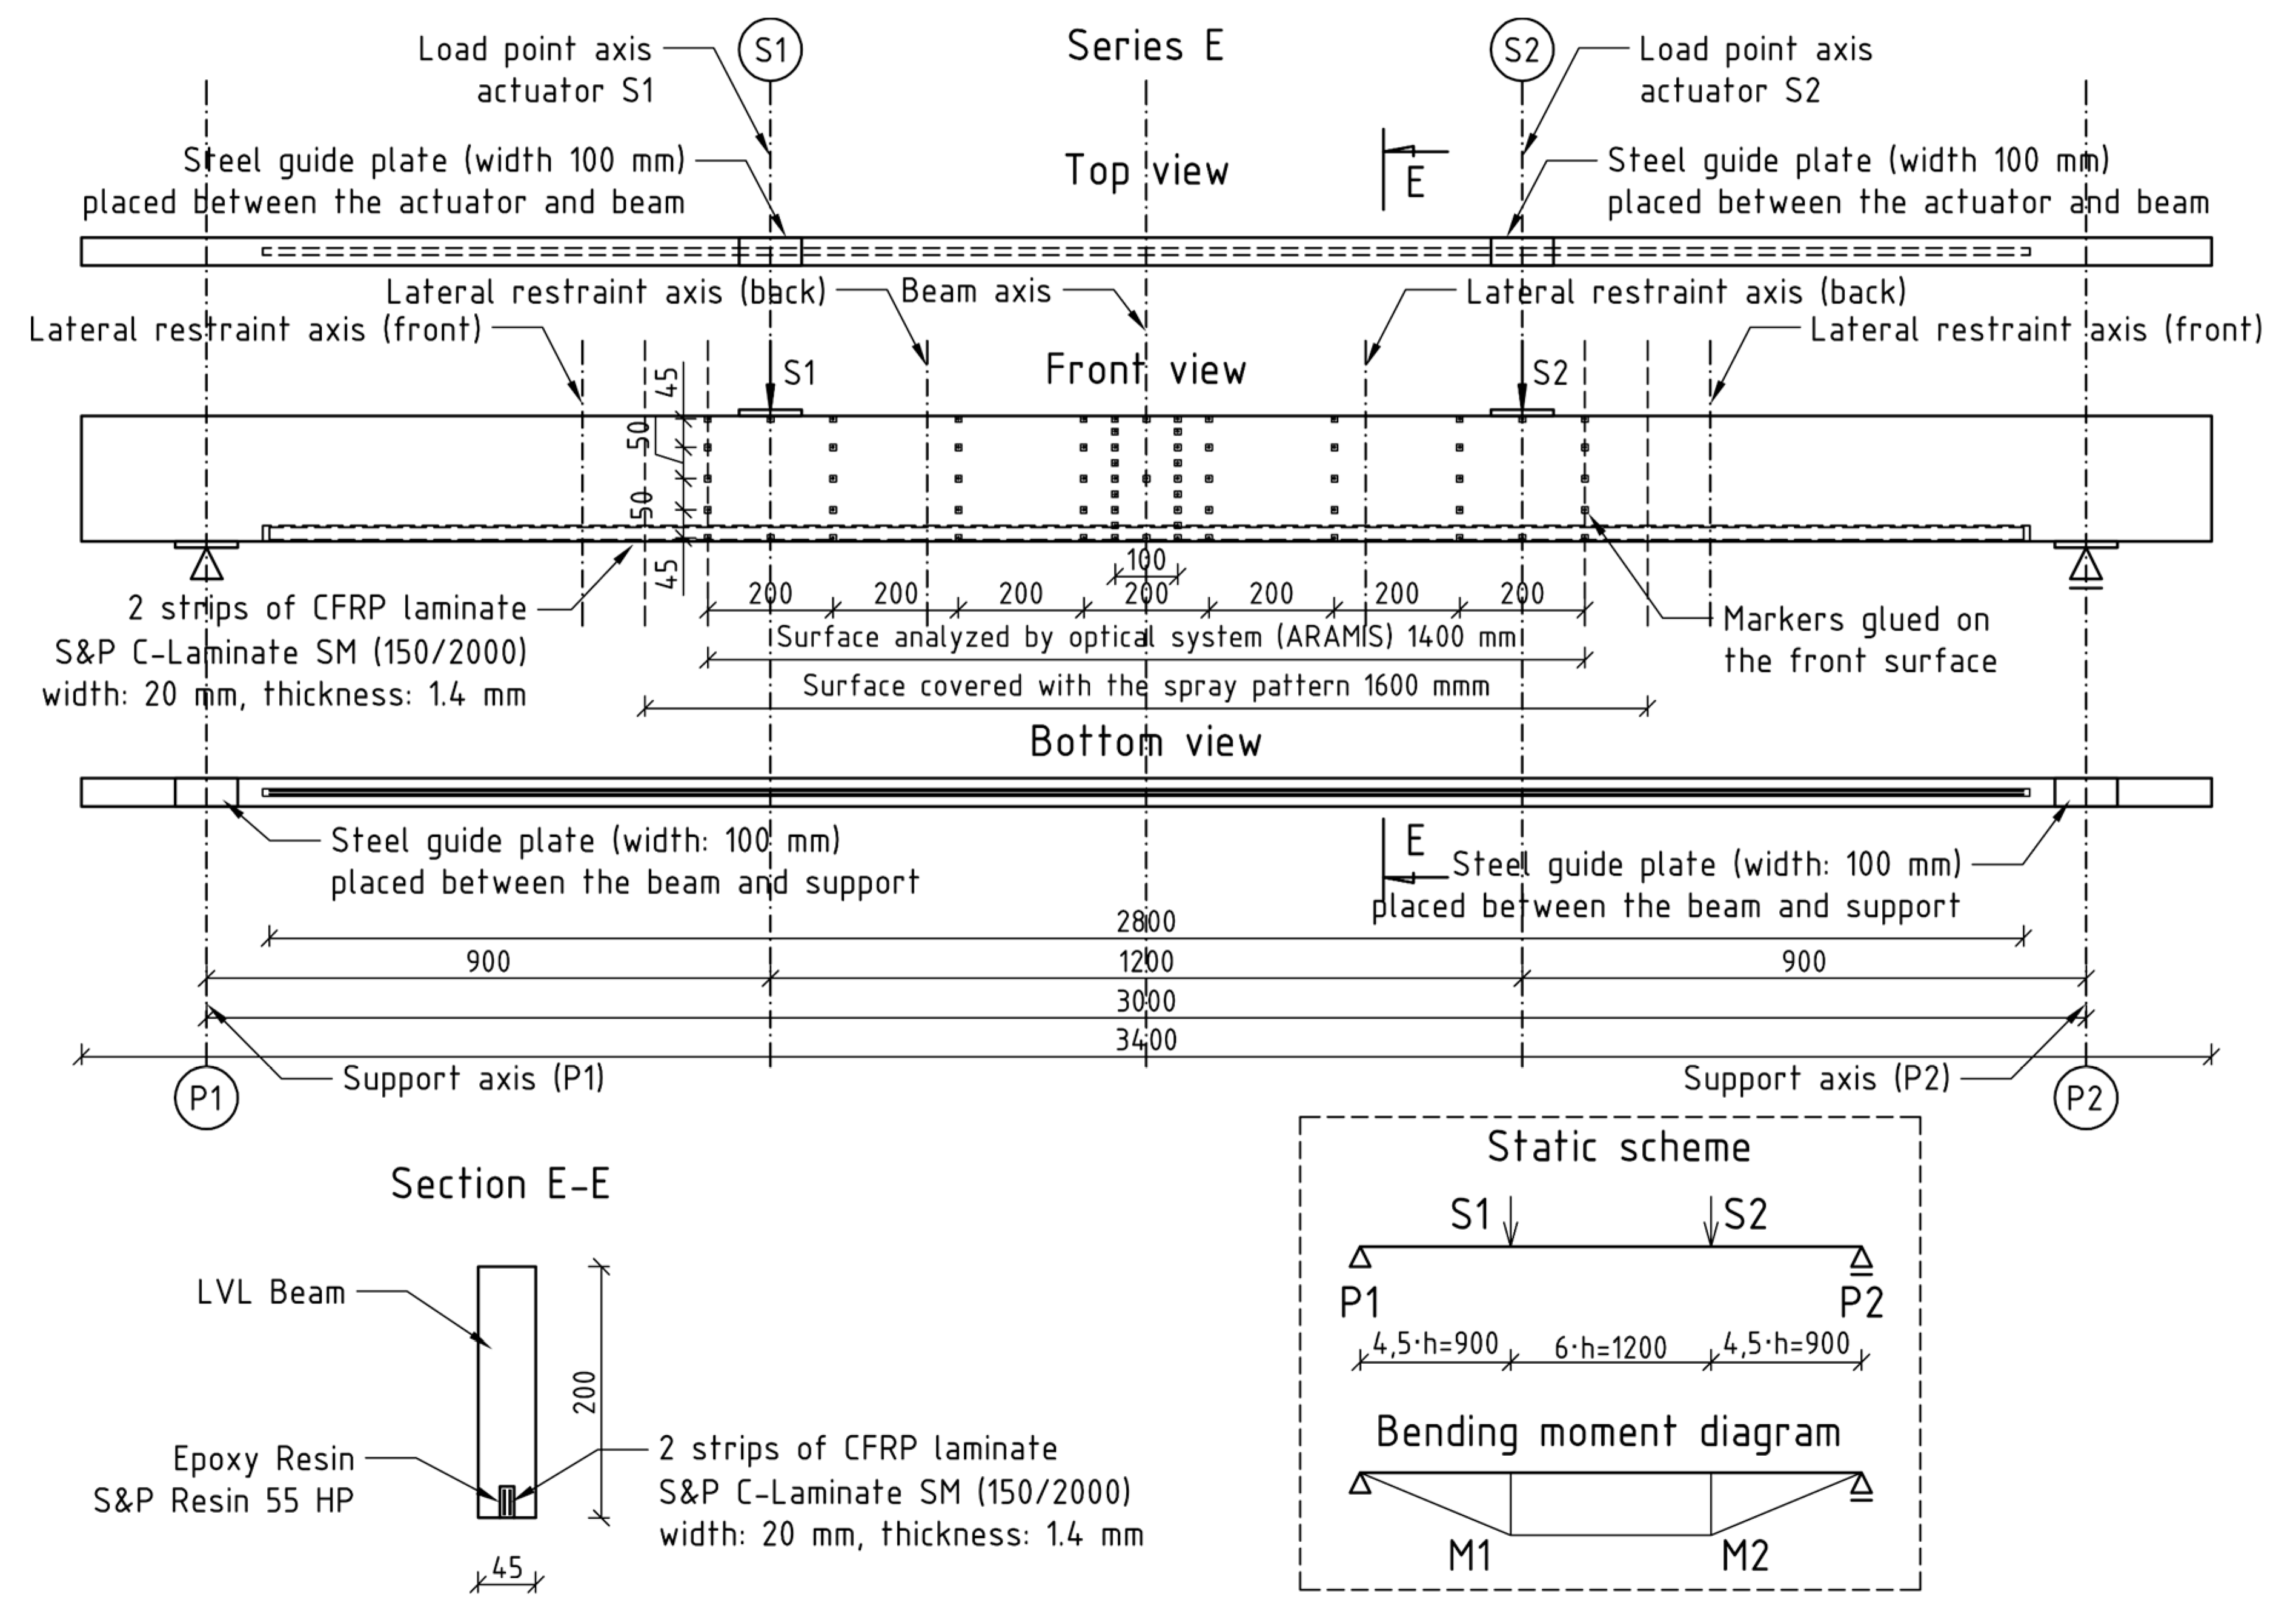
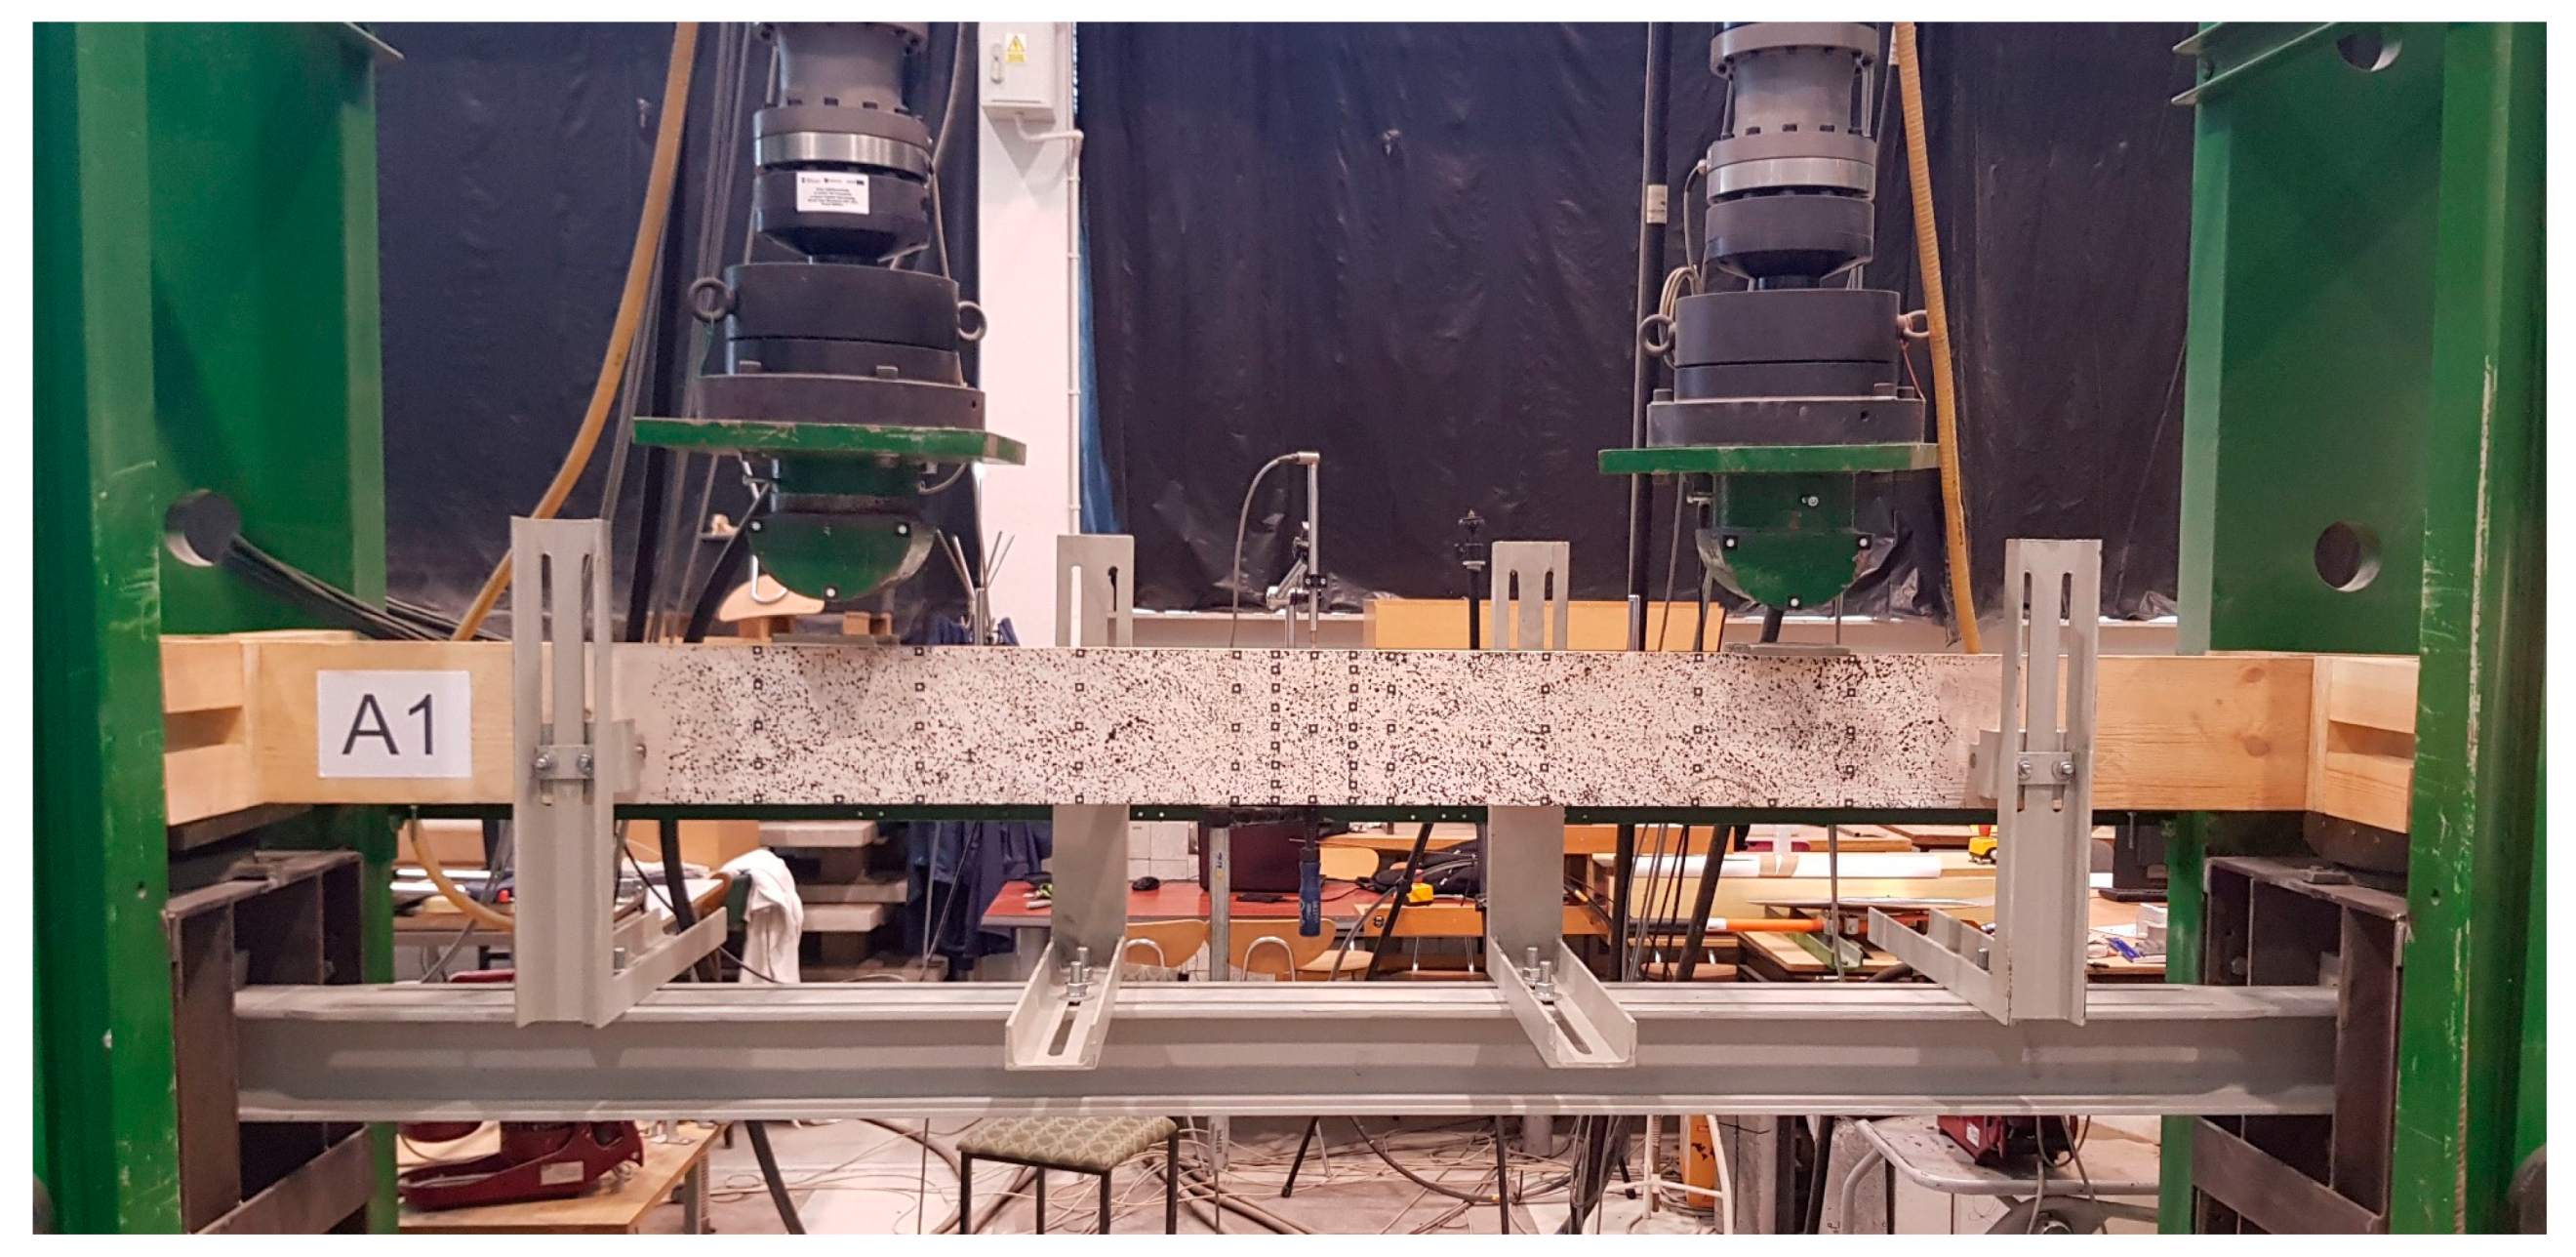
2. Materials and Methods
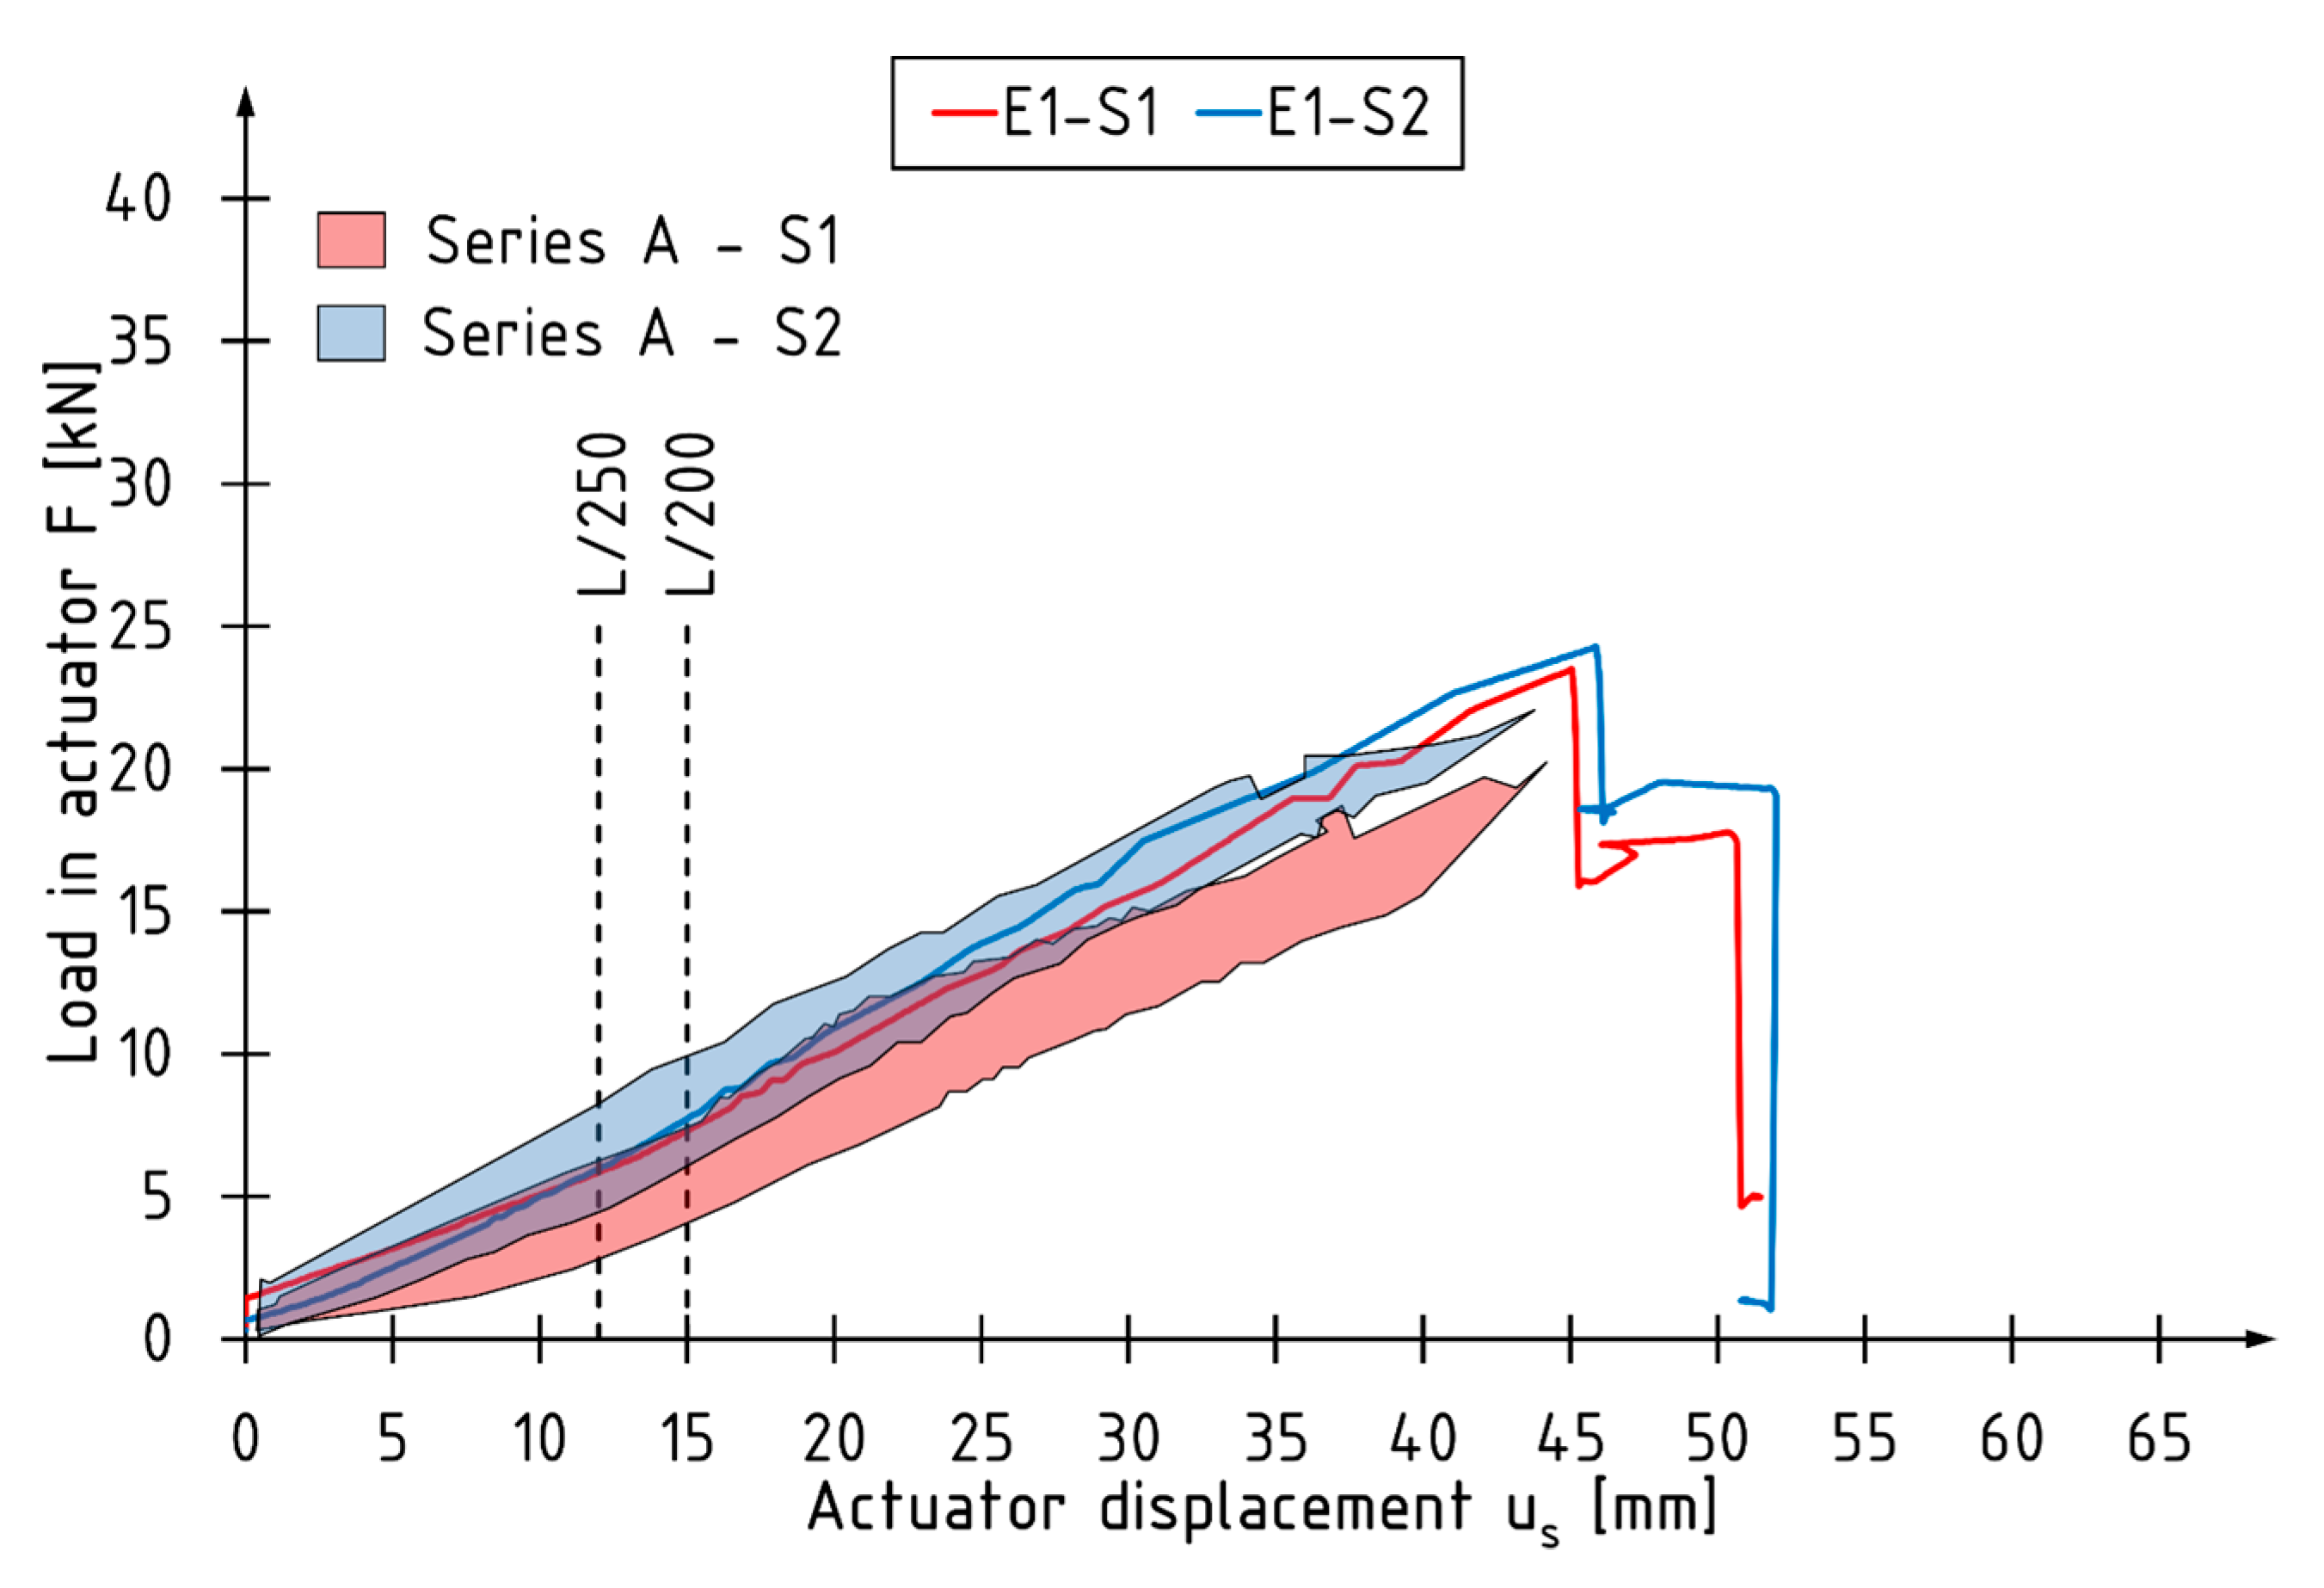
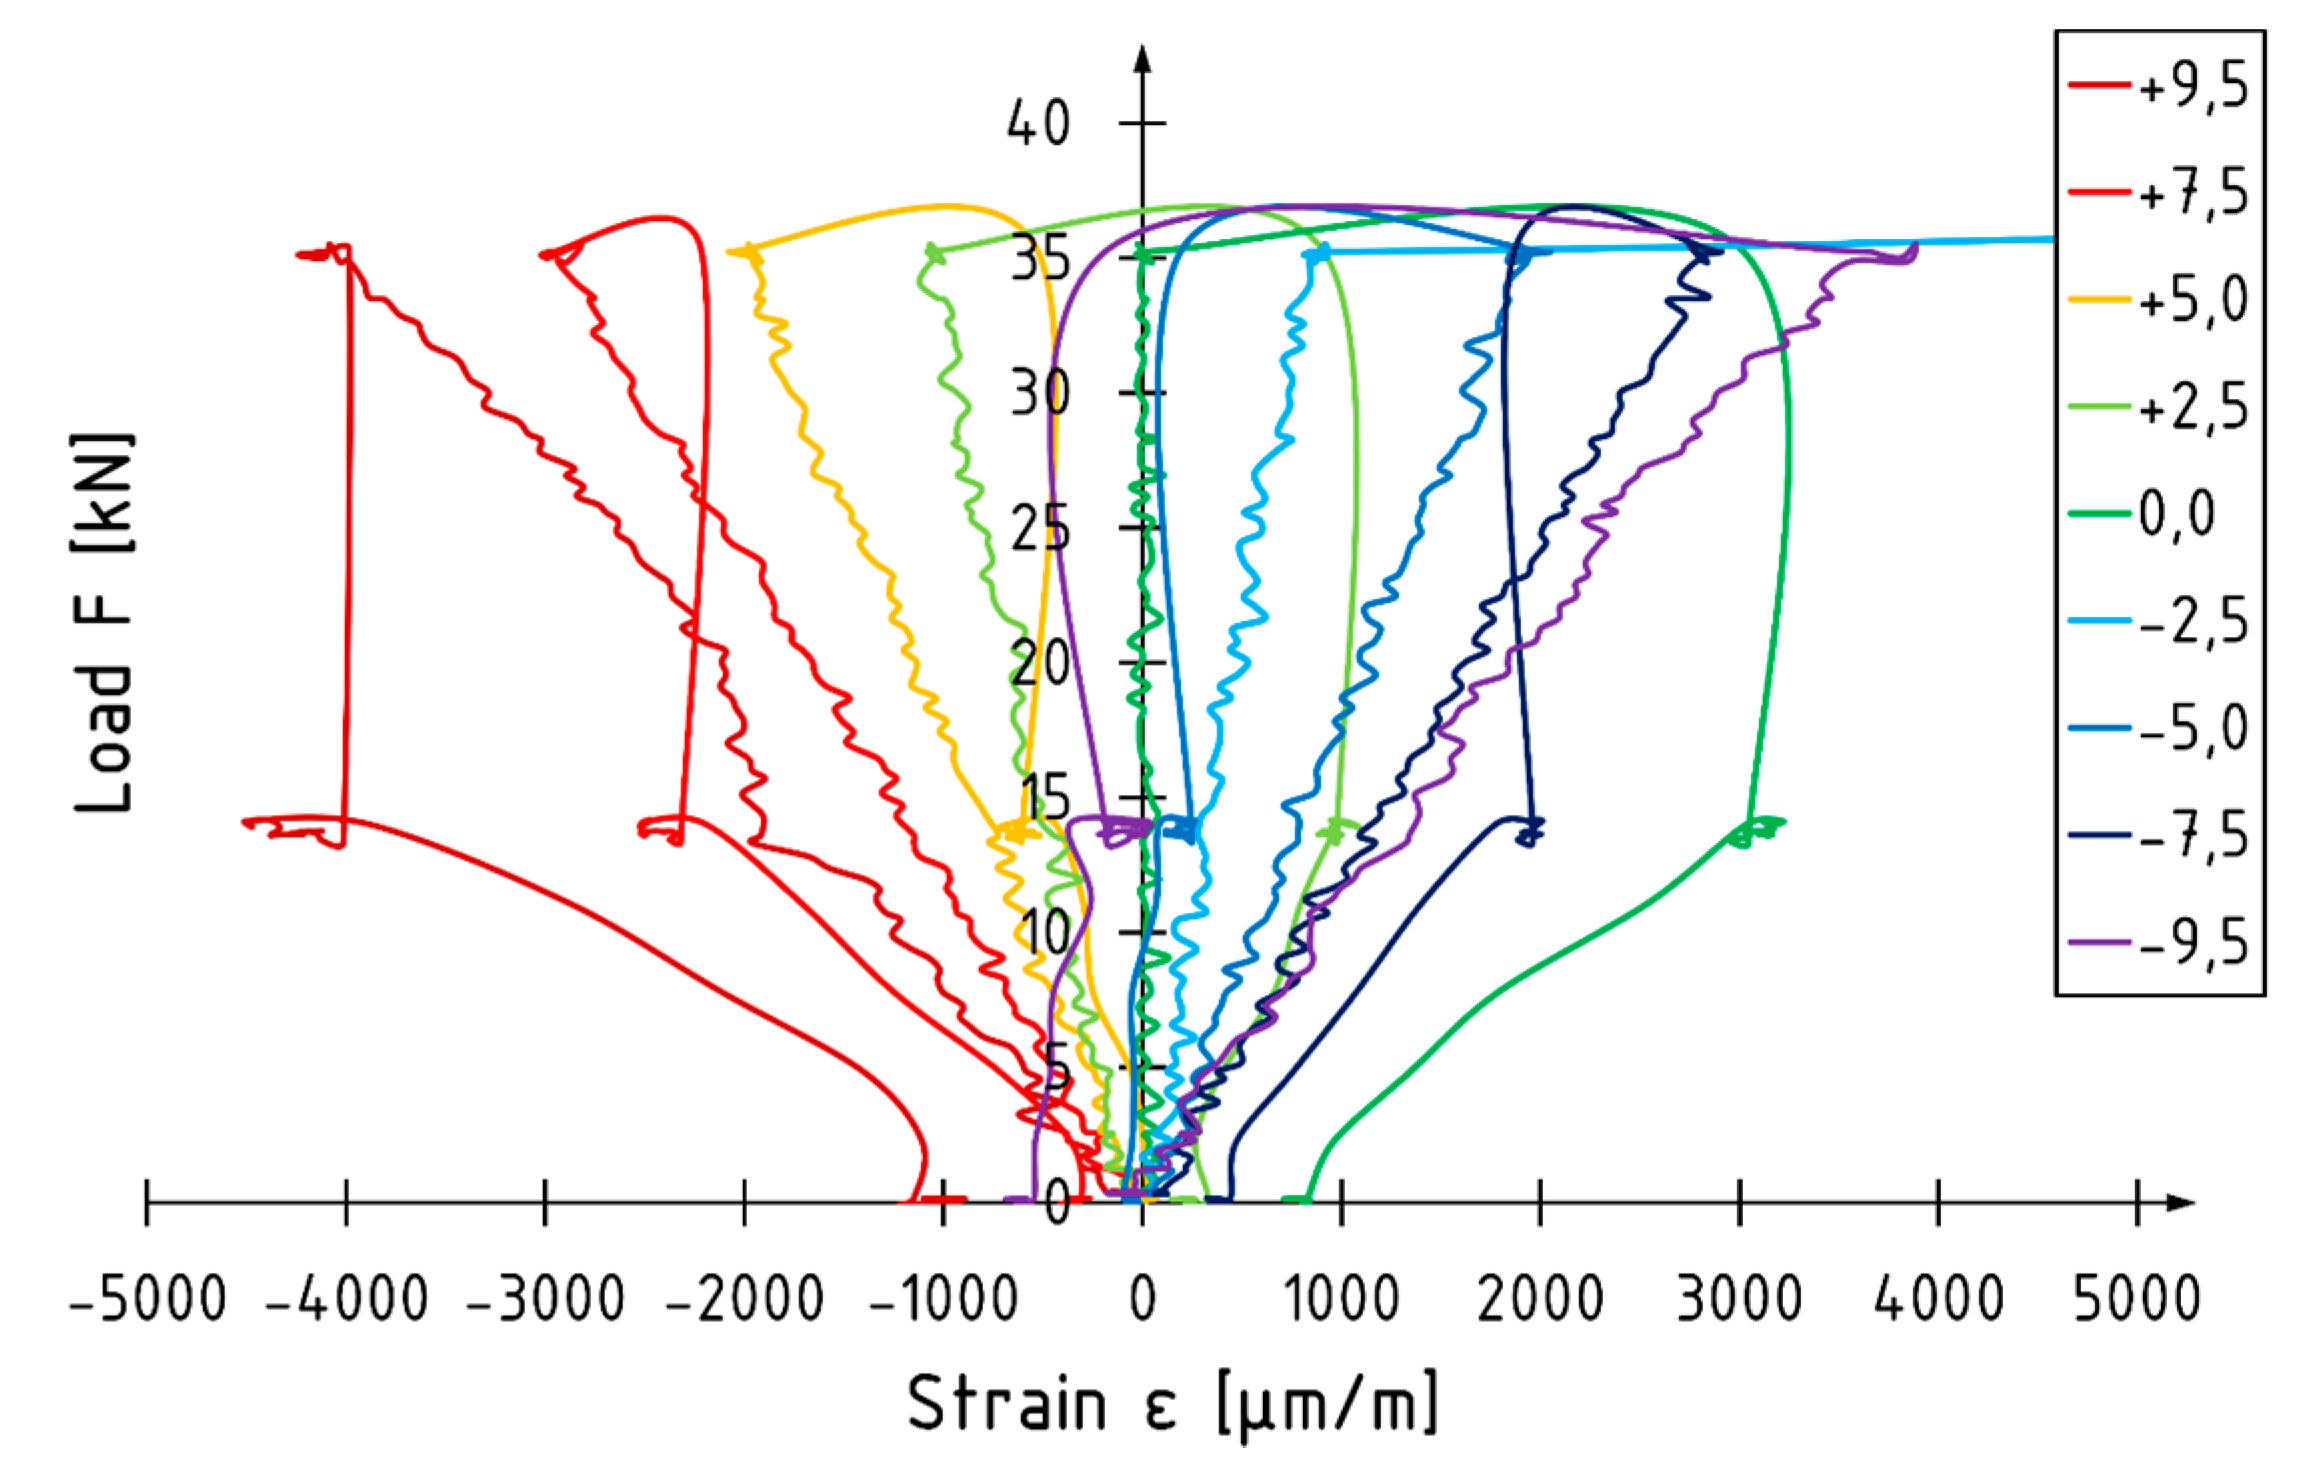
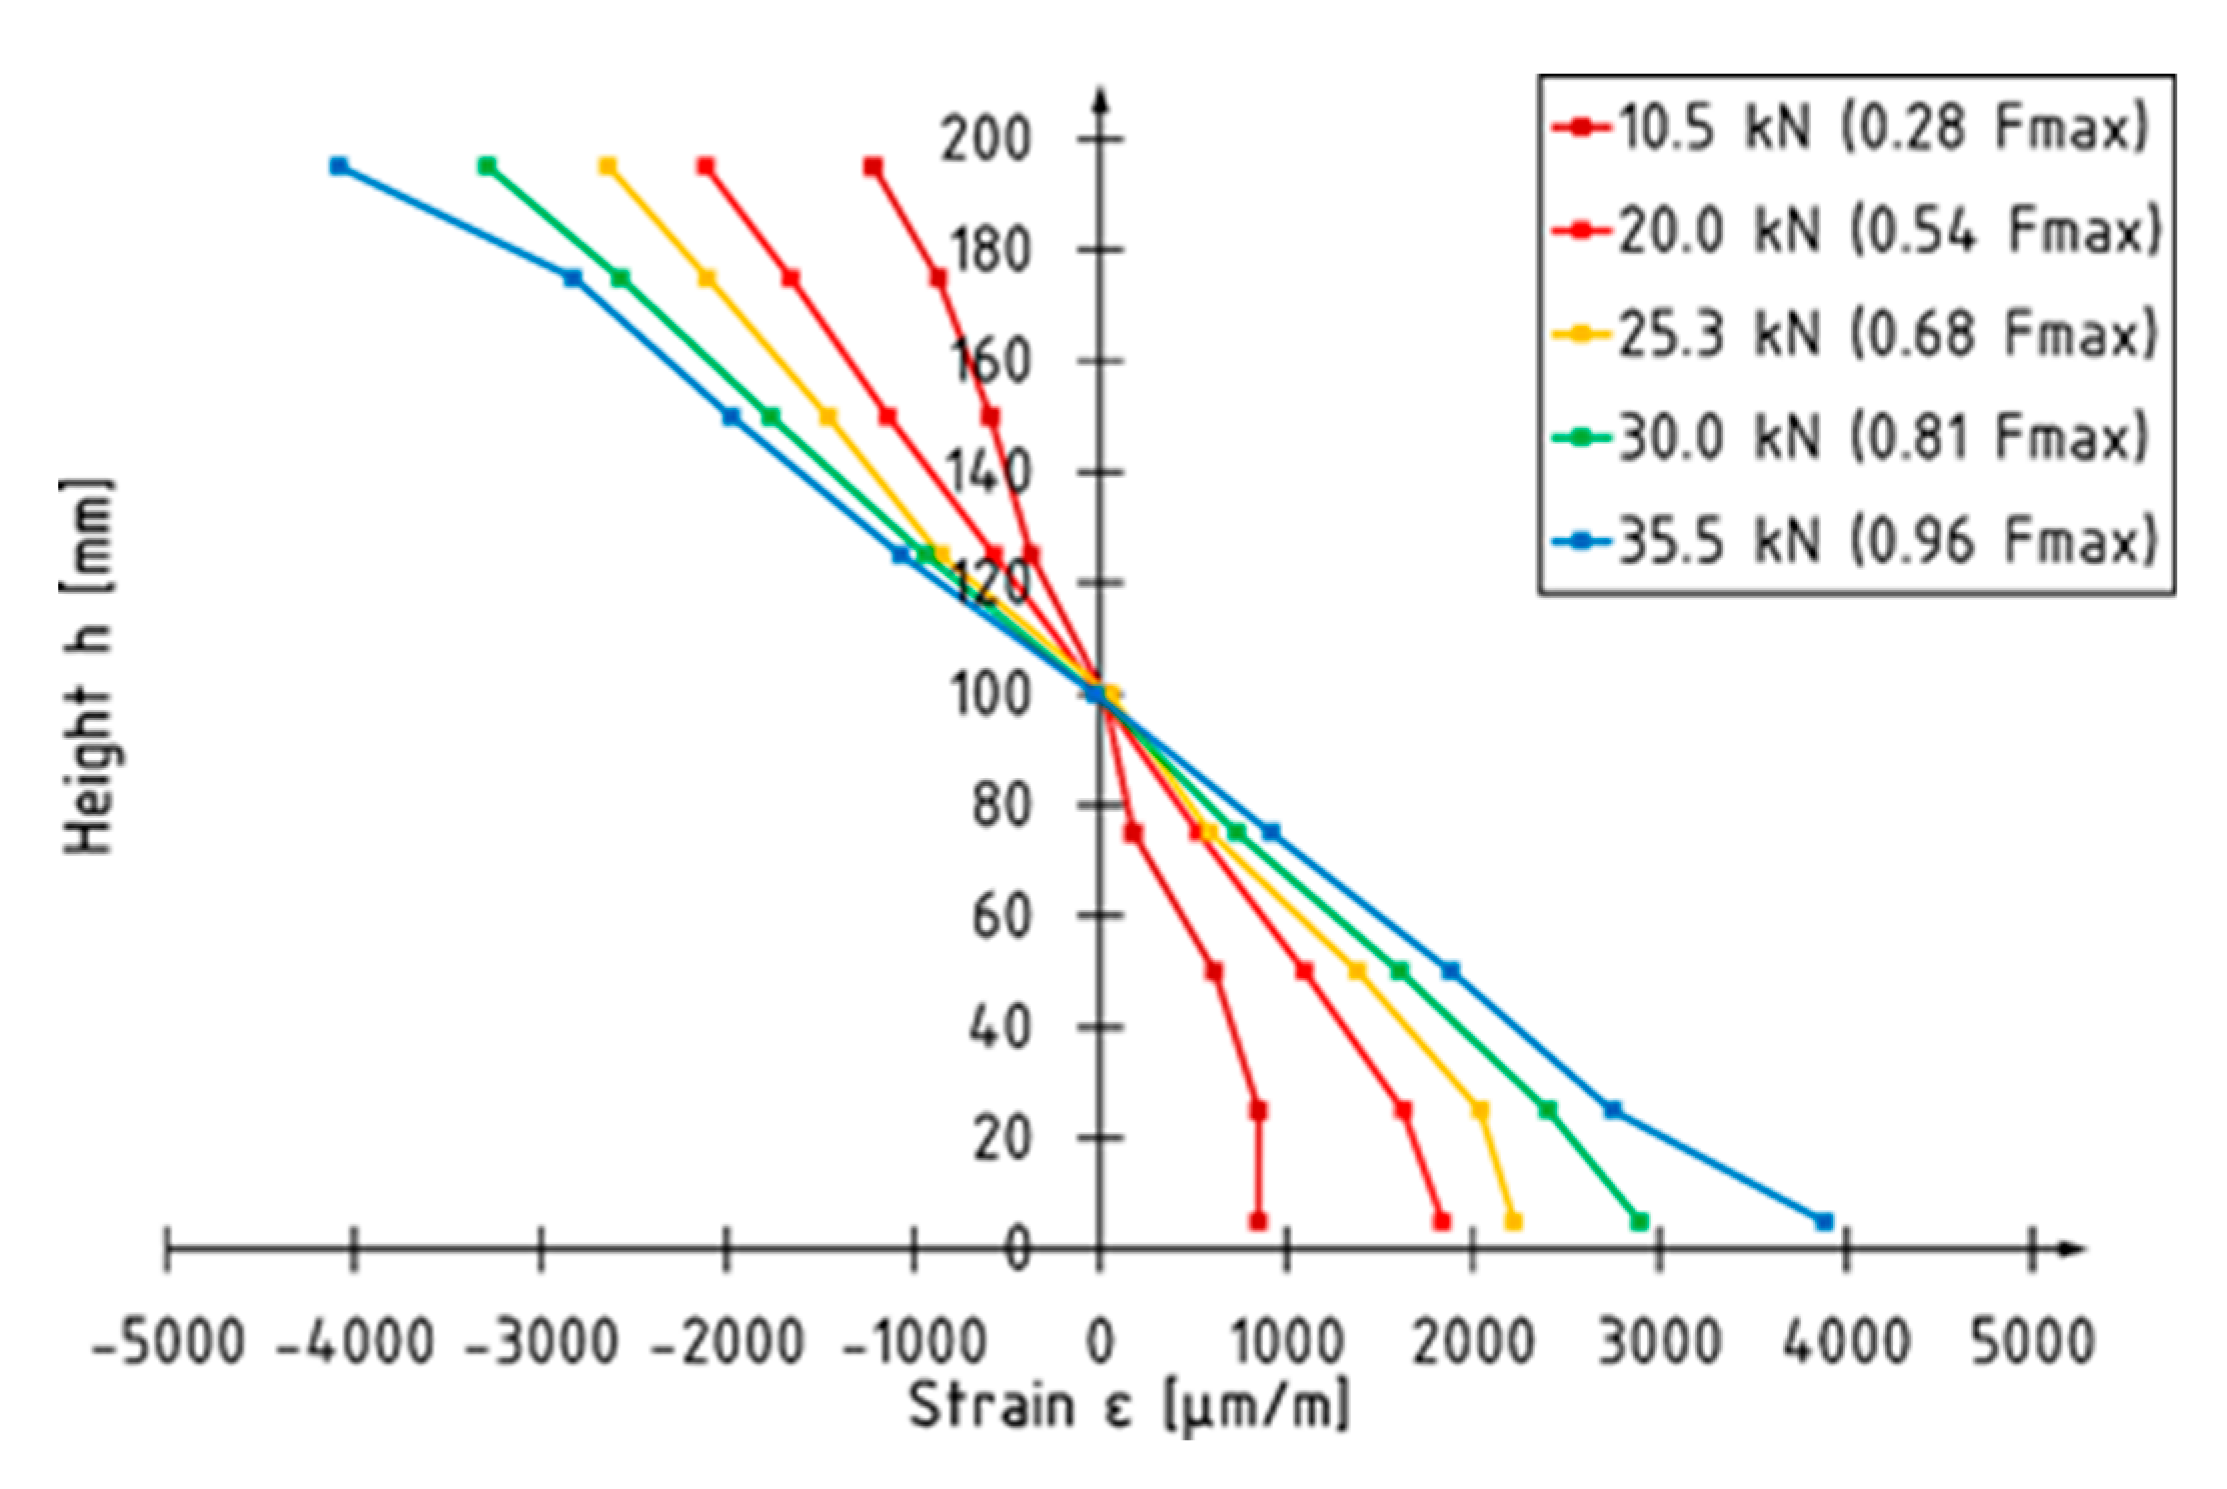
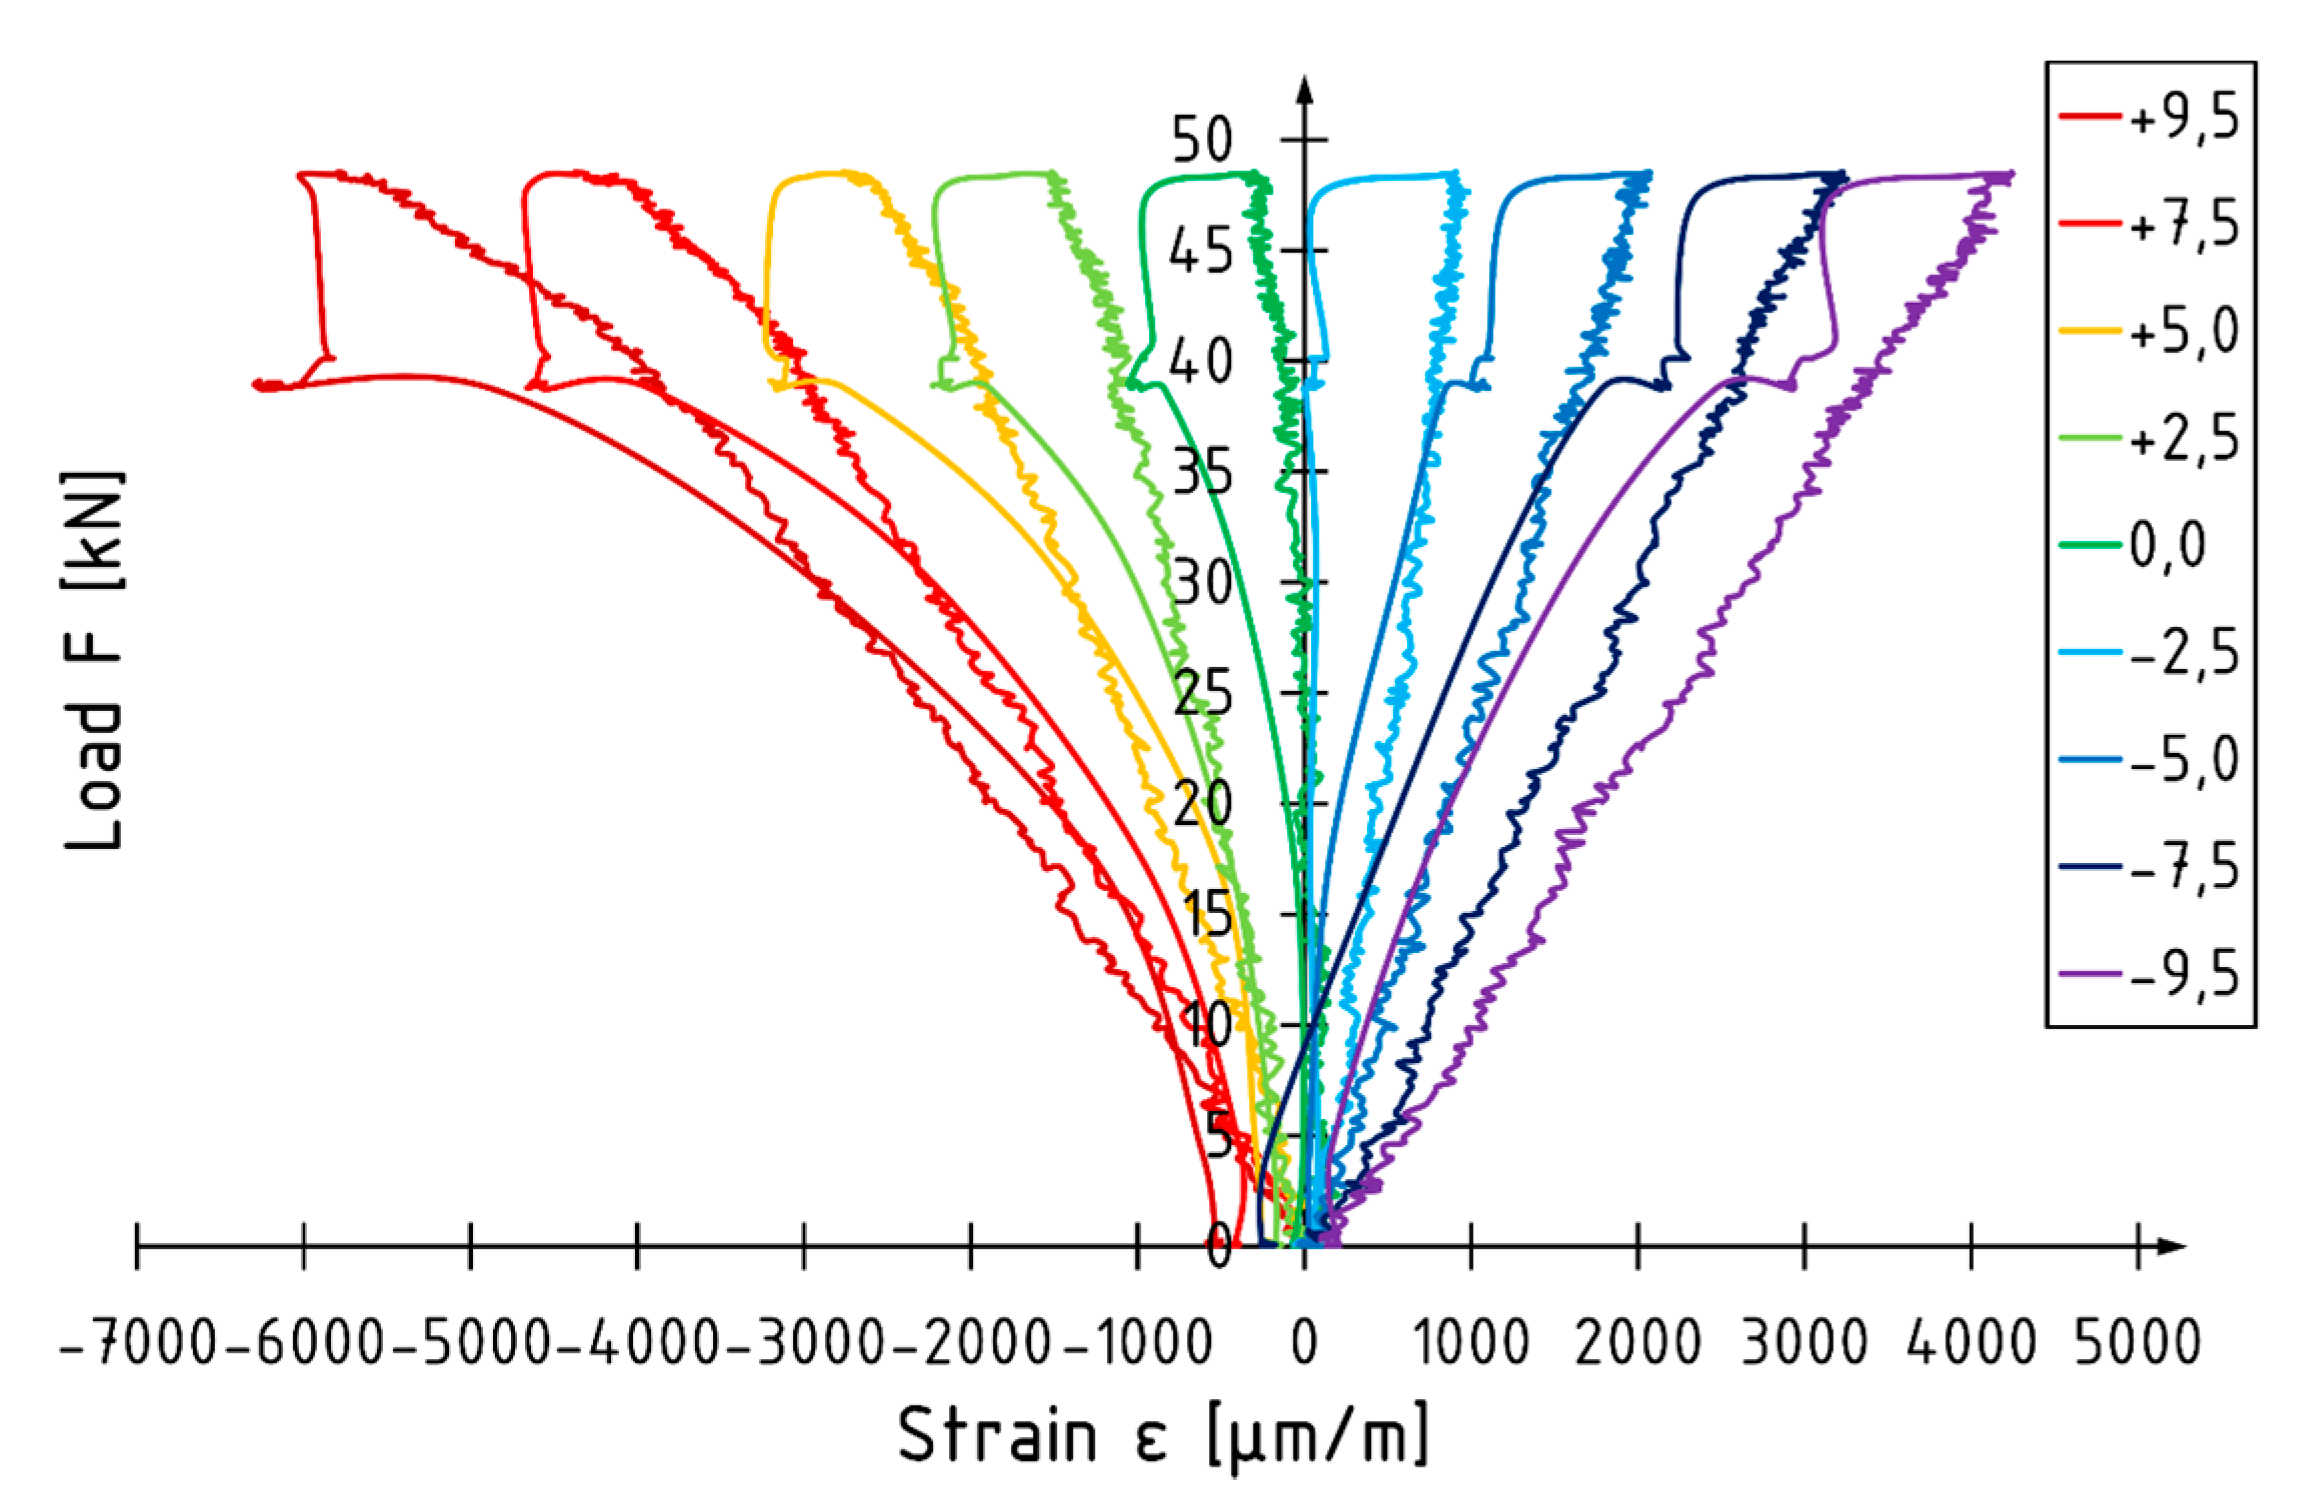
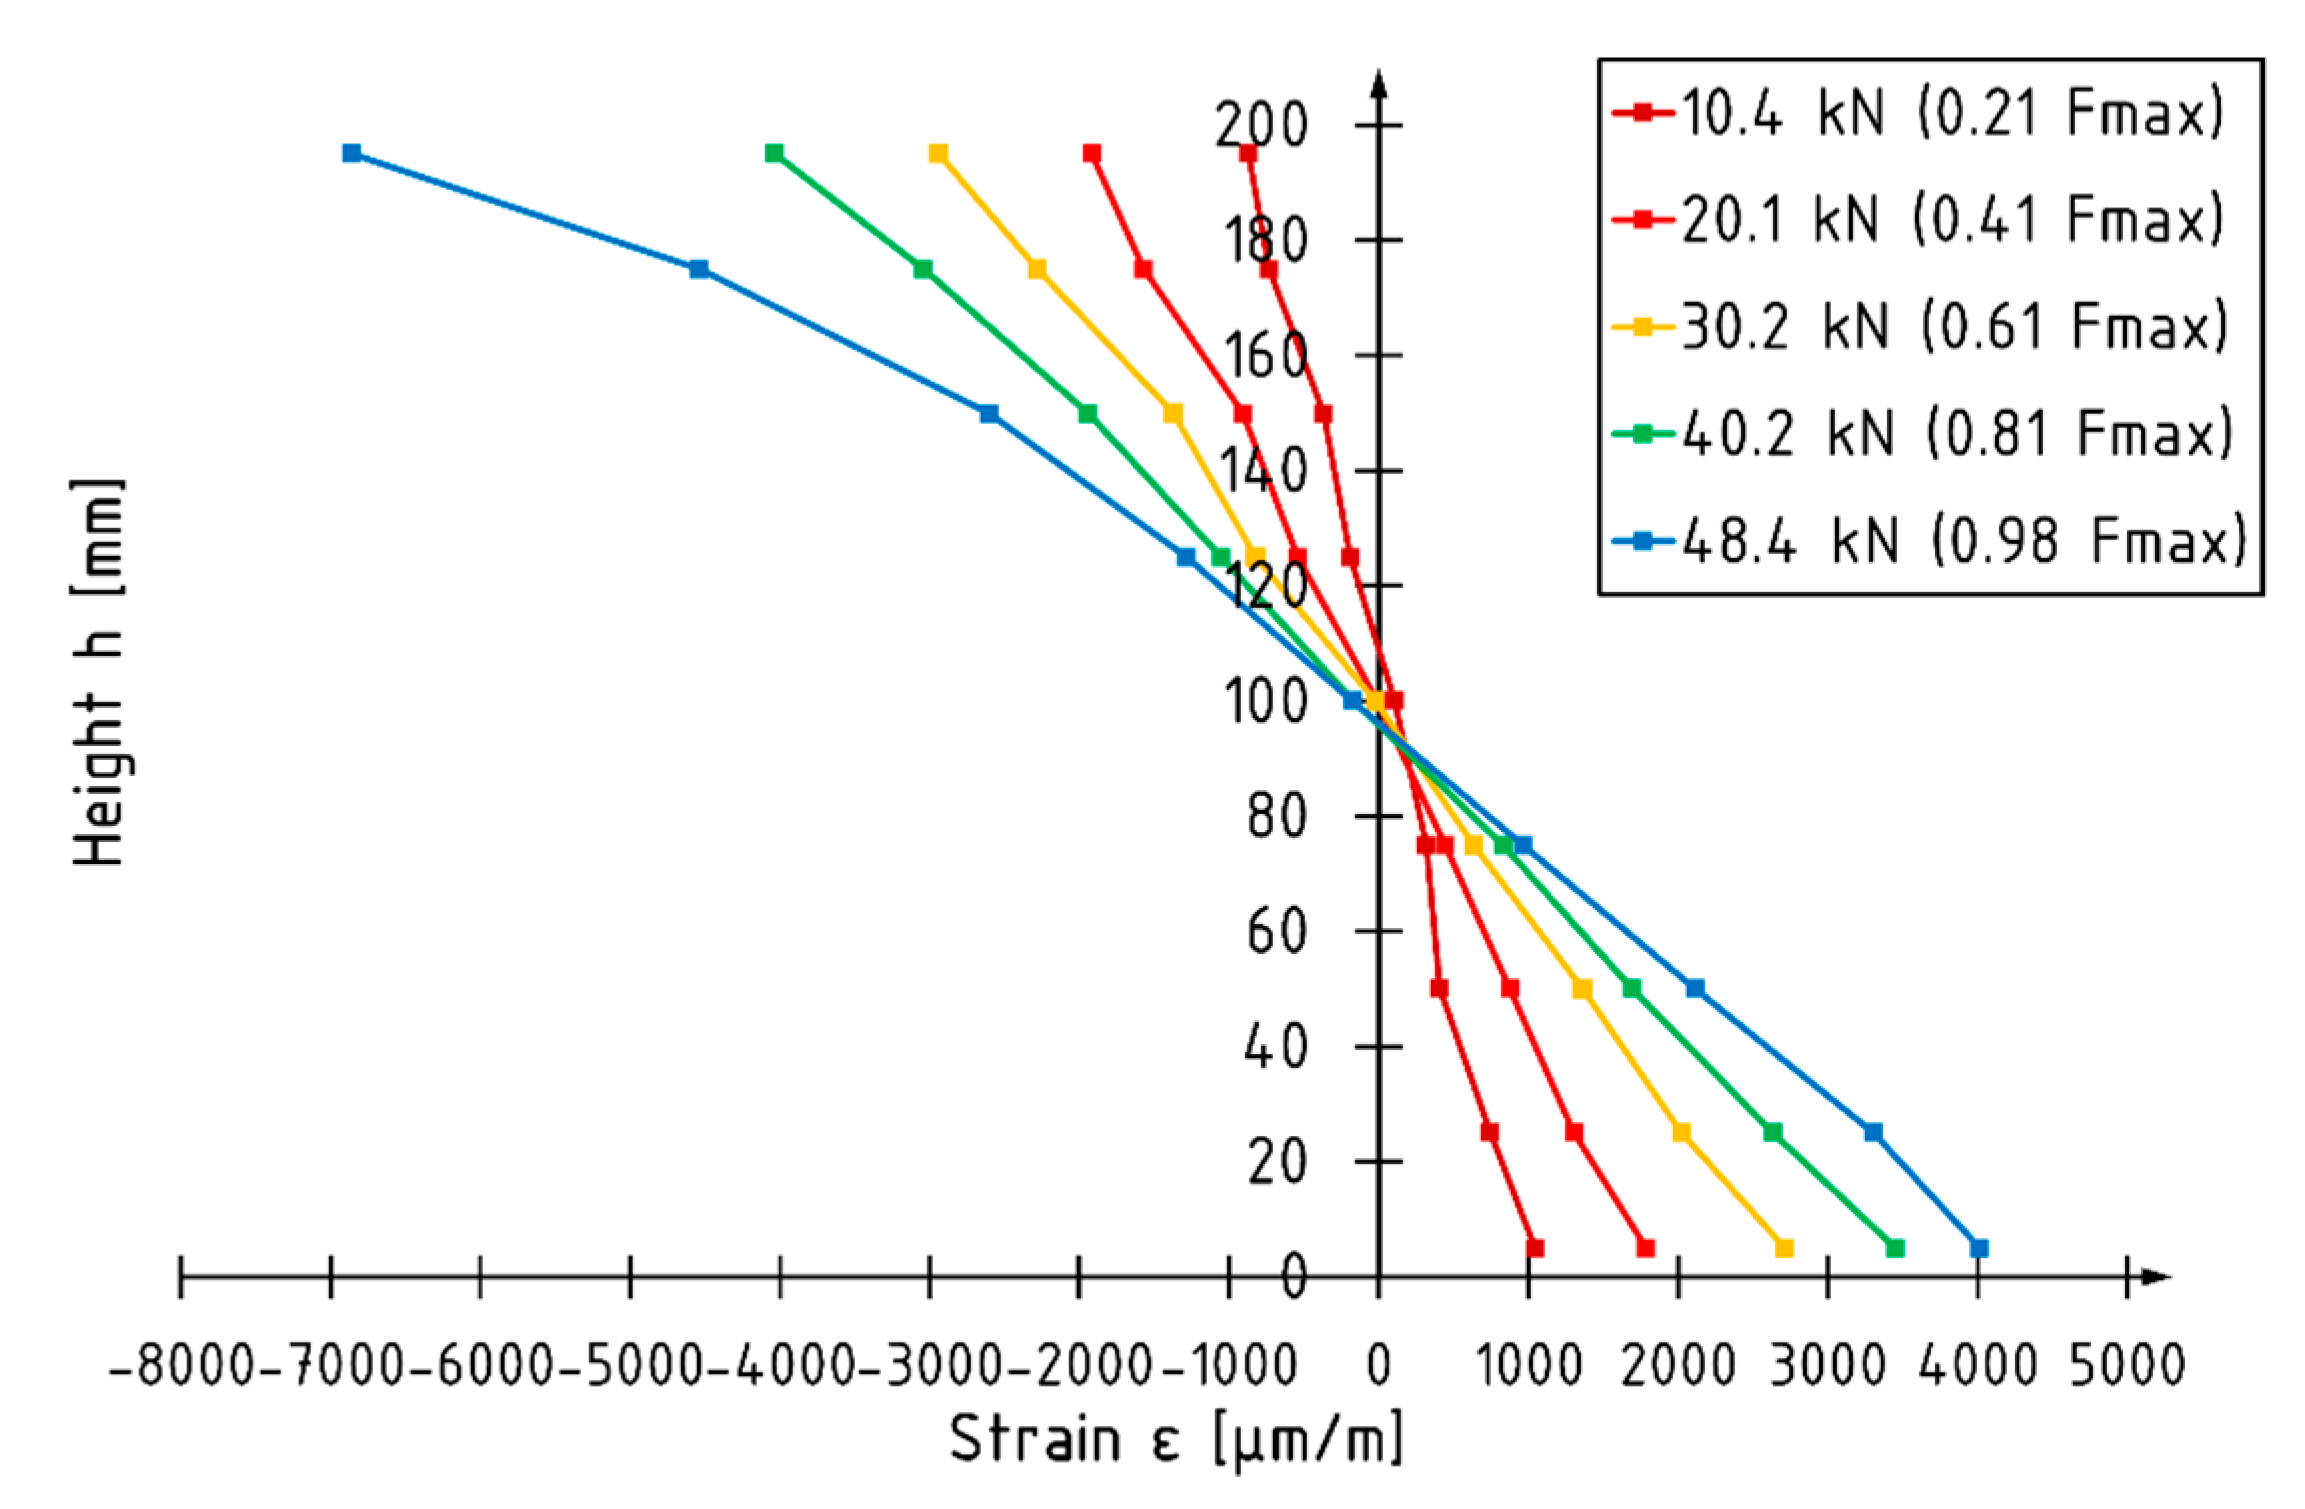
3. Results
4. Discussion and Conclusions
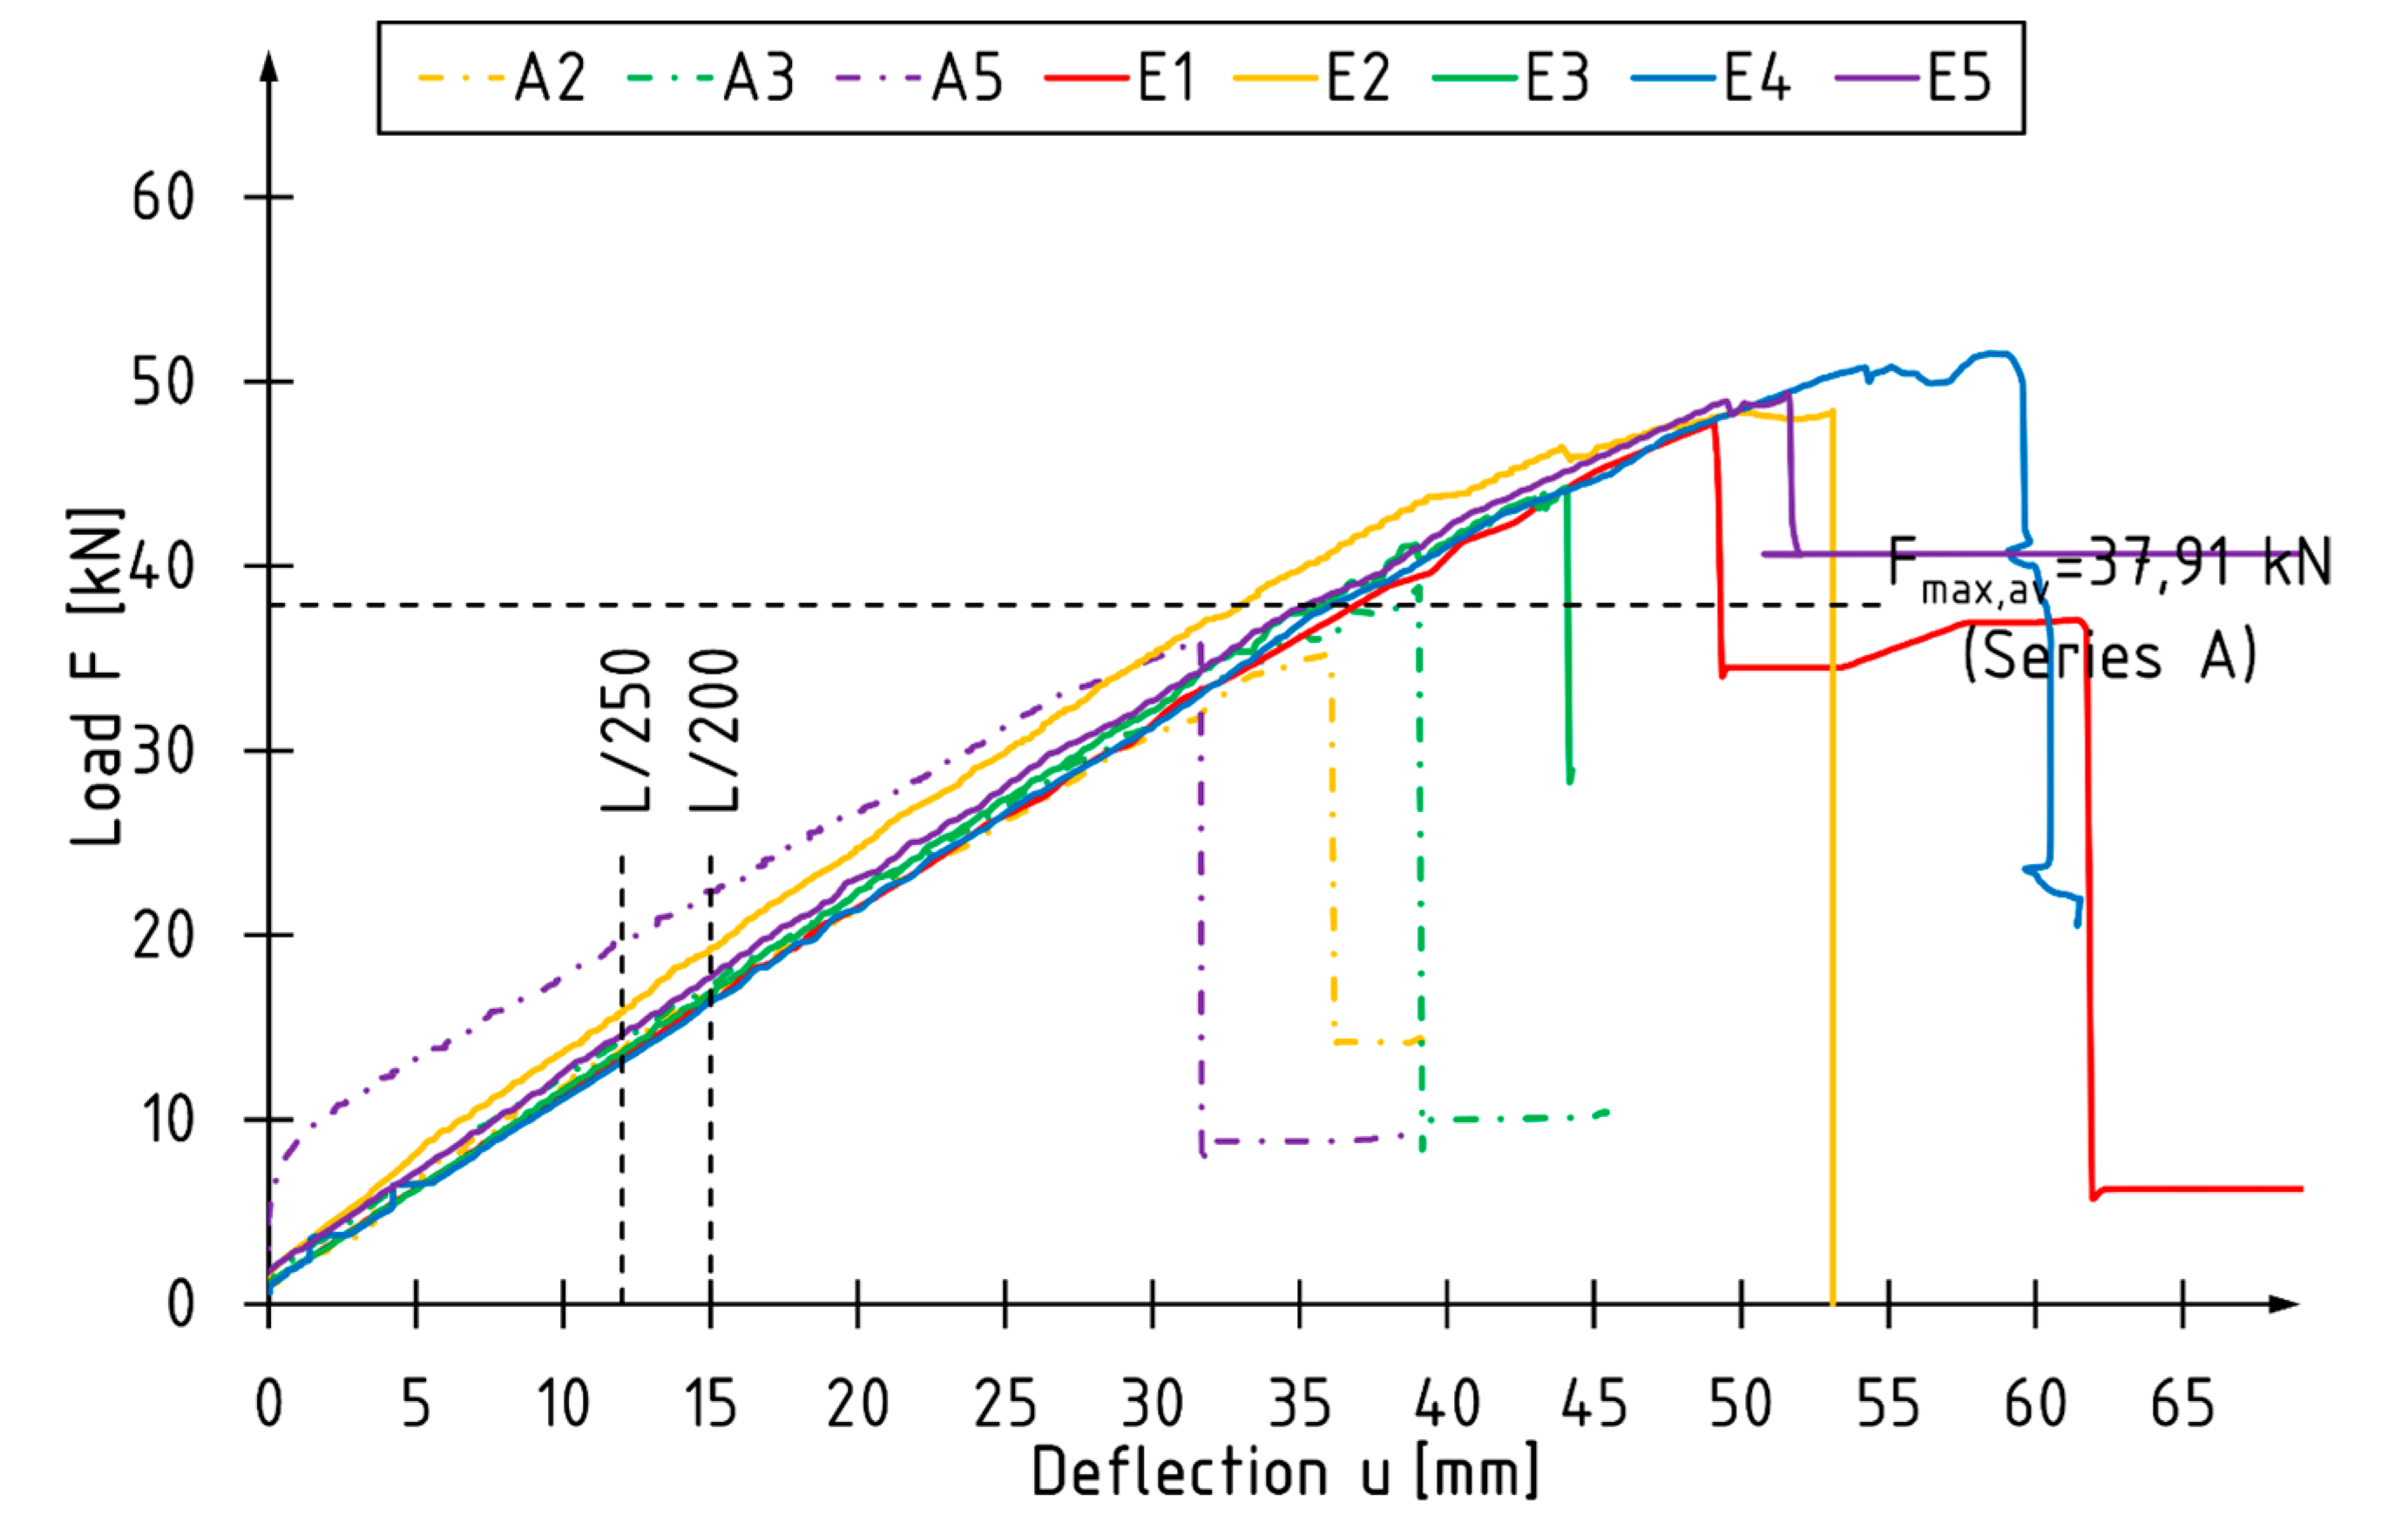
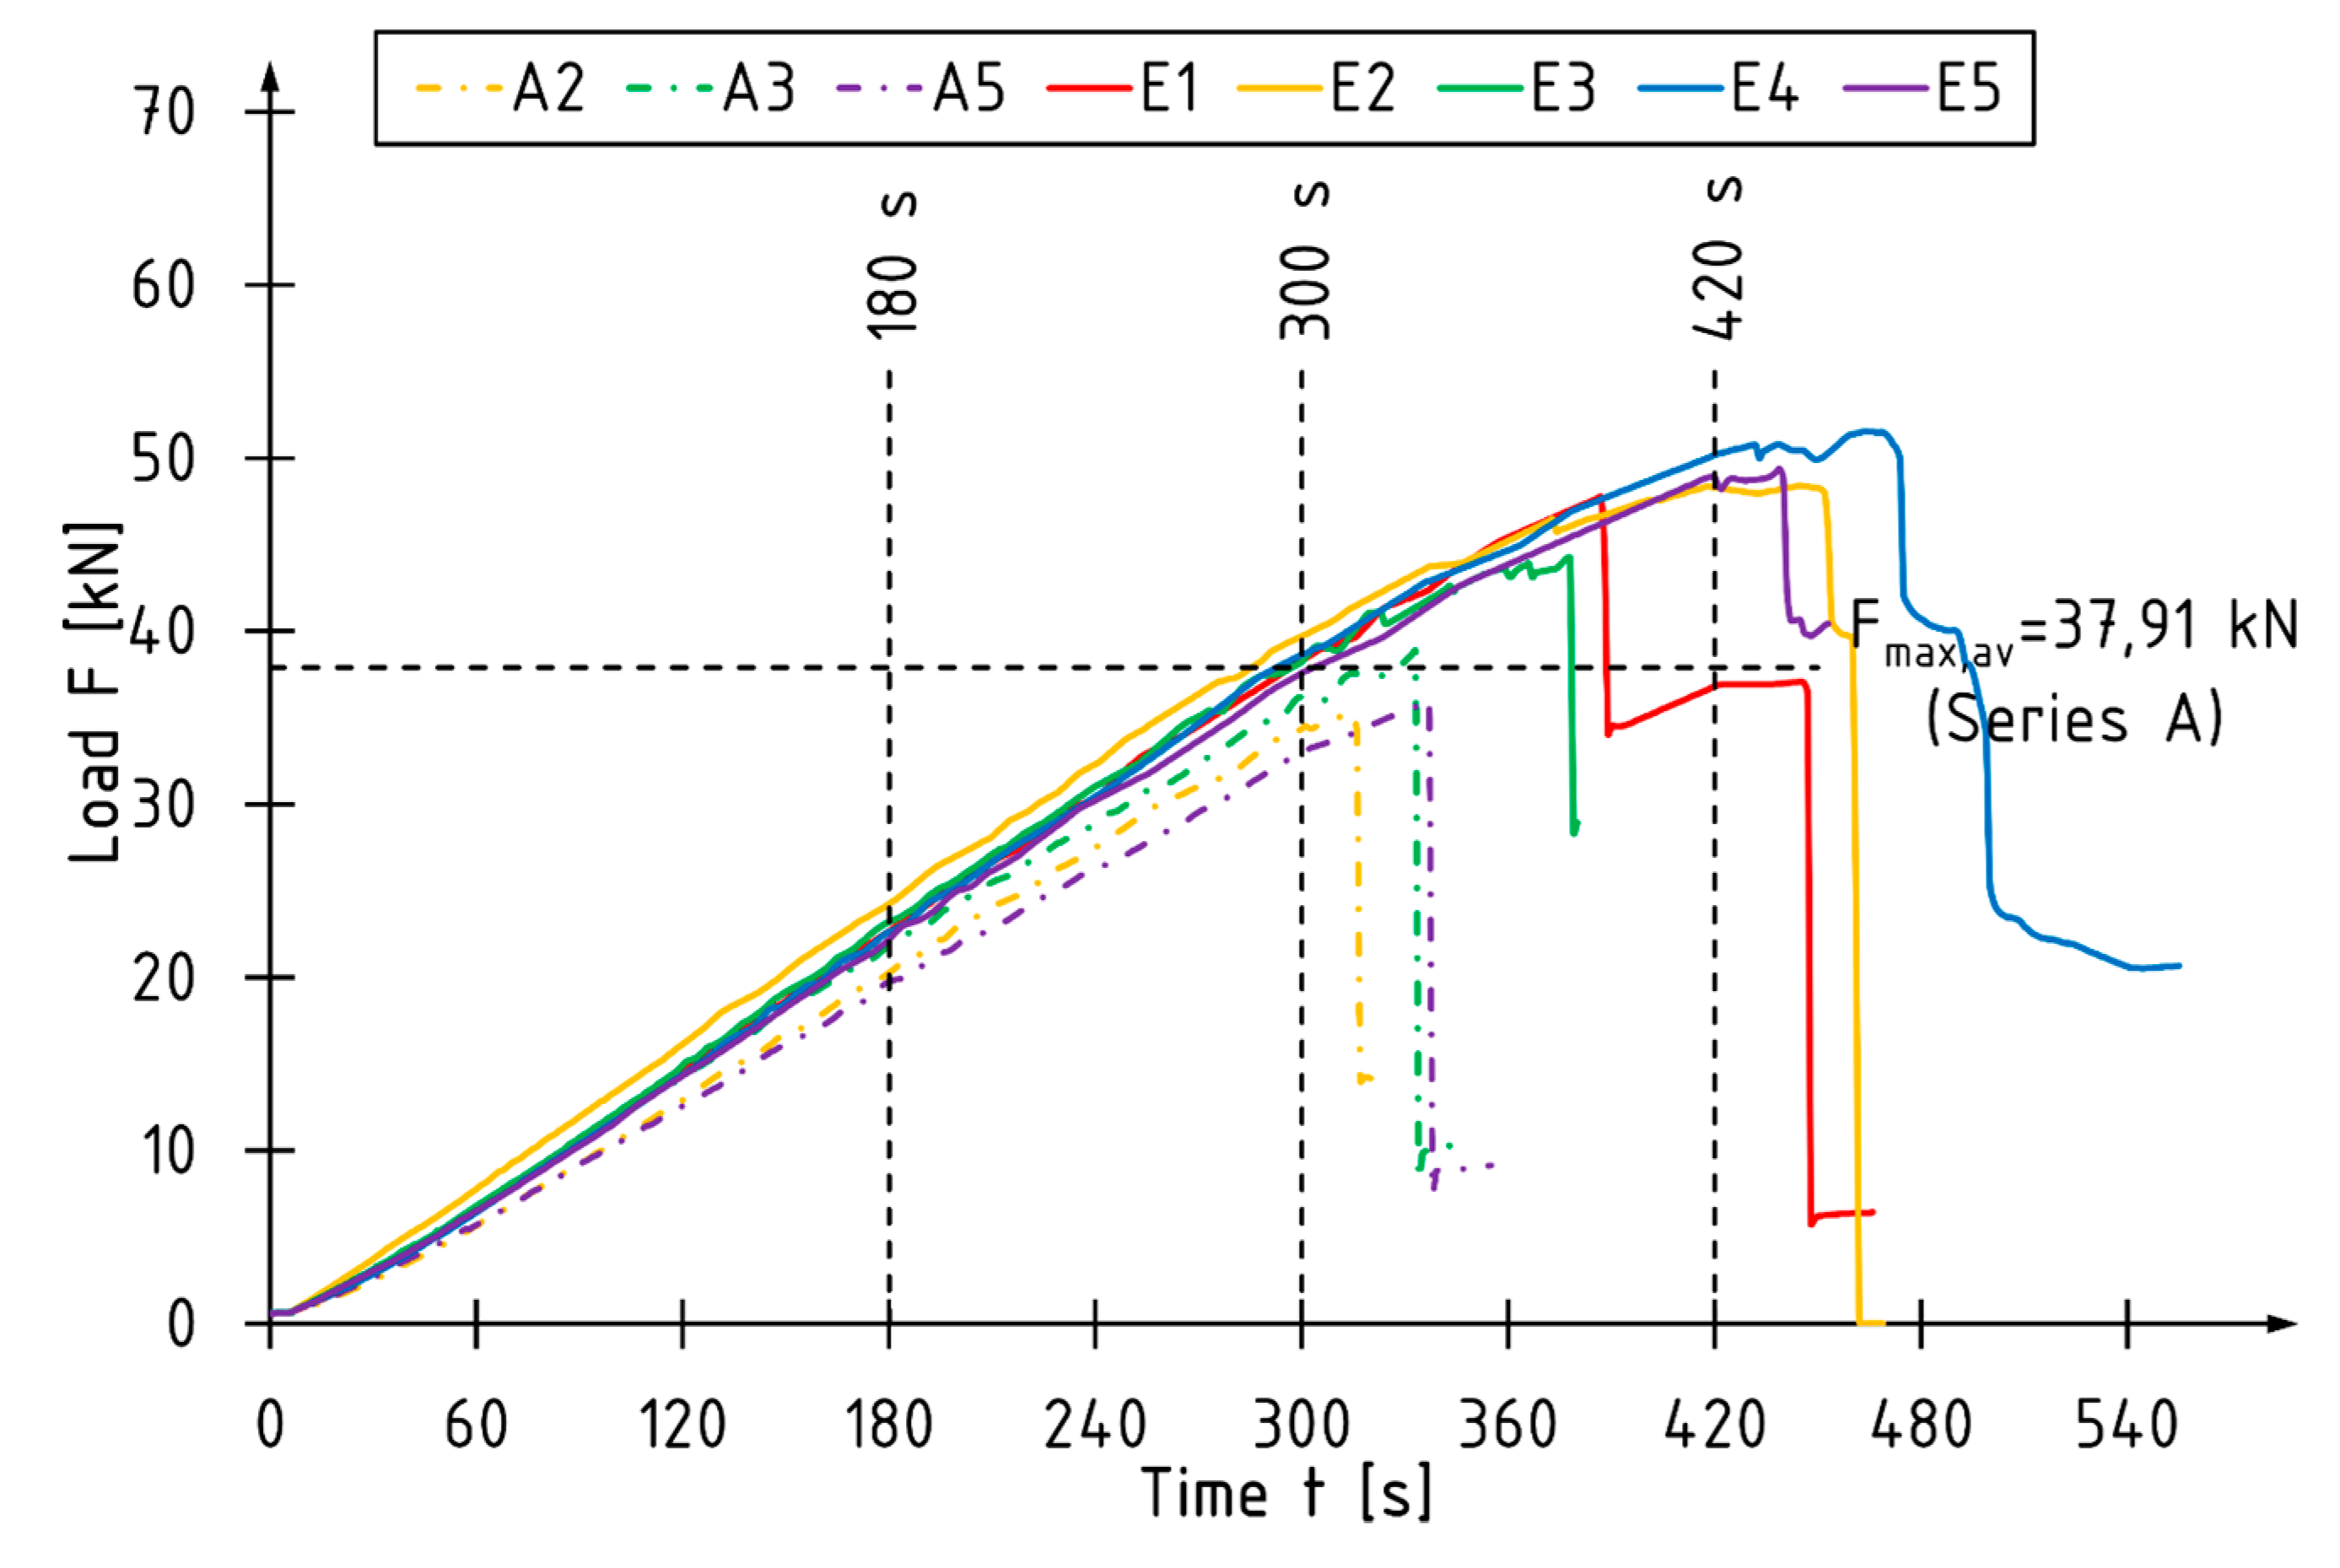
- The control of the load speed of the actuators by means of a fixed displacement rate may cause disturbances in the cross-sectional force values compared to the standard 4-point bending test distribution. A simultaneous loading of the beam with two separately controlled concentrated forces allows for more accurate descriptions of the work of the beams before and immediately after their failure in terms of the working load and its values for individual zones.
- For the unreinforced beams, the maximum loading force and thus the bending moment were usually reached at the actuator number S2, so the average value of the bending moment M2 is 6% higher than the bending moment M1.
- The reinforcement with CFRP laminates glued into the grooves mainly resulted in an increase in the maximum bending moment of the beams—32% and 24% compared to the reference beams for M1 and M2 values, respectively.
- The use of a 0.62% reinforcement ratio resulted in enhancing the global modulus of elasticity in the bending and stiffness coefficients by 11% and 7%, respectively.
- The reinforced beams were characterized by more ductile behavior under bending (non-linear behavior for E2, E4, and E5 beam observed on load versus deflection diagram in the final phase of the tests), which can be equated with greater use of the compression zone of the cross-section.
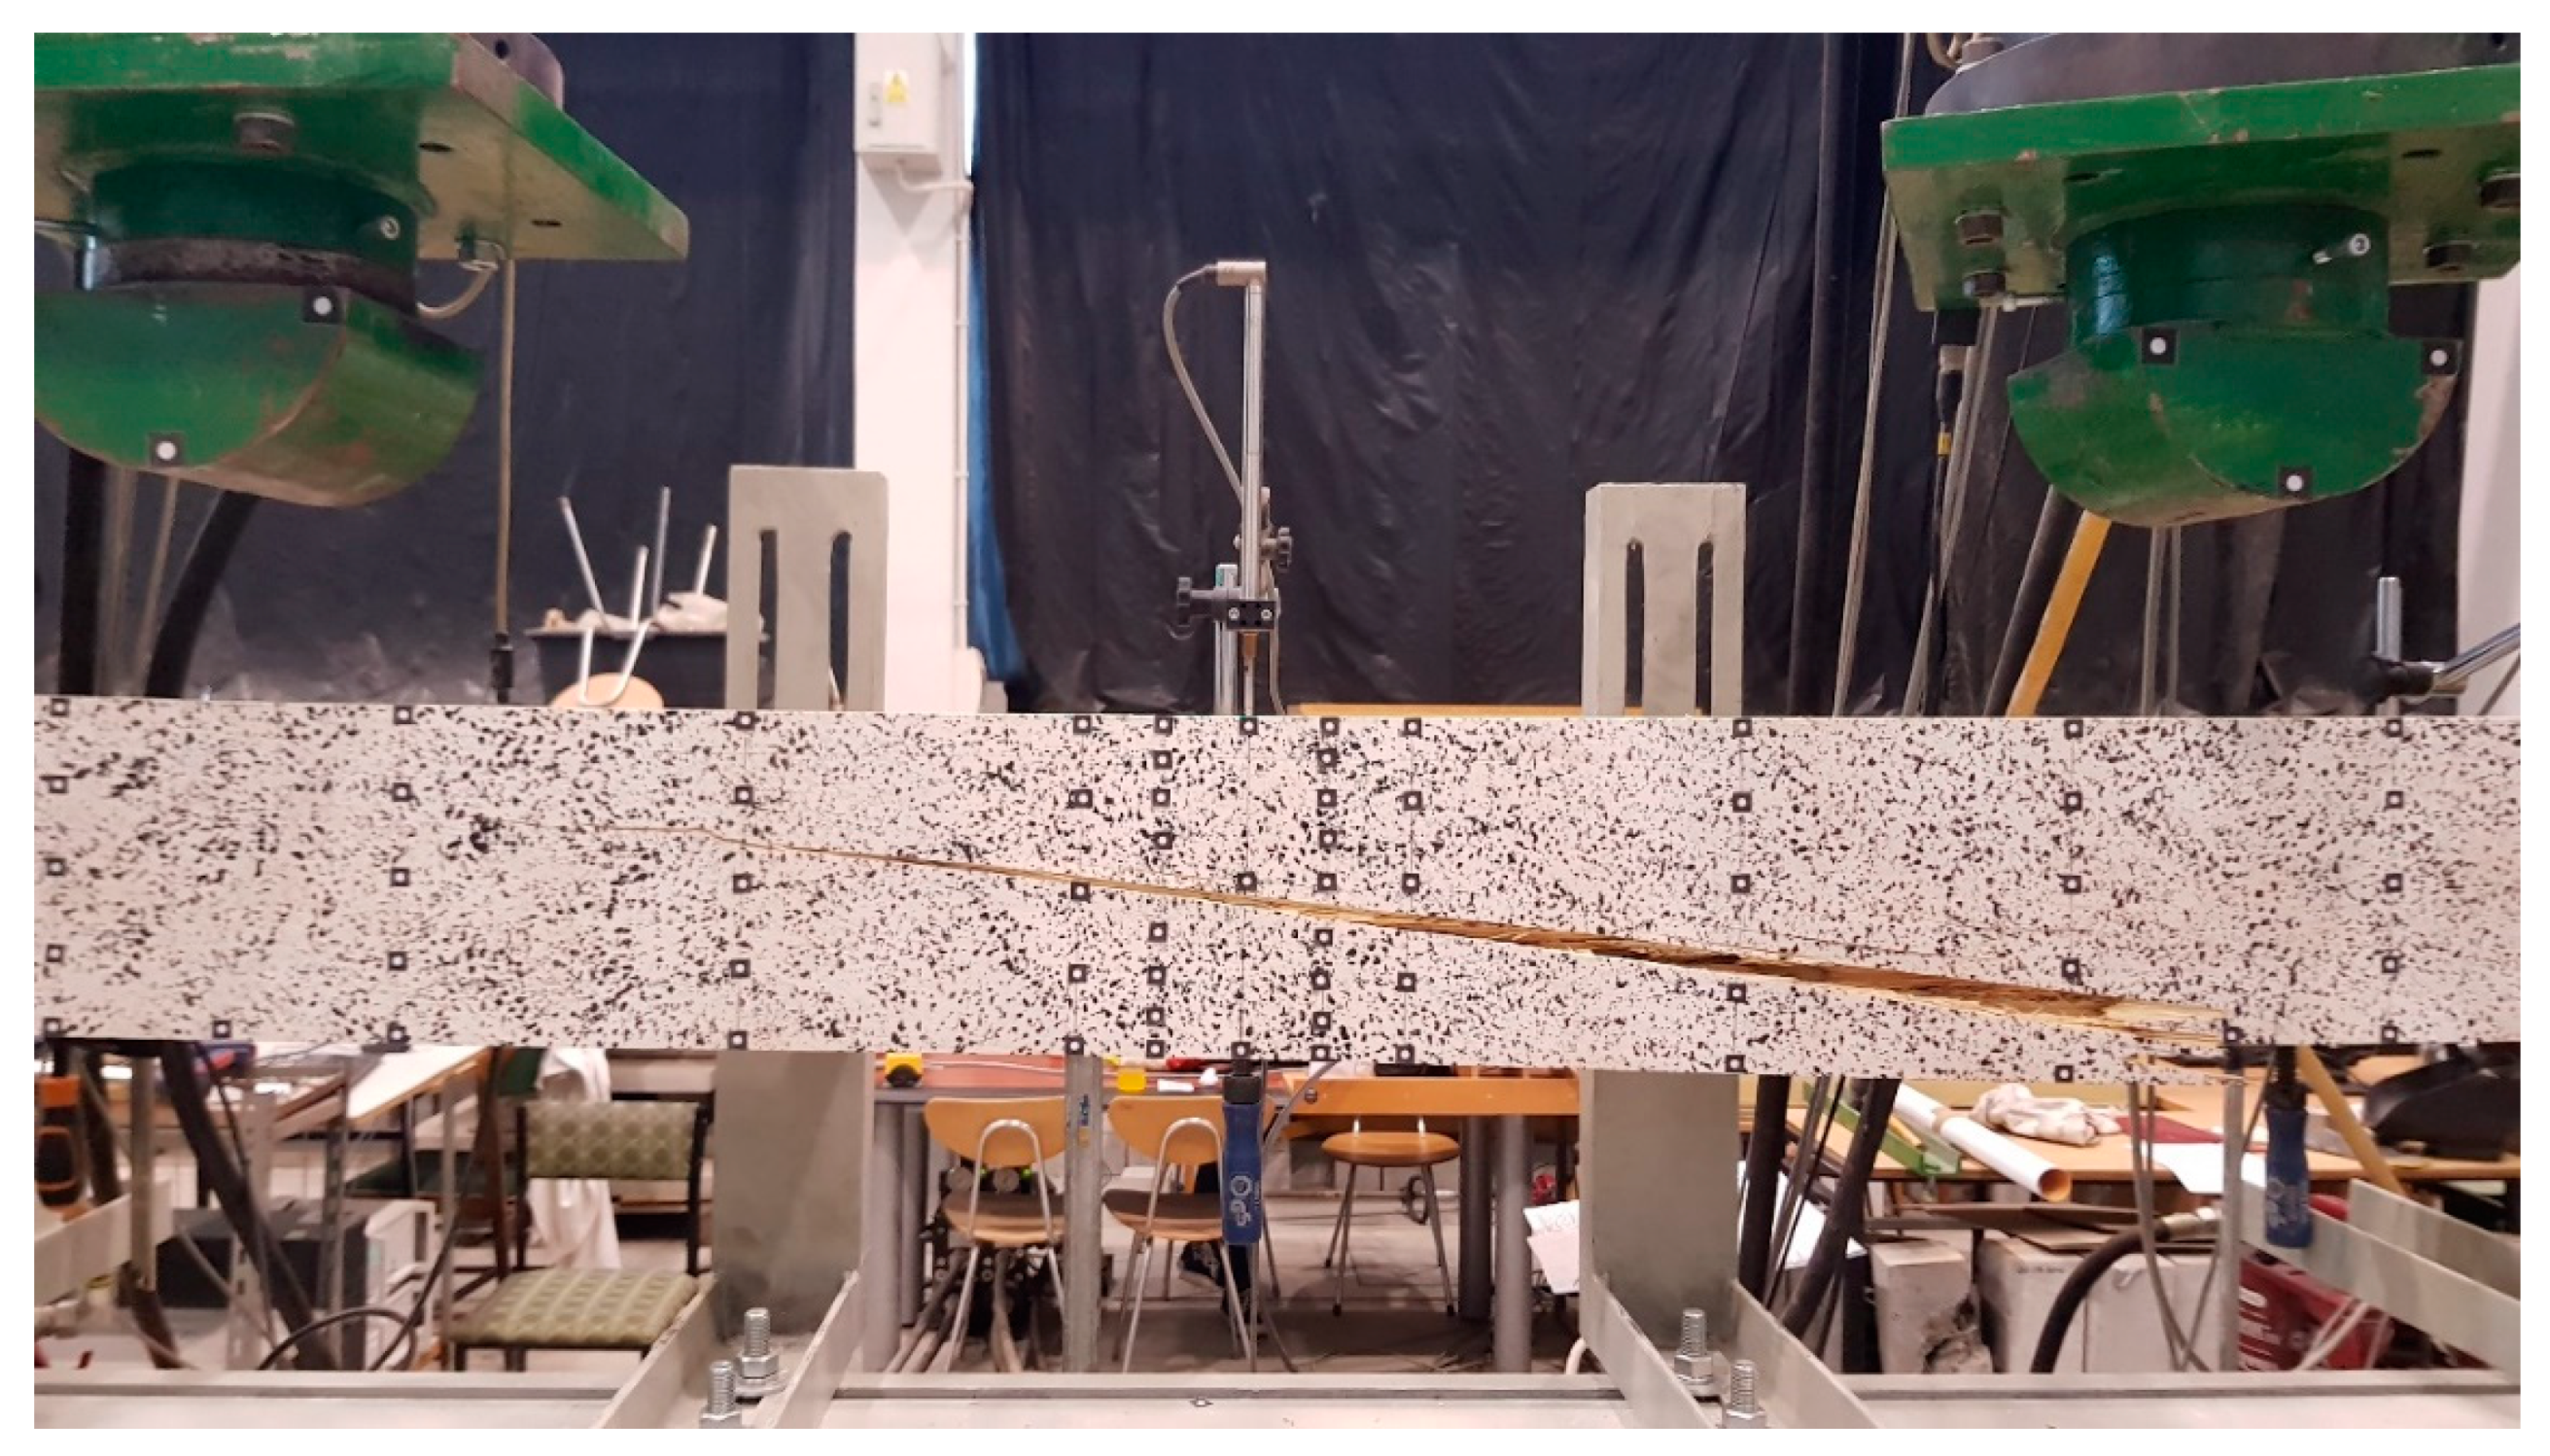
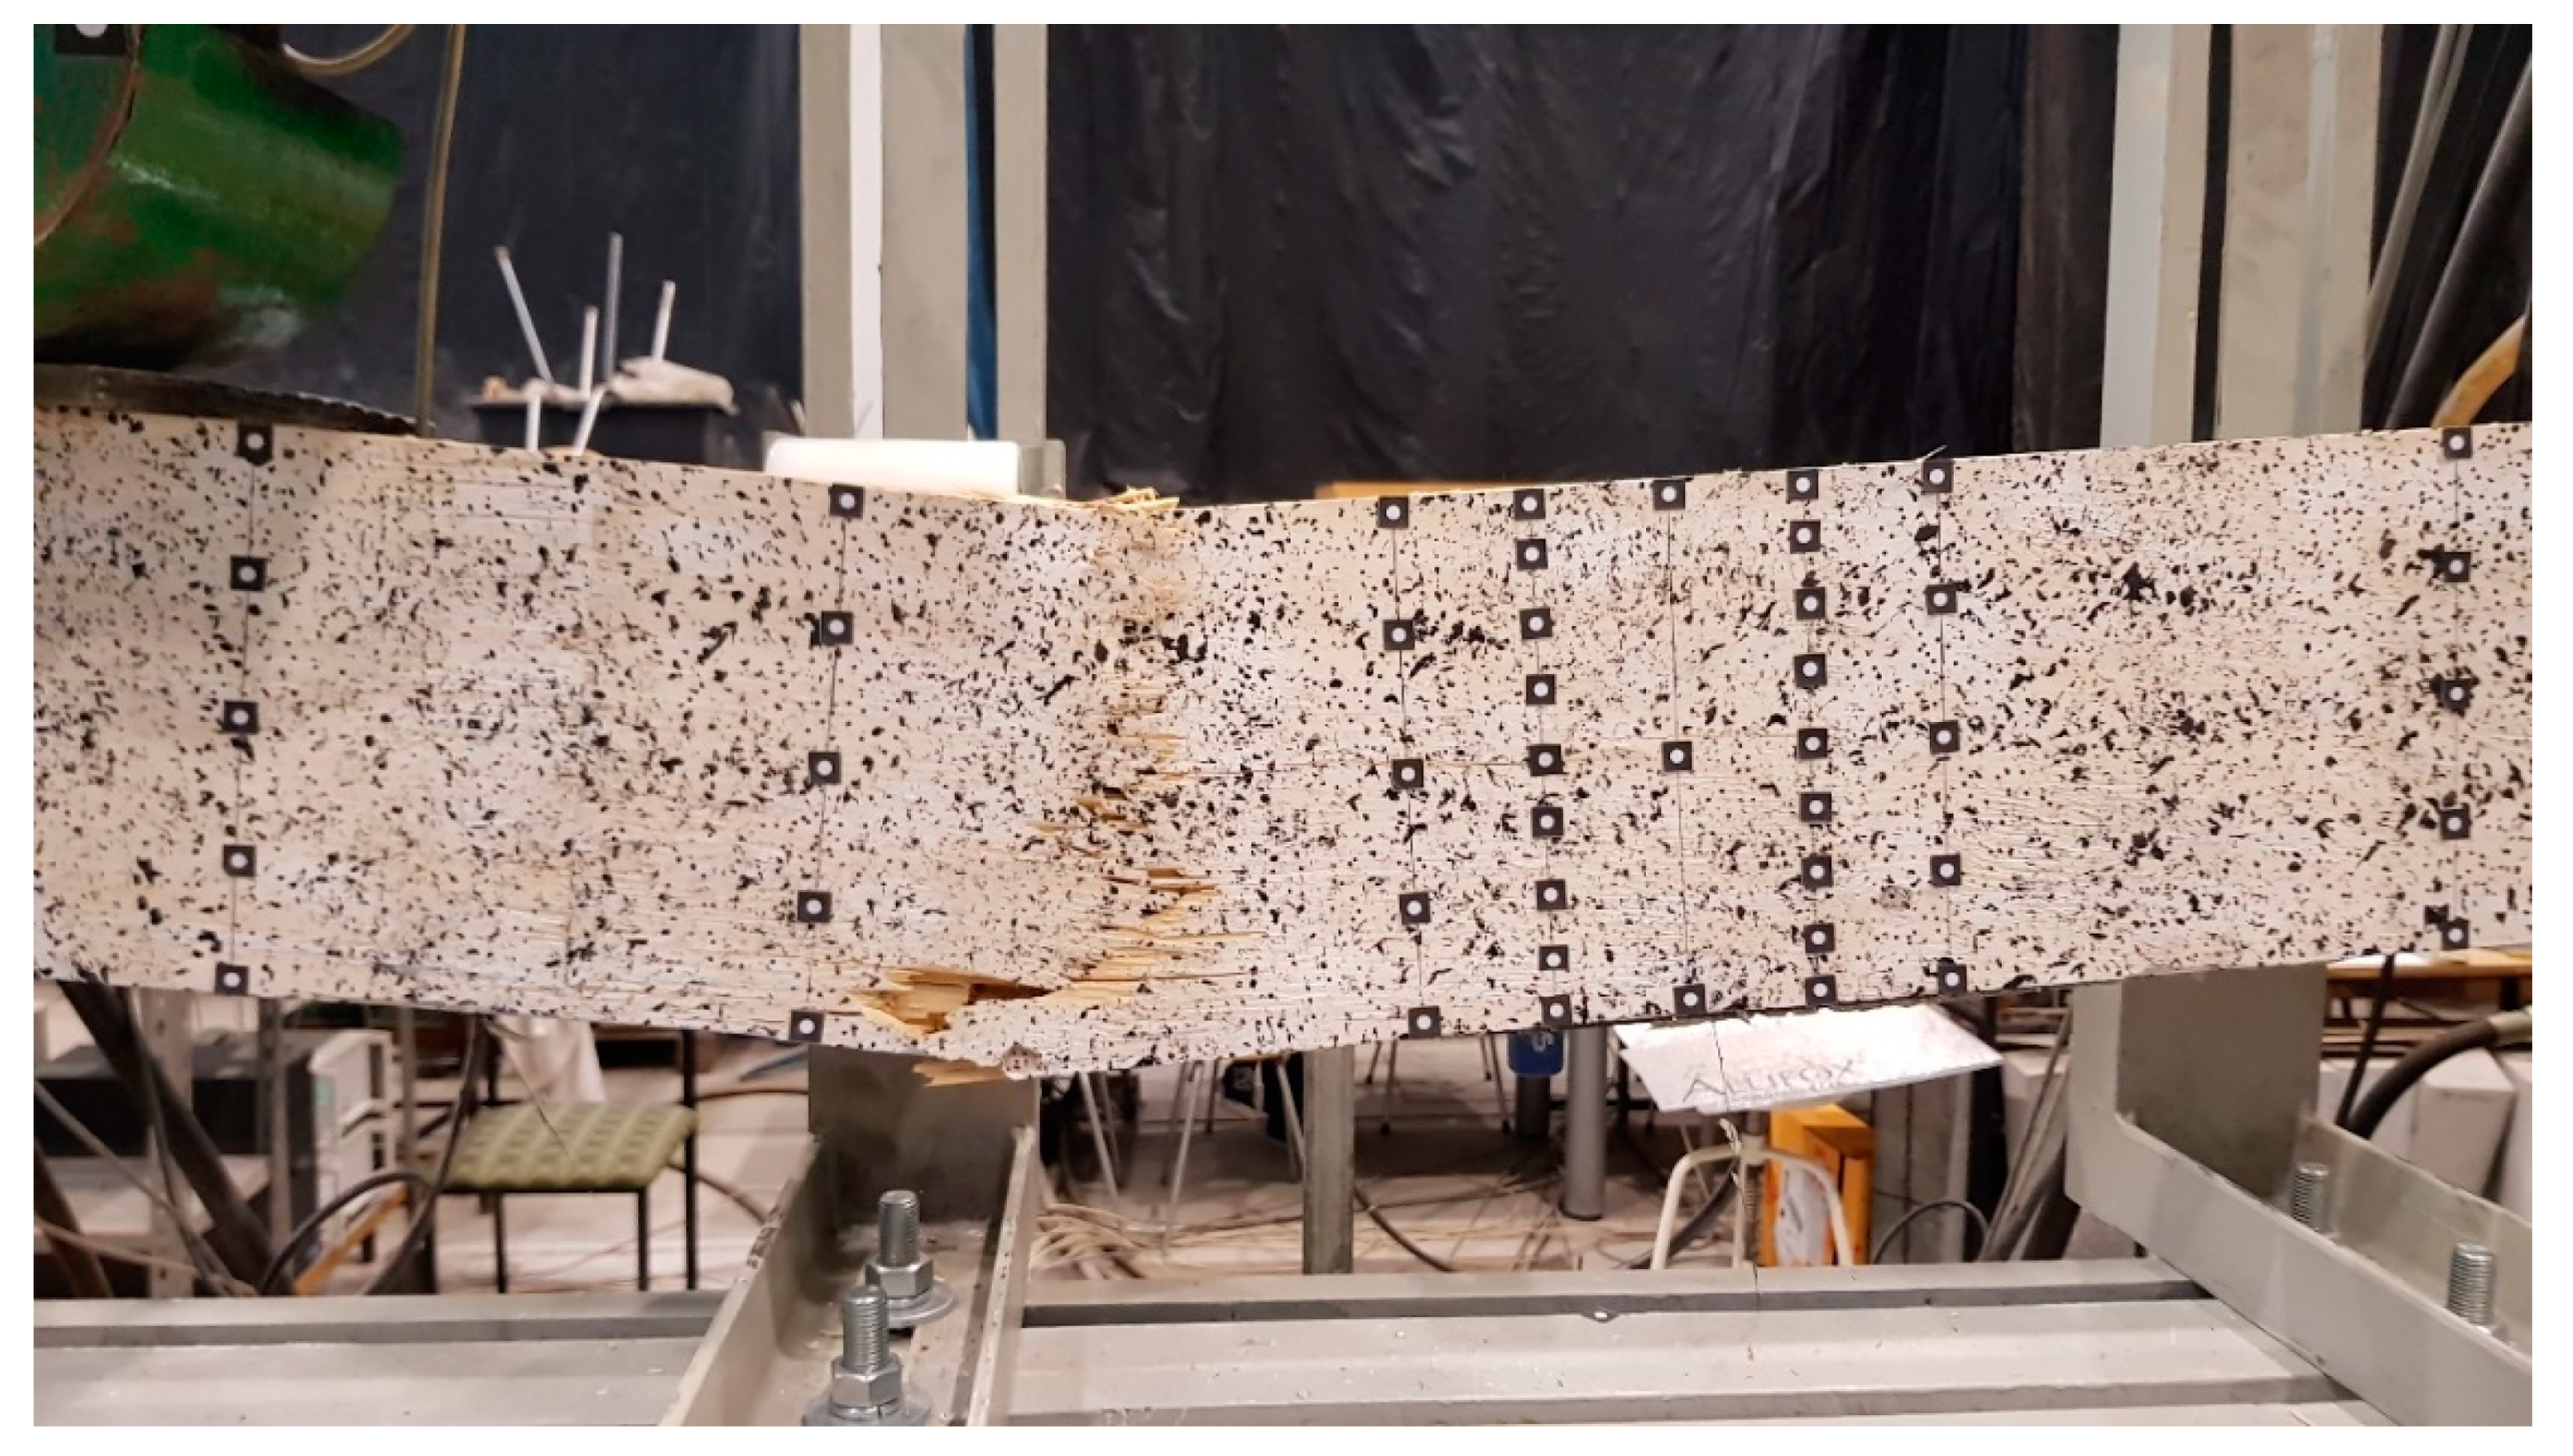
- Unreinforced elements failure was caused by exceeding the tensile strength. Various forms of beam failure were observed for the reinforced beams, with the initiation of most of them resulting from exceeding the veneer strength in the compression or tensile zone. The CFRP laminates were not destroyed.
- The strain profile reading showed higher utilization of compression characteristics of the LVL in reinforced elements.
- The CFRP laminates used as a reinforcement in the current study are relatively expensive in comparison to conventional materials (steel plates, rods) or composites reinforced with glass or aramid fiber. However, they are characterized by great fatigue behavior and corrosion resistance. The CFRP laminates are considerably lighter and have better mechanical parameters when compared to steel.
- The proposed strengthening method is suitable for enhancing the mechanical parameters of existing elements.
Author Contributions
Funding
Acknowledgments
Conflicts of Interest
References
- De Lorenzis, L.; Teng, J.G. Near-surface mounted FRP reinforcement: An emerging technique for strengthening structures. Compos. Part B 2007, 38, 119–143. [Google Scholar] [CrossRef]
- Jasieńko, J. Połączenia Klejowe w Rehabilitacji i Wzmacnianiu Zginanych belek Drewnianych; Oficyna Wydawnicza Politechniki Wrocławskiej: Wrocław, Poland, 2002. [Google Scholar]
- Borri, A.; Corradi, M. A method for flexural reinforcement of old wood beams with CFRP materials. Compos. Part B 2005, 36, 143–153. [Google Scholar] [CrossRef]
- Yang, H.; Ju, D.; Liu, W.; Lu, W. Prestressed glulam beams reinforced with CFRP bars. Constr. Build. Mater. 2016, 109, 73–83. [Google Scholar] [CrossRef] [Green Version]
- Soriano, J.; Peliis, B.P.; Mascia, N.T. Mechanical performance of glued-laminated timber beams symmetrically reinforced with steel bars. Compos. Struct. 2016, 150, 200–207. [Google Scholar] [CrossRef]
- De Luca, V.; Marano, C. Prestressed glulam timbers reinforced with steel bars. Constr. Build. Mater. 2012, 30, 206–217. [Google Scholar] [CrossRef]
- Wdowiak, A.; Brol, J. Effectiveness of Reinforcing Bent Non-Uniform Pre-Stressed Glulam Beams with Basalt Fibre Reinforced Polymers Rods. Materials 2019, 12, 3141. [Google Scholar] [CrossRef] [PubMed] [Green Version]
- Fossetti, M.; Minafò, G.; Papia, M. Flexural behaviour of glulam timber beams reinforced with FRP cords. Constr. Build. Mater. 2015, 95, 54–64. [Google Scholar] [CrossRef]
- Schober, K.U.; Rautenstrauch, K. Post-strengthening of timber structures with CFRP’s. Mater. Struct. 2006, 40, 27–35. [Google Scholar] [CrossRef]
- Balmori, J.-A.; Basterra, L.-A.; Acuña, L. Internal GFRP Reinforcement of Low-Grade Maritime Pine Duo Timber Beams. Materials 2020, 13, 571. [Google Scholar] [CrossRef] [PubMed] [Green Version]
- D’Ambrisi, A.; Focacci, F.; Luciano, R. Experimental investigation on flexural behavior of timber beams. Compos. Struct. 2014, 108, 720–728. [Google Scholar] [CrossRef]
- Nowak, T. Analiza Pracy Statycznej Zginanych Belek Drewnianych Wzmacnianych Przy Użyciu CFRP. Ph.D. Thesis, Politechnika Wrocławska, Wrocław, Poland, 2007. [Google Scholar]
- Brol, J. Strengthening of bent glued laminated (glulam) beams with GARP tapes at the stage of production. Wiadomości Konserwatorskie 2009, 26, 345–353. [Google Scholar]
- Raftery, G.M.; Kelly, F. Basalt rods for reinforcement and repair of timber. Compos. Part B 2015, 70, 9–19. [Google Scholar] [CrossRef]
- Yang, H.; Liu, W.; Lu, W.; Zhu, S.; Geng, Q. Flexural behavior of FRP and steel reinforced glulam beams: Experimental and theoretical evaluation. Constr. Build. Mater. 2009, 106, 550–563. [Google Scholar] [CrossRef]
- Bakalarz, M.; Kossakowski, P. Mechanical Properties of Laminated Veneer Lumber Beams Strengthened with CFRP Sheets. Arch. Civ. Eng. 2019, 65, 57–66. [Google Scholar] [CrossRef]
- Bakalarz, M.; Kossakowski, P. The flexural capacity of laminated veneer lumber beams strengthened with AFRP and GFRP sheets. Tech. Trans. 2019, 2, 85–95. [Google Scholar] [CrossRef] [Green Version]
- PN-EN 408+A1:2012 Timber Structures. Structural Timber and Glued Laminated Timber. Determination of Some Physical and Mechanical Properties; PKN: Warszawa, Poland, 2012.
- PN-EN 14374:2005 Timber Structures. Structural Laminated Veneer Lumber (LVL). Requirements; PKN: Warszawa, Poland, 2005.

| Parameter | Edgewise Condition |
|---|---|
| Bending strength (N/mm2) | 44 |
| Tensile strength (N/mm2) | 36 |
| Compression strength parallel to the grains (N/mm2) | 40 |
| Shear strength (N/mm2) | 4.6 |
| Young’s Modulus (N/mm2) | 14,000 |
| Shear Modulus (N/mm2) | 600 |
| Density (kg/m3) | 480 |
| Parameter | CFRP Laminates |
|---|---|
| Width/Thickness/Length (mm) | 20/1.4/2800 |
| Modulus of elasticity (kN/mm2) | 170 |
| Tensile strength (N/mm2) | 2800 |
| Density (g/cm3) | 1.6 |
| Fiber volume (%) | 68 |
| Elongation at rupture (‰) | 16 |
| Parameter | Epoxy Resin |
|---|---|
| Modulus of elasticity in compression (N/mm2) | 3200 |
| Compressive strength (N/mm2) | 100 |
| Density (g/cm3) | 1–1.1 |
| Elongation at break (‰) | 17.3 |
| No. | Loading Force (kN) | Max. Bending Moment (kNm) | Stiffness Coefficient (kN/mm) | MOE (GPa) | Global Stiffness EI (Nmm2) | Failure Mode | |
|---|---|---|---|---|---|---|---|
| M1 | M2 | ||||||
| A1 | 36.86 | 15.86 | 17.32 | 0.89 | 12.73 | 3.98 × 10⁸ | Tension |
| A2 | 35.33 | 15.33 | 16.46 | 1.14 | 14.50 | 4.52 × 10⁸ | Tension |
| A3 | 38.89 | 17.30 | 17.70 | 1.05 | 14.68 | 4.49 × 10⁸ | Tension |
| A4 | 42.36 | 18.71 | 19.41 | 1.04 | 15.09 | 4.60 × 10⁸ | Tension |
| A5 | 36.08 | 15.54 | 16.93 | 0.90 | 13.77 | 3.99 × 10⁸ | Tension |
| E1 | 47.85 | 21.39 | 21.67 | 1.02 | 14.84 | 4.55 × 10⁸ | Tension |
| E2 | 48.44 | 21.23 | 22.60 | 1.15 | 16.42 | 5.11 × 10⁸ | Compression + Tension |
| E3 | 44.36 | 20.78 | 19.22 | 1.07 | 15.76 | 4.76 × 10⁸ | LTB 1 |
| E4 | 51.54 | 23.70 | 23.41 | 1.04 | 15.62 | 4.63 × 10⁸ | Compression |
| E5 | 49.41 | 22.66 | 22.12 | 1.07 | 15.70 | 4.76 × 10⁸ | Compression |
| Series | Loading Force (kN) | Max. Bending Moment (kNm) | Time to Failure (s) | Stiffness Coefficient (kN/mm) | Modulus of Elasticity (GPa) | Global Stiffness EI (Nmm2) | |
|---|---|---|---|---|---|---|---|
| M1 | M2 | ||||||
| A | 37.91 | 16.55 | 17.56 | 338.1 | 1.00 | 14.16 | 4.26 × 10⁸ |
| E | 48.32 (+27%) | 21.78 (+32%) | 21.71 (+24%) | 422.6 (+25%) | 1.07 (+7%) | 15.67 (+11%) | 4.96 × 10⁸ (+16%) (4.76 × 10⁸) 1 |
| Loading Force (kN) | Stress in LVL σ1 (MPa) 1 | Stress in CFRP Laminate (MPa) 1 | Stress in LVL σ2 (MPa) 2 | Stress Ratio σ1/σ2 |
|---|---|---|---|---|
| 10.2 | 13.03 | 158.16 | 10.67 | 1.22 |
| 20.2 | 22.44 | 272.53 | 20.65 | 1.09 |
| 30.2 | 34.32 | 416.74 | 31.02 | 1.11 |
| 40.1 | 43.99 | 534.17 | 41.32 | 1.06 |
| 46.6 | 52.97 | 643.16 | 49.73 | 1.06 |
© 2020 by the authors. Licensee MDPI, Basel, Switzerland. This article is an open access article distributed under the terms and conditions of the Creative Commons Attribution (CC BY) license (http://creativecommons.org/licenses/by/4.0/).
Share and Cite
Bakalarz, M.M.; Kossakowski, P.G.; Tworzewski, P. Strengthening of Bent LVL Beams with Near-Surface Mounted (NSM) FRP Reinforcement. Materials 2020, 13, 2350. https://doi.org/10.3390/ma13102350
Bakalarz MM, Kossakowski PG, Tworzewski P. Strengthening of Bent LVL Beams with Near-Surface Mounted (NSM) FRP Reinforcement. Materials. 2020; 13(10):2350. https://doi.org/10.3390/ma13102350
Chicago/Turabian StyleBakalarz, Michał Marcin, Paweł Grzegorz Kossakowski, and Paweł Tworzewski. 2020. "Strengthening of Bent LVL Beams with Near-Surface Mounted (NSM) FRP Reinforcement" Materials 13, no. 10: 2350. https://doi.org/10.3390/ma13102350
APA StyleBakalarz, M. M., Kossakowski, P. G., & Tworzewski, P. (2020). Strengthening of Bent LVL Beams with Near-Surface Mounted (NSM) FRP Reinforcement. Materials, 13(10), 2350. https://doi.org/10.3390/ma13102350