Abstract
In this study, we propose a method to estimate structural deformation and failure by using displacement-strain transformation matrices, i.e., strain-to-displacement transformation (SDT) and displacement-to-strain transformation (DST). The proposed SDT method can be used to estimate the complete structural deformation where it is not possible to apply deformation measurement sensors, and the DST method can be used for to estimate structural failures where strain and stress sensors cannot be applied. We applied the SDT matrix to a 1D beam, a 2D plate, rotating structures and real wind turbine blades, and successfully estimated the deformation in the structures. However, certain difficulties were encountered while estimating the displacement of brittle material such as an alumina beam. The study aims at estimating the displacement and stress to predict the failure of the structure. We also explored applying the method to multi-material structures such as a two-beam bonded structure. In the study, we used alumina–aluminum bonded structures because alumina is bonded to the substrate to protect the structure from heat in many cases. Finally, we present the results of the displacement and failure estimation for the alumina–aluminum structure.
1. Introduction
It is necessary to consider maximum deformation, strain, stress and failure of the structure to ensure safe operations. Deformation and strain can be measured using displacement sensors, such as linear variable differential transformers (LVDTs) [1], potentiometers [2], laser displacement sensors [3], strain sensors, such as strain gages [4] and fiber optic sensors [5]. Generally, stress and failure can be estimated based on the strain information. However, in some cases, it is not possible to measure the deformation by using displacement sensors. If we imagine an aircraft in operation, it is difficult to apply displacement sensors because displacement sensors should be installed on a fixed frame. In other cases, it is not possible to measure strain by using strain sensors. For example, strain gages cannot be used under very high electromagnetic and thermal environments or severe vibration. Alternatively, it is possible to use strain-based displacement estimation and displacement-based strain estimation methods.
Many studies have focused on structural deformation estimation based on strain information [6,7,8,9,10], and these studies are summarized in Table 1. As shown in Table 1, strain measurement was performed via strain gages or fiber optic sensors that measure multiple strains along a single strand of the fiber. The maximum estimation error ranges from 1.5%–7%. Researchers used displacement-strain transformation techniques [6,7,10], developed multimetric data fusion techniques [8] and used a linear classical beam-curvature function with a fiber optic strain sensing algorithm (FOSS) [9].

Table 1.
Comparison of the deformation estimation method.
However, strain or stress estimation methods using displacement data were not commonly used, because strain sensors can be easily used for many applications, and it is occasionally difficult for displacement sensors to measure actual strains due to slip or failure to measure the reference point. However, if it is not possible to use strain sensors in high temperature conditions in an oven, then displacement data can be alternatively used by laser displacement sensors to estimate the strain or stress of the structure [11]. It is also possible to apply the image registration [12] or modal superposition method [13] for strain estimation.
The proposed displacement or strain estimation method in the study is based on a modal approach. The use of classical beam–curvature functions increases time consumption due to the increase in structural complexity. However, the modal parameter-based approach can reduce the estimation calculation time and be applied in vibration control applications. Furthermore, the proposed method exhibits a significant advantage wherein the complete structural shape or stress information can be calculated by using a small number of sensors. Figure 1 illustrates the process of estimating the structural deformation or strain by using the displacement–strain transformation matrix.
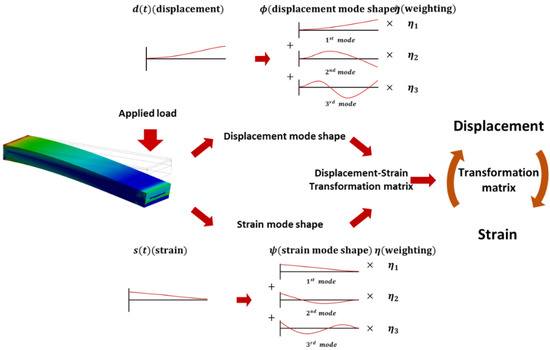
Figure 1.
Process of estimating the structural deformation or strain.
The authors’ group is continuously developing and improving the displacement–strain transformation method, and the research in our group is summarized in Figure 2. The displacement–strain transformation method has been actively studied since the early 2000s. At the beginning of the study, deformation predictions for one-dimensional beam shapes [14] and two-dimensional plates were conducted [15]. After that, the deformation predictions were obtained by gradually expanding its application range to rotating structures [16] and actual wind turbine blades [17].
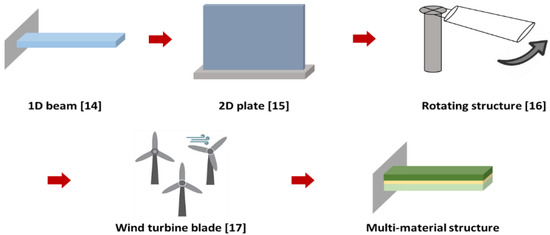
Figure 2.
Research flow of the displacement–strain transformation method used in the study.
The present study focuses on multi-material structures such as two-beam bonded structures. This is because many bonded structures are used for certain applications. For example, the application of multi-material structures, such as composite–metal and ceramic–metal combinations, is increasing [18,19,20]. These types of composite structures suffer from problems including delamination and de-bonding. If we apply displacement–strain transformation techniques, then we can obtain the structural deformation and strain information as well as the failure and de-bonding information in a non-destructive manner.
In the study, we first applied the displacement–strain transformation method to a single material structure to verify strain estimation by using displacement data, as well as the deformation estimation by using strain data. Subsequently, a multi-material structure was used in the same verification test. In addition to the simple prediction of deformation or strain, we propose a method that can determine the point of failure and presence of damage by calculating the stress induced in the structure when deformation occurs. The DST method has been widely applied to single materials, but has not been applied to multi-material or brittle materials. In this paper, we wanted to verify the feasibility of deformation prediction by using the DST method to multi-material and brittle structures.
2. Background Theory of the Displacement-Strain Transformation
2.1. Relationship between Displacement and Strain
The displacement is predicted by measuring strain because the displacement of the structure is not independent of the strain if the structure corresponds to a continuum. The displacement and strain are expressed as the product of the mode matrix, and the modal coordinates are expressed as follows:
where, N denotes the number of modes used, {d} denotes the displacement, {s} denotes the strain, denotes the modal coordinate vector, denotes the displacement mode matrix, and denotes the strain mode matrix. If we rearrange {d} and {s} with the modal coordinate matrix, we obtain Equations (4) and (5):
where, denotes the transposed matrix of , and we substitute Equations (3) and (4) into Equations (1) and (2) to obtain Equations (5) and (6) as follows:
Here, and are expressed as strain-to-displacement transformation (SDT) and displacement-to-strain transformation (DST), respectively. Finally, the displacement and the strain are expressed as Equations (7) and (8), respectively:
{d} = [SDT]{s}
{s} = [DST]{d}
In the above equation, it is observed that the displacement and strain at all positions of the structure are obtained by the mode shape matrix and the measured {s} and {d} [21].
2.2. Number of Strain Gage Sensors
The accuracy of estimation increases when the number of sensors increases in the estimation of the structural deformation. However, it is difficult to use several sensors, given the cost of sensors and the difficulty of attachment and wiring to the structure. Thus, structural deformation can be estimated more effectively if the sensors are optimized for quantity and location.
Based on the rank of the displacement–strain transformation matrix, the number of sensors is identical to the order of mode shapes of the structure. It is possible to determine the optimal number of sensors if we determine the primary mode shape of the structure. In this study, the cantilever beam is used to estimate the structural deformation, and the loading is applied on the free edge. Therefore, the primary mode shape of the beam should correspond to the first mode of the bending mode shape. Hence, the number of sensors corresponds to one or more than one. In this study, three strain sensors are used for a more accurate strain prediction.
2.3. Optimization for Sensor Location
Given the limited number of sensors that can be used, the selection of an optimum measuring position allows for more accurate deformation predictions. In the study, the location of the strain sensor is determined via a genetic algorithm. The genetic algorithm is an imitation method of the law of survival of the fittest and crossing over [22]. In the implementation of the genetic algorithm for optimization, the population size, the number of subpopulations and the maximum number of generations for evolution must be chosen [23]. Figure 3 presents the flow chart of the genetic algorithm. The population is selected to ensure an optimal solution. A new population is created via the cloning and mating of this population. After determining the solution wherein the conditions are satisfied, this sequence is repeated until the optimal solution is determined. In this study, the optimal solution is obtained via minimizing condition number (CN) [24]. CN is the relationship between the minimum value and the maximum value in the matrix. In the case of the DST matrix, it was determined that the smaller the CN value showed a higher accuracy of the prediction.
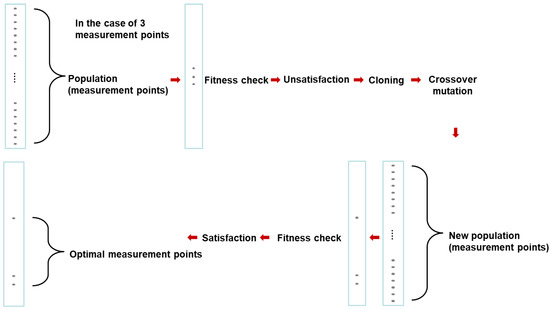
Figure 3.
Optimization of the strain gage sensor location.
3. Estimation of Deformation and Strain of a Single Material Structure
In the experiment, a stainless steel beam (300 mm × 25 mm × 1 mm) was used. The material properties of the stainless steel are listed in Table 2. The strains were measured by strain gages attached to a Wheatstone bridge circuit, and the displacements were measured via laser displacement sensors.
Table 2.
Material properties of the stainless steel beam.
3.1. Sensor Location Optimization
The optimal location for attaching the strain gage sensors to stainless steel specimens was selected via MATLAB’s optimtool genetic algorithm. Considering the repeated process of the genetic algorithm, it was confirmed that the optimum position of the three strain gage sensors corresponded to 39, 48 and 159 mm. We used the same approach and obtained the optimal displacement sensor locations for three points measurements as 96, 196 and 287.
3.2. Estimation of Deformation of a Single Material Structure Using the SDT Method
3.2.1. Experiment Setup for Deformation of Single Material Structure
The structure was deformed by applying loads corresponding to 50 gf, 100 gf and 150 gf to the end tip of the stainless steel beam, as shown in Figure 4. The deformation of the stainless steel beam was estimated via the proposed SDT matrix and measured strain values. The locations of the strain sensors for structural deformation estimation was selected as 39, 48 and 159 mm via the genetic algorithm. Strain gages were attached to these three locations, as shown in Figure 5 and the strains were obtained. The displacement of the stainless steel beam was measured via a laser displacement sensor, and the measurement point was measured at the endpoint of the beam.
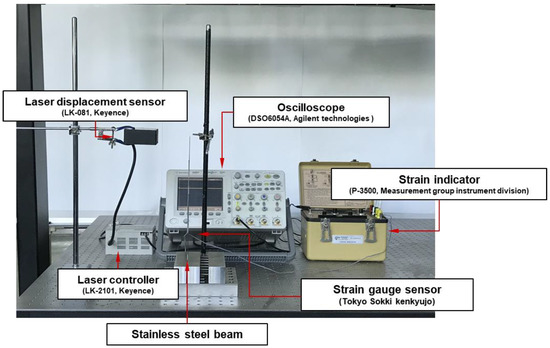
Figure 4.
Test setup for strain-to-displacement transformation experiment.
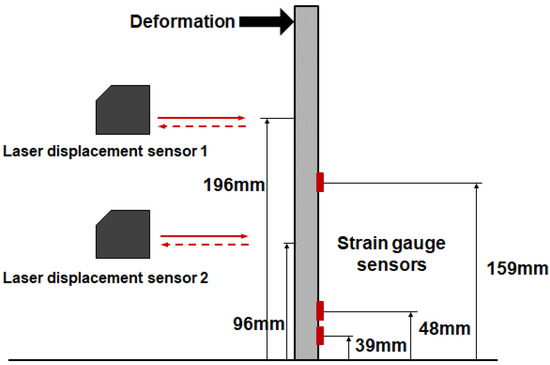
Figure 5.
Measurement points of the stainless steel beam.
3.2.2. Displacement Estimation Results Using SDT Method
To validate the estimation accuracy of the SDT and DST methods, experiment results were compared with the results of the SDT and DST methods, finite elements method (FEM) and the analytical method. Specifically, ANSYS was used for the FEM simulation. In the analytical method, to obtain the deflection of the beam, Equations (9) and (10) are used as follows:
where denotes the maximum deflection of the beam, denotes the force at the endpoint of the beam, denotes the length of the beam, denotes the elastic modulus of the beam, denotes the moment of inertia in the rectangular cross-section of the beam, denotes the width of the cross-section of the beam, and denotes the height of the cross-section of the beam.
Figure 6 shows the results obtained by applying the measured strain values to the SDT matrix and comparing the displacements that were calculated by using the predicted displacement and beam deflection equations and the displacement values obtained by the analytical method employing ANSYS.
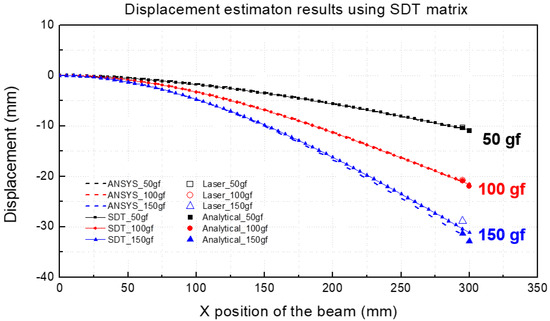
Figure 6.
Displacement estimation results by using the strain-to-displacement transformation (SDT) matrix (Single material).
The results of the displacement prediction indicated that when the specimen was subjected to loads corresponding to 50, 100 and 150 gf, the displacement value appeared as a curve with the largest displacement at the end of the beam. Additionally, it was observed that the experimental values, values predicted by using the SDT matrix, and displacement values calculated by the analytical method, agree well with each other.
In order to determine the accuracy of the displacement prediction using the SDT matrix, error analysis was performed for each prediction and experiment result. Table 3 shows the error rates of displacement values obtained via analytical methods, experimental values and predicted displacement values using the SDT matrix.
Table 3.
Displacement estimation results using the SDT matrix (Single material).
The error was less than 5.2% between experiment value and estimation value using the SDT matrix. As shown in Table 3, the results of the SDT matrix are significantly accurate when compared with those of the FEM and analytical methods.
3.3. Estimation of the Deformation in a Single Material Structure by Using the DST Method
3.3.1. Experimental Setup for Deformation Estimation of a Single Material Structure
The locations of the displacement sensors were selected as corresponding to 96, 196 and 287 mm from the genetic algorithm. Two laser displacement sensors measured the structural deformation at 96 mm and 196 mm. The deformation at 287 mm is measured using a ruler, as shown in Figure 7. At the 287 mm point of the beam, the structure was deformed by pulling the beam by 10, 20, and 30 mm. With respect to the 96 mm and 196 mm locations, as shown in Figure 8 and the displacement of each point was obtained via laser displacement sensors. The strain of the stainless steel beam was measured with a strain indicator, and the measurement position was identical to the position of the strain gage sensor in the SDT experiment.
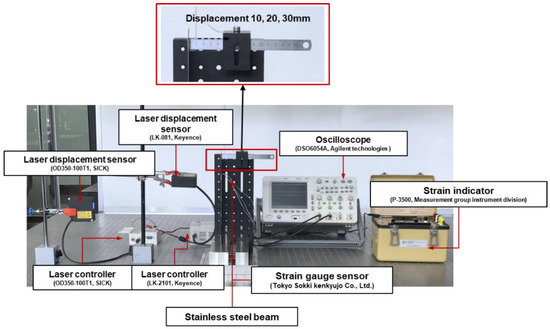
Figure 7.
Test setup for displacement-to-strain transformation experiment.
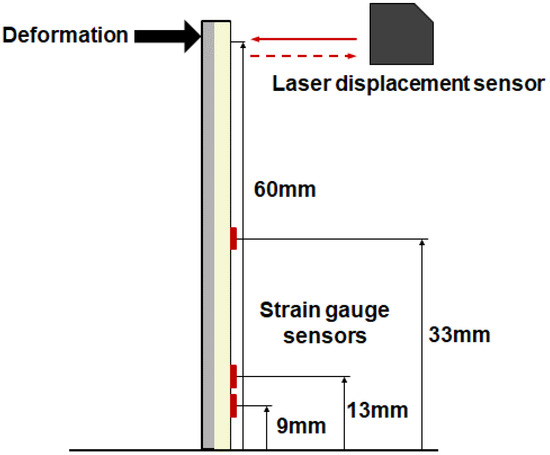
Figure 8.
Measurement points of the multilayer beam.
3.3.2. Strain Estimation Results Using the DST Method
As shown in Figure 9, the experimental values, predicted values using the DST matrix and strain values calculated by the analytical method agree well with each other. In order to calculate the accuracy of the strain prediction method using the DST matrix, error analysis was performed for each prediction and experiment result. Table 4 shows the results of strain estimation. The error in the DST method is less than 7.9%.
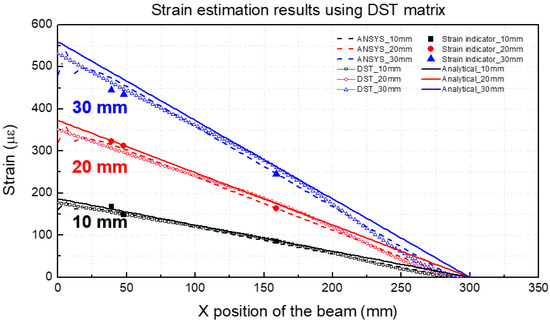
Figure 9.
Strain estimation results using the DST matrix (Single material).
Table 4.
Strain estimation results using the DST matrix (Single material).
4. Estimation of Deformation and Strain of the Multi-Material Structure
The displacement–strain transformation technique was also applied to a multi-material structure. In the study, the multi-material structure was composed of an aluminum beam, alumina beam and epoxy bonding layer. Table 5 lists the material properties of each component of the multi-material structure.
Table 5.
Material properties of the aluminum and alumina ceramic.
The dimensions of the alumina and aluminum beam corresponded to 100 mm in length, 25 mm in width and 1 mm in thickness, as shown in Figure 10. The thickness of the epoxy layer was measured as 0.15 mm after the bonding of two beams. The epoxy bonding layer was composed of a 2:1 weight ratio of epoxy resin (PRO-SET ADV-175) and hardener (PRO-SET ADV-275) and cured at room temperature for 10 h. The length of the specimen was determined to be shorter than that of the stainless steel beam that was used in single material structure presented in Section 3 because the cost of the alumina ceramic is very high, and we examined when a rupture of the ceramic occurred during the test. The specimen was fixed using a clamp, and thus, the dimensions of the actual cantilever beam corresponded to 62 mm in length, 25 mm in width, and 2.15 mm in total thickness.
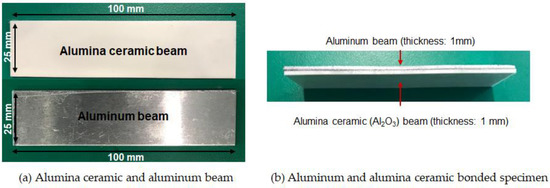
Figure 10.
Aluminum and alumina ceramic bonded specimen.
4.1. Sensor Location Optimization
The location of the strain gage sensor was optimized via the genetic algorithm and CN value. Thus, the strain sensor location was determined as 11, 13 and 37 mm, and displacement sensor location was calculated as corresponding to 20, 37 and 56 mm. However, it is not possible to set the positions of the strain gage sensors to the optimized locations due to the difficulty in attaching the strain gage sensor because it was extremely close between the optimized positions. The position of strain gage sensors was determined as 9, 13 and 33 mm for the purpose of convenience. In the case of the laser displacement sensor, the length of the beam was short and installation of the laser displacement sensors was difficult due to the head size. The positions of the laser displacement sensors were set at 22 mm and 52 mm to avoid overlapping of the laser head. Although the position of the sensor was set in a manner different from the optimized position, it could be sufficiently applied to the SDT and DST matrix. Given that the modified sensor position and optimized sensor position were similar to each other, it was not considered to significantly affect the result.
4.2. Experiment Setup for Deformation Estimation of Multi-Material Structure
Figure 11 shows the complete experimental setup for the deformation and strain estimation of the multilayer structure. An end of the specimen was fixed and the other end was deformed in the out-of-plane direction via the linear stage until the specimen was broken. Displacement and strain of the multilayer structure were measured via laser displacement sensors and strain gages, respectively.
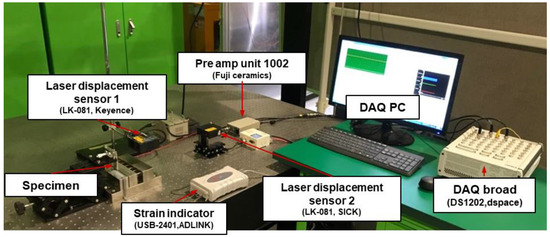
Figure 11.
Test setup for deformation and strain estimation experiment for the multilayer beam.
4.3. Displacement Estimation Results Using the SDT Method
Figure 12 and Table 6 show the displacement estimation results using SDT and measured displacements at 22 mm and 52 mm on the alumina side of the beam. The multilayer beam was broken when the deformation of the endpoint of the beam approximately corresponded to 1.2 mm. The estimation error between the experimental value and estimation value using SDT was less than 16.2%.
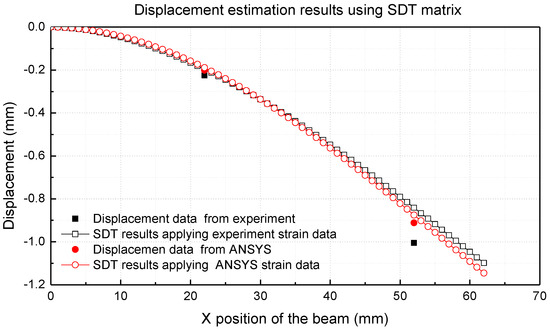
Figure 12.
Displacement estimation results using the SDT matrix (multi-material).
Table 6.
Displacement estimation results using the SDT matrix (multi-material).
4.4. Strain Estimation Results Using the DST Method
Figure 13 and Table 7 present the strains estimated using DST and the strain measured at 9, 13 and 33 mm on the alumina side of the beam. As shown in Figure 13, the experimental and predicted values for the DST matrix match well with each other. Table 7 shows the results of the strain estimation, and the error in the DST method is less than 7.6%.
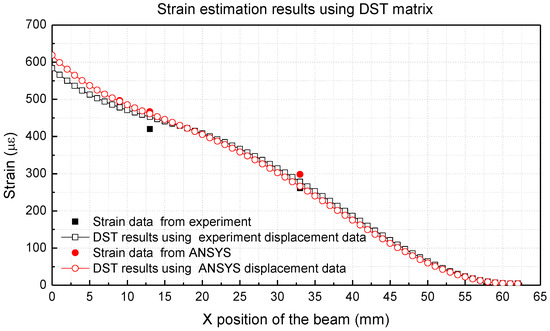
Figure 13.
Strain estimation results using the DST matrix (multi-material).
Table 7.
Strain estimation results using the DST matrix (multi-material).
4.5. Stress and Failure Estimation Results Using the DST Method
The stress estimation was conducted via the DST method. Figure 14 and Table 8 summarize the result of stress estimation. The multilayer beam was deformed until the beam was broken, and the stress of the multilayer beam was calculated by multiplying the strain and estimated from DST and elastic modulus of the alumina. In the experiment, the multilayer beam was broken when the deformation at the endpoint of the multilayer beam exceeded approximately 1.2 mm. When the deformation of the beam corresponded to 1.2 mm, it was confirmed that the stress applied to the beam is more than 200 MPa. Given that the yield strength of alumina was approximately in the range of 215–248 MPa when the elastic modulus was approximately 330–370 GPa [25], it was observed that the failure occurred because the stress generated by the deformation applied to the alumina beam exceeded the yield strength of the alumina.
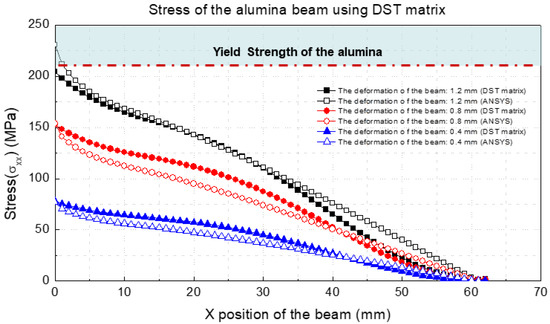
Figure 14.
Stress of the alumina beam using the DST matrix.
Table 8.
Stress of the alumina beam using the DST matrix.
5. Conclusions
In the study, the structural deformation and failure estimation methods using DST and SDT were proposed. We verified the displacement-strain transformation method for the structural deformation and strain estimation of single- and multi-material structures.
First, the DST and SDT methods were applied to a single material structure to verify the strain estimation using displacement data and deformation estimation using strain data. A comparison of the deformation and strain values of the single structure confirmed that the experimental values, predicted values using the DST and SDT matrix and displacement and strain values calculated by the analytical method, agreed well each other.
Second, we verified the multi-material structure. The DST and SDT method was applied to an aluminum–alumina beam. A comparison of the displacement and strain of the multilayer beam indicated that the experimental values and predicted values using the DST and SDT matrix matched well with each other.
Finally, we performed the stress and failure estimation of the multilayer beam. The failure estimation of the multi-material structure was conducted via the DST matrix. The failure prediction results confirmed that the estimated stress using the DST matrix was similar to the stress obtained using the ANSYS simulation. It was also observed that the stress at beam failure was well-matched with the yield strength of the alumina.
It was concluded the displacement–strain transformation method can be used for the deformation and strain estimation of the structure where the displacement or strain sensor cannot be applied. In addition to the simple prediction of the displacement or strain, DST and SDT methods determine the point of failure and presence of damage by calculating the stress of the structure when deformation occurs. The proposed method uses a smaller number of discrete alternative sensors to estimate complete structural deformation, strain and stress distribution. Therefore, it can be used for real-time structural behavior monitoring or control without the need for intensive calculations and numerous sensors.
Author Contributions
Conceptualization, H.-L.J. and L.-H.K.; methodology, D.-H.H., M.-Y.H. and L.-H.K.; formal analysis, H.-L.J.; resources, D.-H.H. and M.-Y.H.; writing—original draft preparation, H.-L.J.; writing—review and editing, H.-L.J., D.-H.H. and L.-H.K.; supervision, L.-H.K. and D.K.; project administration, L.-H.K. and D.K.; funding acquisition, L.-H.K. All authors have read and agreed to the published version of the manuscript.
Funding
This material is based upon work supported by the Ministry of Trade, Industry & Energy (MOTIE, Korea) under Sensor Industry Enhancement Program (20003125, Development of an ultraprecision measurement sensor based on the fiber composite for flaw detection of the composite structure) and by a grant from R&D program of Korea Railroad Research Institute.
Conflicts of Interest
The authors declare no conflict of interest.
References
- Pera, D.; Ferrando, I. An integrated monitoring system through 3d laser scanner and traditional instruments for load test on arch bridge. Int. Arch. Photogramm. Remote Sens. Spat. Inf. Sci. 2017, 42. [Google Scholar] [CrossRef]
- Zalt, A.; Meganathan, V.; Yehia, S.; Abudayyeh, O.; Abdel-Qader, I. Evaluating sensors for bridge health monitoring. In Proceedings of the 2007 IEEE International Conference on Electro/Information Technology, Chicago, IL, USA, 17–20 May 2007; pp. 368–372. [Google Scholar]
- Xie, L.; Qiu, Z.C.; Zhang, X.M. Vibration control of a flexible clamped-clamped plate based on an improved FULMS algorithm and laser displacement measurement. Mech. Syst. Signal Process. 2016, 75, 209–227. [Google Scholar] [CrossRef]
- Xia, Q.; Liu, H. Multi-axis dynamic displacement measurement based on a strain shunt structure. Sens. Actuators A Phys. 2018, 272, 62–74. [Google Scholar] [CrossRef]
- Zhang, C.C.; Zhu, H.H.; Liu, S.P.; Shi, B.; Zhang, D. A kinematic method for calculating shear displacements of landslides using distributed fiber optic strain measurements. Eng. Geol. 2018, 234, 83–96. [Google Scholar] [CrossRef]
- Rapp, S.; Kang, L.H.; Han, J.H.; Mueller, U.C.; Baier, H. Displacement field estimation for a two-dimensional structure using fiber Bragg grating sensors. Smart Mater. Struct. 2009, 18, 025006. [Google Scholar] [CrossRef]
- Bang, H.J.; Ko, S.W.; Jang, M.S.; Kim, H.I. Shape estimation and health monitoring of wind turbine tower using a FBG sensor array. In Proceedings of the 2012 IEEE International Instrumentation and Measurement Technology Conference, Graz, Austria, 13–16 May 2012; pp. 496–500. [Google Scholar]
- Park, J.W.; Sim, S.H.; Jung, H.J. Displacement estimation using multimetric data fusion. IEEE/ASME Trans. Mechatron. 2013, 18, 1675–1682. [Google Scholar] [CrossRef]
- Derkevorkian, A.; Masri, S.F.; Alvarenga, J.; Boussalis, H.; Bakalyar, J.; Richards, W.L. Strain-based deformation shape-estimation algorithm for control and monitoring applications. AIAA J. 2013, 51, 2231–2240. [Google Scholar] [CrossRef]
- Wang, Z.C.; Geng, D.; Ren, W.X.; Liu, H.T. Strain modes based dynamic displacement estimation of beam structures with strain sensors. Smart Mater. Struct. 2014, 23, 125045. [Google Scholar] [CrossRef]
- Seo, S.W.; Kim, K.J. Prediction of operational strains using displacement-strain transformation matrix and its application. In Proceedings of the Korean Society for Noise and Vibration Engineering, Korea, May 1996; pp. 355–360. [Google Scholar]
- Carvalho, C.; Slagmolen, P.; Bogaerts, S.; Scheys, L.; D’hooge, J.; Peers, K.; Suetens, P. 3D tendon strain estimation using high-frequency volumetric ultrasound images: A feasibility study. Ultrason. Imaging 2018, 40, 67–83. [Google Scholar] [CrossRef] [PubMed]
- Yang, Y.; Jung, H.K.; Dorn, C.; Park, G.; Farrar, C.; Mascareñas, D. Estimation of full-field dynamic strains from digital video measurements of output-only beam structures by video motion processing and modal superposition. Struct. Control Health Monit. 2019, 26, e2408. [Google Scholar] [CrossRef]
- Kang, L.H.; Kim, D.K.; Han, J.H. Estimation of dynamic structural displacements using fiber Bragg grating strain sensors. J. Sound Vib. 2007, 305, 534–542. [Google Scholar] [CrossRef]
- Rapp, S.; Kang, L.H.; Mueller, U.C.; Han, J.H.; Baier, H. Dynamic shape estimation by modal approach using fiber Bragg grating strain sensors. In Sensors and Smart Structures Technologies for Civil, Mechanical, and Aerospace Systems; SPIE: Washington, DC, USA, 2007; Volume 6529, p. 65293E. [Google Scholar]
- Kim, H.I.; Kang, L.H.; Han, J.H. Shape estimation with distributed fiber Bragg grating sensors for rotating structures. Smart Mater. Struct. 2011, 20, 035011. [Google Scholar] [CrossRef]
- Kim, H.I.; Han, J.H.; Bang, H.J. Real-time deformed shape estimation of a wind turbine blade using distributed fiber Bragg grating sensors. Wind Energy 2014, 17, 1455–1467. [Google Scholar] [CrossRef]
- Fleischer, J.; Nieschlag, J. Introduction to CFRP-metal hybrids for lightweight structures. Prod. Eng. 2018, 12, 109–111. [Google Scholar] [CrossRef]
- Fernández-Pérez, J.; Cantero, J.L.; Díaz-Álvarez, J.; Miguélez, M.H. Hybrid Composite-Metal Stack Drilling with Different Minimum Quantity Lubrication Levels. Materials 2019, 12, 448. [Google Scholar] [CrossRef] [PubMed]
- Christke, S.; Gibson, A.G.; Grigoriou, K.; Mouritz, A.P. Multi-layer polymer metal laminates for the fire protection of lightweight structures. Mater. Des. 2016, 97, 349–356. [Google Scholar] [CrossRef]
- Bang, H.J.; Kim, H.-I.; Lee, K.-S. Measurement of strain and bending deflection of a wind turbine tower using arrayed FBG sensors. Int. J. Precis. Eng. Manuf. 2012, 13, 2121–2126. [Google Scholar] [CrossRef]
- Bahng, E.Y. Optimal Sensor Placement for Structural Parameter Estimation Using Genetic Algorithm. J. Korean Soc. Hazard Mitig. 2010, 10, 9–16. [Google Scholar]
- Grady, S.A.; Hussaini, M.Y.; Abdullah, M.M. Placement of wind turbines using genetic algorithms. Renew. Energy 2005, 30, 259–270. [Google Scholar] [CrossRef]
- Pyzara, A.; Bylina, B.; Bylina, J. The influence of a matrix condition number on iterative methods’ convergence. In Proceedings of the 2011 Federated Conference on Computer Science and Information Systems (FedCSIS), Szczecin, Poland, 18–21 September 2011; pp. 459–464. [Google Scholar]
- MatWeb. Available online: http://www.matweb.com (accessed on 22 September 2019).


© 2020 by the authors. Licensee MDPI, Basel, Switzerland. This article is an open access article distributed under the terms and conditions of the Creative Commons Attribution (CC BY) license (http://creativecommons.org/licenses/by/4.0/).