Experimental Verification of Isotropic and Anisotropic Anhysteretic Magnetization Models


Abstract
1. Introduction
2. Models of Anhysteretic Curve
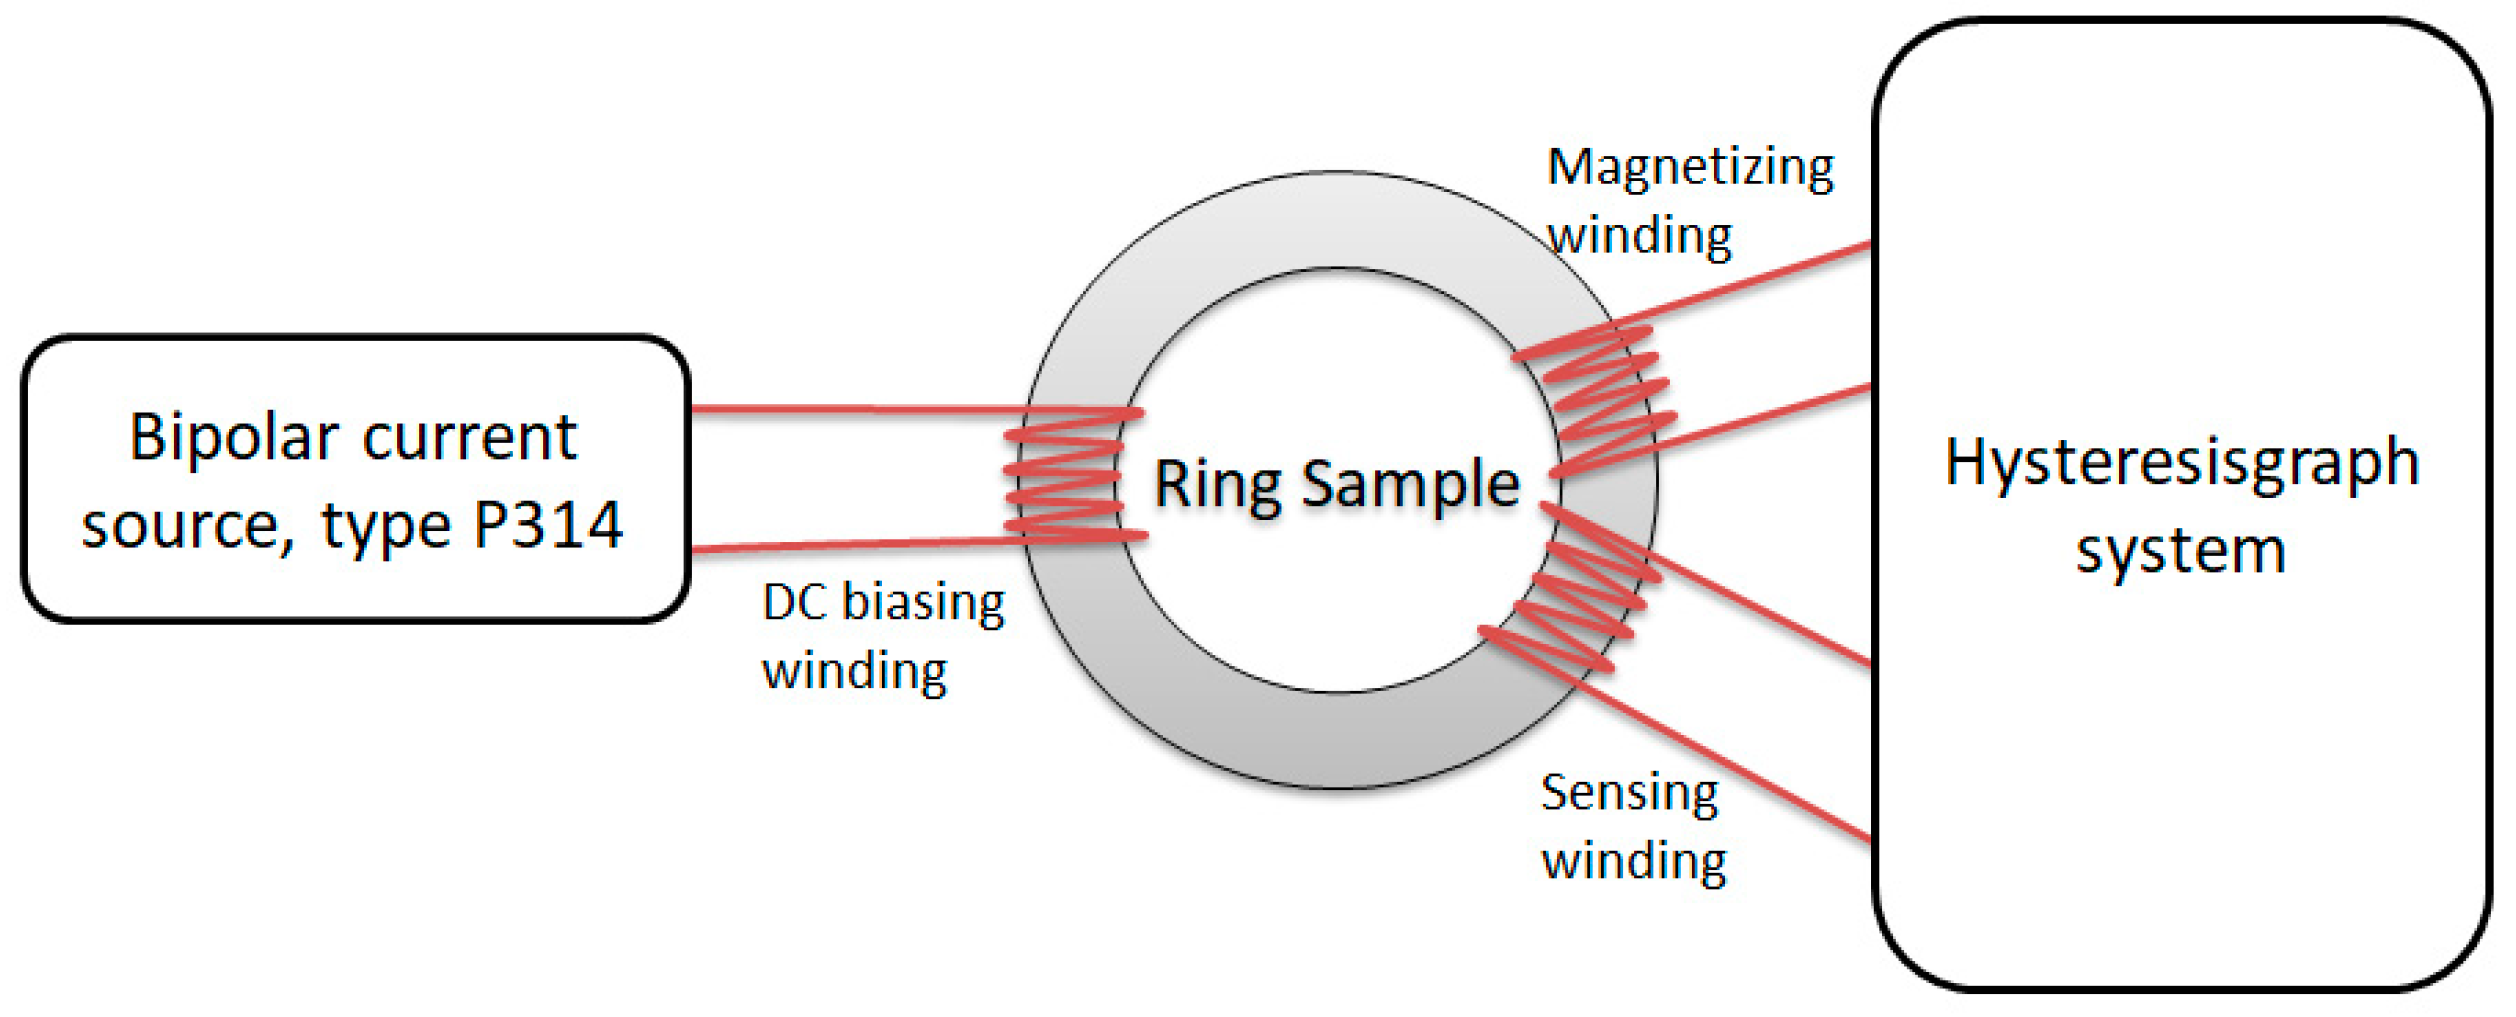
3. Materials and Methods
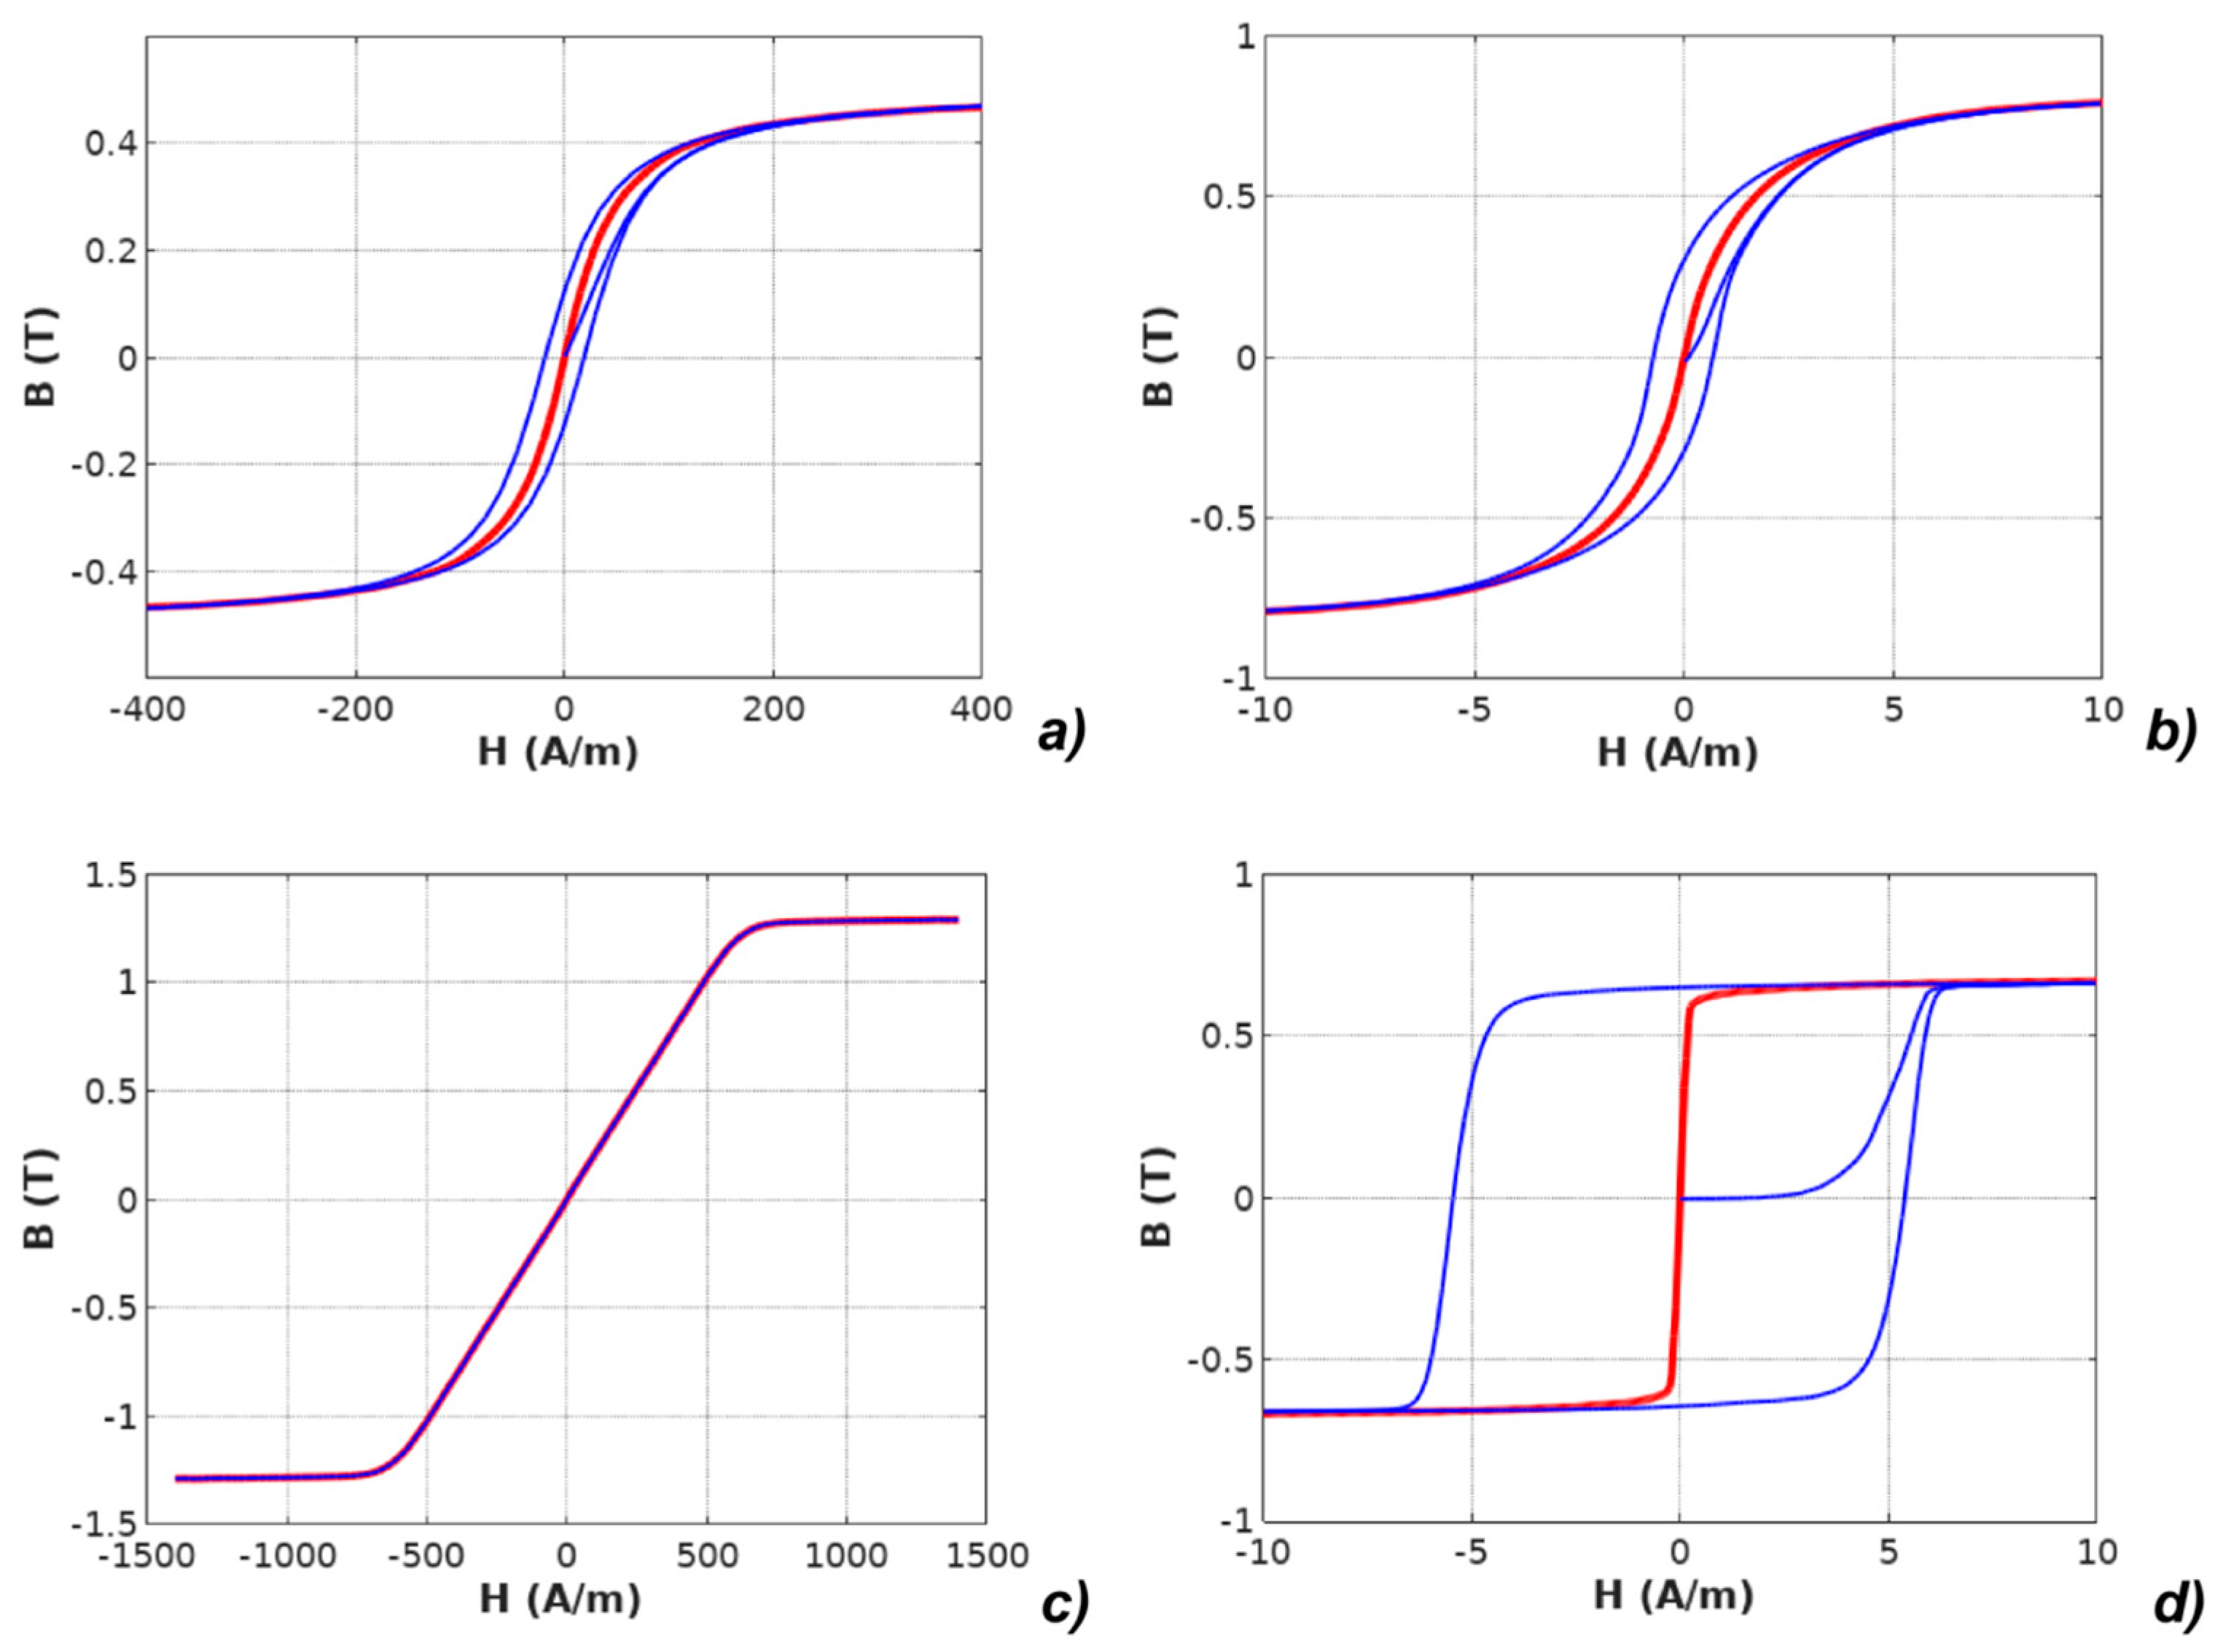
4. Identification of Parameters of the Models
5. Conclusions
Author Contributions
Funding
Conflicts of Interest
References
- Jiles, D.C.; Atherton, D. Theory of ferromagnetic hysteresis. J. Appl. Phys. 1984, 55, 2115–2120. [Google Scholar] [CrossRef]
- Jiles, D.C.; Atherton, D. Theory of ferromagnetic hysteresis. J. Magn. Magn. Mater. 1986, 61, 48–60. [Google Scholar] [CrossRef]
- Venkataraman, R.; Krishnaprasad, P.S. Qualitative analysis of a bulk ferromagnetic hysteresis model. In Proceedings of the 37th IEEE Conference on Decision and Control, Tampa, FL, USA, 16–18 December 1998. [Google Scholar] [CrossRef]
- Szewczyk, R.; Cheng, P. Open Source Implementation of Different Variants of Jiles-Atherton Model of Magnetic Hysteresis Loops. Acta Phys. Pol. A 2018, 133, 654–656. [Google Scholar] [CrossRef]
- Chwastek, K.; Szczygłowski, J.; Wilczyński, W. Minor Loops in the Harrison Model. Acta Phys. Pol. A 2012, 121, 941–944. [Google Scholar] [CrossRef]
- Szewczyk, R. Validation of the Anhysteretic Magnetization Model for Soft Magnetic Materials with Perpendicular Anisotropy. Materials 2014, 7, 5109–5116. [Google Scholar] [CrossRef] [PubMed]
- Jiles, D.C. Introduction to Magnetism and Magnetic Materials, 2nd ed.; Chapman and Hall: London, UK, 1998; ISBN 978-0412798603. [Google Scholar]
- Kvasnica, B.; Kundracik, F. Fitting experimental anhysteretic curves of ferromagnetic materials and investigation of the effect of temperature and tensile stress. J. Magn. Magn. Mater. 1996, 162, 43–49. [Google Scholar] [CrossRef]
- Nowicki, M. Anhysteretic Magnetization Measurement Methods for Soft Magnetic Materials. Materials 2018, 11, 2021. [Google Scholar] [CrossRef] [PubMed]
- Estakhri, N.M.; Edwards, B.; Engheta, N. Inverse-designed metastructures that solve equations. Science 2019, 363, 1333–1338. [Google Scholar]
- La Spada, L.; Spooner, C.; Haq, S.; Hao, Y. Curvilinear MetaSurfaces for Surface Wave Manipulation. Sci. Rep. 2019, 9, 3107. [Google Scholar] [CrossRef] [PubMed]
- Kittel, C. Introduction to Solid State Physics, 2nd ed.; John Wiley and Sons: Hoboken, NJ, USA, 1960; ISBN 1114173568. [Google Scholar]
- Sablik, M.; Jiles, D.C. Coupled magnetoelastic theory of magnetic and magnetostrictive hysteresis. IEEE Trans. Magn. 1993, 29, 2113–2123. [Google Scholar] [CrossRef]
- Kokornaczyk, E.; Gutowski, M.W. Anhysteretic Functions for the Jiles-Atherton Model. IEEE Trans. Magn. 2015, 51, 7300305. [Google Scholar] [CrossRef]
- Ponjavic, M.M.; Duric, R.M. Nonlinear modeling of the self-oscillating fluxgate current sensor. IEEE Sens. J. 2007, 7, 1546. [Google Scholar] [CrossRef]
- La Spada, L.; Vegni, L. Electromagnetic nanoparticles for sensing and medical diagnostic applications. Materials 2018, 11, 603. [Google Scholar] [CrossRef] [PubMed]
- Sablik, M.J.; Augustyniak, B.; Chmielewski, M. Modeling biaxial stress effects on magnetic hysteresis in steel with the field and stress axes noncoaxial. J. Appl. Phys. 1999, 85, 4391–4393. [Google Scholar] [CrossRef]
- Sablik, M.J.; Burkhardt, G.L.; Kwun, H.; Jiles, D.C. A model for the effect of stress on the low-frequency harmonic content of the magnetic induction in ferromagnetic materials. J. Appl. Phys. 1988, 63, 3930–3932. [Google Scholar] [CrossRef]
- Chwastek, K.; Szczygłowski, J.; Najgebauer, M. A Direct Search algorithm for estimation of Jiles-Atherton hysteresis model parameters. Mater. Sci. Eng. B 2006, 131, 22–26. [Google Scholar] [CrossRef]
- Chwastek, K.; Szczygłowski, J. An alternative method to estimate the parameters of Jiles-Atherton model. J. Magn. Magn. Mater. 2007, 314, 47–51. [Google Scholar] [CrossRef]
- Culity, B.D. Introduction to Magnetic Materials, 2nd ed.; Wiley-IEEE Press: Hoboken, NJ, USA, 2011; ISBN 978-1-118-21149-6. [Google Scholar]
- Ramesh, A.; Jiles, D.C.; Bi, Y. Generalization of hysteresis modeling to anisotropic materials. J. Appl. Phys. 1997, 81, 5585–5587. [Google Scholar] [CrossRef]
- Ramesh, A.; Jiles, D.; Roderik, J. A model of anisotropic anhysteretic magnetization. IEEE Trans. Magn. 1996, 32, 4234–4236. [Google Scholar] [CrossRef]
- Charubin, T.; Nowicki, M.; Marusenkov, A.; Szewczyk, R.; Nosenko, A.; Kyrylchuk, V. Mobile ferrograph system for ultrahigh permeability alloys. J. Autom. Mob. Rob. Intell. Syst. 2018, 12, 40–42. [Google Scholar] [CrossRef]
- Frydrych, P.; Szewczyk, R.; Salach, J. Magnetic Fluxgate Sensor Characteristics Modeling Using Extended Preisach Model. Acta Phys. Pol. A 2014, 126, 18–19. [Google Scholar] [CrossRef]
- La Spada, L. Metasurfaces for Advanced Sensing and Diagnostics. Sensors 2019, 19, 355. [Google Scholar] [CrossRef] [PubMed]
- Dahal, J.N.; Ali, K.S.S.; Mishra, S.R.; Alam, J. Structural, Magnetic, and Mössbauer Studies of Transition Metal-Doped Gd2Fe16Ga0.5TM0.5 Intermetallic Compounds (TM = Cr, Mn, Co, Ni, Cu, and Zn). Magnetochemistry 2018, 4, 54. [Google Scholar] [CrossRef]


| Parameter | Unit | Mn-Zn ferrite F3001 | Co67Fe4Mo1B11Si17 | Fe73.5Cu1Nb3Si15.5B7 Perpendicular Anisotropy | Fe67Co18B14Si1 Parallel Anisotropy |
|---|---|---|---|---|---|
| Ms | A/m | 356,460 | 643,597 | 820,551 | 521,407 |
| a | A/m | 87.52 | 11.20 | 50.00 | 0.52 |
| α | 7.65 × 10⁻⁷ | 1.31 × 10⁻⁵ | 2.92 × 10⁻⁸ | 5.96 × 10⁻⁷ | |
| R2 | % | 99.79 | 99.9989 | 88.47 | 99.96 |
| Parameter | Unit | Mn-Zn ferrite F3001 | Co67Fe4Mo1B11Si17 | Fe73.5Cu1Nb3Si15.5B7 Perpendicular Anisotropy | Fe67Co18B14Si1 Parallel Anisotropy |
|---|---|---|---|---|---|
| Ms | A/m | 360,958 | 649,693 | 1,073,424 | 523,969 |
| a | A/m | 55.90 | 3.99 | 264.94 | 0.10 |
| α | 1.34 × 10⁻⁵ | 9.91 × 10⁻⁶ | 2.92 × 10⁻⁸ | 5.64 × 10⁻⁸ | |
| R2 | % | 99.94 | 99.9977 | 99.74 | 99.96 |
| Parameter | Unit | Mn-Zn ferrite F3001 | Co67Fe4Mo1B11Si17 | Fe73.5Cu1Nb3Si15.5B7 Perpendicular Anisotropy | Fe67Co18B14Si1 Parallel Anisotropy |
|---|---|---|---|---|---|
| Ms | A/m | 399,291 | 727,548 | 1,330,538 | 533,825 |
| a | A/m | 44.01 | 2.36 | 385.76 | 0.08 |
| α | 2.26 × 10⁻⁵ | 2.68 × 10⁻⁶ | 2.94 × 10⁻⁸ | 5.64 × 10⁻⁸ | |
| R2 | % | 99.9992 | 99.995 | 99.50 | 99.97 |
| Parameter | Unit | Mn-Zn ferrite | Co67Fe4Mo1B11Si17 | Fe73.5Cu1Nb3Si15.5B7 Perpendicular Anisotropy | Fe67Co18B14Si1 Parallel Anisotropy |
|---|---|---|---|---|---|
| Ms | A/m | 402,878 | 737,851 | 948,825 | 537,164 |
| a | A/m | 32.67 | 1.84 | 50.00 | 0.10 |
| α | 9.17 × 10⁻⁵ | 5.07 × 10⁻⁵ | 2.92 × 10⁻⁸ | 3.68 × 10⁻⁷ | |
| R2 | % | 99.9990 | 99.995 | 95.11 | 99.95 |
| Parameter | Unit | Mn-Zn ferrite F-3001 | Co67Fe4Mo1B11Si17 | Fe73.5Cu1Nb3Si15.5B7 Perpendicular Anisotropy | Fe67Co18B14Si1 Parallel Anisotropy |
|---|---|---|---|---|---|
| Ms | A/m | 403,075 | 736,367 | 1,028,169 | 602,000 |
| a | A/m | 32.98 | 1.80 | 2.72 | 28.86 |
| α | 9.5 × 10⁻⁵ | 4.8 × 10⁻⁵ | 4.48 × 10⁻⁶ | 6.85 × 10⁻⁵ | |
| Κan | J/m3 | 0.05 | 0.04 | 411.42 | 487.98 |
| R2 | % | 99.9990 | 99.995 | 99.9993 | 99.65 |
| R2 (%) | Mn-Zn ferrite F-3001 | Co67Fe4Mo1B11Si17 | Fe73.5Cu1Nb3Si15.5B7 Perpendicular Anisotropy | Fe67Co18B14Si1 Parallel Anisotropy |
|---|---|---|---|---|
| erf-based | 99.79 | 99.9989 | 88.47 | 99.96 |
| exp-based | 99.94 | 99.9977 | 99.74 | 99.96 |
| arctan-based | 99.9992 | 99.995 | 99.50 | 99.97 |
| Langevin function-based | 99.9990 | 99.995 | 95.11 | 99.95 |
| Anisotropic extension-based | 99.9990 | 99.995 | 99.9993 | 99.65 |
© 2019 by the authors. Licensee MDPI, Basel, Switzerland. This article is an open access article distributed under the terms and conditions of the Creative Commons Attribution (CC BY) license (http://creativecommons.org/licenses/by/4.0/).
Share and Cite
Nowicki, M.; Szewczyk, R.; Nowak, P. Experimental Verification of Isotropic and Anisotropic Anhysteretic Magnetization Models. Materials 2019, 12, 1549. https://doi.org/10.3390/ma12091549
Nowicki M, Szewczyk R, Nowak P. Experimental Verification of Isotropic and Anisotropic Anhysteretic Magnetization Models. Materials. 2019; 12(9):1549. https://doi.org/10.3390/ma12091549
Chicago/Turabian StyleNowicki, Michał, Roman Szewczyk, and Paweł Nowak. 2019. "Experimental Verification of Isotropic and Anisotropic Anhysteretic Magnetization Models" Materials 12, no. 9: 1549. https://doi.org/10.3390/ma12091549
APA StyleNowicki, M., Szewczyk, R., & Nowak, P. (2019). Experimental Verification of Isotropic and Anisotropic Anhysteretic Magnetization Models. Materials, 12(9), 1549. https://doi.org/10.3390/ma12091549