The Enhancement of H2 Evolution over Sr1−1.5xTbxWO4 Solid Solution under Ultraviolet Light Irradiation


Abstract
1. Introduction
2. Materials and Methods
2.1. Preparations of the Catalysts
2.2. Characterizations
2.3. Theoretical Calculations
2.4. Photocatalytic Performance Evaluation
2.5. Preparation of the Cocatalysts
3. Results and Discussion
4. Conclusions
Author Contributions
Funding
Acknowledgments
Conflicts of Interest
References
- Qi, J.; Zhang, W.; Cao, R. Solar-to-hydrogen energy conversion based on water splitting. Adv. Energy Mater. 2018, 8, 1–16. [Google Scholar] [CrossRef]
- Zou, Z.G.; Ye, J.H.; Sayama, K.; Arakawa, H. Direct splitting of water under visible light irradiation with an oxide semiconductor photocatalyst. Nature 2001, 414, 625–627. [Google Scholar]
- Shen, S.L.; Wang, Q.B. Rational tuning the optical properties of metal sulfide nanocrystals and their applications. Chem. Mater. 2013, 25, 1166–1178. [Google Scholar] [CrossRef]
- Ahmed, M.; Guo, X.X. A review of metal oxynitrides for photocatalysis. Inorg. Chem. Front. 2016, 3, 578–590. [Google Scholar] [CrossRef]
- Yang, J.; Xie, T.P.; Liu, C.L.; Xu, L.J. Facile fabrication of dumbbell-like beta-Bi2O3/graphene nanocomposites and their highly efficient photocatalytic activity. Materials 2018, 11, 1359. [Google Scholar] [CrossRef]
- Yang, J.; Fu, H.; Yang, D.F.; Gao, W.L.; Cong, R.H.; Yang, T. ZnGa2-xInxS4 (0 ≤ x ≤ 0.4) and Zn1-2y(CuGa)yGa1.7In0.3S4 (0.1 ≤ y ≤ 0.2): Optimize visible light photocatalytic H2 evolution by fine modulation of band structures. Inorg. Chem. 2015, 54, 2467–2473. [Google Scholar]
- Yan, H.J.; Yang, J.H.; Ma, G.J.; Wu, G.P.; Zong, X.; Lei, Z.B.; Shi, J.Y.; Li, C. Visible-light-driven hydrogen production with extremely high quantum efficiency on Pt-PdS/CdS photocatalyst. J. Catal. 2009, 266, 165–168. [Google Scholar] [CrossRef]
- Pan, C.S.; Takata, T.; Nakabayashi, M.; Matsumoto, T.; Shibata, N.; Ikuhara, Y.; Domen, K. A complex perovskite-type oxynitride: The first photocatalyst for water splitting operable at up to 600 nm. Angew. Chem. Int. Ed. 2015, 54, 2955–2959. [Google Scholar] [CrossRef] [PubMed]
- Maeda, K.; Teramura, K.; Saito, N.; Inoue, Y.; Domen, K. Improvement of photocatalytic activity of (Ga1-xZnx)(N1-xOx) solid solution for overall water splitting by co-loading Cr and another transition metal. J. Catal. 2006, 243, 303–308. [Google Scholar] [CrossRef]
- Cui, C.; Li, S.; Qiu, Y.W.; Hu, H.H.; Li, X.Y.; Li, C.R.; Gao, J.K.; Tang, W.H. Fast assembly of Ag3PO4 nanoparticles within three-dimensional graphene aerogels for efficient photocatalytic oxygen evolution from water splitting under visible light. Appl. Catal. B-Environ. 2017, 200, 666–672. [Google Scholar] [CrossRef]
- Yang, H.X.; Liu, X.Y.; Sun, S.N.; Nie, Y.; Wu, H.P.; Yang, T.Y.; Zheng, S.J.; Lin, S.L. Green and facile synthesis of graphene nanosheets/K3PW12O40 nanocomposites with enhanced photocatalytic activities. Mater. Res. Bull. 2016, 78, 112–118. [Google Scholar] [CrossRef]
- Zhang, N.; Yang, M.Q.; Liu, S.Q.; Sun, Y.G.; Xu, Y.J. Waltzing with the Versatile Platform of Graphene to Synthesize Composite Photocatalysts. Chem. Rev. 2015, 115, 10307–10377. [Google Scholar] [CrossRef]
- Wang, G.J.; Jing, Y.; Ju, J.; Yang, D.F.; Yang, J.; Gao, W.L.; Cong, R.H.; Yang, T. Ga4B2O9: An efficient borate photocatalyst for overall water splitting without cocatalyst. Inorg. Chem. 2015, 54, 2945–2949. [Google Scholar] [CrossRef]
- Yang, J.; Jiang, P.F.; Yue, M.F.; Yang, D.F.; Cong, R.H.; Gao, W.L.; Yang, T. Bi2Ga4O9: An undoped single-phase photocatalyst for overall water splitting under visible light. J. Catal. 2017, 345, 236–244. [Google Scholar] [CrossRef]
- Zheng, Y.H.; Lin, J.T.; Wang, Q.M. Emissions and photocatalytic selectivity of SrWO4:Ln3+ (Eu3+, Tb3+, Sm3+ and Dy3+) prepared by a supersonic microwave co-assistance method. Photochem. Photobiol. Sci. 2012, 11, 1567–1574. [Google Scholar] [CrossRef]
- Shan, Z.C.; Wang, Y.M.; Ding, H.M.; Huang, F.Q. Structure-dependent photocatalytic activities of MWO4 (M = Ca, Sr, Ba). J. Mol. Catal. A-Chem. 2009, 302, 54–58. [Google Scholar] [CrossRef]
- Cavalcante, L.S.; Sczancoski, J.C.; Batista, N.C.; Longo, E.; Varela, J.A.; Orlandi, M.O. Growth mechanism and photocatalytic properties of SrWO4 microcrystals synthesized by injection of ions into a hot aqueous solution. Adv. Powder. Technol. 2013, 24, 344–353. [Google Scholar] [CrossRef]
- Shivakumara, C.; Saraf, R.; Behera, S.; Dhananjaya, N.; Nagabhushana, H. Scheelite-type MWO4 (M = Ca, Sr, and Ba) nanophosphors: Facile synthesis, structural characterization, photoluminescence, and photocatalytic properties. Mater. Res. Bull. 2015, 61, 422–432. [Google Scholar] [CrossRef]
- Liu, X.Y.; Nie, Y.; Yang, H.X.; Sun, S.N.; Chen, Y.Y.; Yang, T.Y.; Lin, S.L. Enhancement of the photocatalytic activity and electrochemical property of graphene-SrWO4 nanocomposite. Solid State Sci. 2016, 55, 130–137. [Google Scholar] [CrossRef]
- Talebi, R.; Safari, A. Synthesis, characterization, and of investigation magnetic and photocatalytic property of SrWO4 nanoparticles. J. Mater. Sci-Mater. El. 2016, 27, 9842–9846. [Google Scholar] [CrossRef]
- Sahmi, A.; Bensadok, K.; Zirour, H.; Trari, M. Physical and photoelectrochemical characterizations of SrWO4 prepared by thermal decomposition: Application to the photo electro-oxidation of ibuprofen. J. Solid State Electr. 2017, 21, 2817–2824. [Google Scholar] [CrossRef]
- Chen, D.; Liu, Z.; Ouyang, S.X.; Ye, J.H. Simple room-temperature mineralization method to SrWO4 micro/nanostructures and their photocatalytic properties. J. Phys. Chem. C. 2011, 115, 15778–15784. [Google Scholar] [CrossRef]
- Yang, J.; Yue, M.F.; Ju, J.; Cong, R.H.; Gao, W.L.; Yang, T. Co-molten solvothermal method for synthesizing chalcopyrite CuFe1-xCrxS2 (x ≤ 0.4): High photocatalytic activity for the reduction of nitrate ions. Dalton Trans. 2014, 43, 15385–15390. [Google Scholar]
- TOPAS, V4. 1-beta, Bruker AXS, Karlsuhe, Germany. 2004. Available online: https://www.bruker.com/products/x-ray-diffraction-and-elemental-analysis/x-ray-diffraction/xrd-software/topas.html (accessed on 7 May 2019).
- Kresse, G.; Furthmuller, J. Efficient iterative schemes for ab initio total-energy calculations using a plane-wave basis set. Phys. Rev. B. 1996, 54, 11169–11186. [Google Scholar] [CrossRef]
- Blochl, P.E. Projector augmented-wave method. Phys. Rev. B. 1994, 50, 17953–17979. [Google Scholar] [CrossRef]
- Perdew, J.P.; Burke, K.; Ernzerhof, M. Generalized gradient approximation made simple. Phys. Rev. Lett. 1996, 77, 3865–3868. [Google Scholar] [CrossRef]
- Huang, X.; Jing, Y.; Yang, J.; Ju, J.; Cong, R.H.; Gao, W.L.; Yang, T. Flower-like nanostructure MNb2O6 (M = Mn, Zn) with high surface area: Hydrothermal synthesis and enhanced photocatalytic performance. Mater. Res. Bull. 2014, 51, 271–276. [Google Scholar] [CrossRef]
- Jing, D.; Guo, L. A novel method for the preparation of a highly stable and active CdS photocatalyst with a special surface nanostructure. J. Phys. Chem. B 2006, 110, 11139–11145. [Google Scholar] [CrossRef]
- Liu, J.; Liu, Y.; Liu, N.Y.; Han, Y.Z.; Zhang, X.; Huang, H.; Lifshitz, Y.; Lee, S.T.; Zhong, J.; Kang, Z.H. Metal-free efficient photocatalyst for stable visible water splitting via a two-electron pathway. Science 2015, 347, 970–974. [Google Scholar] [CrossRef]
- Nayak, S.; Mohapatra, L.; Parida, K. Visible light-driven novel g-C3N4/NiFe-LDH composite photocatalyst with enhanced photocatalytic activity towards water oxidation and reduction reaction. J. Mater. Chem. A 2015, 3, 18622–18635. [Google Scholar] [CrossRef]
- Zhang, Y.; Gu, J.; Murugananthan, M.; Zhang, Y.R. Development of novel α-Fe2O3/NiTiO3 heterojunction nanofibers material with enhanced visible-light photocatalytic performance. J. Alloy. Comp. 2015, 630, 110–116. [Google Scholar] [CrossRef]
- Tan, L.L.; Ong, W.J.; Chai, S.P.; Mohamed, A.R. Noble metal modified reduced graphene oxide/TiO2 ternary nanostructures for efficient visible-light-driven photoreduction of carbon dioxide into methane. Appl. Catal. B: Environ. 2015, 166–167, 251–259. [Google Scholar] [CrossRef]
- Kudo, A.; Miseki, Y. Heterogeneous photocatalyst materials for water splitting. Chem. Soc. Rev. 2009, 38, 253–278. [Google Scholar] [CrossRef]
- Ni, L.; Tanabe, M.; Irie, H. A visible-light-induced overall water-splitting photocatalyst: Conduction-band-controlled silver tantalate. Chem. Commun. 2013, 49, 10094–10096. [Google Scholar] [CrossRef]
- Zou, Z.G.; Ye, J.H.; Arakawa, H. Photocatalytic behavior of a new series of In0.8M0.2TaO4 (M = Ni, Cu, Fe) photocatalysts in aqueous solutions. Catal. Lett. 2001, 75, 3–4. [Google Scholar] [CrossRef]
- Ran, J.R.; Zhang, J.; Yu, J.G.; Jaroniec, M.; Qiao, S.Z. Earth-abundant cocatalysts for semiconductor based photocatalytic water splitting. Chem. Soc. Rev. 2014, 43, 7787–7812. [Google Scholar] [CrossRef]
- Ma, B.; Cong, R.H.; Gao, W.L.; Yang, T. Photocatalytic overall water splitting over an open-framework galliumborate loaded with various cocatalysts. Catal. Commun. 2015, 71, 17–20. [Google Scholar] [CrossRef]


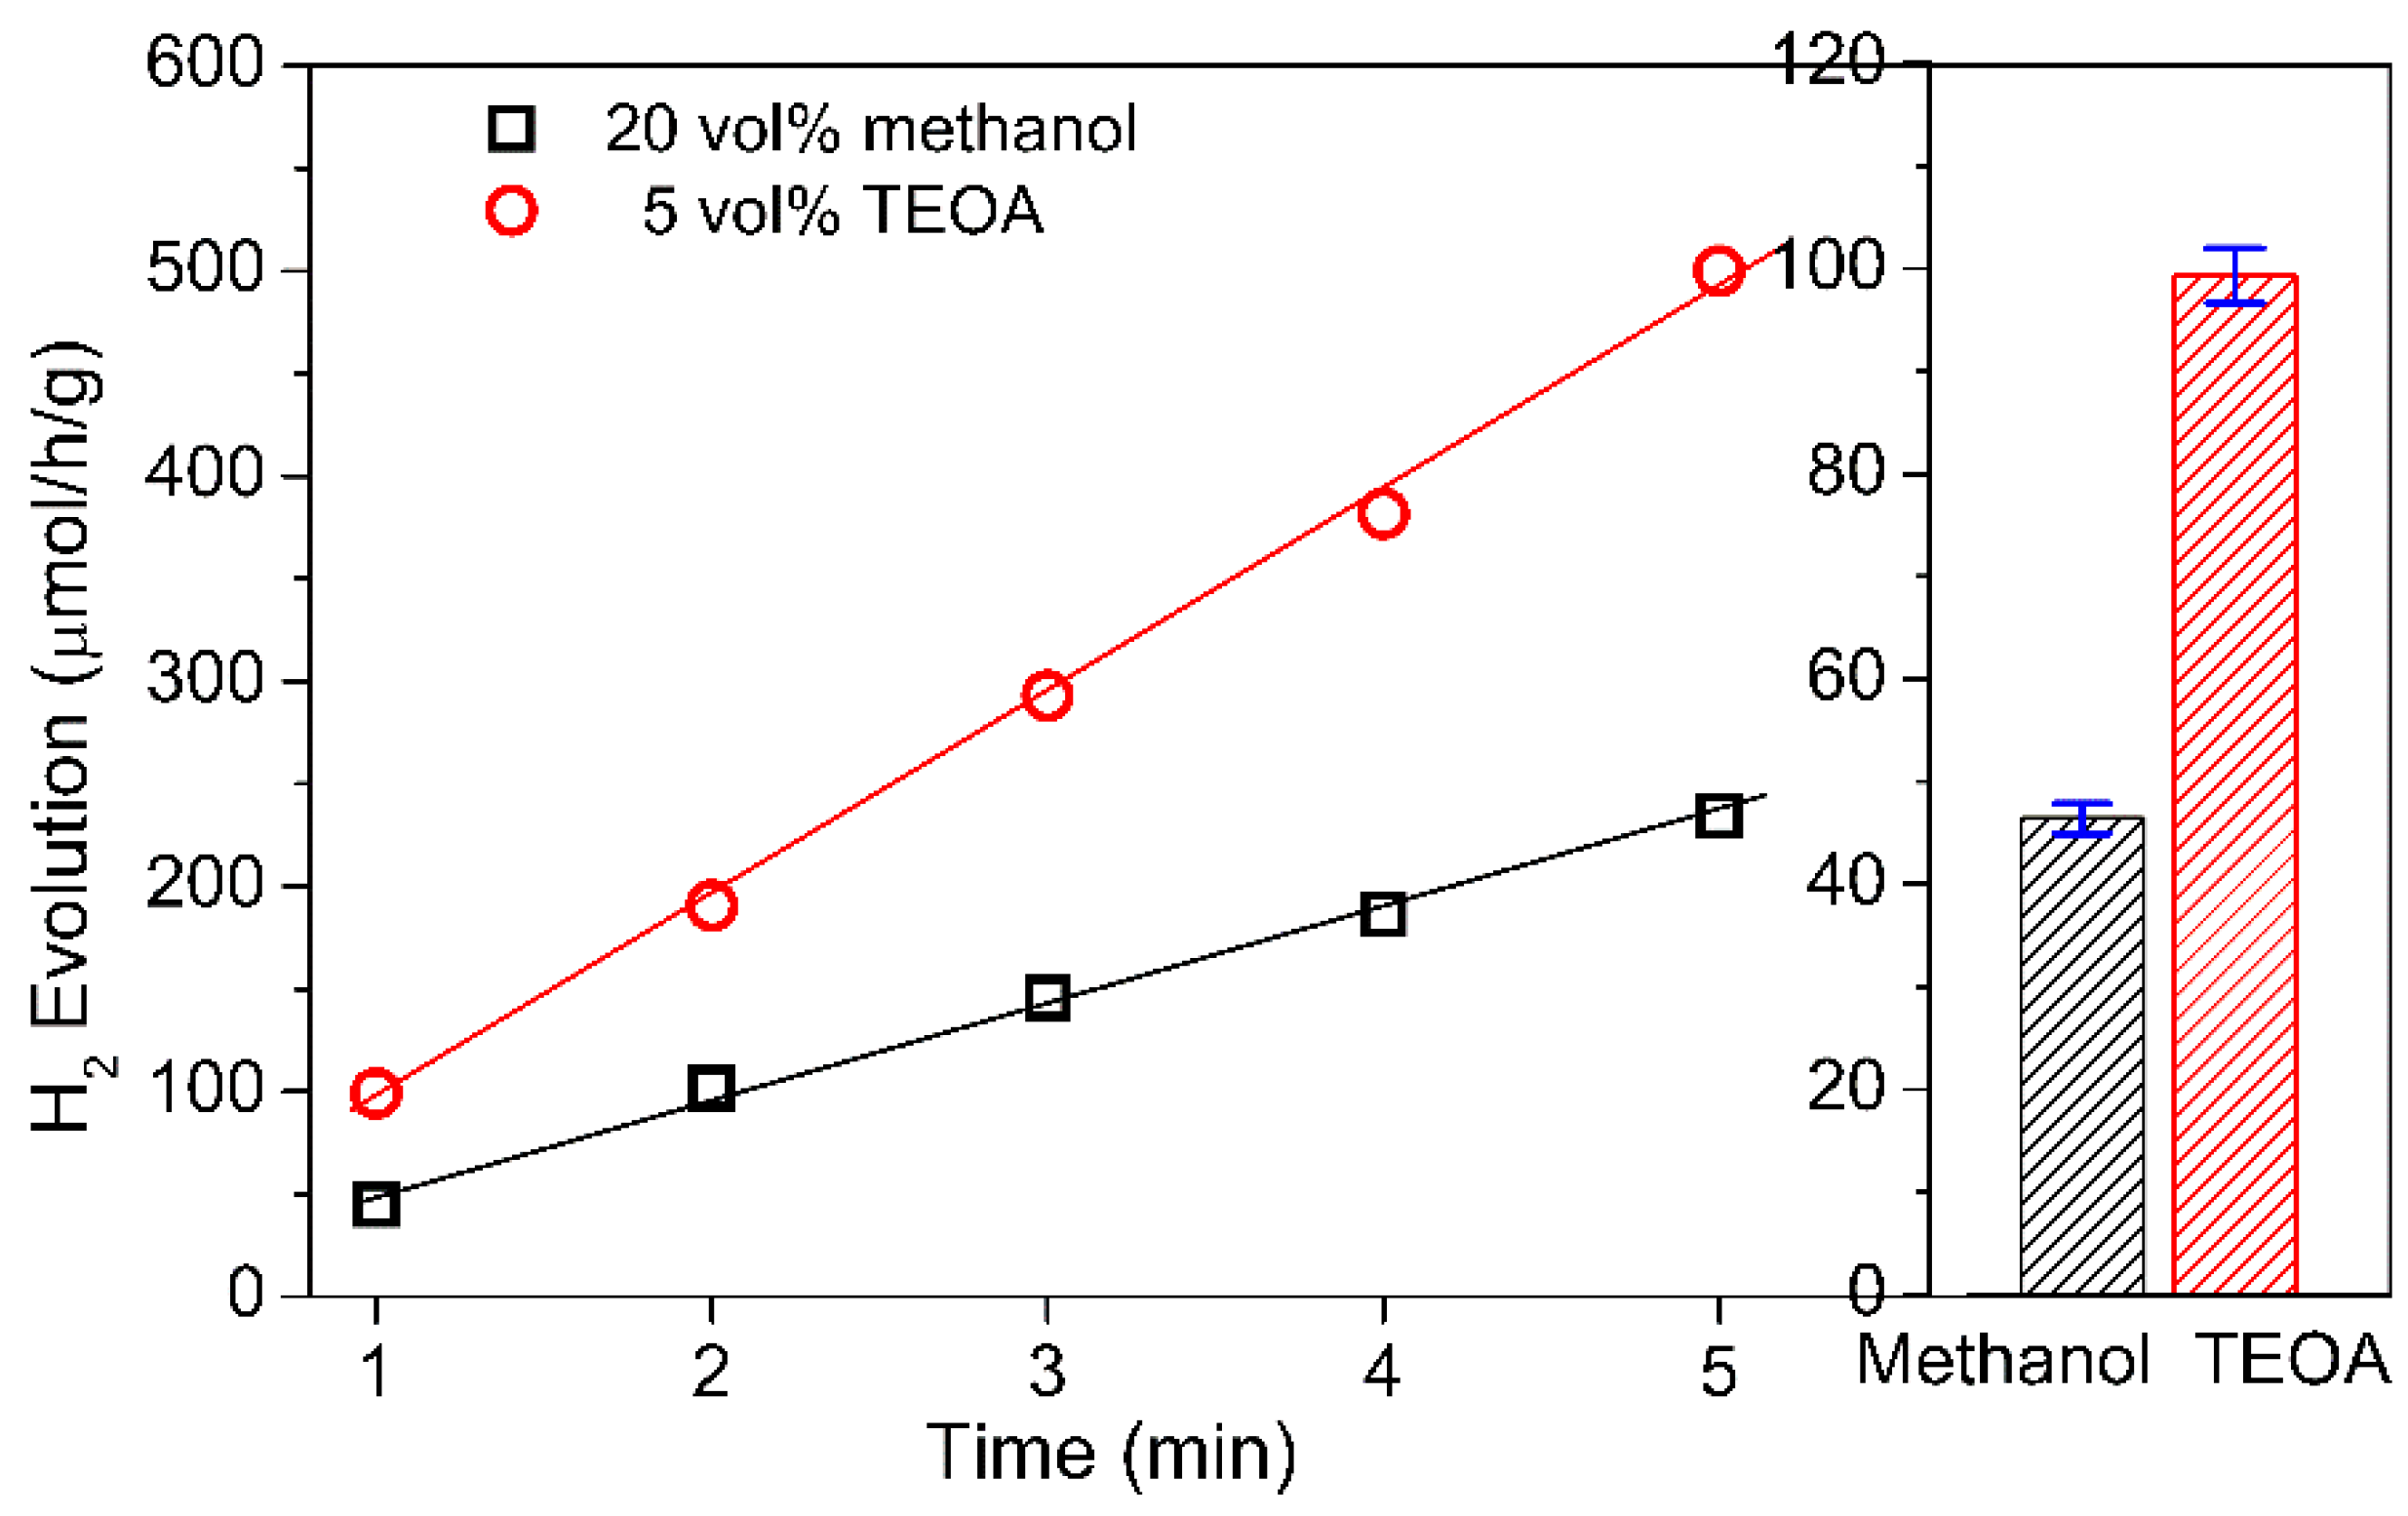
| Photocatalyst | [1] SrWO4 | [2] 1.5 wt % Ru-Loaded SrWO4 | [3] Sr0.82Tb0.12WO4 | [4] 1.5 wt % Ru-Loaded Sr0.82Tb0.12WO4 |
|---|---|---|---|---|
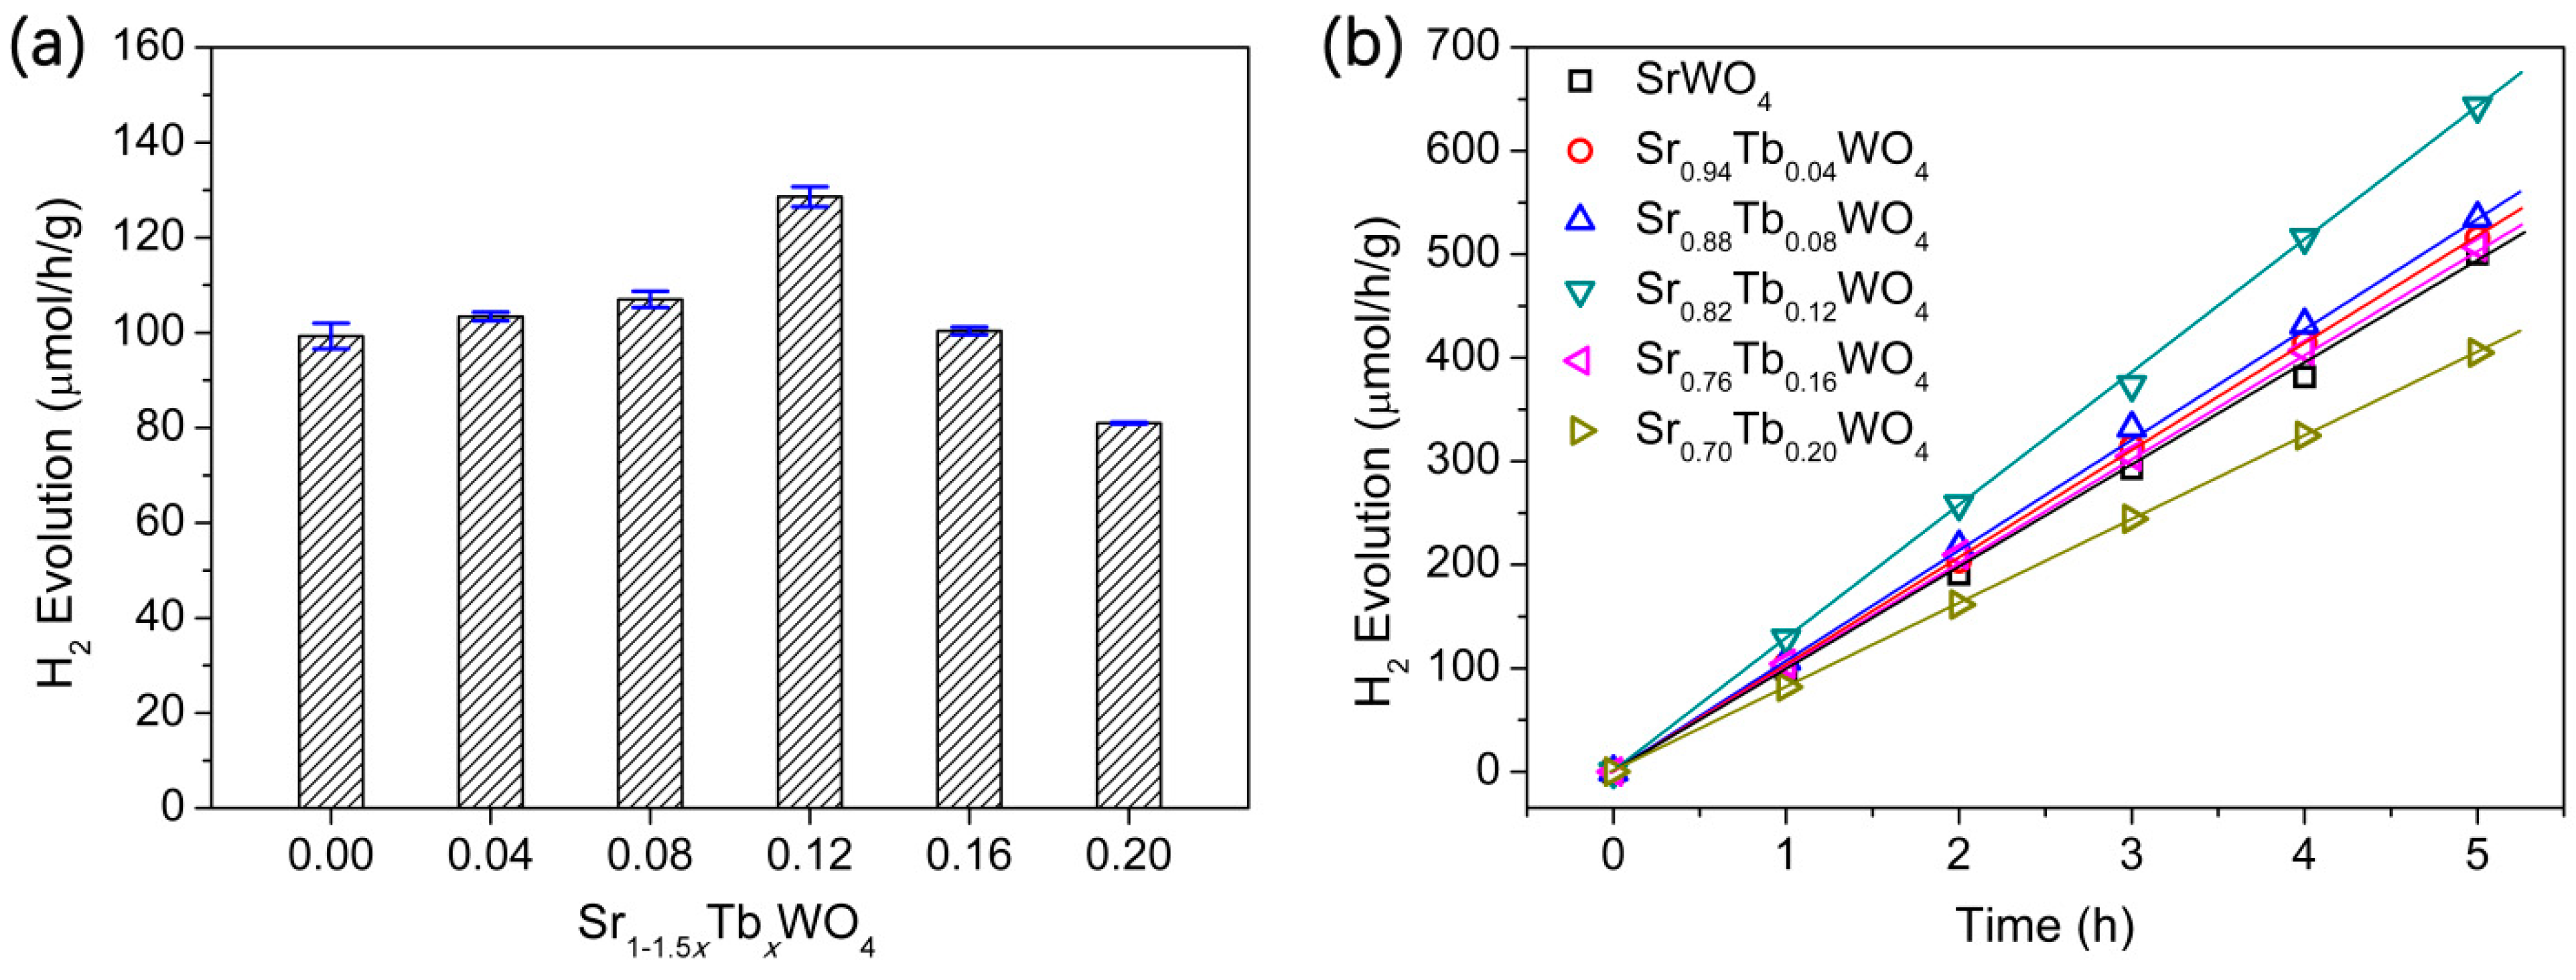
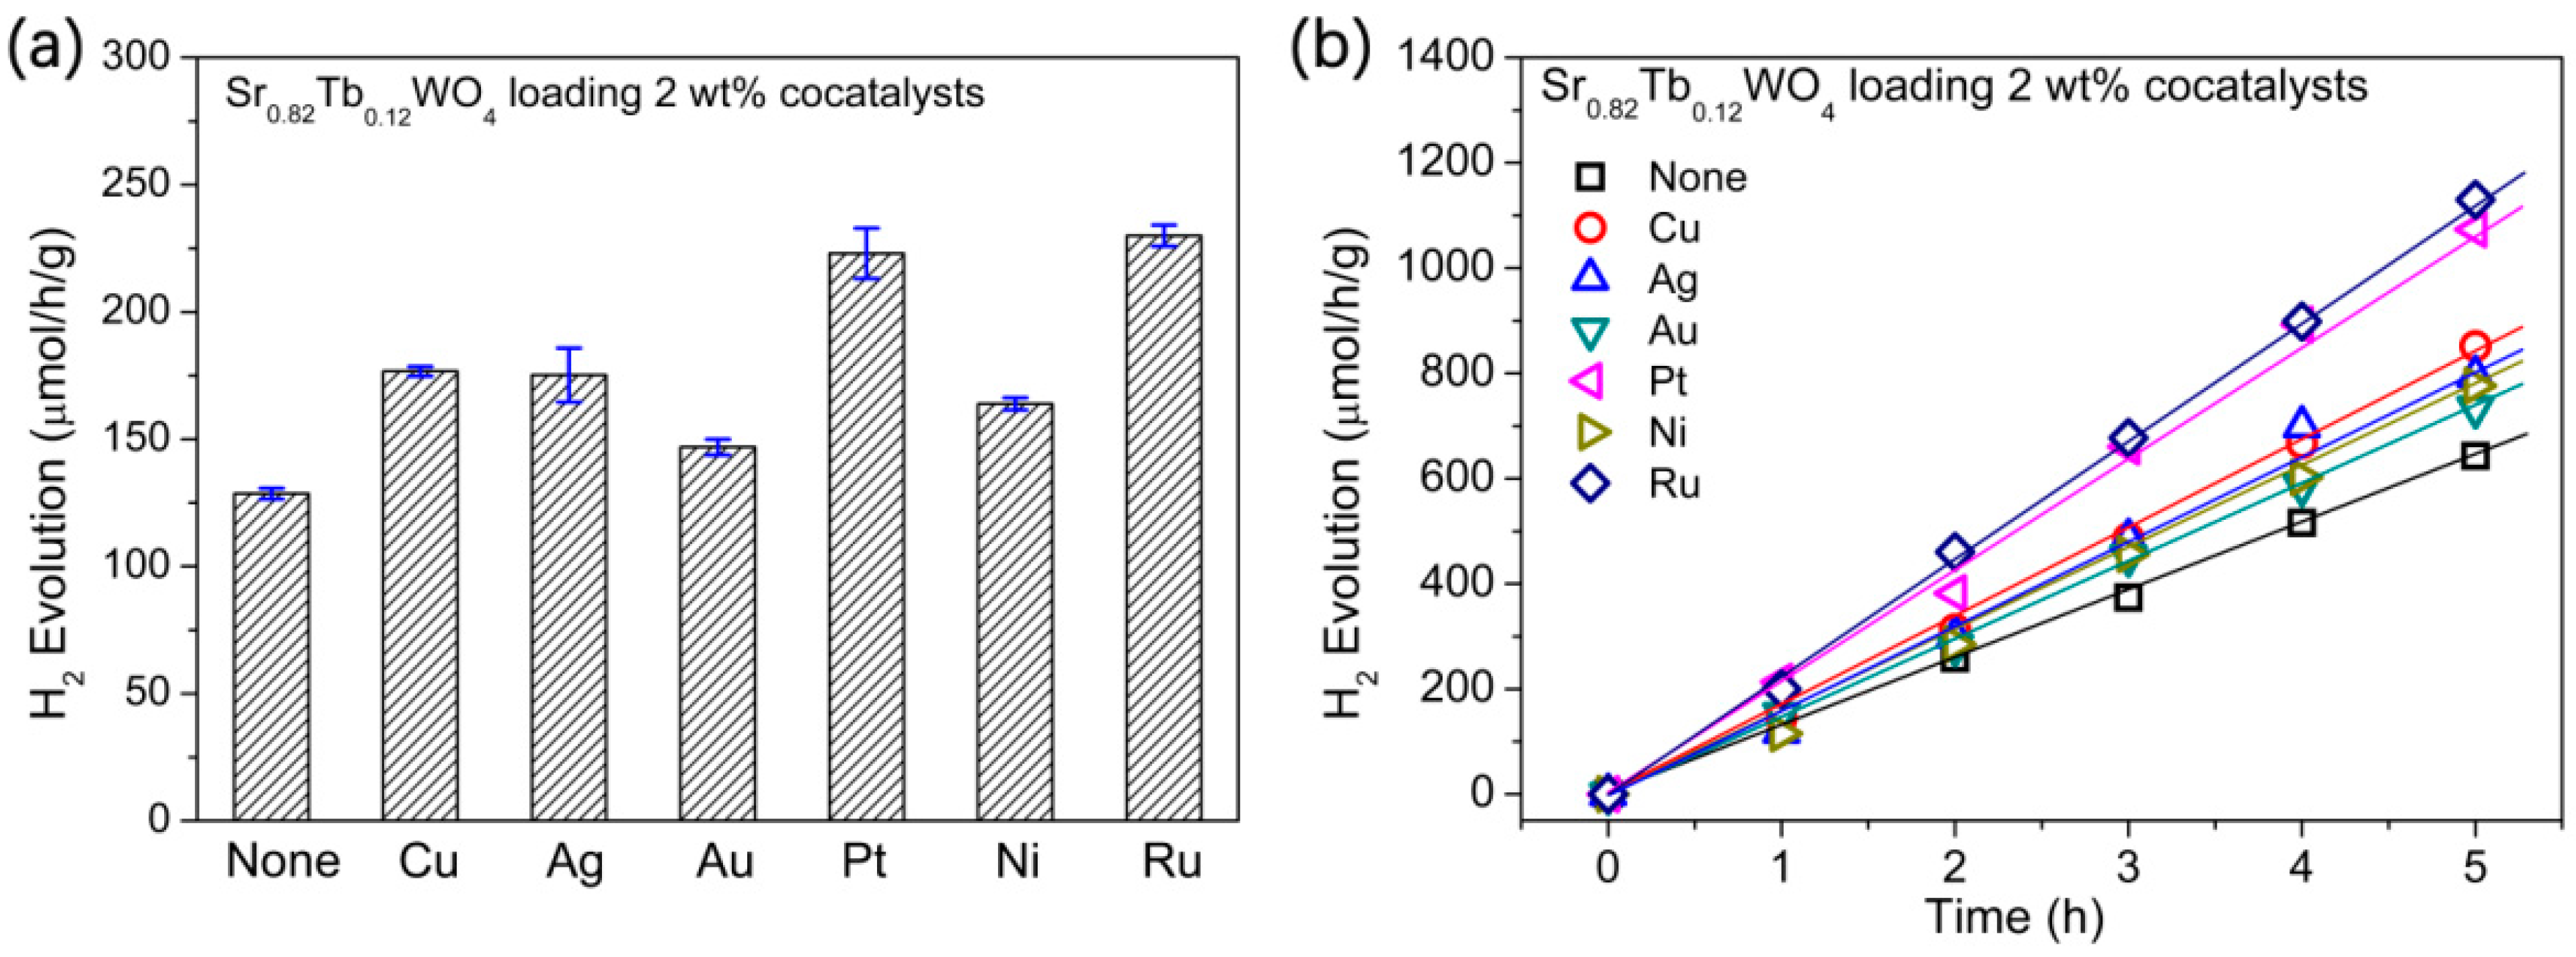
| H2 evolution (μmol/h/g) | 99.3 | 117.4 | 128.6 | 281.9 |
| ratio | [2]:[1] = 1.18 | [3]:[1] = 1.30 | [4]:[1] = 2.84; [4]:[2] = 2.40; [4]:[3] = 2.19 |
© 2019 by the authors. Licensee MDPI, Basel, Switzerland. This article is an open access article distributed under the terms and conditions of the Creative Commons Attribution (CC BY) license (http://creativecommons.org/licenses/by/4.0/).
Share and Cite
Yang, J.; Sun, X.; Zeng, T.; Hu, Y.; Shi, J. The Enhancement of H2 Evolution over Sr1−1.5xTbxWO4 Solid Solution under Ultraviolet Light Irradiation. Materials 2019, 12, 1487. https://doi.org/10.3390/ma12091487
Yang J, Sun X, Zeng T, Hu Y, Shi J. The Enhancement of H2 Evolution over Sr1−1.5xTbxWO4 Solid Solution under Ultraviolet Light Irradiation. Materials. 2019; 12(9):1487. https://doi.org/10.3390/ma12091487
Chicago/Turabian StyleYang, Jia, Xiaorui Sun, Ting Zeng, Yilan Hu, and Jianwei Shi. 2019. "The Enhancement of H2 Evolution over Sr1−1.5xTbxWO4 Solid Solution under Ultraviolet Light Irradiation" Materials 12, no. 9: 1487. https://doi.org/10.3390/ma12091487
APA StyleYang, J., Sun, X., Zeng, T., Hu, Y., & Shi, J. (2019). The Enhancement of H2 Evolution over Sr1−1.5xTbxWO4 Solid Solution under Ultraviolet Light Irradiation. Materials, 12(9), 1487. https://doi.org/10.3390/ma12091487