Article

An Energy-Based Unified Approach to Predict the Low-Cycle Fatigue Life of Type 316L Stainless Steel under Various Temperatures and Strain-Rates

1
Division of Industrial Metrology, Korea Research Institute of Standards and Science, Daejeon 34113, Korea
2
Autonomous Vehicles Research Team, New Transportation Innovative Research Center, Korea Railroad Research Institute, Uiwang-si 16105, Korea
3
Department of Safety Engineering, Seoul National University of Science and Technology, Seoul 01811, Korea
*
Author to whom correspondence should be addressed.
Materials 2019, 12(7), 1090; https://doi.org/10.3390/ma12071090
Submission received: 10 March 2019 / Revised: 29 March 2019 / Accepted: 29 March 2019 / Published: 2 April 2019
(This article belongs to the Special Issue Deformation, Fatigue and Fracture of Materials)

Abstract

:
An energy-based low-cycle fatigue model was proposed for applications at a range of temperatures. An existing model was extended to the integrated approach, incorporating the simultaneous effects of strain rate and temperature. A favored material at high temperature, type 316L stainless steel, was selected in this study and its material characteristics were investigated. Tensile tests and low-cycle fatigue tests were performed using several strain rates at a temperature ranging from room temperature to 650 °C. Material properties were obtained in terms of temperature using the displacement-controlled tensile tests and further material response were investigated using strain-controlled tensile tests. Consequently, no pronounced reduction in strengths occurred at temperatures between 300 and 550 °C, and a negative strain rate response was observed in the temperature range. Based on the low-cycle fatigue tests by varying strain rates and temperature, it was found that a normalized plastic strain energy density and a strain-rate modified cycle were successfully correlated. The accuracy of the model was discussed by comparing between predicted and experimental lives.

1. Introduction

Reliable lifetime assessment is of primary concern in structures or mechanical components, most importantly in those whose failure results in catastrophic disaster. Because inaccurate or non-conservative estimations can cause significant losses in human lives and properties, the accuracy of predicted lives must be assured in the design stage and in the remaining useful lifetime assessment of the structures. Accuracy can be achieved on an integral basis of extensive explorations into material response, of external loading analysis, and of guaranteed life prediction models [1,2,3].
Many mechanical components in power facilities or nuclear reactors must withstand repeated loading at elevated temperatures and low-cycle fatigue (LCF) is considered as a predominant failure mechanism. For example, turbine blades, disks, and boiler components in plants are subjected to LCF at elevated temperatures. In those applications, the mechanical components can experience a wide range of operating temperatures. Specifically, the components are subject to temperature gradient induced cyclic thermal stresses owing to startups and shutdowns or the temperature change of a coolant that is either a liquid, such as sodium, or a gas, such as helium, that flows in the pipe of a cooling system [4,5]. Moreover, when exposed to a temperature greater than the creep-activation temperature, materials of which the components are made can experience complicated microstructural changes, resulting in appearance of various failure mechanisms. Thus, fatigue life prediction at elevated temperature can be a challenging problem.
A long history of studies exists to discover the effects associated with LCF behavior at elevated temperatures: Temperature, temperature cycling, strain rate, hold time, load sequence, etc. [6,7,8,9,10]. Each previous study concentrated on identifying and quantifying the individual effects on fatigue life. However, a more convincing lifetime calculation at the design stage and the remaining useful lifetime assessments requires a more inclusive approach that embraces a few of the above-mentioned effects because those are involved simultaneously.
Two representative parameters describe the LCF characteristics: Plastic strain amplitude and plastic strain energy density. For example, the Coffin-Manson model [11] assumes a linear relationship between the plastic strain amplitude and fatigue life in the logarithmic coordinate and the Morrow model [12] relates a plastic strain energy density and fatigue life in the logarithmic coordinate. Subsequently, the strain rate effect on fatigue life was incorporated by developing the frequency-modified parameters in the frequency-modified Coffin-Manson model [13] and the frequency-modified energy model [14], respectively. The Coffin-Manson model and the Morrow energy model can predict well under the isothermal conditions, but they cannot explain the effect of strain rate on fatigue life. To consider the effect of strain rate on fatigue life, the frequency-modified Coffin-Manson model or the frequency-modified energy model should be used. Even though these two models can explain well the effects of strain rate and strain amplitude on fatigue life, they cannot account for the effect of temperature. They only represent how the material constants change with respect to the test temperatures. Therefore, it is better to improve and modify the existing models, including the Coffin-Manson model and the Morrow model mentioned above [11,12,13,14], to account for the temperature dependency of fatigue life.
In this study, type 316L stainless steel is selected to propose a phenomenological energy-based life prediction model incorporating strain rate and temperature effects. The material has been favored for power facilities or nuclear fusion reactors for its resistance at high temperatures. In this regard, tensile tests and strain-controlled LCF tests were conducted against various temperatures and strain rates. The temperatures ranges from room temperature (RT) to 650 °C, and the strain rate is varied from 1 × 10⁻⁵ to 1 × 10⁻² s−1 to investigate the influence of strain rate and temperature on the material behavior and to measure the mechanical properties. Subsequently, the capabilities and validity of the developed model are discussed.

2. Materials and Methods

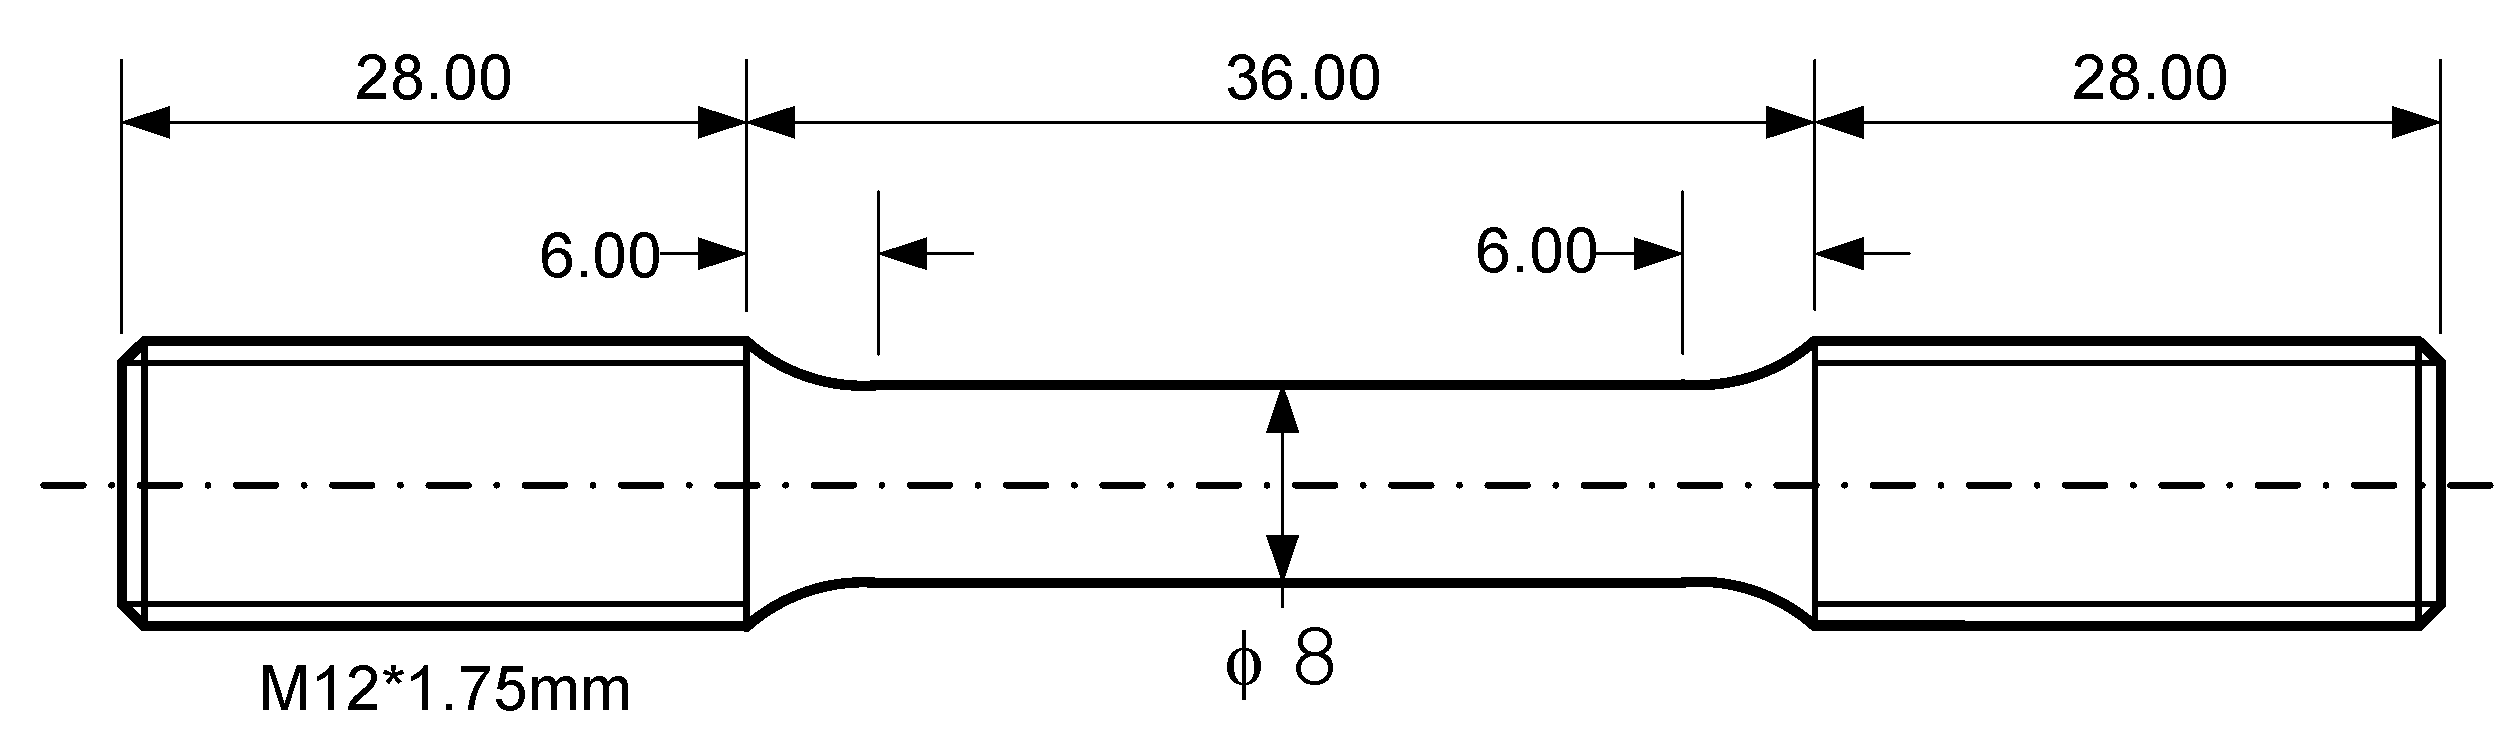
2.1. Material and Specimen

All specimens were made from an extruded 316L stainless steel bar of diameter 16 mm that was solution-treated at 1100 °C for 40 min and subsequently cold-drawn by 17% cold work (%CW). The chemical composition of the steel is shown in Table 1 and average grain size determined by linear intercept method was 53 μm. A type of specimen designed by ASTM code E606-92 [15] was employed for tensile tests and LCF tests as shown in Figure 1, and the specimen surface was polished along the longitudinal direction with emery paper up to 13 μm to remove surface defects.

2.2. Test Equipment

A closed-loop servo-hydraulic test system with a 5-ton capacity manufactured by MTS (Eden Prairie, MN, USA) was used to perform the tensile tests and LCF tests. A resistance type furnace that can control the ambient temperature with the variation of ±1 °C at steady state was used for temperature control. A specimen was fixed on the test machine using a hydraulic grip system. A high temperature extensometer manufactured by MTS (Model No.: 632-13F-20, guage length: 25 mm) was used to perform the strain control tests and the displacement signal, load signal, and strain signal were recorded for each cycle during the test.

2.3. Tesile Test

Tensile tests were performed in two different control manners: Displacement-control and strain-control. The tests were primarily performed using displacement-controlled tensile tests to obtain the mechanical properties depending on temperature. Additionally, strain-controlled tests, when further investigations were required, were subsequently performed to capture a particular mechanical response in the considered range of strain rate (1 × 10⁻³, 1 × 10⁻⁴ or 1 × 10⁻⁵ s−1).
In the displacement-control tensile tests, the actuator is displaced at 2 mm/min under isothermal condition ranging from RT to 650 °C. Prior to loading, the material to be tested was metallurgically stabilized by maintaining the specimen at a test temperature for an hour. From the results, tensile properties such as E, σy, σu, %EL (percent elongation) were extracted.
For the strain-controlled tensile tests, specimens were prepared similarly as in the displacement-control test. Subsequently, they were stretched with a strain rate controlled by an extensometer. Because the extensometer used in the tests has a limited travel length with −5% ~ +10%, tensile tests using strain control were stopped at 5% strain value and stress relaxation tests were proceeded by maintaining this strain value.

2.4. LCF Test

In order to investigate the effects of temperature and strain amplitude on fatigue life, LCF tests were performed using strain control. All tests were performed in air under a fully reversed total strain control mode employing a triangular waveform. A specimen was maintained at the test temperature for an hour before the fatigue test started while unloaded.
First, extensive fatigue tests were performed to investigate the fatigue characteristics over a wide range of temperature, from RT to 650 °C. A fully reversed strain cycle using a strain rate of 1×10⁻³ s−1 was imposed under a carefully controlled temperature environment, and the considered strain amplitudes were 0.3%, 0.4%, 0.5%, 0.6%, 0.7%, 0.8% to construct a fatigue life curve for a given temperature. Likewise, the LCF tests were repeated to obtain the fatigue characteristics at other temperatures. Next, investigations to observe the effect of strain rate on fatigue life were performed. Here, the strain rates were varied with a fixed strain amplitude of 0.5%.
In this study, the fatigue life was defined as the 70% load drop point of a stabilized load amplitude at Nf/2 cycles because a few cycles are required from the 70% load drop point to reach the final failure. The plastic strain amplitude, Δεp/2 was determined from a stress-strain hysteresis loop as specified in BS 7270 (or ISO/DIS) [16], which is defined as the distance between the intersections with the strain axis at the stress-strain hysteresis loop. For each test condition, two to four specimens were used on account of inherent scatter. The fatigue life for each specimen was recorded and the average value was regarded as the fatigue life.

3. Results and Discussion

3.1. Tensile Test Result

3.1.1. Test by Displacement Control

The mechanical properties of type 316L stainless steel were obtained from tensile tests using the displacement control of 2 mm/min at each test temperature. The elastic modulus was determined by measuring the slope of stress-strain curve during unloading in the elastic region and the yield stress was done by the 0.2% offset method.
The mechanical properties of type 316L stainless steel are summarized in Table 2. In Figure 2, the material strength (σy, σu) against temperature is plotted, and the ductility change is superimposed to clarify the effect of temperature. As expected, the material strengths and ductility are affected by temperature. The remarkable decrease in strength is observed in the temperature range between RT and 300 °C (16% and 25% decrease in σy and σu, respectively) and between 550 and 650 °C (17% decrease in both σy and σu). However, it appears that the temperature effect is not pronounced between 300 and 550 °C. Instead, the material strength at 400 °C is slightly greater than that at 300 °C. Likewise, the material ductility does not change significantly between 300 and 550 °C. However, it decreased significantly between RT and 200 °C and exhibits a minimum value at approximately 400 °C and increases when temperature exceeds 550 °C.

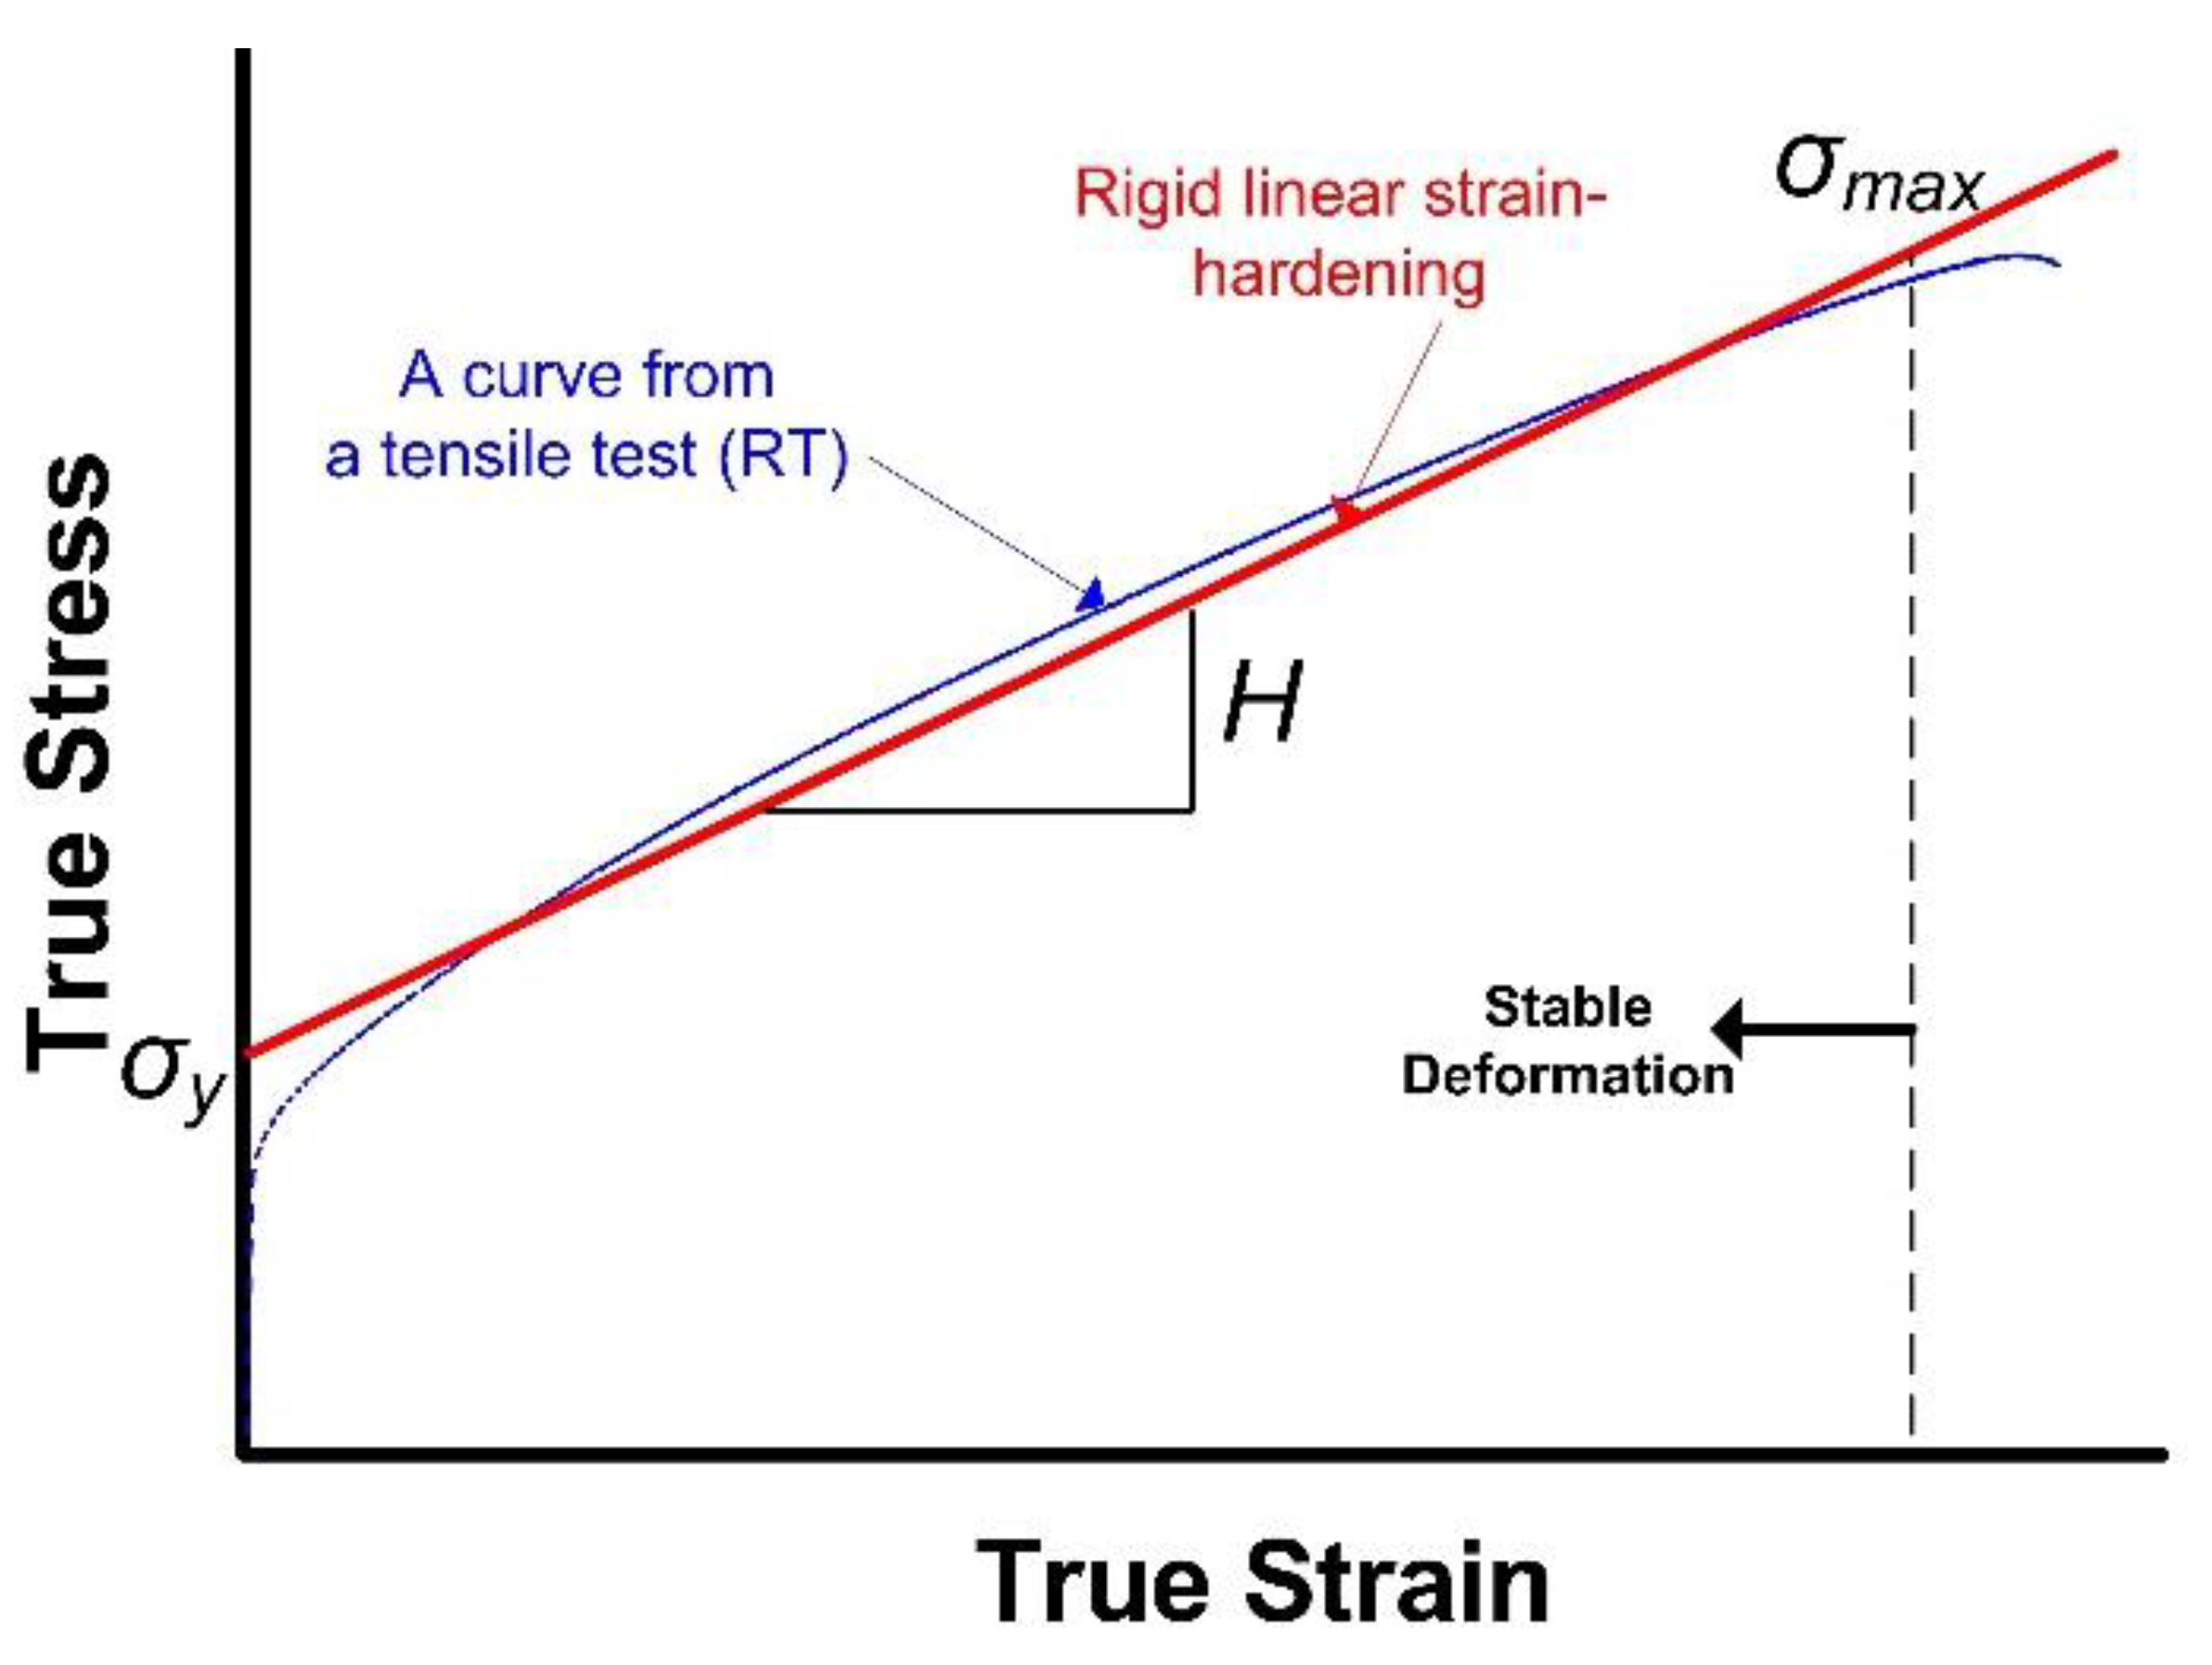
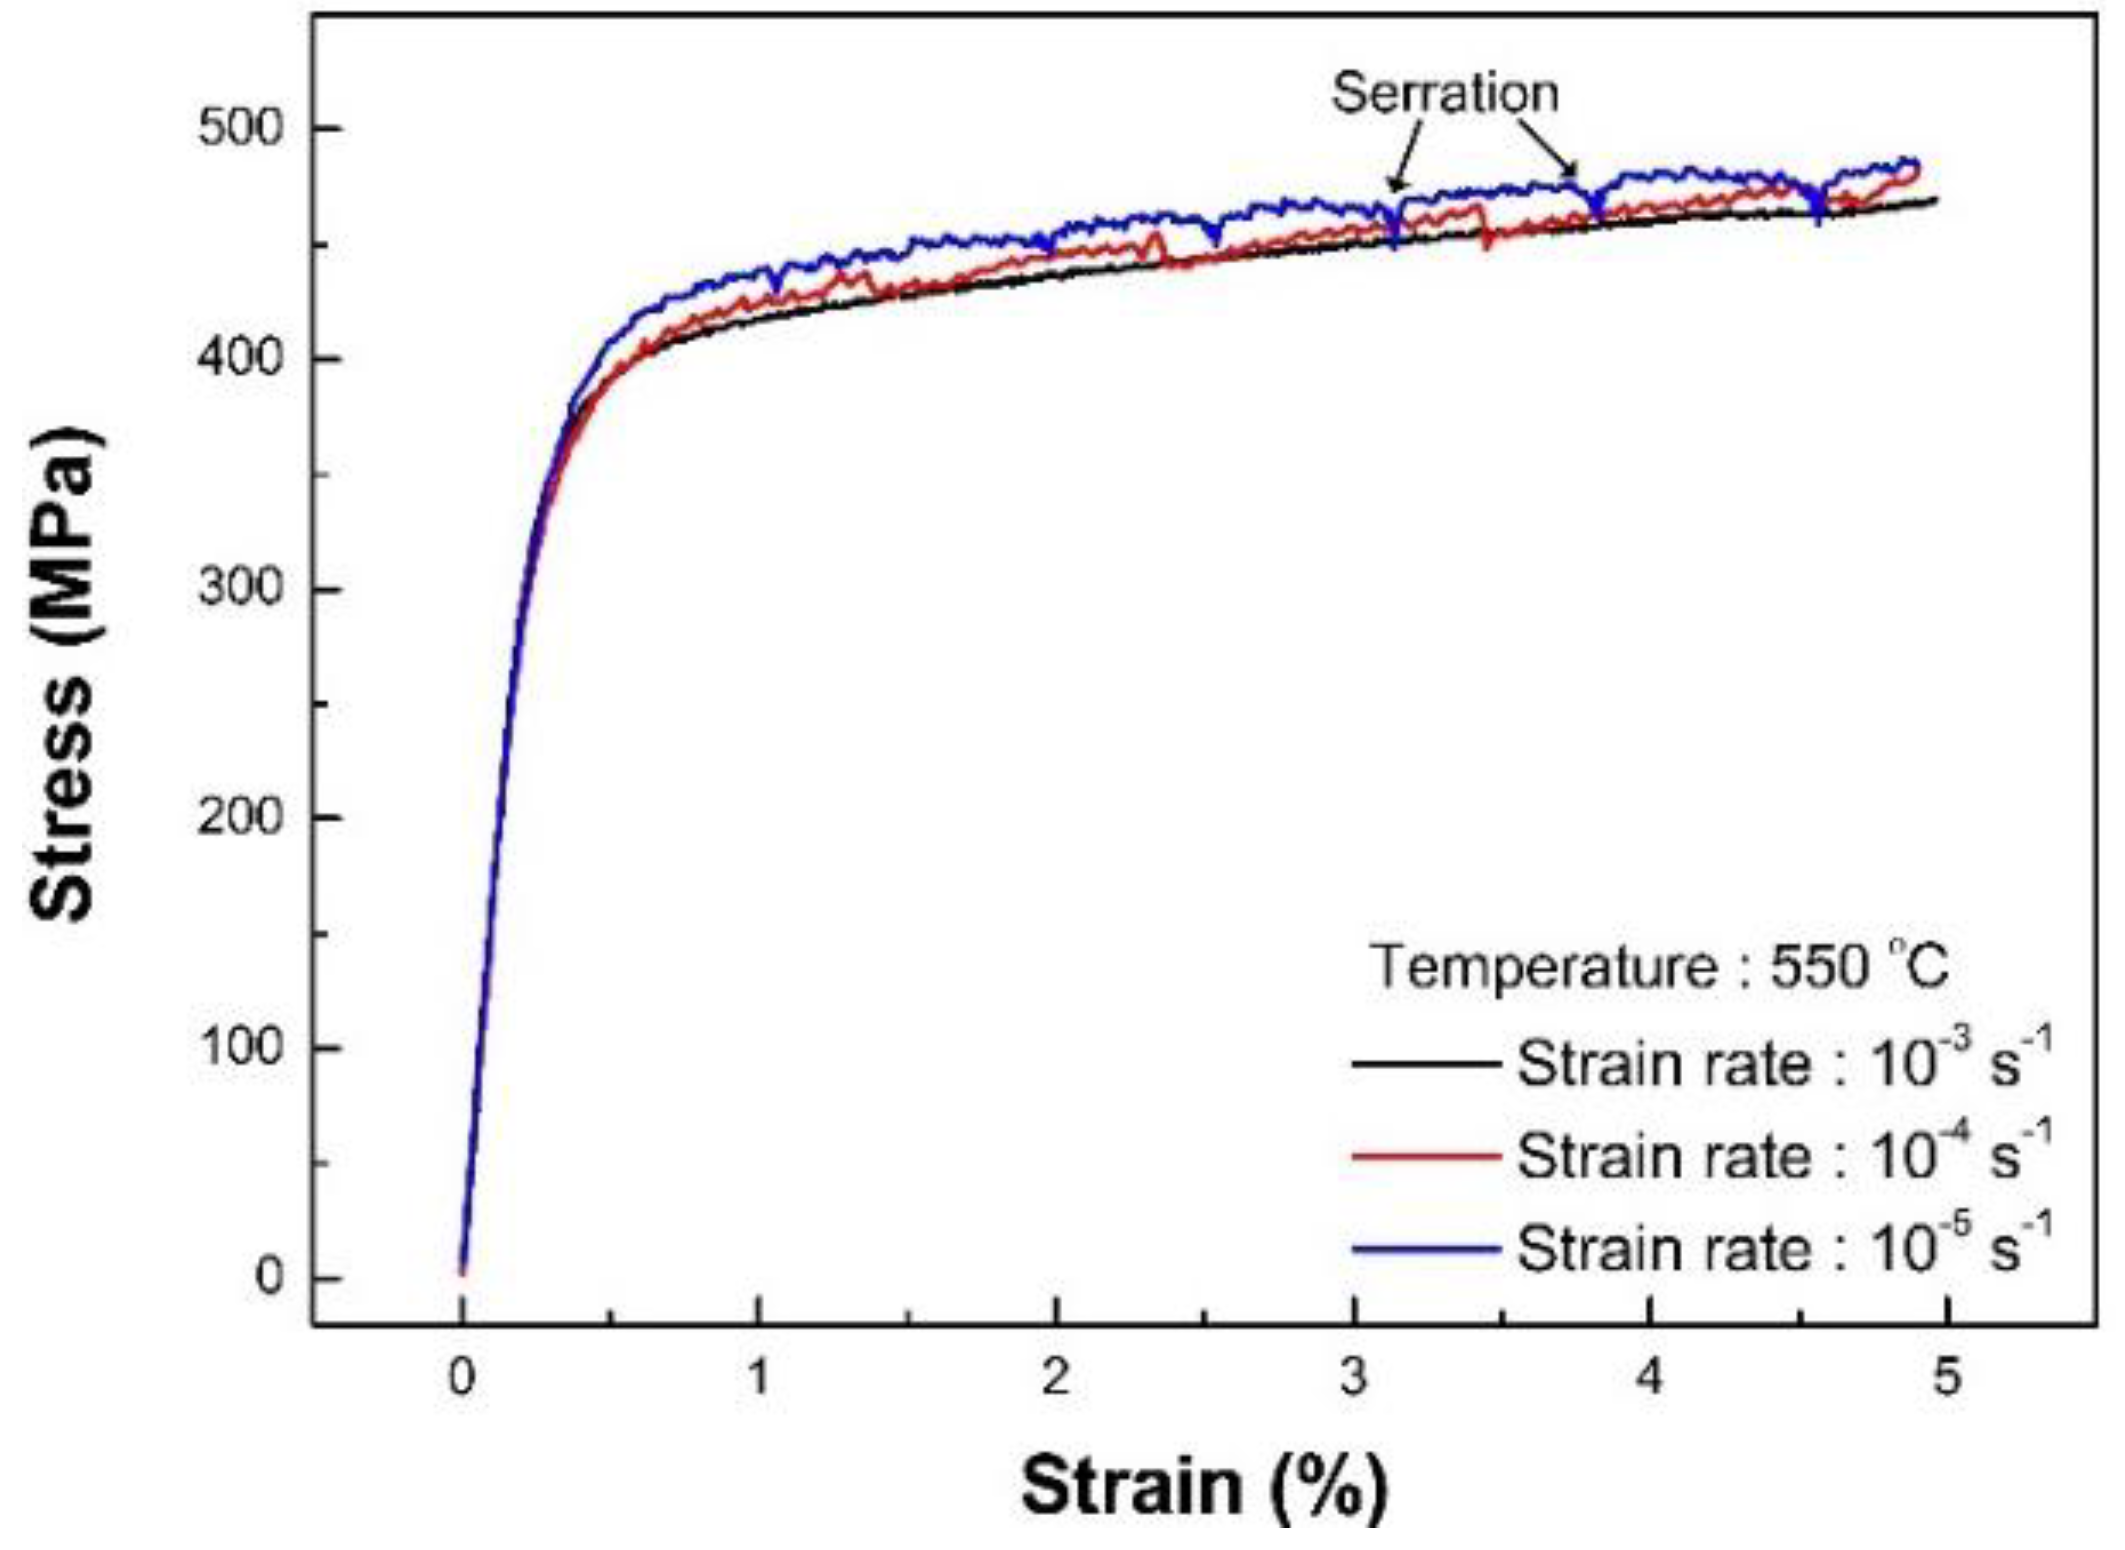
3.1.2. Test by Strain Control

Strain-controlled tensile test data were provided up to a strain of 5% because the tensile test was deliberately halted, as mentioned in Section 2. The tensile test results at 550 °C using strain rates of 1 × 10⁻³, 1 × 10⁻⁴ and 1 × 10⁻⁵ s−1 are shown in Figure 3. It is noteworthy that typical engineering metallic materials are generally strengthened at a higher rate of loading and is called “strain-rate hardening” [17]. However, interesting facts were observed in the strain-controlled tensile tests of type 316L stainless steel. In contrast with typical engineering metals, type 316L stainless steel hardens at lower applied strain rates at 550 °C and is known as “a negative strain rate response” [18]. In addition, at small strain rates such as 10−4 and 10−5 s−1, the tensile curve is serrated during plastic deformation and is known as “the plastic serration phenomena.” Therefore, the strain rate affected the material behavior at high temperature and it is speculated that complexities may occur at temperatures from 300 to 550 °C.
According to previous studies [18,19], such abnormal characteristics in the deformation behavior and mechanical properties of type 316L stainless steel at 300–550 °C arise from the interaction between mobile dislocations and solute atoms during plastic deformation, that is, dynamic strain aging (DSA). DSA is known to impair the fatigue property by way of multiple crack initiation, which comes from the DSA-induced localization of deformation, and rapid crack growth due to the DSA-induced hardening.

3.2. LCF Test Result

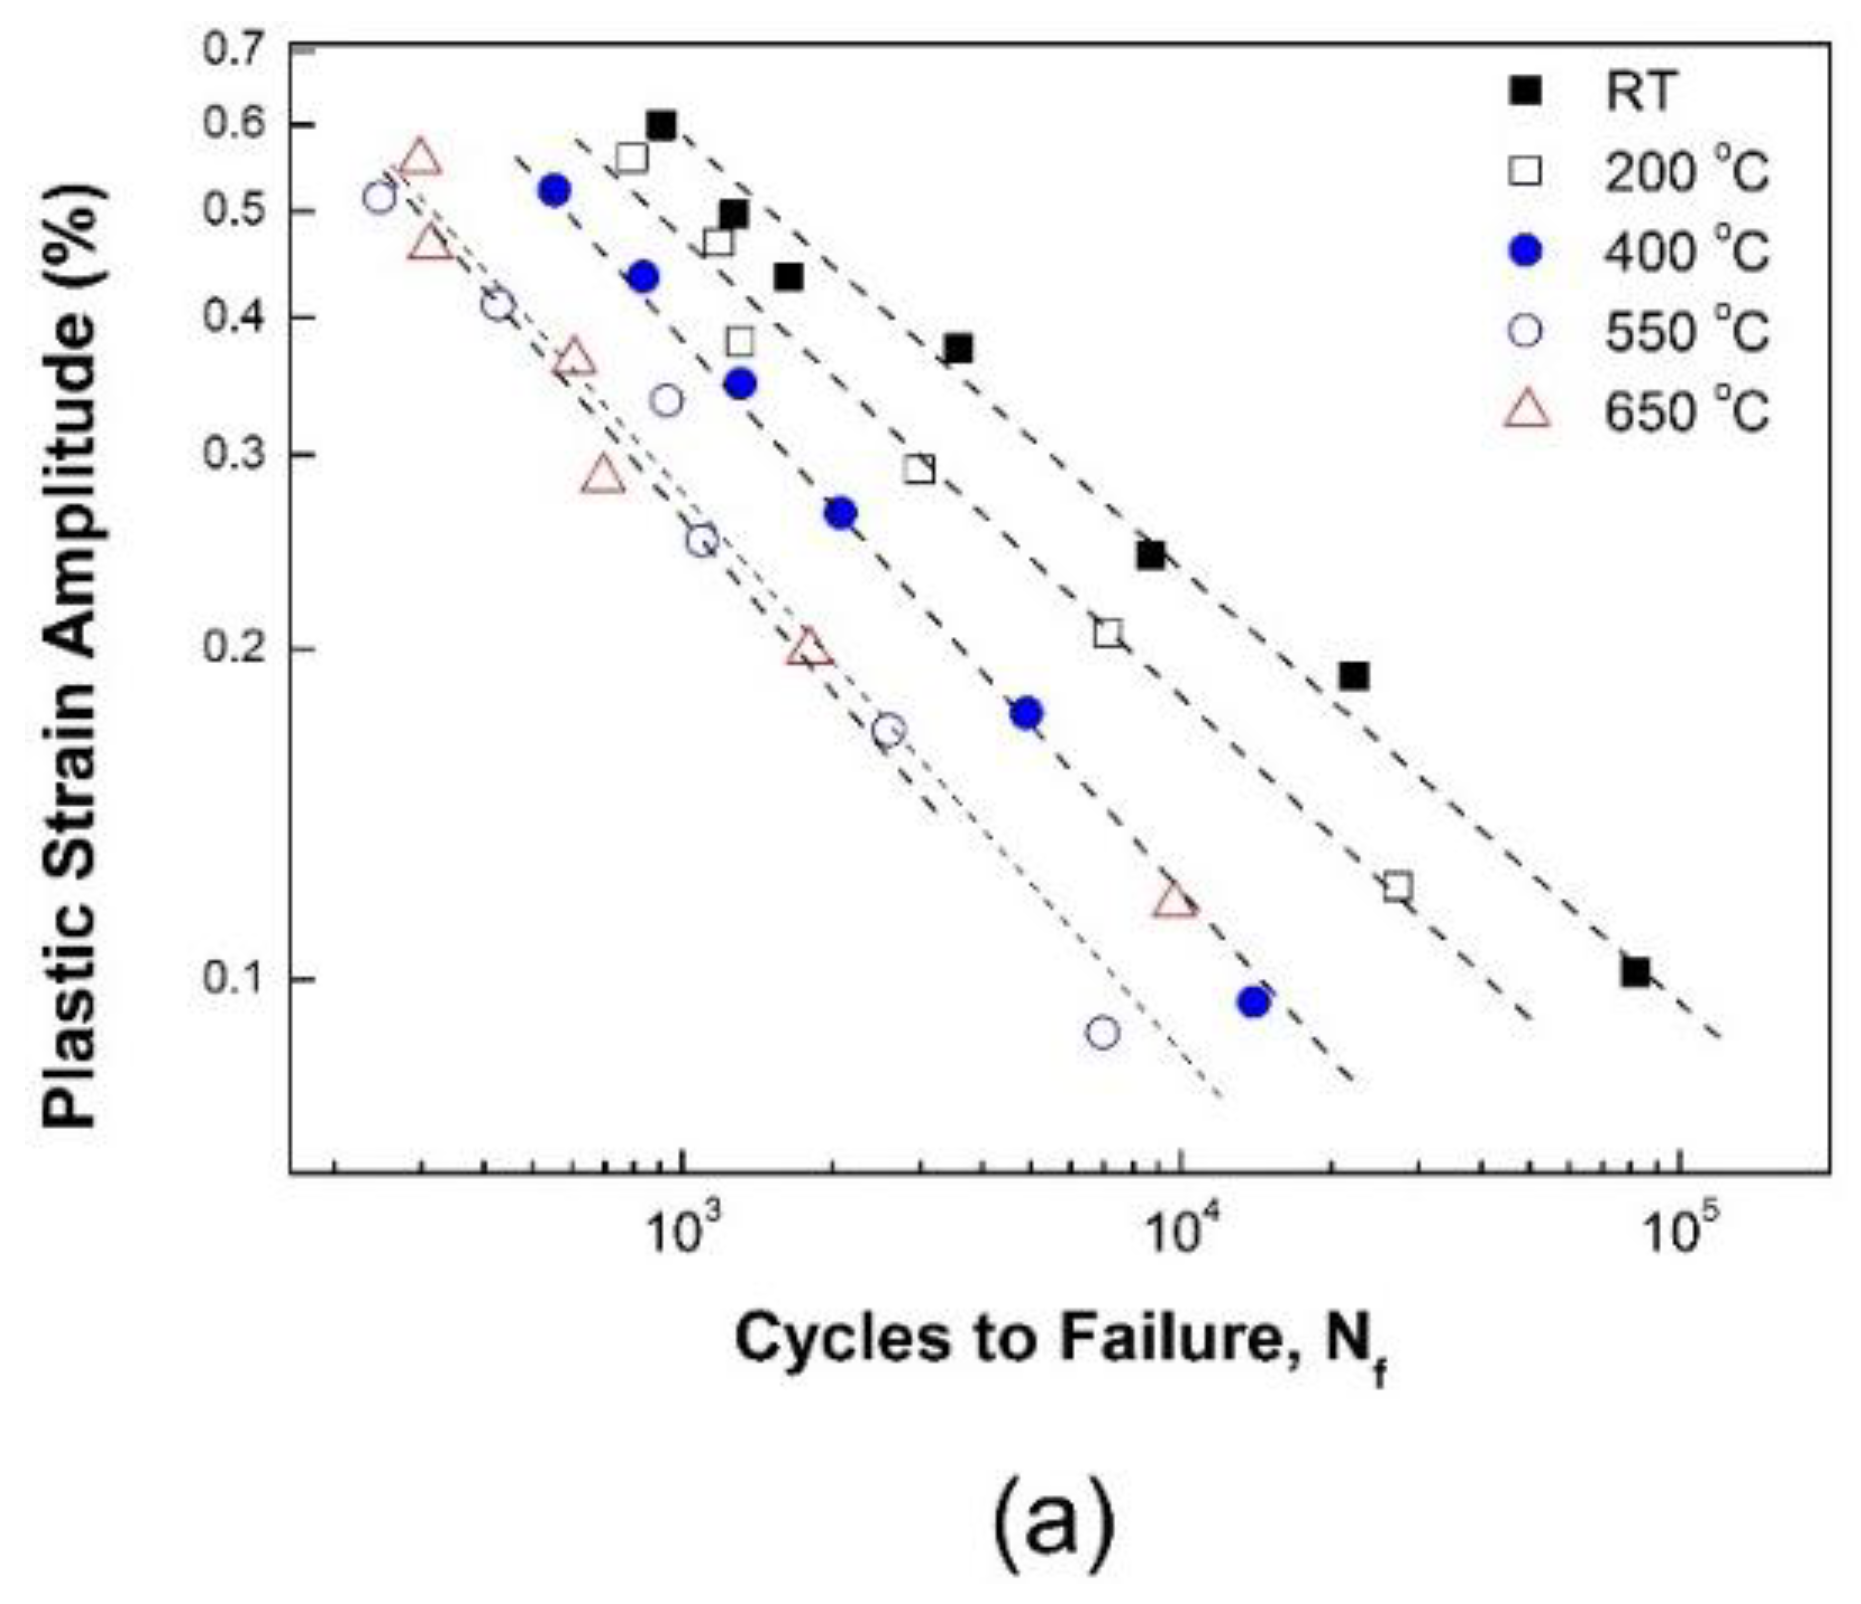
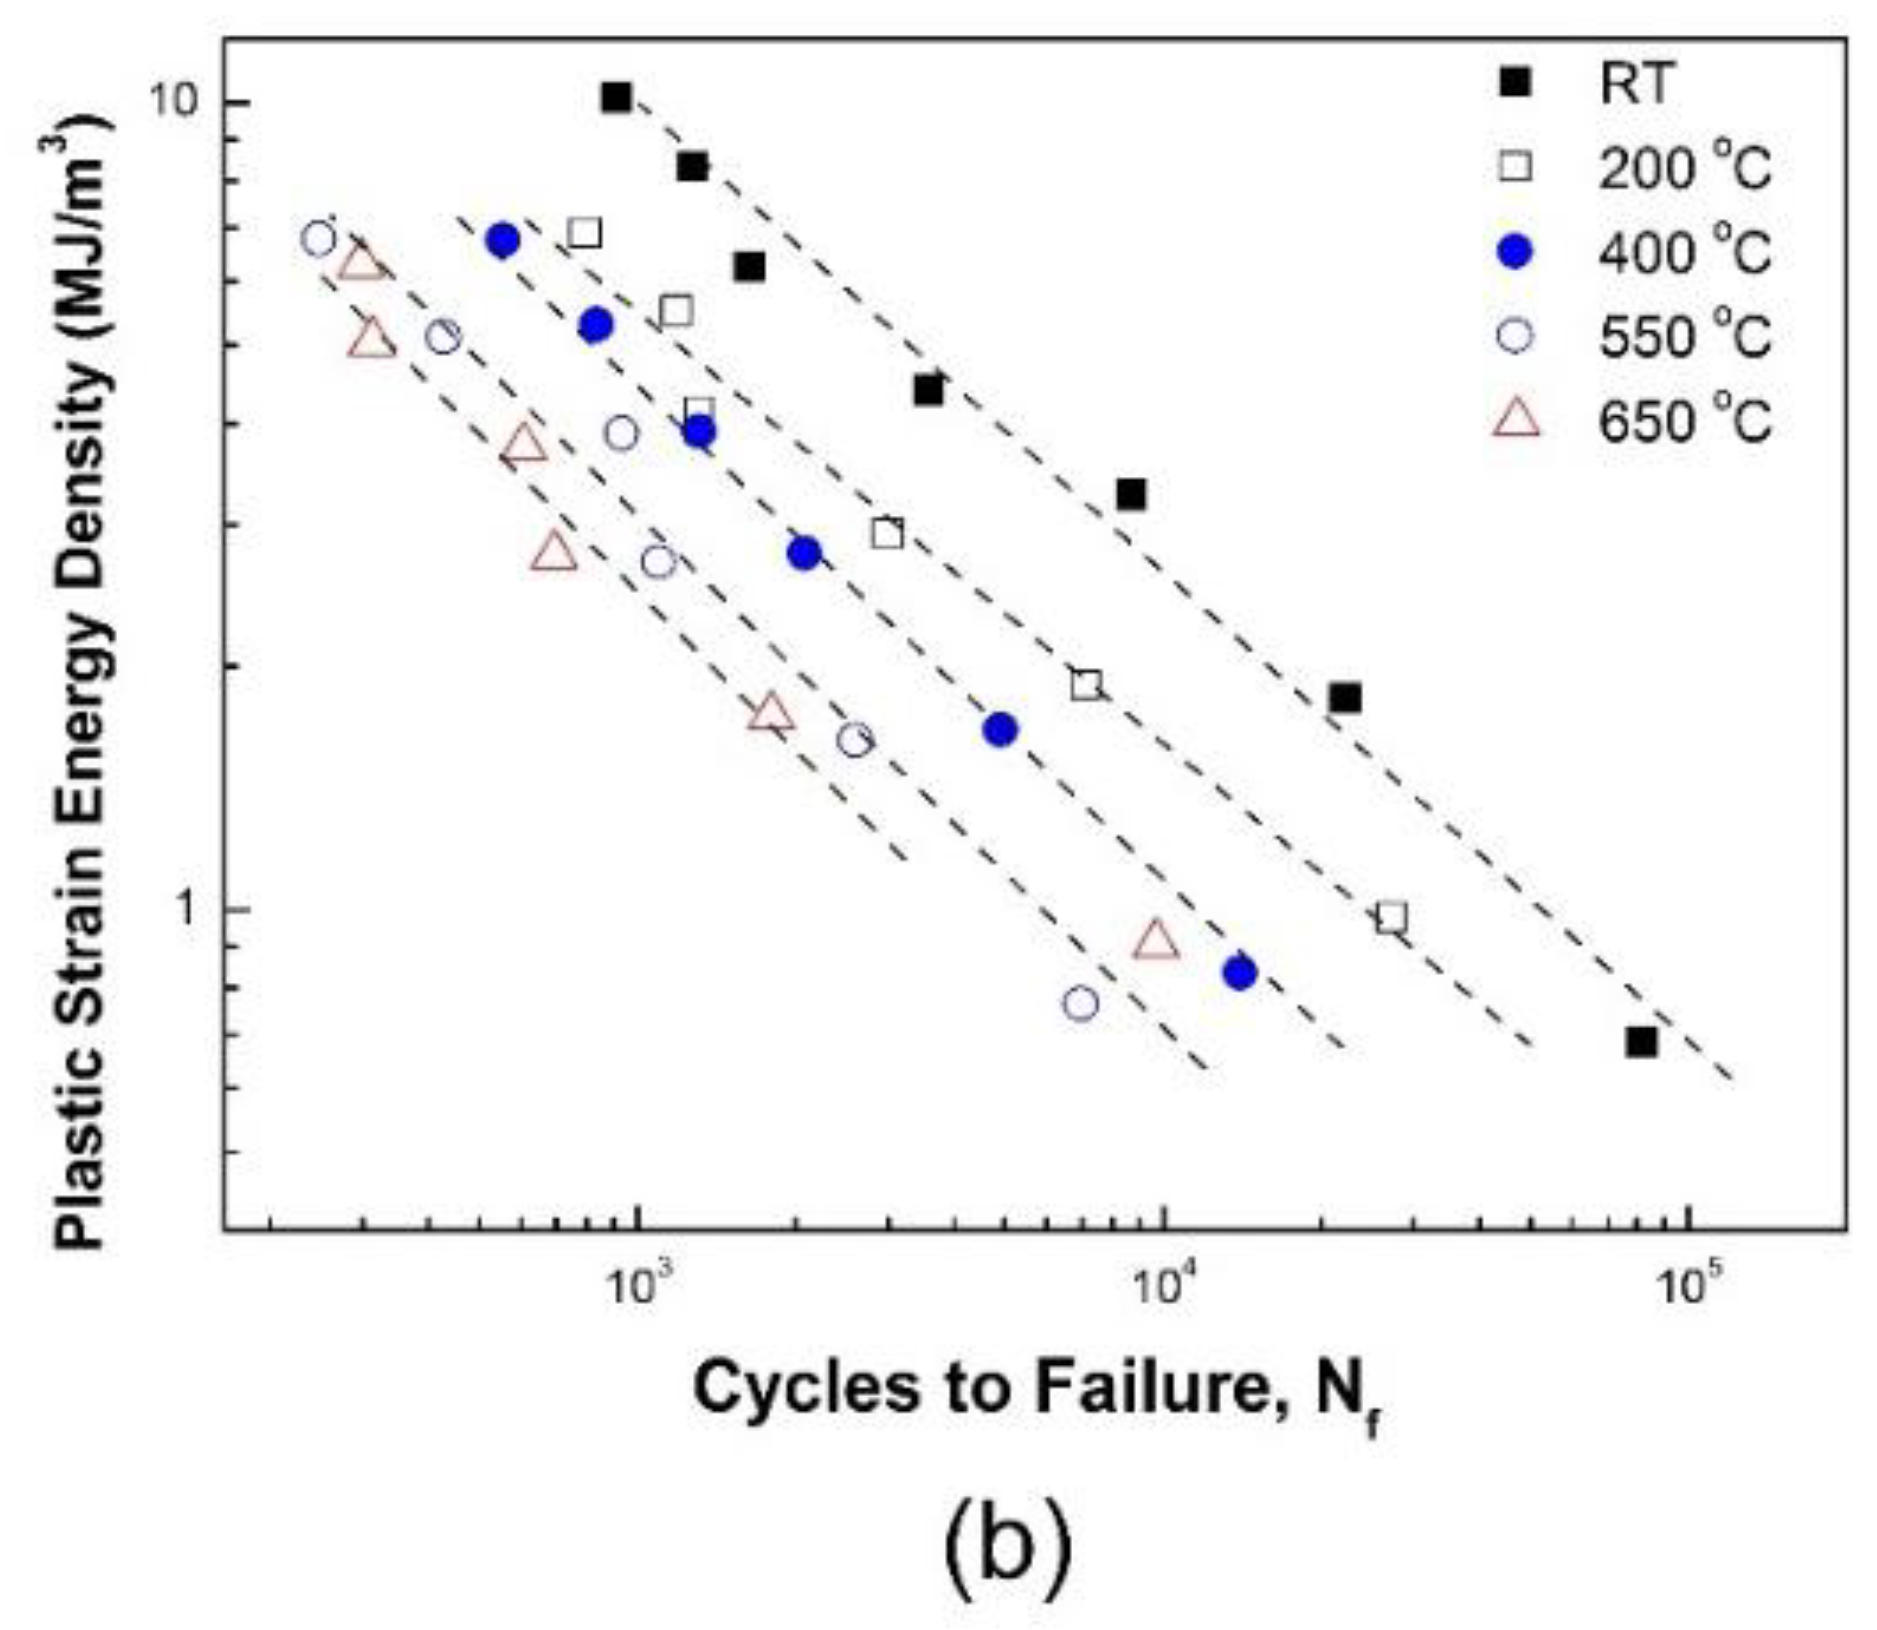
3.2.1. Effect of Temperature on Fatigue Life

LCF tests using a strain control of 1 × 10⁻³ s−1 were carried out for strain amplitudes of 0.3% to 0.8% at RT, 200, 400, 550, and 650 °C. It has long been known that the plastic strain amplitude or dissipated energy during a stabilized cycle can be a representative parameter to characterize LCF life.
Figure 4 presents the plastic strain amplitude and plastic strain energy density at a stabilized cycle. Despite the total strain-controlled tests, the tests above are associated with temperature. Thus, tests were performed to determine whether those parameters can be applied correctly regardless of the operating temperature.
First, the relationship between plastic strain amplitude and fatigue life is shown in Figure 5a. The Coffin-Manson model, in which damage accumulates as the plastic strain cycle is repeated, predicts the fatigue life Nf in terms of the plastic strain amplitude Δεp/2, as shown in Equation (1):
N f m C ( Δ ε P / 2 ) = C C
where mC and CC are the fatigue ductility exponent and fatigue ductility coefficient, respectively. As shown in Figure 5a, fatigue life exhibits a linear relationship with the plastic strain amplitude in the logarithmic coordinate at each temperature. The Coffin-Manson model is a good prediction model at each temperature condition, presumably, despite the occurrence of microstructural changes with increased temperature.
Next, the fatigue lives were plotted using the plastic strain energy density in Figure 5b. In this case, the Morrow model was examined, and the model predicts the fatigue life Nf in terms of the plastic strain energy density ΔWp, as shown in Equation (2):
N f m E Δ W P = C E
Here, mE and CE are material constants determined empirically. The plastic strain energy density was determined from the area enclosed by the stabilized stress-strain hysteresis loop at Nf/2. As shown in Figure 5b, the plastic strain energy density and fatigue life exhibit a linear relationship in the logarithmic coordinate for each temperature. Likewise, the Morrow model is as a good prediction model for isothermal conditions as is the Coffin-Manson model.
For simple calculations, the plastic strain energy density of a Masing material is given by
Δ W P = 1 n 1 + n Δ σ Δ ε P ,
where n and Δσ are the cyclic strain hardening exponent in cyclic stress-strain equation and the stress range determined from the stabilized stress-strain hysteresis loop at Nf/2, respectively. On the other hand, the plastic strain energy density of a non-Masing material can be obtained from the cyclic and master curve equations:
Δ W P = 1 n * 1 + n * Δ σ × Δ ε P + 2 n * 1 + n * δ σ 0 × Δ ε P ,
Here, n* is the strain-hardening exponent of the master curve and δσ0 is the increase in the proportional stress limit in the master and cyclic curves [20].
Both life prediction models, Coffin-Manson and Morrow, are excellent life prediction models for a given temperature condition; however, they cannot be applied irrespective of the temperature. The material constants, mC, CC, mE, and CE, are summarized in Table 3.

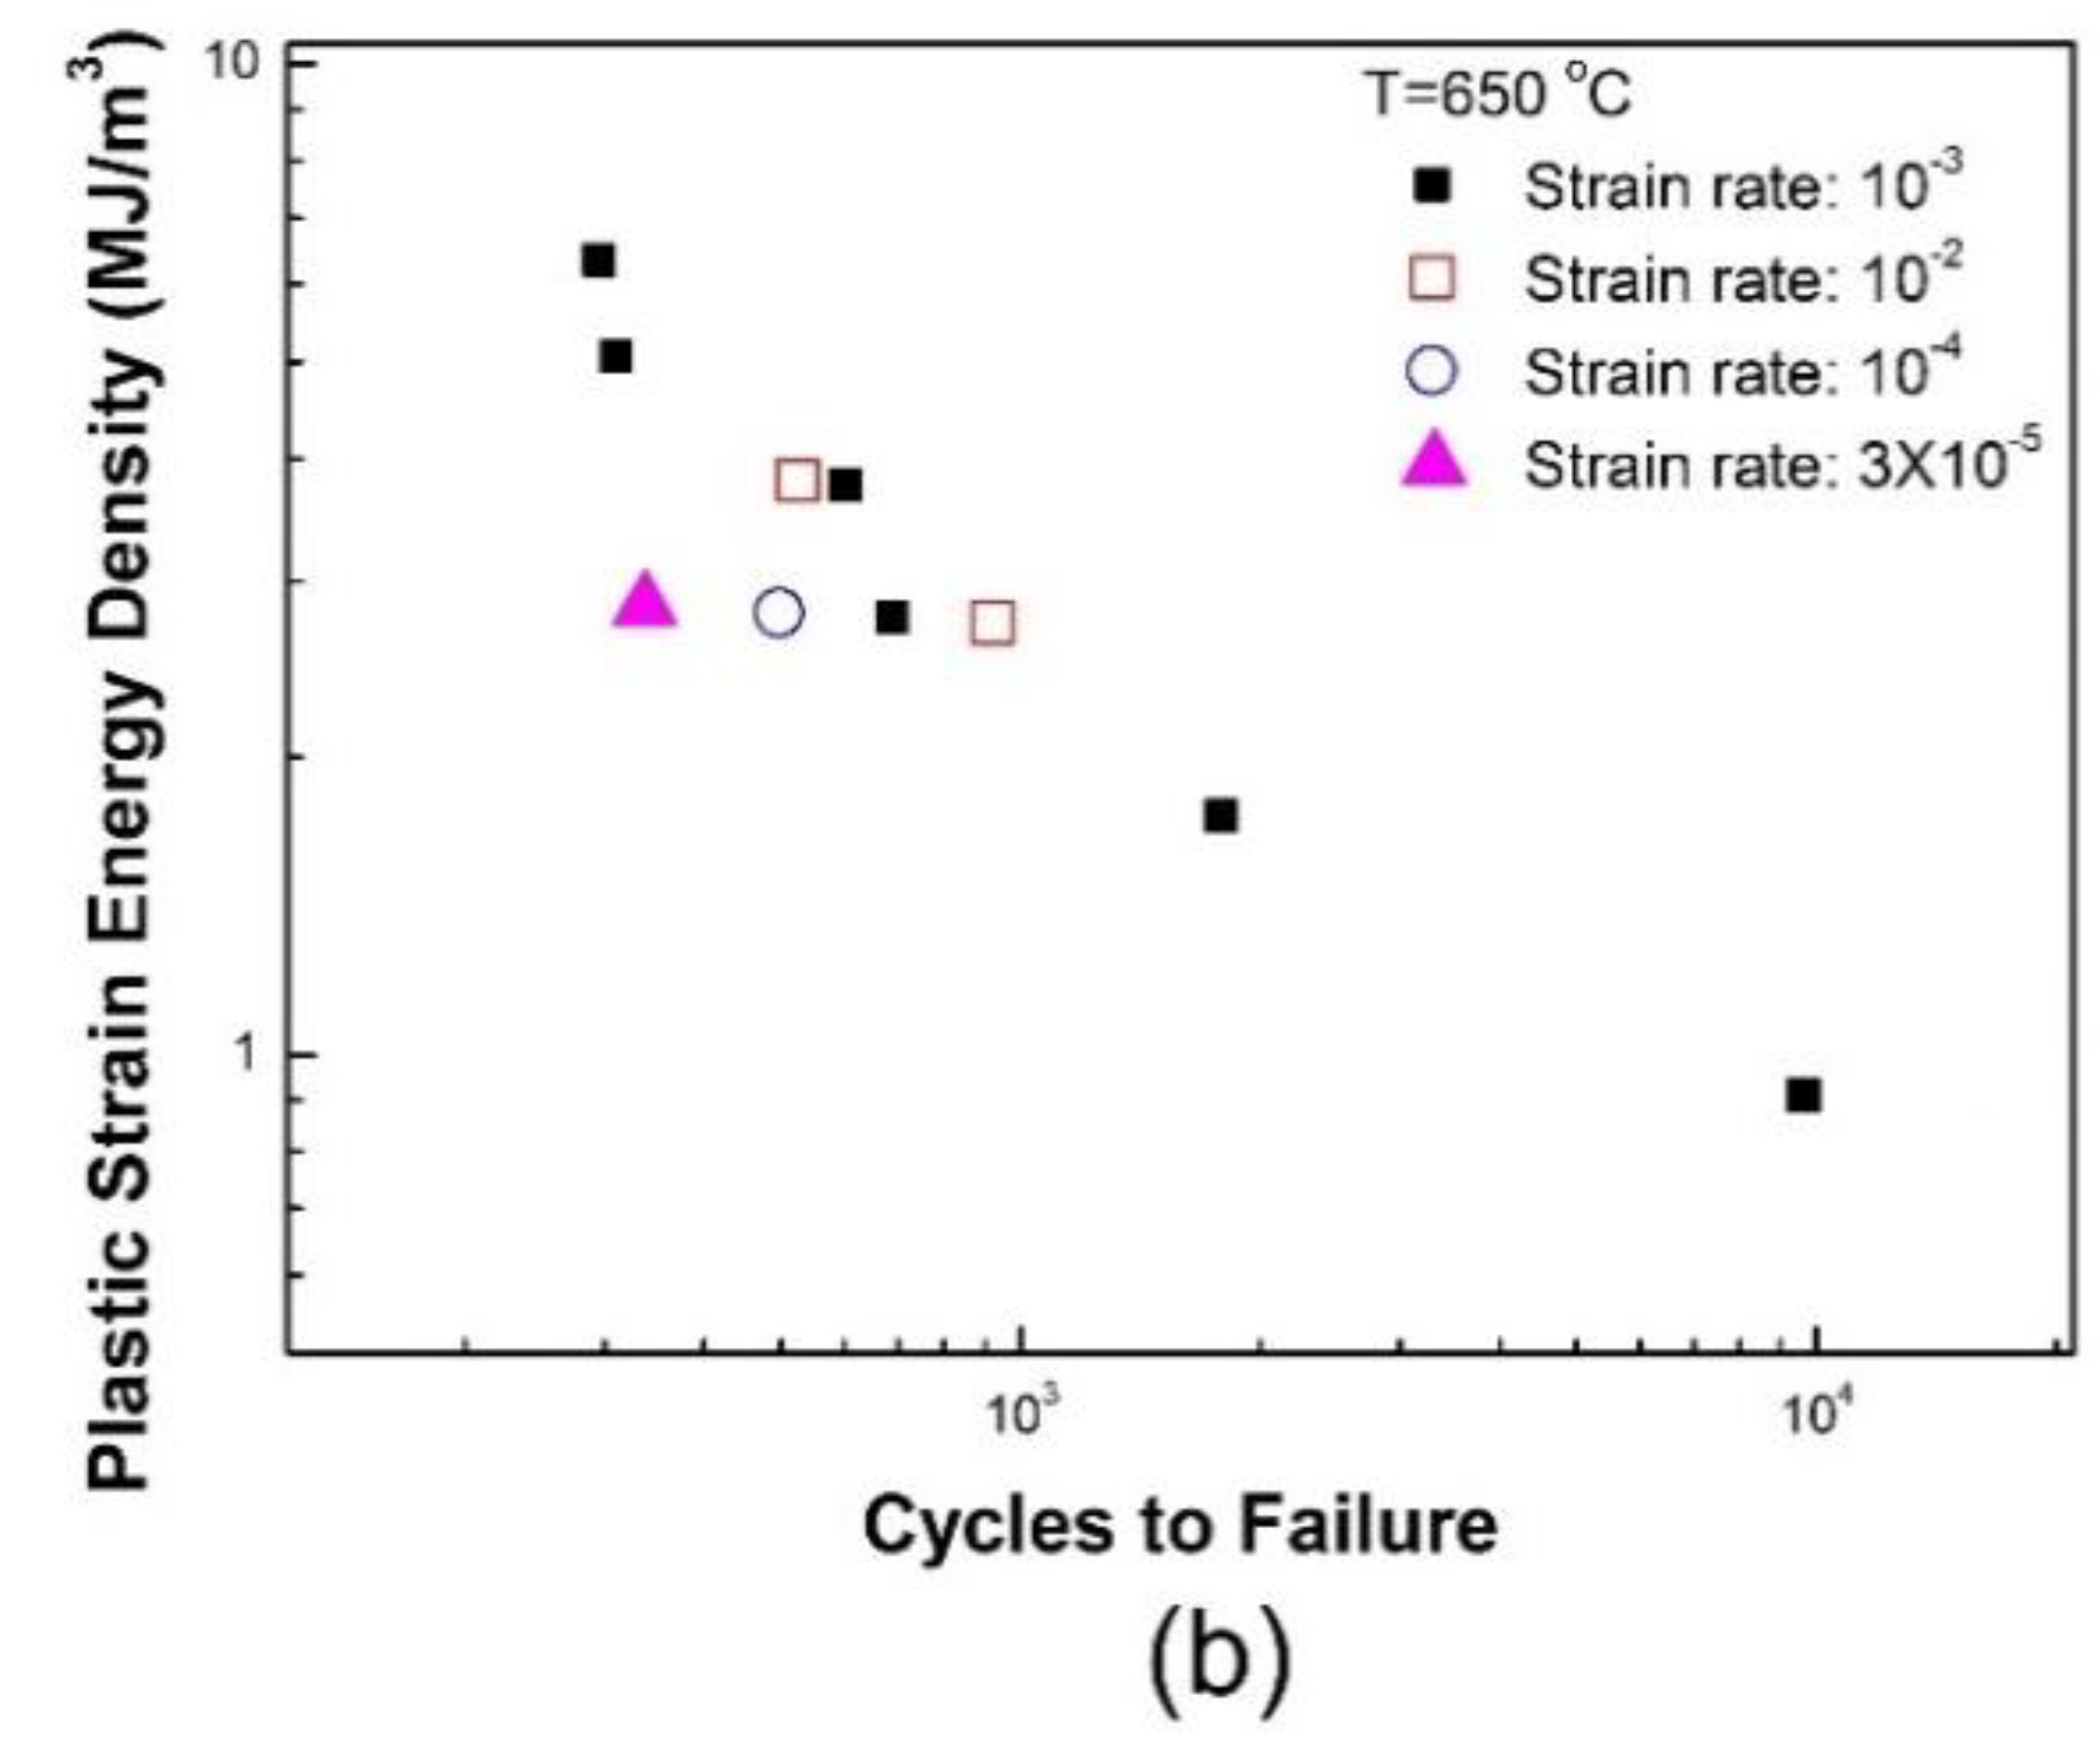
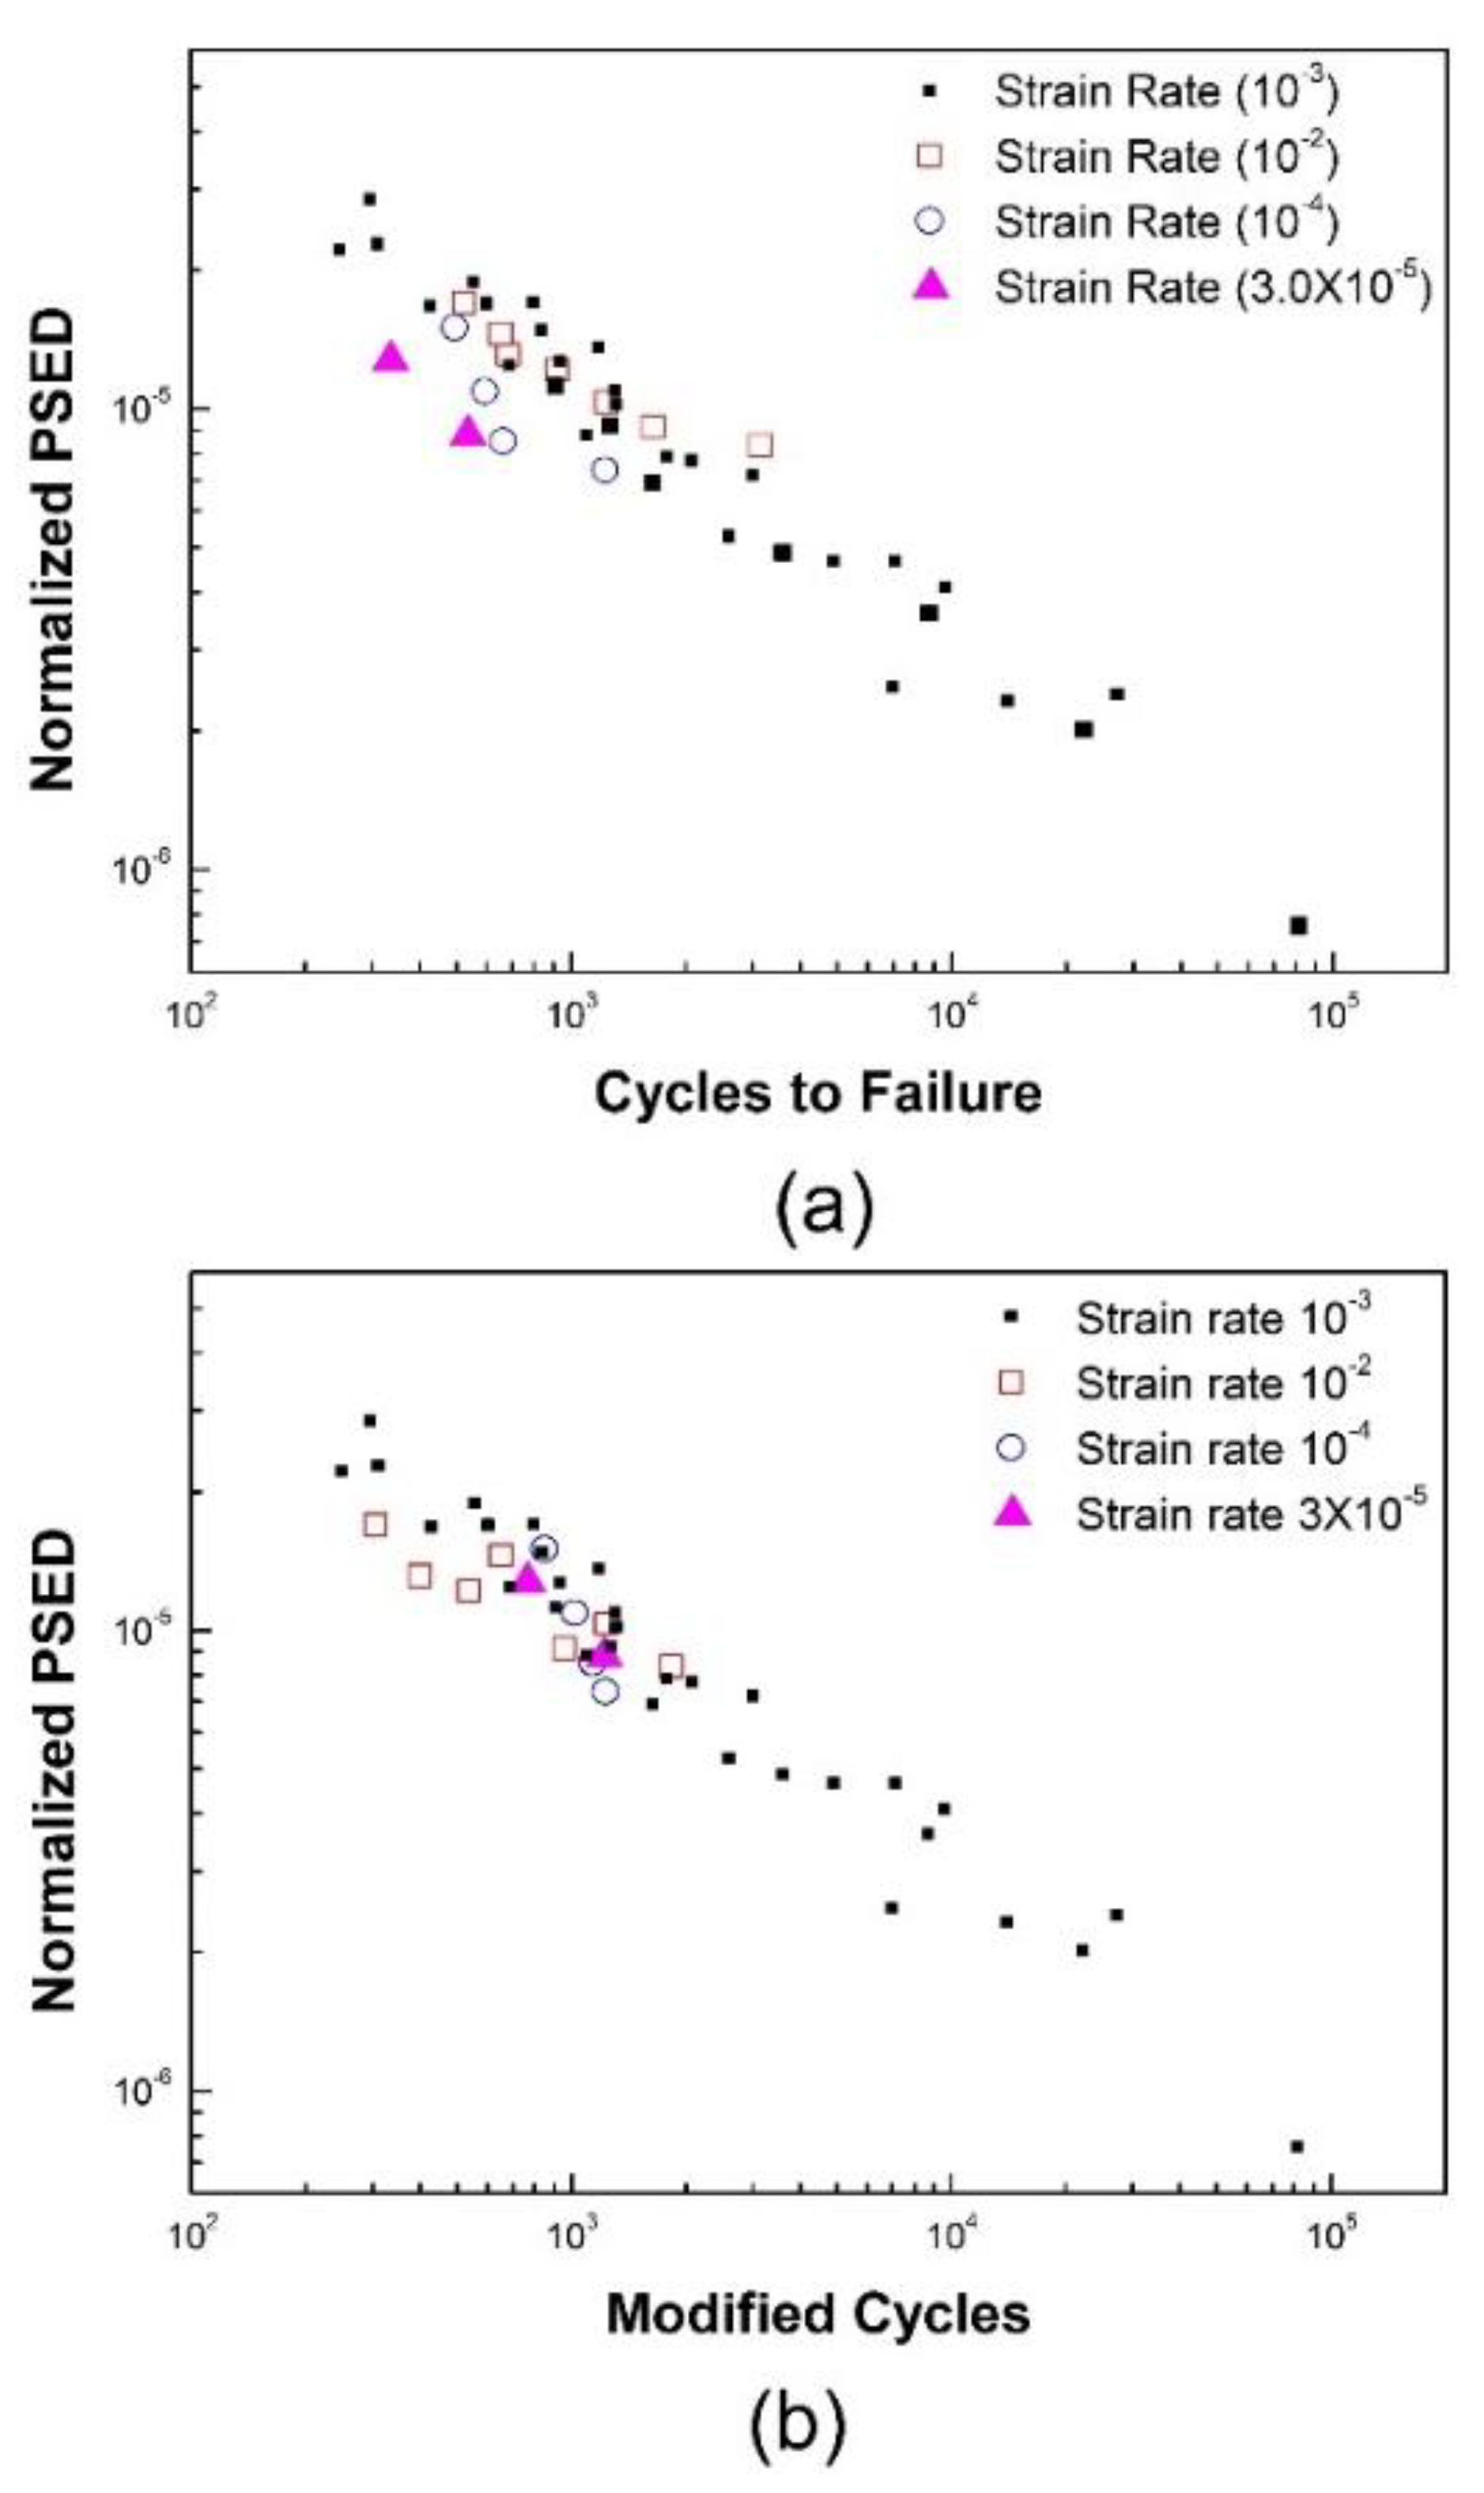
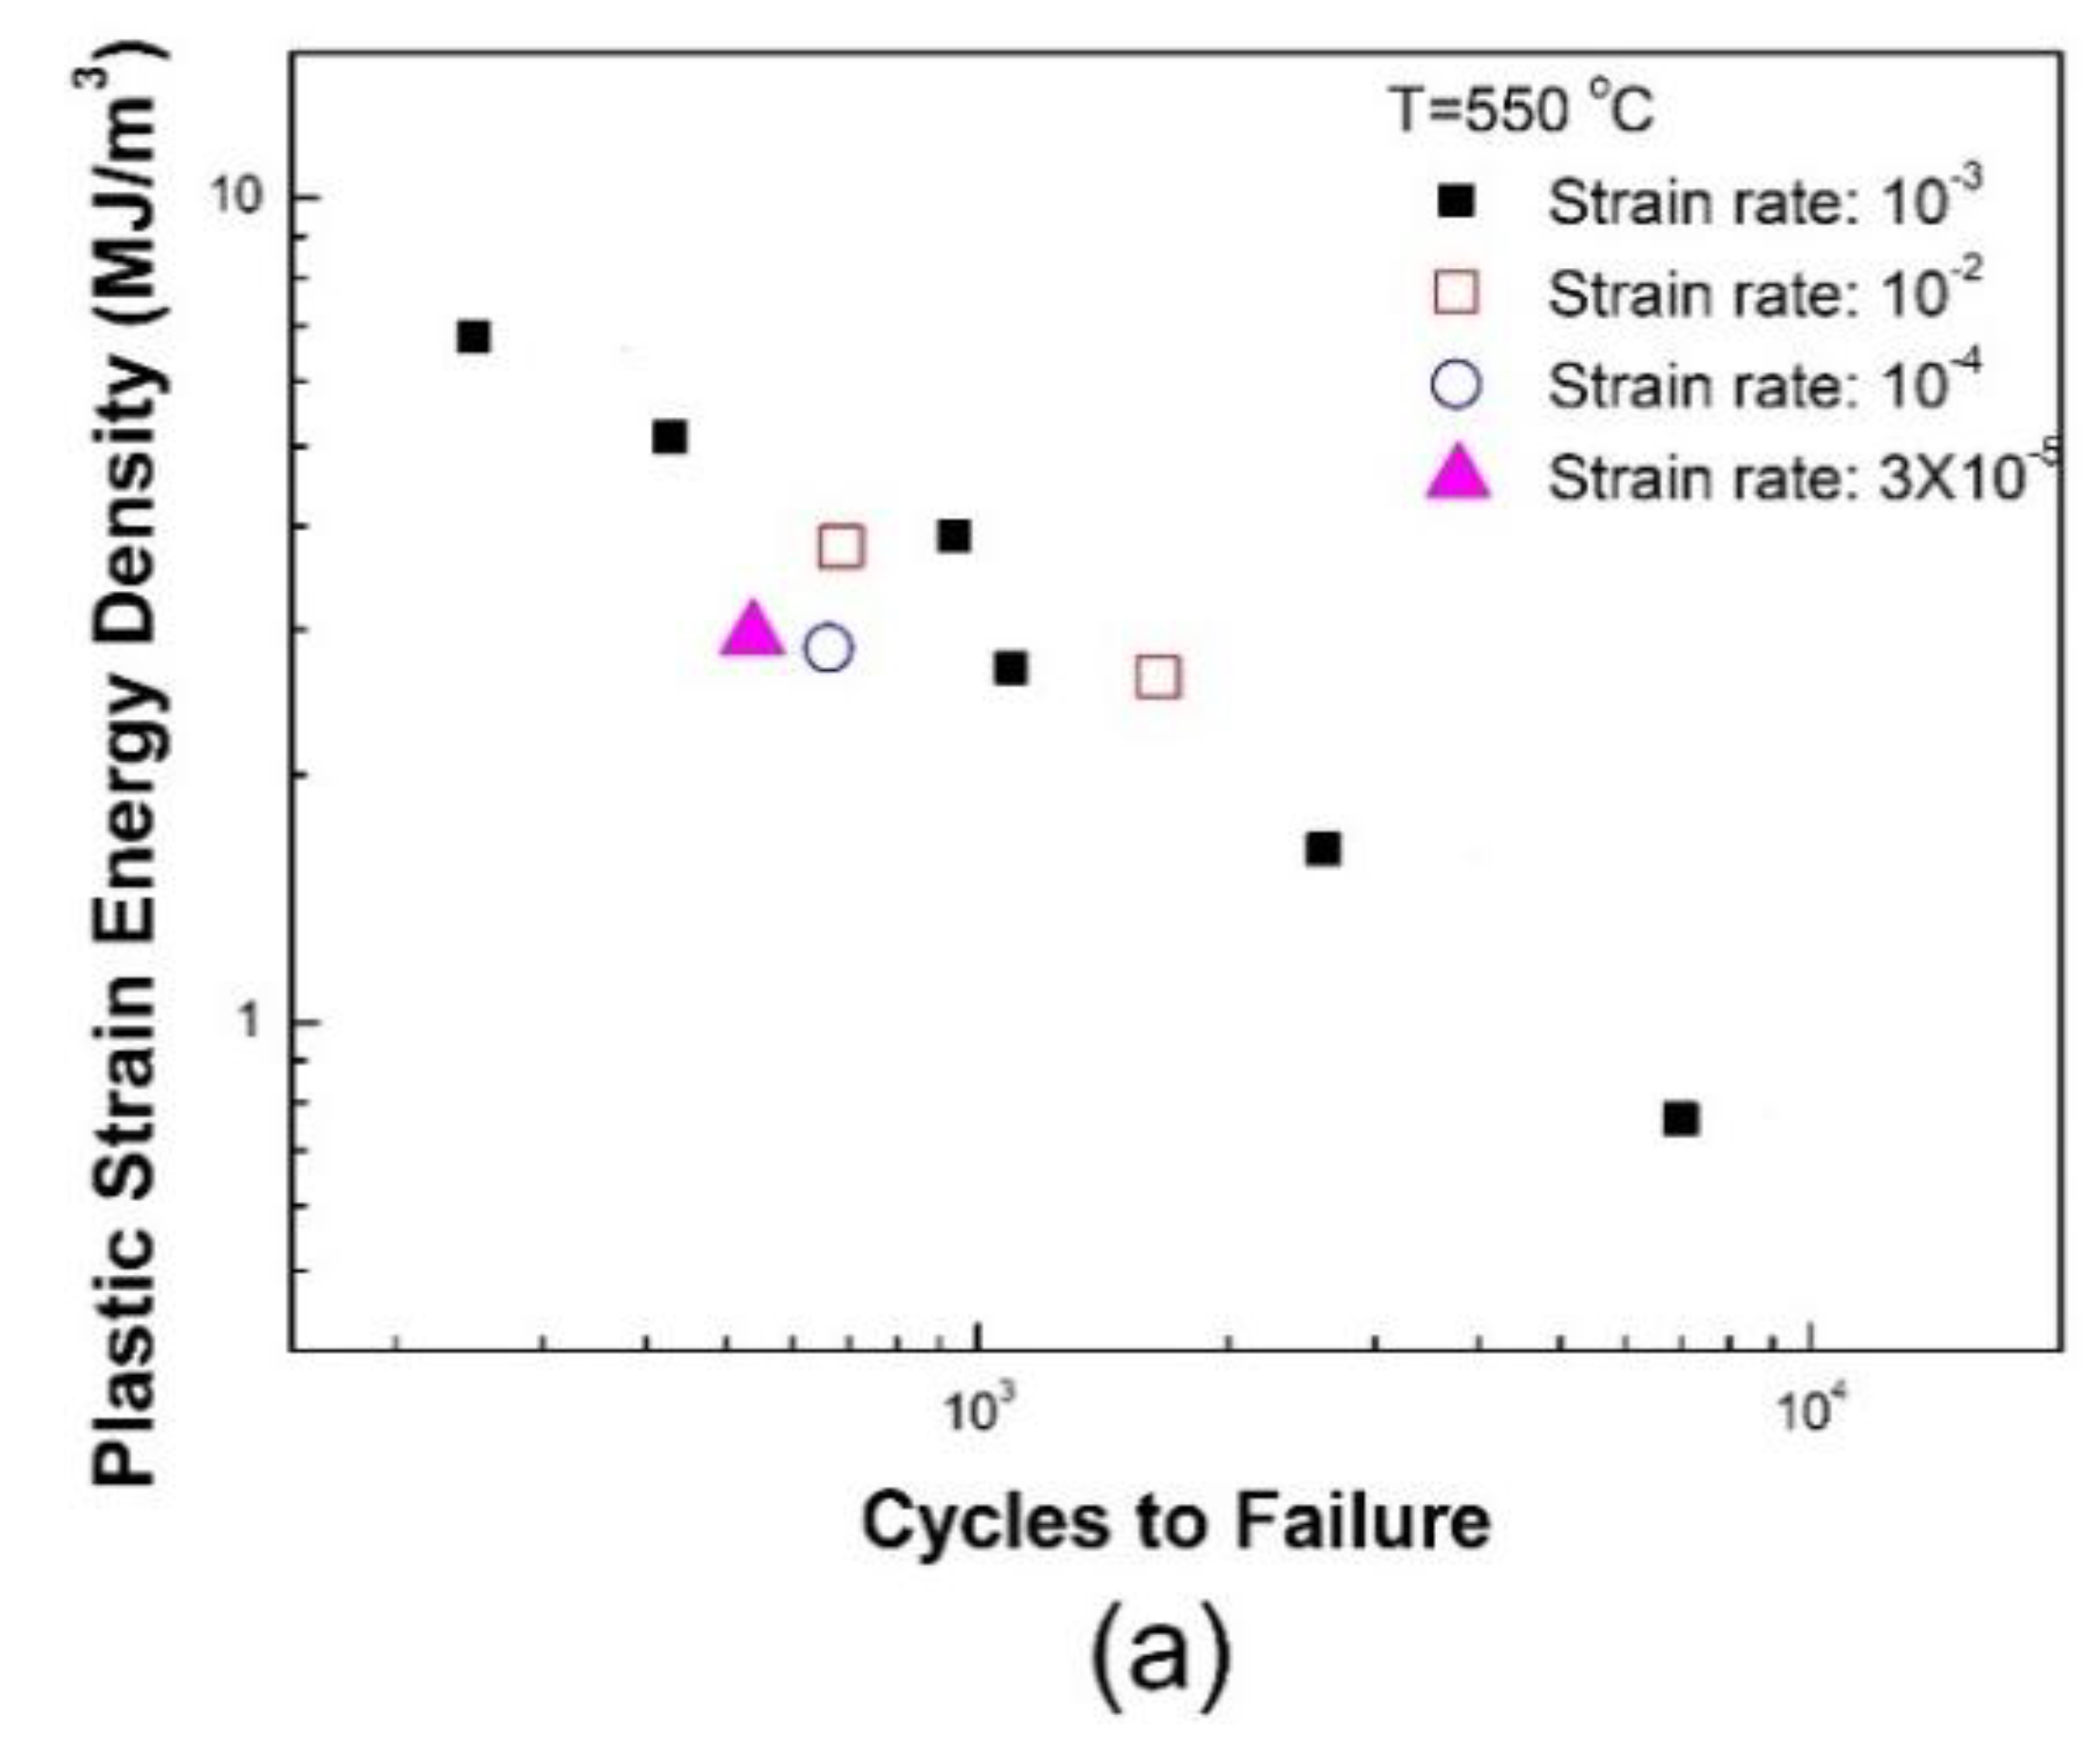
3.2.2. Effect of Strain Rate on Fatigue Life

The effect of strain rate on material behavior and fatigue life is negligible at RT, but it is not negligible as temperature increases. To investigate the effect of strain rate on fatigue life, LCF tests were conducted with diverse strain rates of 1 × 10⁻², 1 × 10⁻³, 1 × 10⁻⁴ and 3 × 10⁻⁵ s−1. In those tests, one total strain amplitude of 0.5% was applied and three test temperature conditions, i.e., 400, 550, and 650 °C, were considered.
The plastic strain energy density obtained from a stabilized hysteresis loop are summarized in Table 4. Depending on the imposed strain rate, the plastic strain energy, WP, exhibits slight variations.
With increased strain rate, approximately 10% difference of WP occurs between the strain rates of 1 × 10⁻² and 1 × 10⁻⁴ s−1.
As shown in Figure 6, greater strain rates result in longer fatigue lives. This can be explained based on the DSA effect. DSA is known to degrade the fatigue resistance [18,19]. The DSA-induced hardening accelerates the crack growth rate, consequently reducing the crack propagation life. In the regime of DSA (300–550 °C), the DSA effect becomes more pronounced with a decrease in strain rate and this therefore results in a reduction of fatigue life with decreasing strain rate at a given temperature.

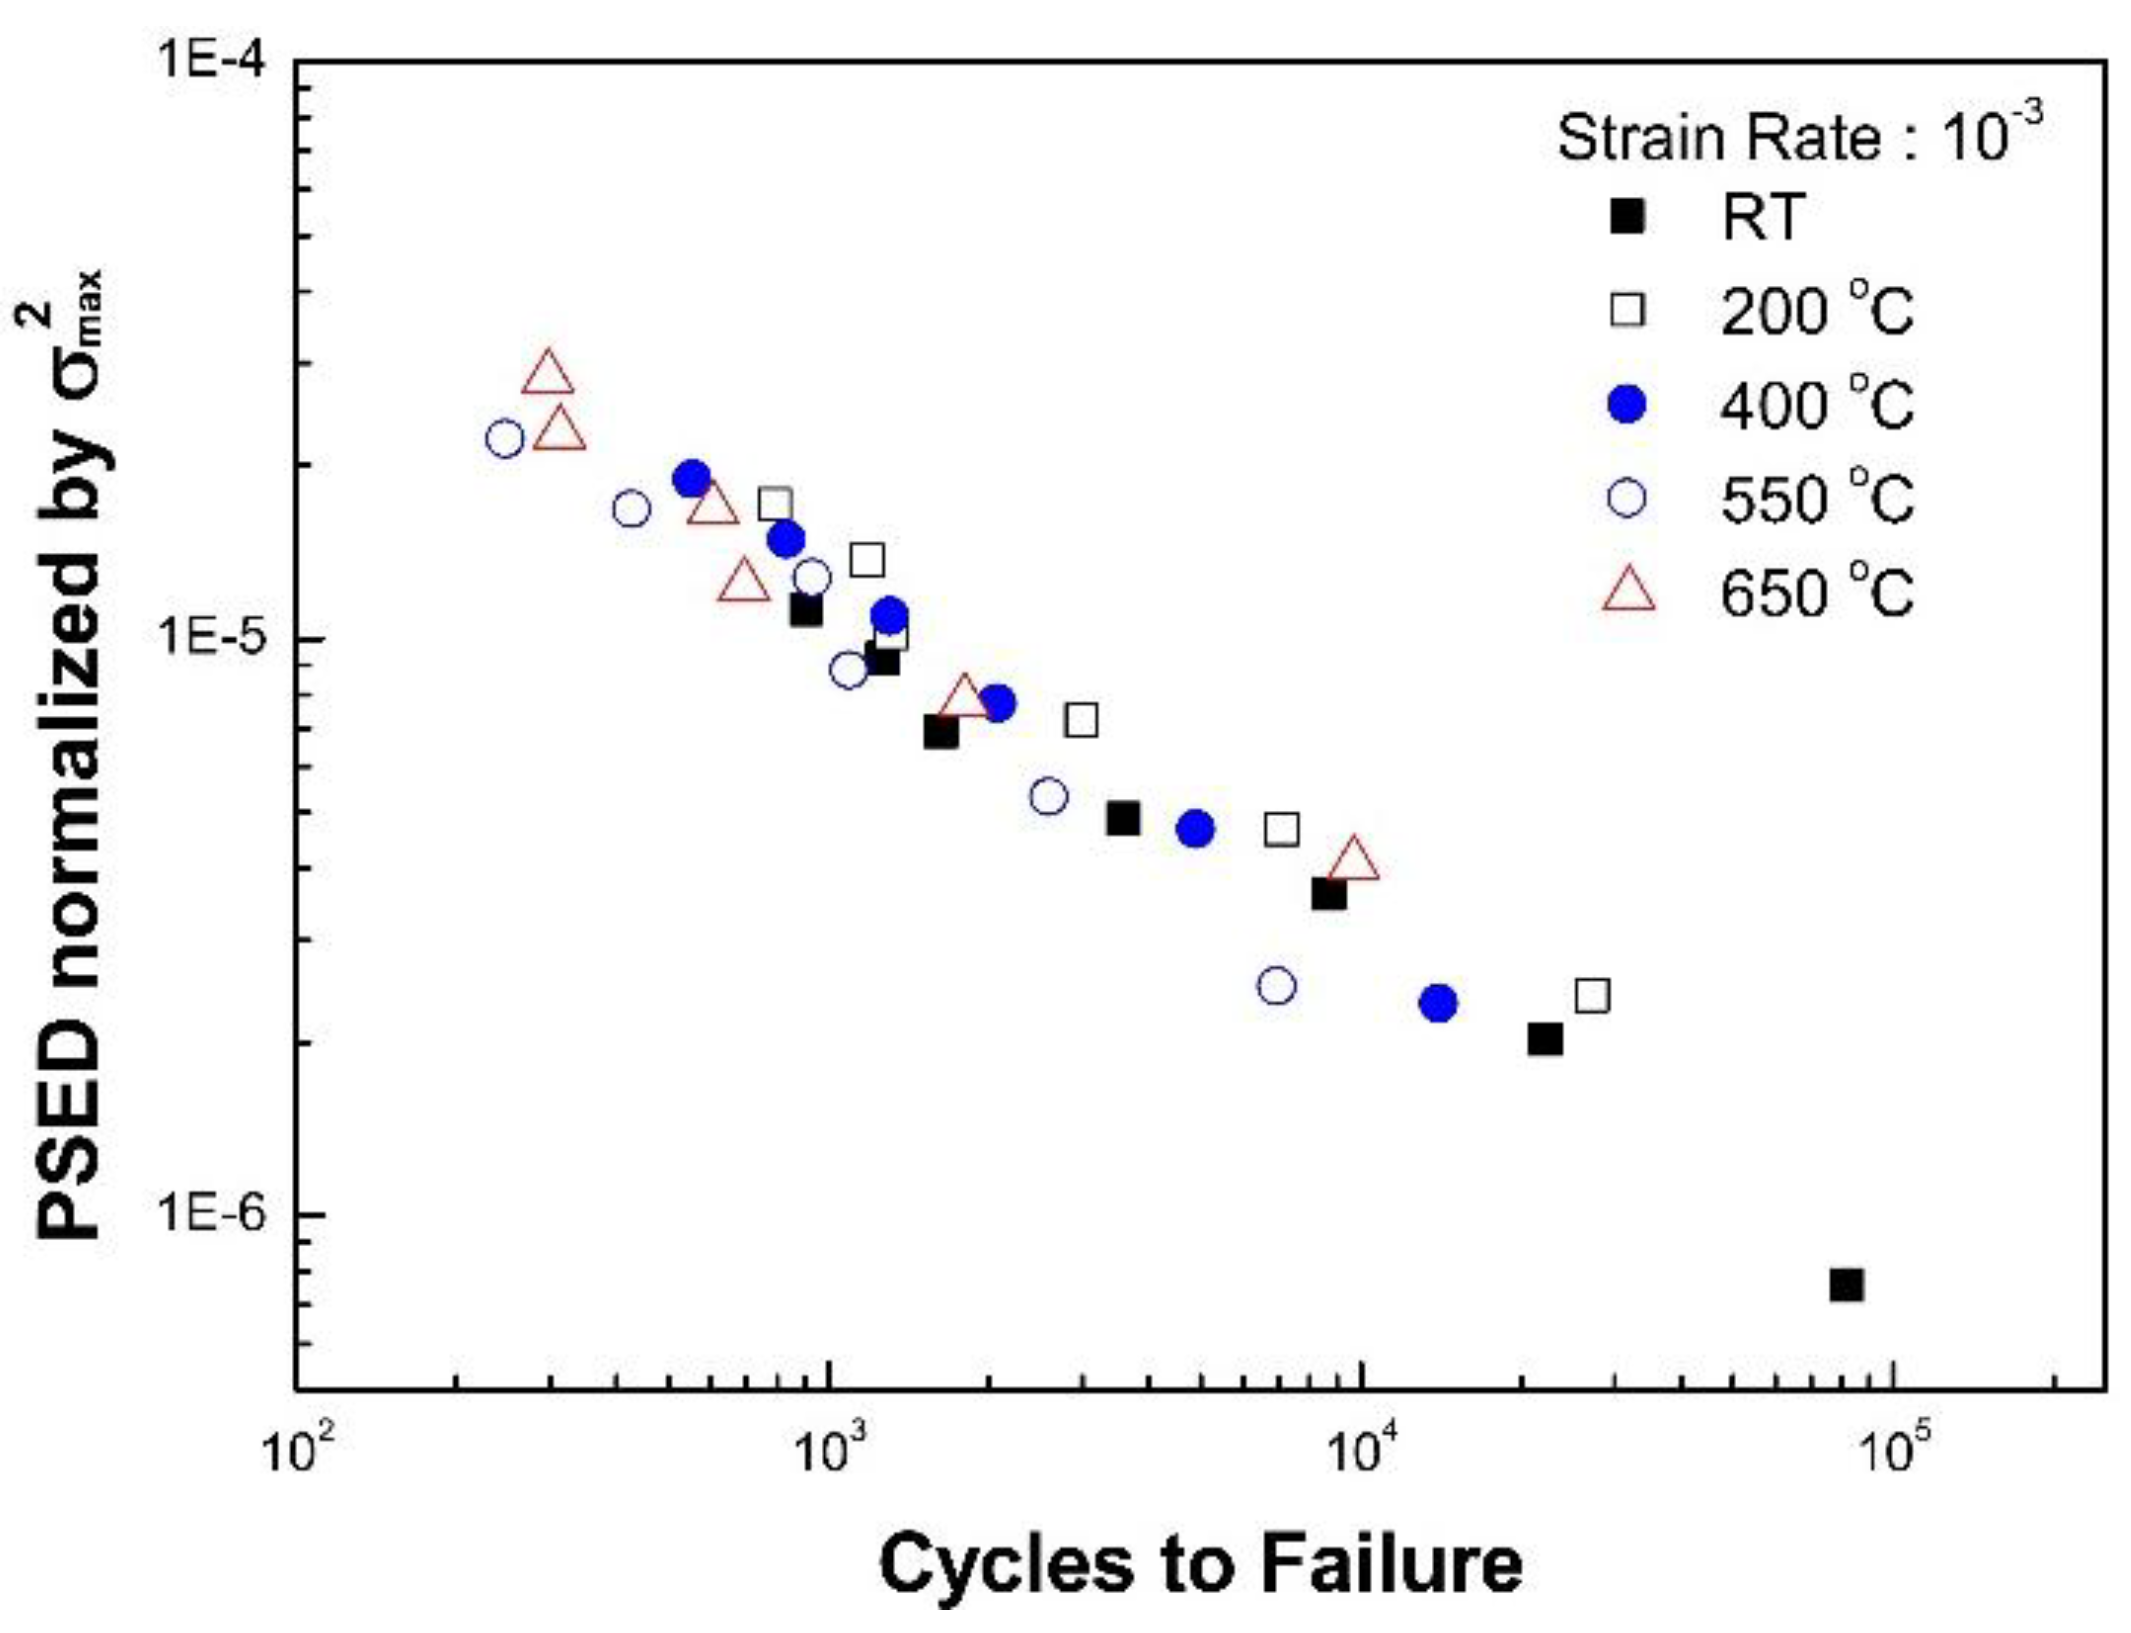
3.2.3. Proposed Energy-Based Fatigue Model

A new life prediction model is developed for a range of temperature and strain rate. It is noteworthy that the material ductility coefficient, CE, depend significantly on temperature. Further, the dependence of the fatigue exponent, mE, exists, but not as much as that of CE (Table 3). To incorporate temperature dependency into a life prediction model, the temperature-dependent parameters must be properly introduced into the Morrow model to eliminate the temperature dependence of the constants, mE and CE. Thus, a possible model should be of the following form:
N f m E Δ W P f ( T ) = C E
where f (T) is a temperature-dependent normalizing function for ΔWP.
To account for the effect of strain rate on fatigue life, the frequency-modified fatigue life was introduced into Equation (5) by replacing the loading frequency ν by the strain rate   ε ˙ because the strain rate was controlled in the LCF tests. Therefore, the strain-rate inclusive model becomes a multiplicative form of the strain-rate modified fatigue life and normalized dissipate energy density.
[ N f (   ε ˙   ε ˙ 0 ) k 1 ] m Δ W P f ( T ) = C
Here, ε ˙ 0 is a reference strain rate (e.g., 1 × 10⁻³ s−1) and m, k, C are material constants. For a proper selection of f(T), the function must be a material parameter that decreases with increasing temperature such as yield stress, material toughness, tangent modulus, etc. Simultaneously, it is reasonable to consider the function as an energy-related function to maintain consistency.
We begin with a material response to decide the function f(T). As shown in the stress-strain curve presented in Figure 7, the material exhibits a strain-hardening in the plastic deformation region.
Assuming a rigid-linear strain hardening material, the energy absorbed prior to unstable necking is given by
f ( T ) : W = ( σ max σ Y H ) ( σ max + σ Y 2 ) ,
where H and σmax are the tangent modulus and ultimate tensile stress in the true stress-strain curve. However, the energy-related parameter above is not practical for the description of f(T), as shown in Equation (7) because of the number of material constants. For simplification, using a single dominant material constant, σ max 2 , in place of f(T), Equation (6) becomes
[ N f ( ε ˙ ε ˙ 0 ) k 1 ] m Δ W P ( σ max ( T ) ) 2 = C
When the fatigue life is presented by a function of the plastic strain energy density normalized by σ max 2 , the fatigue life data at the temperature range (RT to 650 °C) was reduced to a single curve as shown in Figure 8. That is, the normalizing factor, σ max 2 , can be employed to eliminate the temperature dependence of the constant C efficiently.
The effects of strain rate on fatigue life are examined from Figure 9. Figure 9a does not account for the strain rate dependency on fatigue life, which is based on Equation (6). Meanwhile, Figure 9b is generated by considering the strain rate using Equation (8). When the strain rate modified fatigue life is presented as a function of the temperature modified plastic strain energy density, the data points obtained at the range of temperature (RT to 650 °C) and strain rate (3 × 10⁻⁵ to 1 × 10⁻² s−1) were reduced into a single curve, as shown in Figure 9b. In this case, the average values of constants m, k, and C in Equation (8) were found to be 0.576, 0.808, and 6.21 × 10⁻⁴, respectively.
Comparisons between the predicted lives and test data are presented in Figure 10. The horizontal and vertical axes represent the test data and predicted data, respectively. The more data points closer to the line of 45° slope (solid line in the figure) implies that the test results agree well with the predicted lives from the developed model. From the comparison, most of the data points are located between the factor-of-two line (dotted lines in the figure). Therefore, the new life prediction model described in Equation (8) can successfully describe the fatigue life with the inclusion of the effects of strain rate and temperature.

4. Conclusions

In this study, an energy-based fatigue life prediction model was developed that included the effects of temperature and strain rate. Tensile behavior of type 316L stainless steel were investigated by varied temperatures and strain rates. Low-cycle fatigue tests were performed over a wide range of temperature (RT to 650 °C) and strain rate (1 × 10⁻⁵ to 1 × 10⁻² s−1) with a constant total strain amplitude from 0.3% to 0.8%. Fatigue lives obtained from the extensive experimental program were plotted with respect to plastic strain amplitude, plastic strain energy density, and normalized plastic strain energy density. The conclusions were as follows.
  • The developed fatigue model successfully described the temperature and strain-dependent fatigue life. The developed model was a multiplicative form of the normalized plastic strain energy density and frequency modified fatigue life, resulting from a good correlation between the two parameters. Finally, the prediction capabilities were verified by comparing with the predicted life and experimental fatigue life. Consequently, most of experimental data were found to be between the factor-of-two lines.
  • The conventional Coffin-Manson model and Morrow model were recommended at one isothermal temperature for a life prediction model. However, they were not applicable over the specified temperature range, or, the fatigue ductility coefficient, C, and exponent, m, must be provided with respect to temperature.
  • At the temperature range of 300—550 °C, DSA occurred, causing abnormal features in the deformation behavior (a serrated flow and negative strain-rate sensitivity) and mechanical properties (a plateau in the variation of strength and ductility with temperature), and this led to the deterioration of the fatigue resistance. Despite the DSA-induced complicated nature of fatigue life behavior, the capability of the developed fatigue model could be proven over a range of temperature and strain rate.

Author Contributions

Conceptualization, N.H.T. and J.-Y.L.; Methodology, N.H.T. and J.-Y.L.; Formal Analysis, N.H.T., J.-S.K. and J.-Y.L.; Investigation, N.H.T., J.-S.K. and J.-Y.L.; Writing—Original Draft Preparation, N.H.T.; Writing—Review and Editing, J.-Y.L.; Supervision, J.-Y.L.

Funding

This research was funded by the Korea Research Institute of Standards and Science through the project of “Development of Reliability Technology of Standard Measurement for Hydrogen Convergence Station (KRISS-2018-GP2018-0011).” This research was also partially supported by a grant from the R&D Program of the Korea Railroad Research Institute, Republic of Korea and the National Research Foundation of Korea (NRF) grant funded by the Korea Government (Grant No.: 2017R1C1B5017363), Republic of Korea.

Conflicts of Interest

The authors declare no conflict of interest.

References

  1. Kamal, M.; Rahman, M.M. Advances in fatigue life modeling: A review. Renew. Sustain. Energy Rev. 2018, 82, 940–949. [Google Scholar] [CrossRef]
  2. Santecchia, E.; Hamouda, A.M.S.; Musharavati, E.; Zalnezhad, E.; Cabibbo, M.; El Mehtedi, M.; Spigarelli, S. A review on fatigue life prediction methods for metals. Adv. Mater. Sci. Eng. 2016, 2016, 9573524. [Google Scholar] [CrossRef]
  3. Bezazi, A.; Pierce, S.G.; Worden, K.; Harkati, E. Fatigue life prediction of sandwich composite materials under flexural tests using a Bayesian trained artificial neural network. Int. J. Fatigue 2007, 29, 738–747. [Google Scholar] [CrossRef]
  4. Zhang, Z.; Tan, J.; Wu, X.; Han, E.; Ke, W.; Rao, J. Effect of temperature on corrosion fatigue behavior of 316LN stainless steel in high temperature pressurized water. Corros. Sci. 2019, 146, 80–89. [Google Scholar] [CrossRef]
  5. Yan, X.; Zhang, X.; Tu, S.; Mannan, S.; Xuan, F.; Lin, Y. Review of creep-fatigue endurance and life prediction of 316 stainless steels. Int. J. Press Vessels Piping 2015, 126–127, 17–28. [Google Scholar] [CrossRef]
  6. Suazay, M.; Mottot, M.; Allais, L.; Noblecourt, M.; Monnet, I.; Perinet, J. Creep fatigue behavior of an AISI stainless steel at 550 °C. Nucl. Eng. Des. 2004, 232, 219–236. [Google Scholar] [CrossRef]
  7. Qiu, Y.; Pang, J.C.; Li, S.X.; Zhang, M.X.; Zhang, Z.F. Influence of temperature on the low-cycle fatigue properties of compacted graphite iron. Int. J. Fatigue 2018, 117, 450–460. [Google Scholar] [CrossRef]
  8. Hong, J.; Jang, C.; Kim, T. Effects of mixed strain rates on low cycle fatigue behaviors of austenitic stainless steels in a simulated PWR environment. Int. J. Fatigue 2016, 82, 292–299. [Google Scholar] [CrossRef]
  9. Srinivasan, V.S.; Valsan, M.; Rao, K.B.S.; Mannan, S.L.; Raj, B. Low cycle fatigue and creep-fatigue interaction behavior of 316L(N) stainless steel and life prediction by artificial neural network approach. Int. J. Fatigue 2003, 25, 1327–1338. [Google Scholar] [CrossRef]
  10. Sharkar, P.P.; De, P.S.; Dhua, S.K.; Chakraborti, P.C. Strain energy based low cycle fatigue damage analysis in a plain C–Mn rail steel. Mater. Sci. Eng. A Struct. Mater. 2017, 707, 125–135. [Google Scholar] [CrossRef]
  11. Coffin, L.F., Jr. A study of the effects of cyclic thermal stresses on a ductile metal. Trans. ASME 1954, 76, 931–950. [Google Scholar]
  12. Feltner, C.E.; Morrow, J.D. Microplastic strain hysteresis energy as a criterion for fatigue fracture. J. Basic Eng. 1961, 83, 15–22. [Google Scholar] [CrossRef]
  13. Shi, X.Q.; Pang, H.L.J.; Zhou, W.; Wang, Z.P. Low cycle fatigue analysis of temperature and frequency effects in eutectic solder alloy. Int. J. Fatigue 2000, 22, 217–228. [Google Scholar] [CrossRef]
  14. Lee, J.H.; Jeong, H.Y. Fatigue life prediction of solder joints with consideration of frequency, temperature and cracking energy density. Int. J. Fatigue 2004, 61, 264–270. [Google Scholar] [CrossRef]
  15. ASTM E606-92 Standard Practice for Strain-Controlled Fatigue Testing; ASTM International: West Conshohocken, PA, USA, 2004.
  16. Kandil, F.A. Potential ambiguity in the determination of the plastic strain range component in LCF testing. Int. J. Fatigue 1999, 21, 1013–1018. [Google Scholar] [CrossRef]
  17. Xu, Z.; Huang, F. Plastic behavior and constitutive modeling of armor steel over wide temperature and strain rate ranges. Acta Mech. Solida Sin. 2012, 25, 598–608. [Google Scholar] [CrossRef]
  18. Hong, S.G.; Lee, S.B. Dynamic strain aging under tensile and LCF loading conditions and their comparison in cold worked 316L stainless steel. J. Nucl. Mater. 2004, 328, 232–242. [Google Scholar] [CrossRef]
  19. Hong, S.G.; Lee, S.B. Mechanism of dynamic strain aging and characterization of its effect on the low-cycle fatigue behavior in type 316L stainless steel. J. Nucl. Mater. 2005, 340, 307–314. [Google Scholar] [CrossRef]
  20. Ellyn, F. Fatigue Damage, Crack Growth and Life Prediction; Chapman & Hall: London, UK, 1997; pp. 87–90. [Google Scholar]
Figure 1. Specimen for tensile and low-cycle fatigue (LCF) test (dimensions in mm).
Materials 12 01090 g001
Figure 2. Material properties depending on temperature.
Materials 12 01090 g002
Figure 3. Strain rate dependency at 550 °C.
Materials 12 01090 g003
Figure 4. Temperature dependency of (a) Δεp and (b) ΔWp at ε ˙ = 1 × 10 3 s−1.
Materials 12 01090 g004
Figure 5. Life prediction by (a) the Coffin-Manson model and (b) the Morrow model at ε ˙ = 1 × 10 3 s−1.
Materials 12 01090 g005aMaterials 12 01090 g005b
Figure 6. Strain rate dependence on fatigue lives at (a) 550 °C and (b) 650 °C.
Materials 12 01090 g006aMaterials 12 01090 g006b
Figure 7. Rigid linear-strain hardening assumption of tensile response.
Materials 12 01090 g007
Figure 8. The verification of the new LCF life prediction model with respect to temperature.
Materials 12 01090 g008
Figure 9. The verification of the new LCF life prediction model with respect to strain-rate: (a) without using the strain-rate modified fatigue lives; (b) with using strain-rate modified fatigue lives in Equation (8).
Materials 12 01090 g009
Figure 10. Comparison between predicted fatigue life and test data.
Materials 12 01090 g010
Table 1. The chemical composition of 316L stainless steel (wt %).
CSiMnPSNiCrMoCuN
0.0250.411.410.0250.02510.2216.162.090.043
Table 2. The mechanical properties of 316L stainless steel.
Temperature
(°C)
Strain Rate
(s−1)
σy
(MPa)
σu
(MPa)
EL
(%)
σmax
(MPa)
209.34 × 10−448968450.90985
2001.01 × 10−341954628.80638
3001.01 × 10−340951024.80583
4009.11 × 10−438951224.14591
5509.42 × 10−436848724.00554
6009.09 × 10−434645725.32528
6509.68 × 10−431540333.65472
Table 3. Material constants in each life prediction models.
Temperature
(°C)
Coffin-Manson Model
(Equation (1))
Morrow Model
(Equation (2))
mCCCmECE
RT0.3958.950.580552.33
2000.4188.510.535221.38
4000.50112.200.610301.30
5500.5109.380.635247.07
6500.5269.960.651221.31
Table 4. The changes of plastic strain energy density, WP, with respect to strain rate at each temperature (Δεt = ±0.5%).
Strain Rate
(s−1)
WP (MJ/m3)
400 °C500 °C650 °C
1 × 10−22.7682.6102.701
1 × 10−32.7482.6622.739
1 × 10−42.8282.8252.780
3.2 × 10−52.9522.837

