Comparison of Effects of Sodium Bicarbonate and Sodium Carbonate on the Hydration and Properties of Portland Cement Paste


Abstract
1. Introduction
2. Materials and Methods
2.1. Materials
2.2. Methods
3. Results
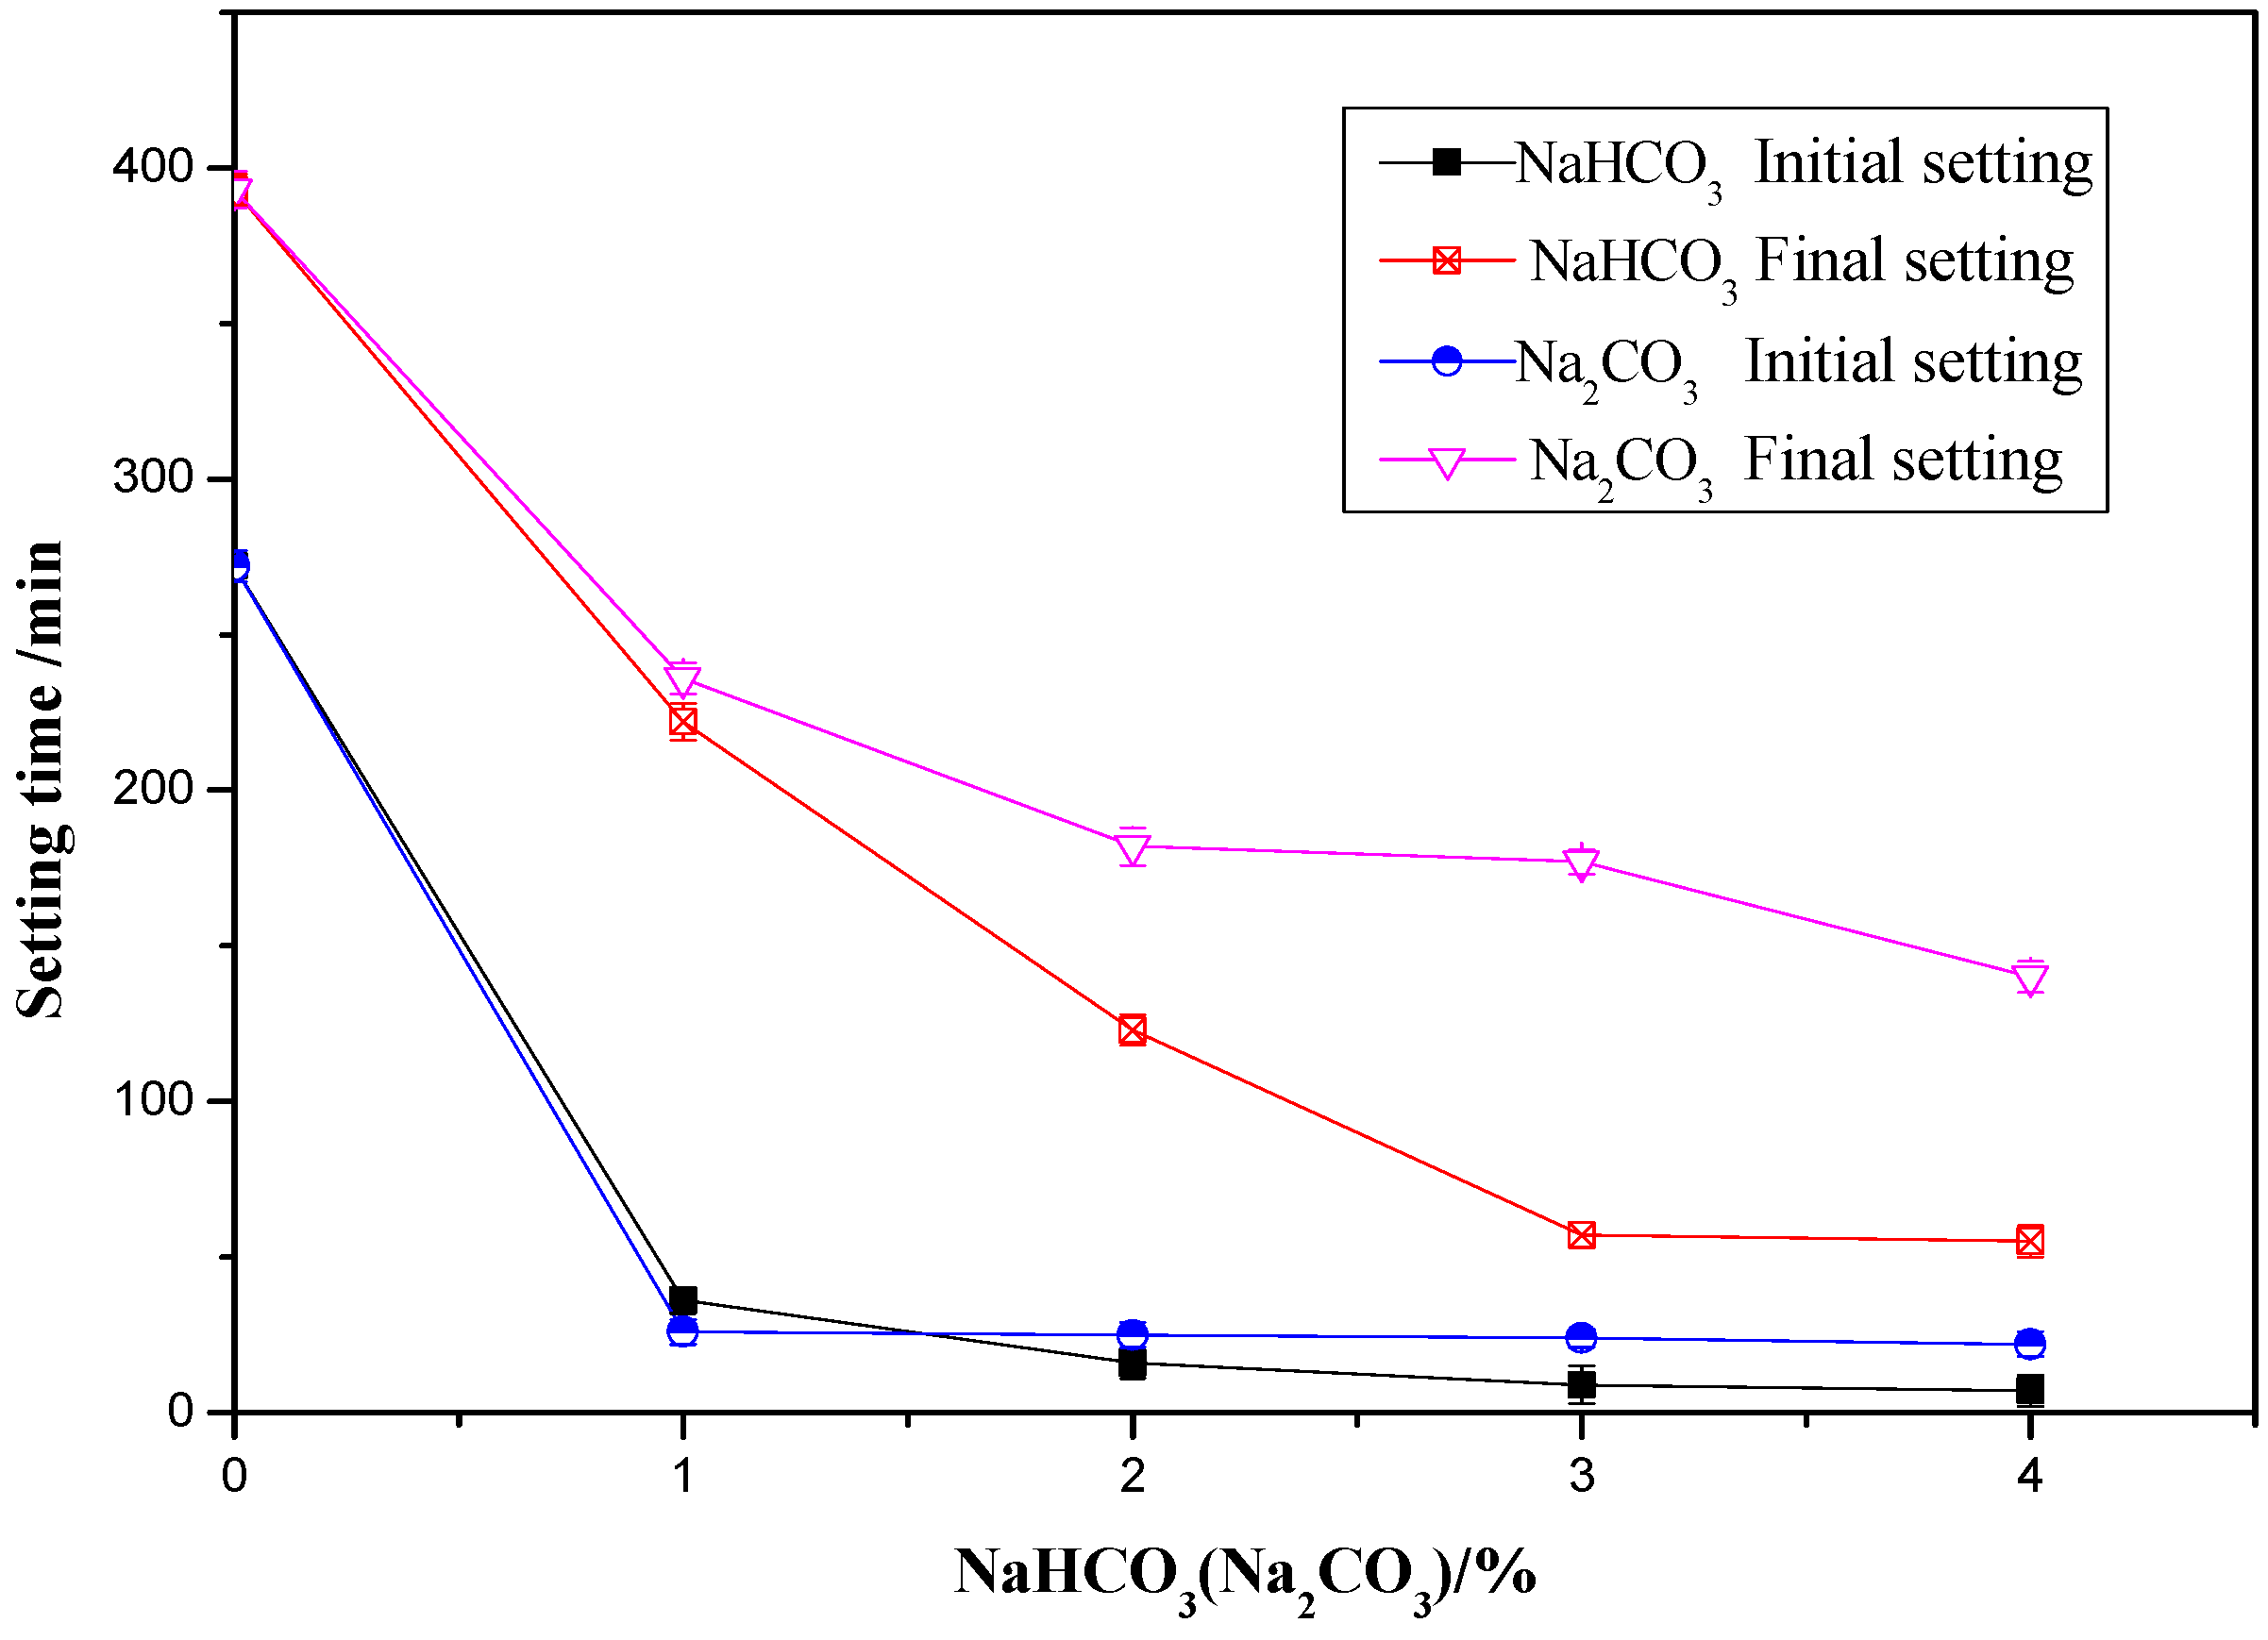
3.1. Influence of NaHCO3/Na2CO3 on the Setting Time of OPC Paste
3.2. Influence of NaHCO3/Na2CO3 on the Compressive Strength of OPC Paste
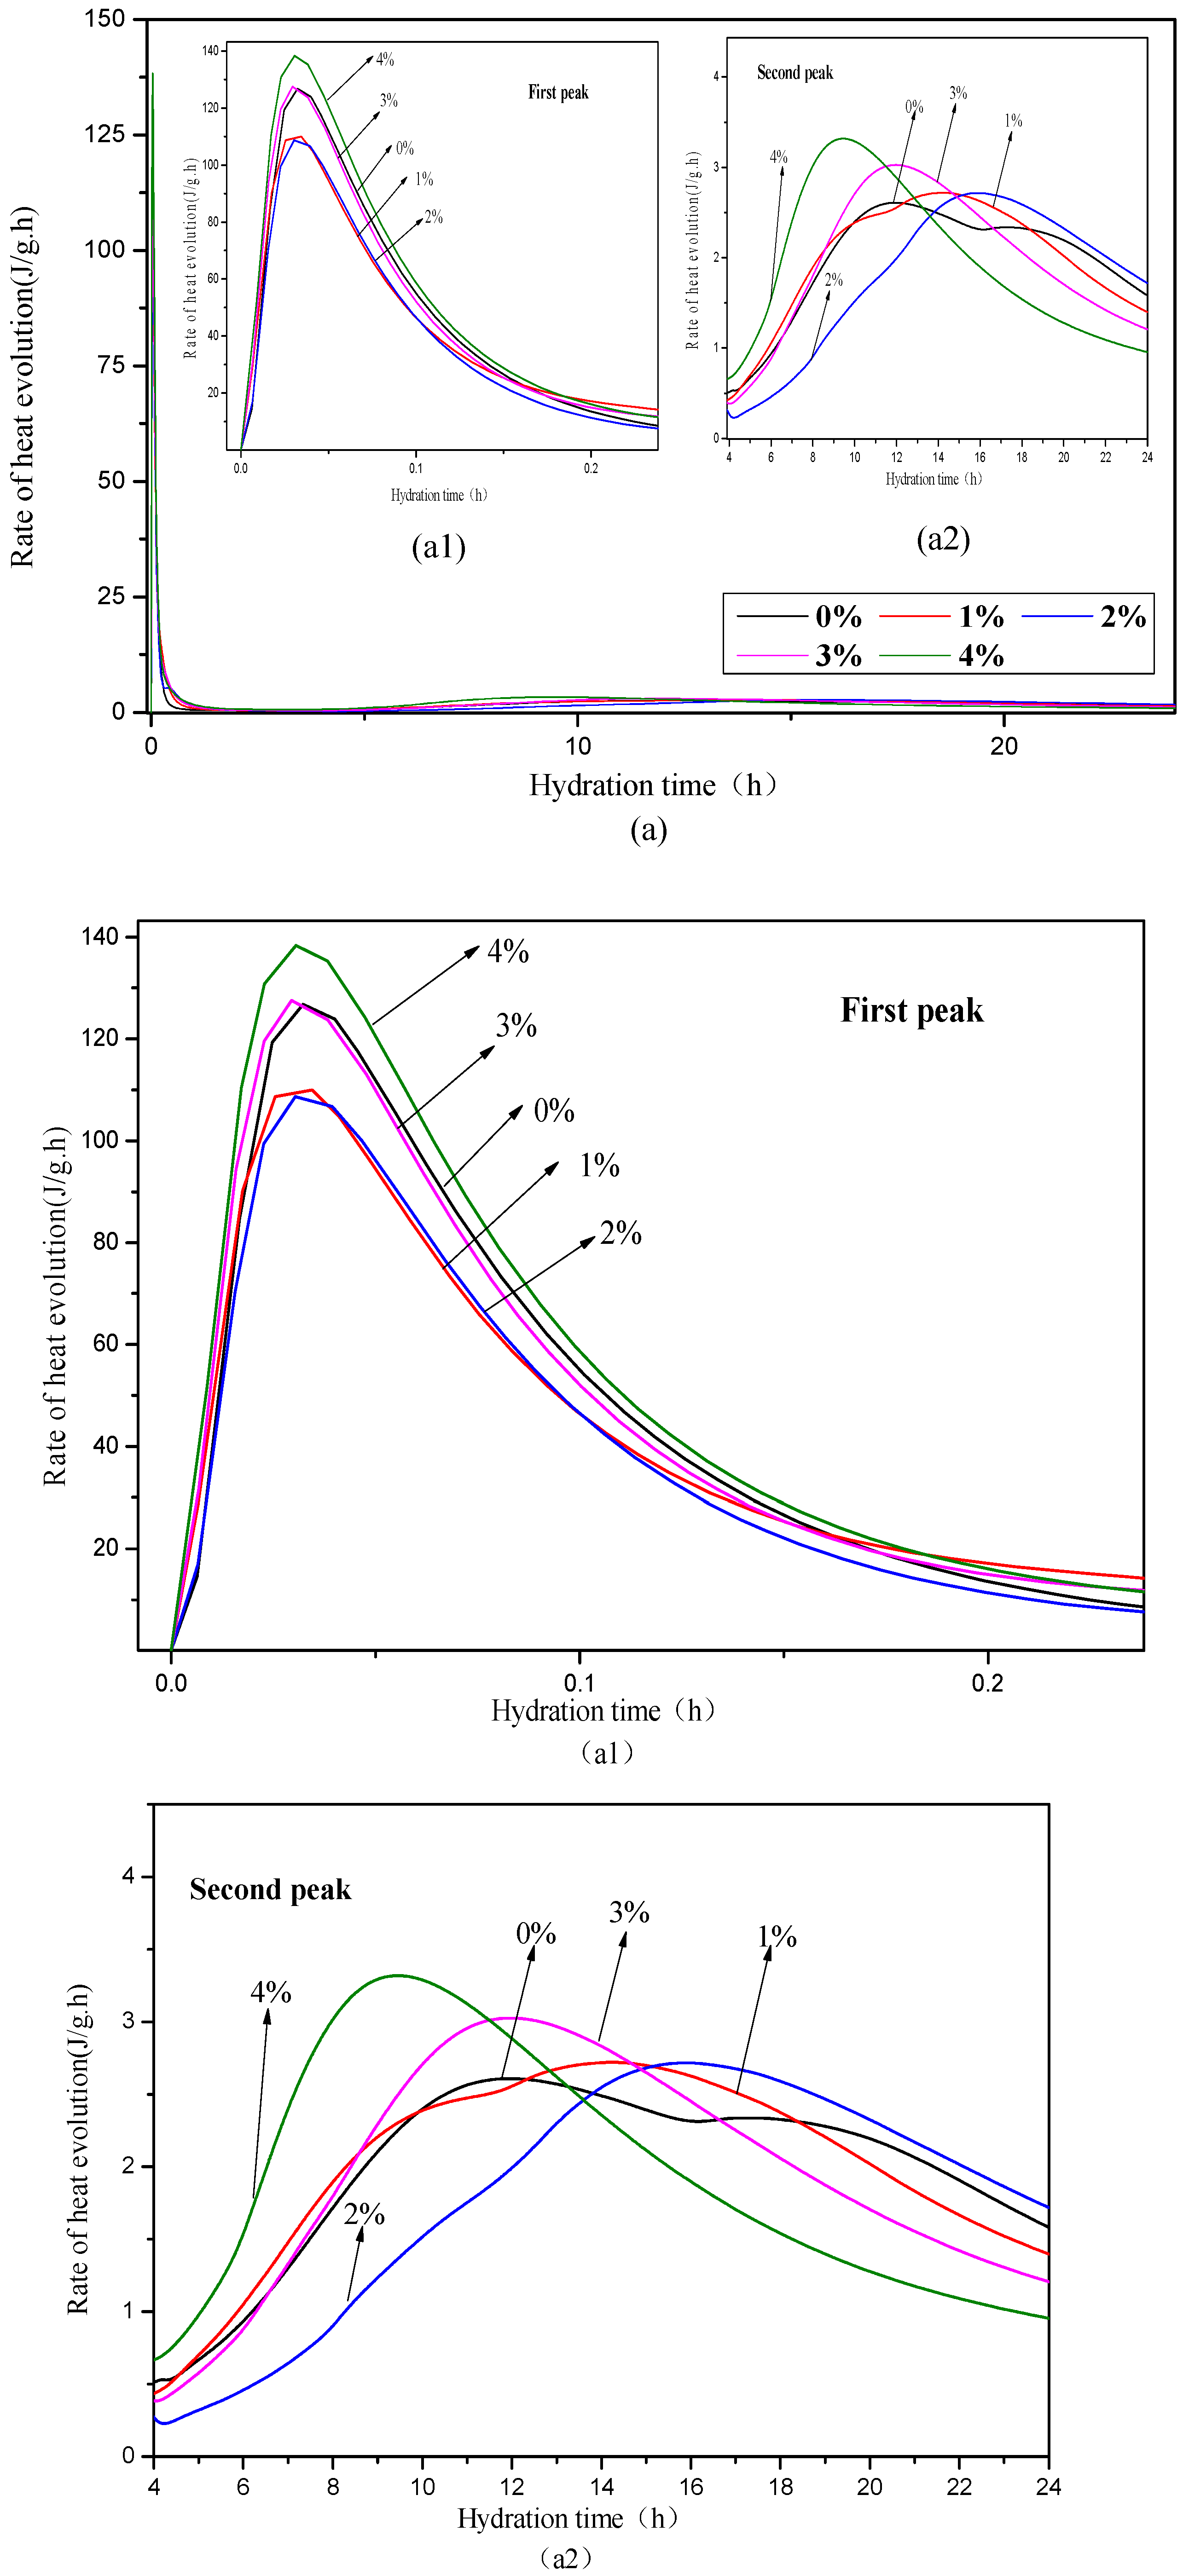
3.3. Hydration Heat
3.4. TG-DTA Results
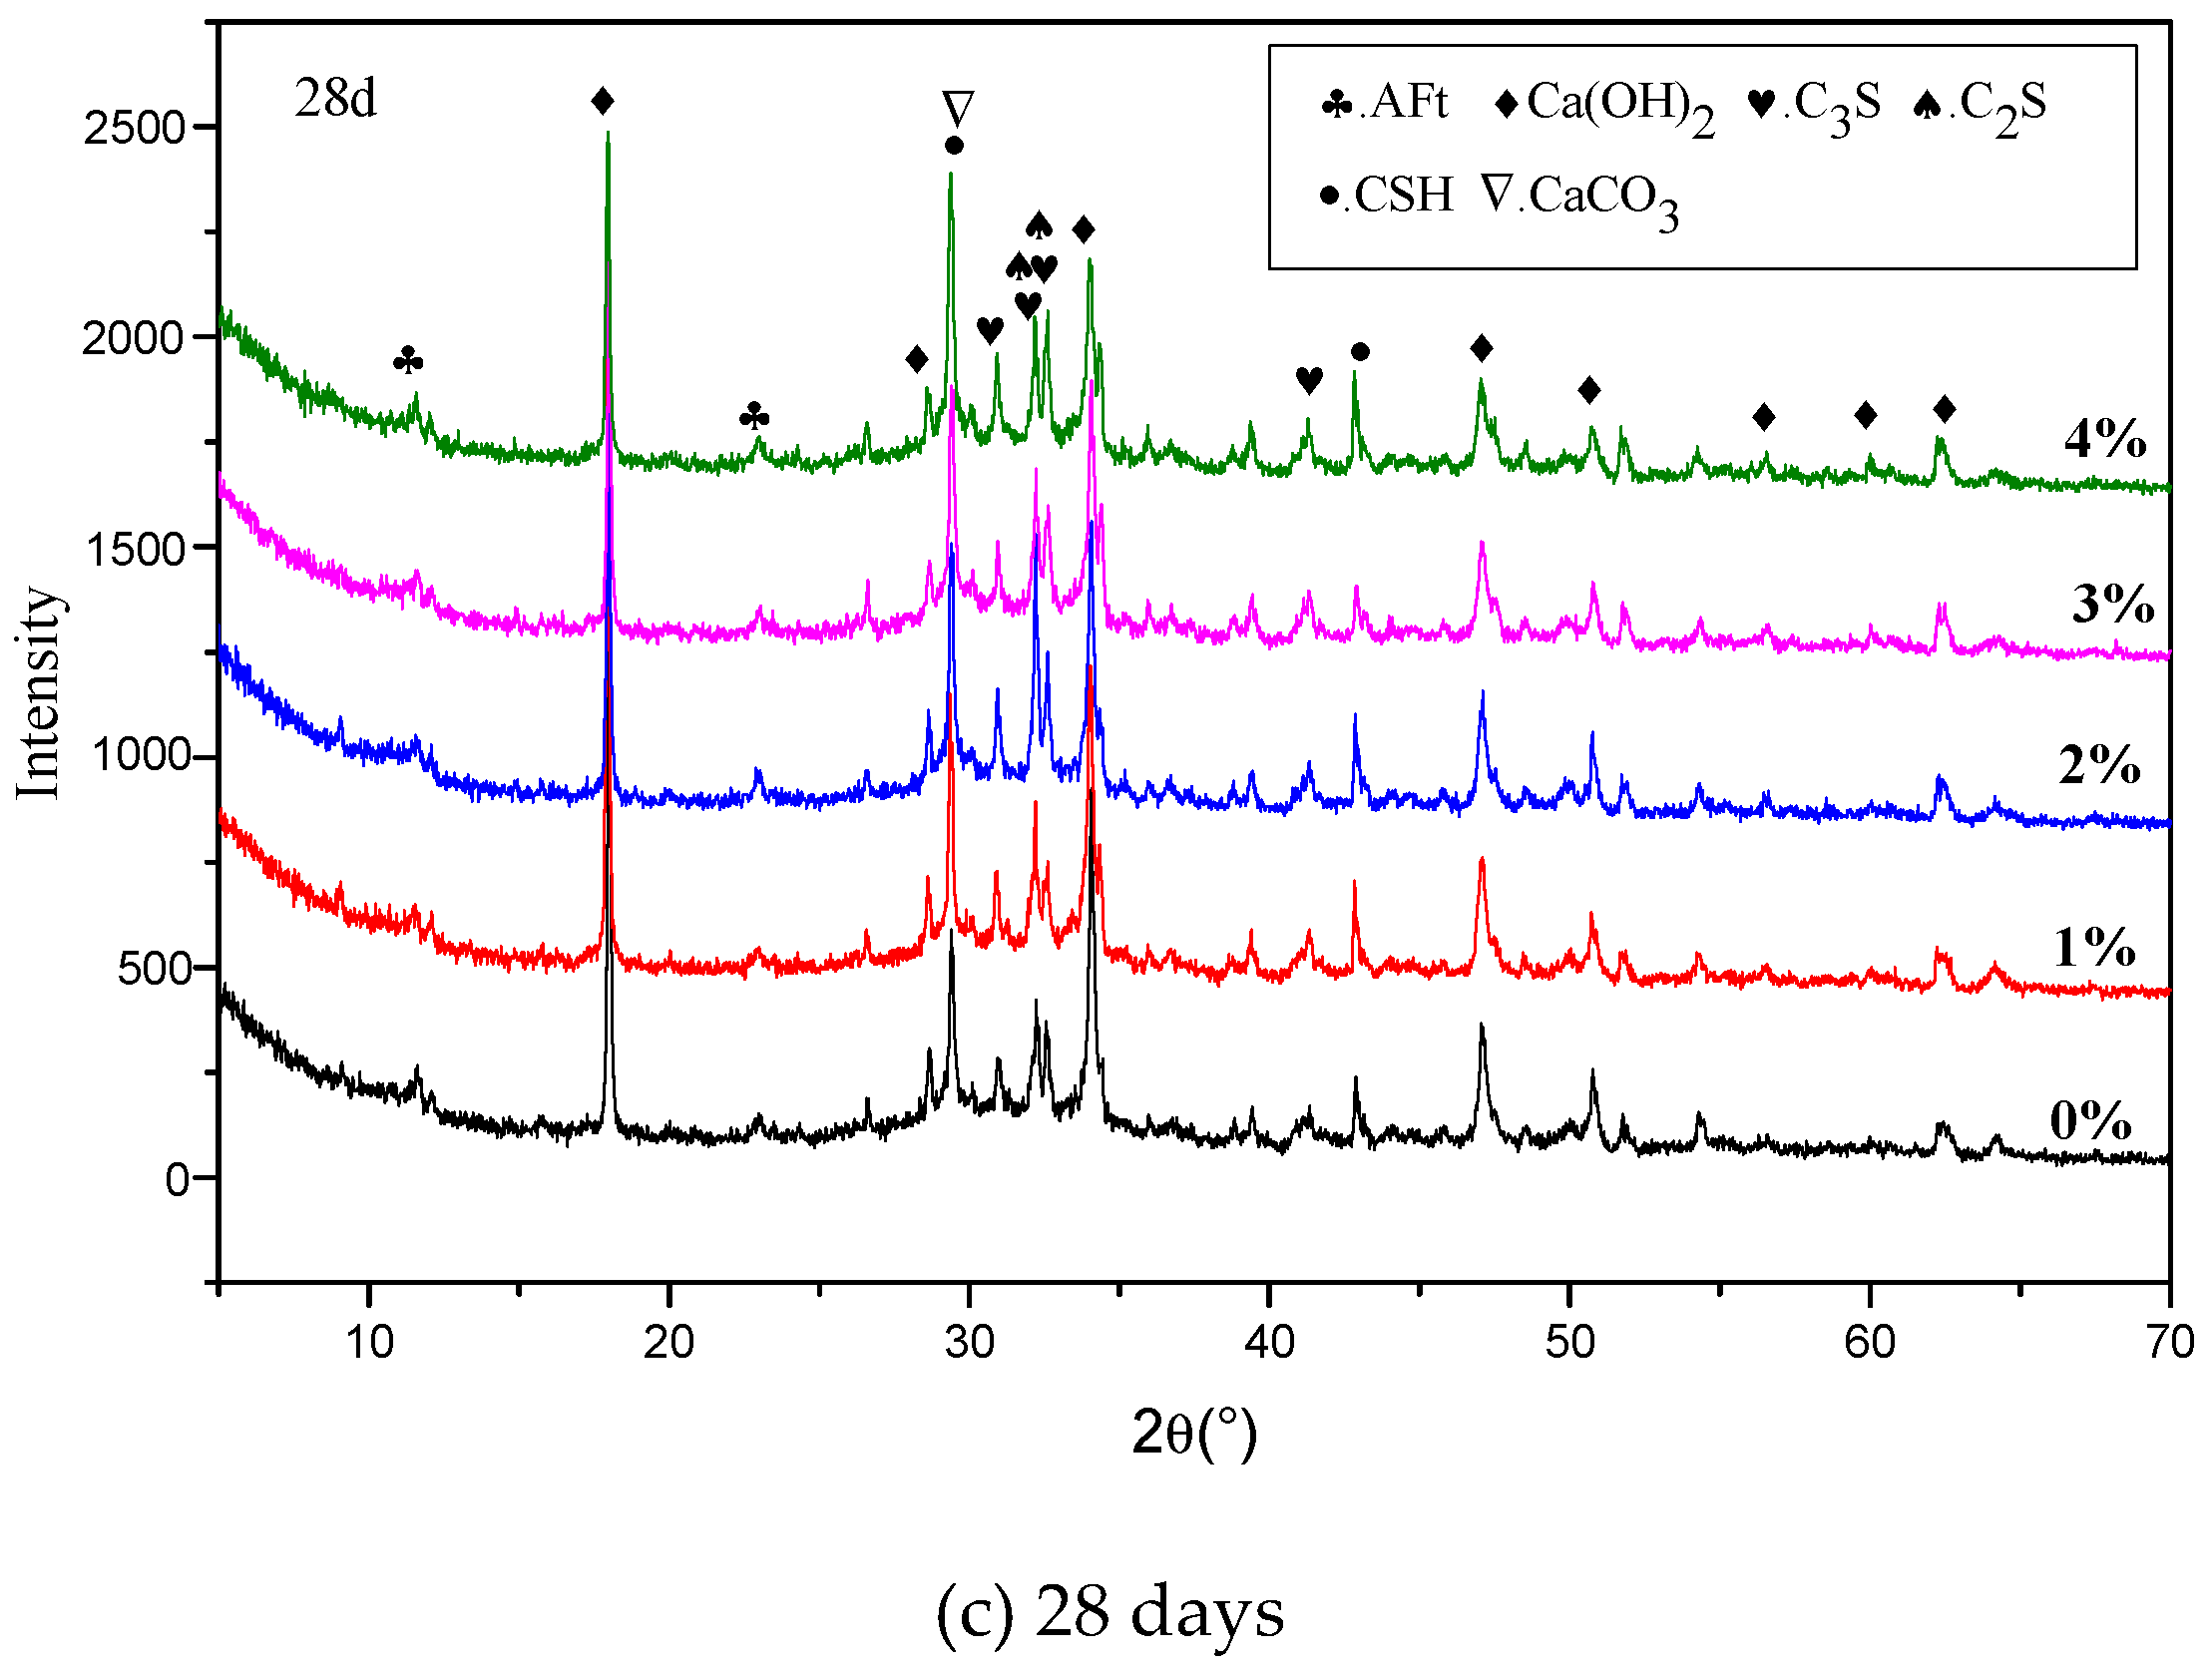
3.5. XRD Results
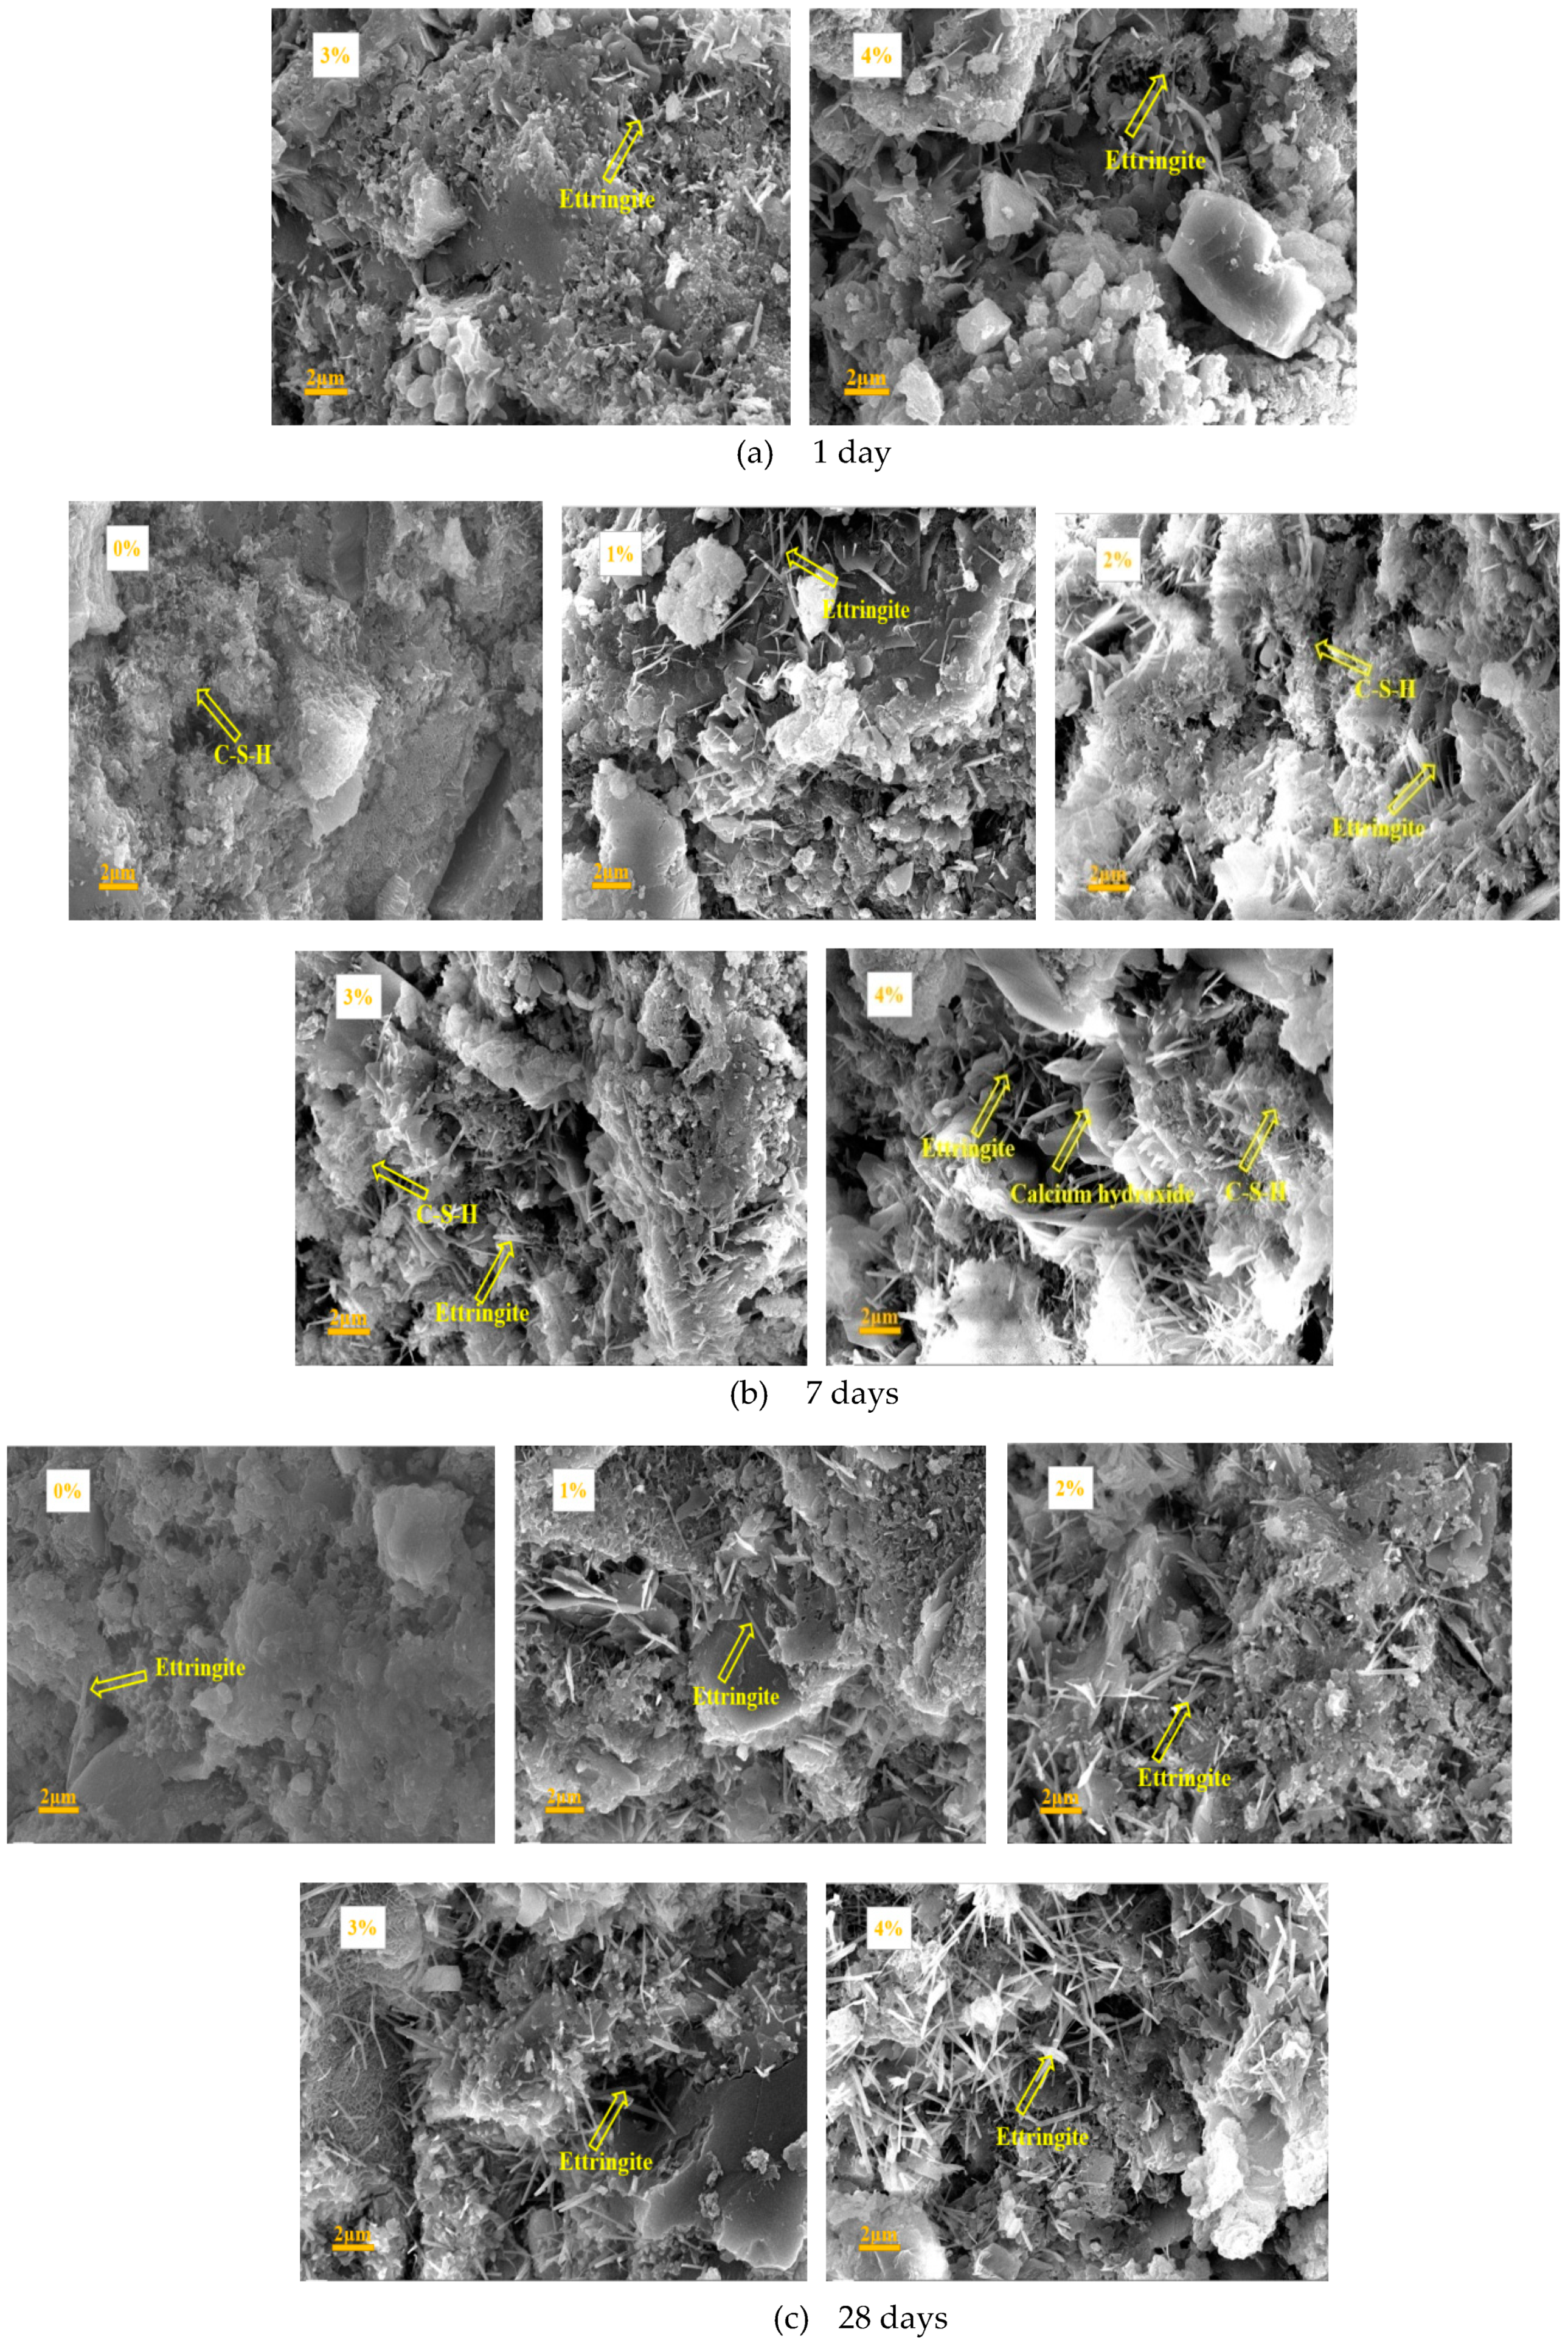
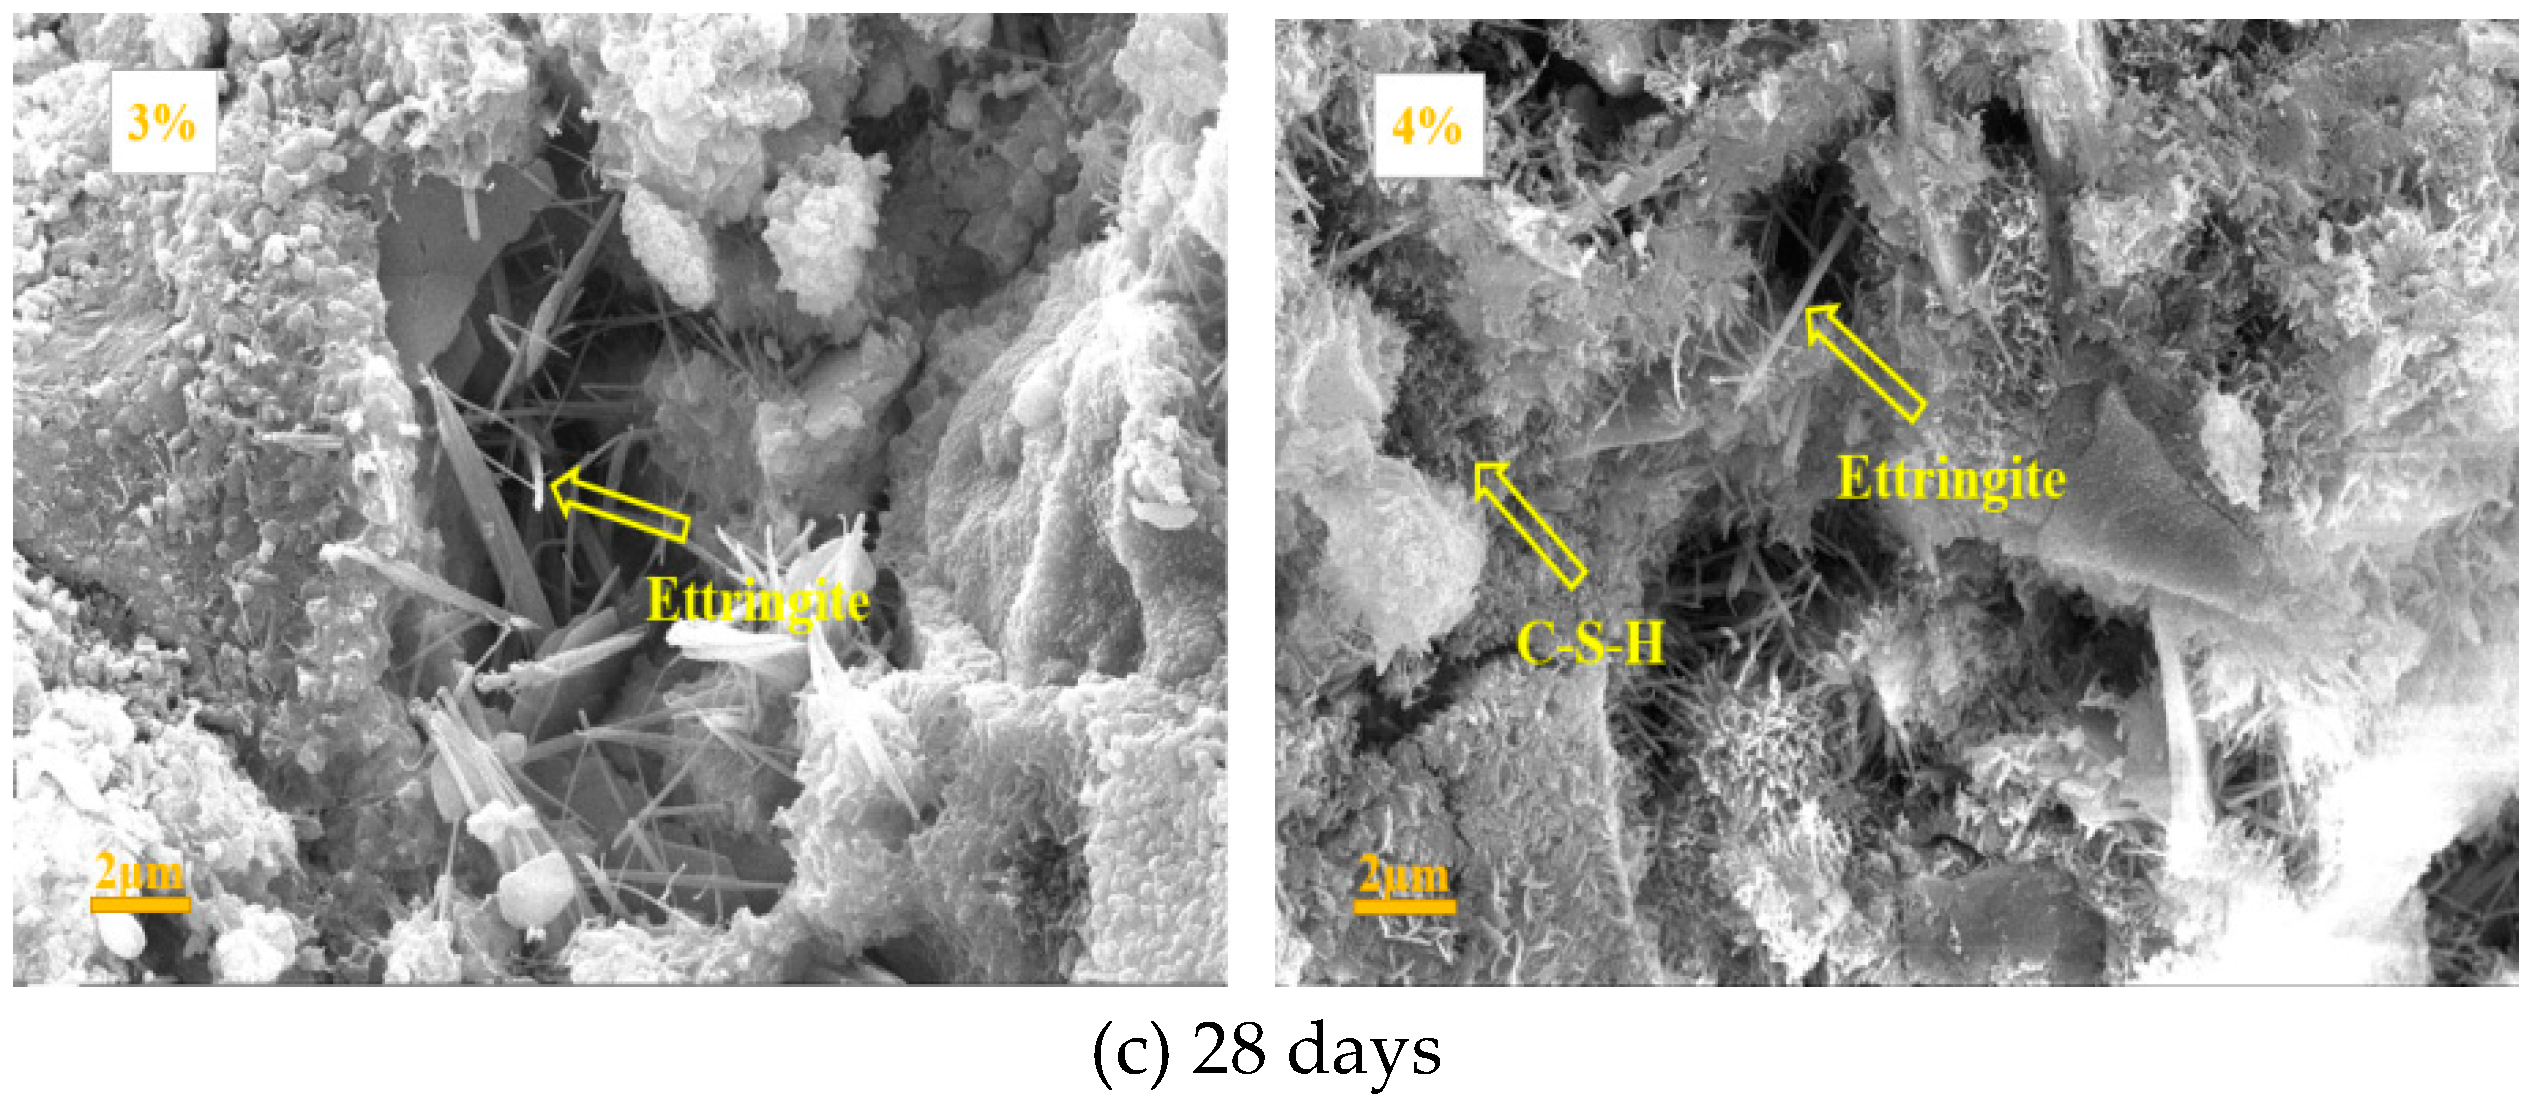
3.6. SEM Results
4. Discussion
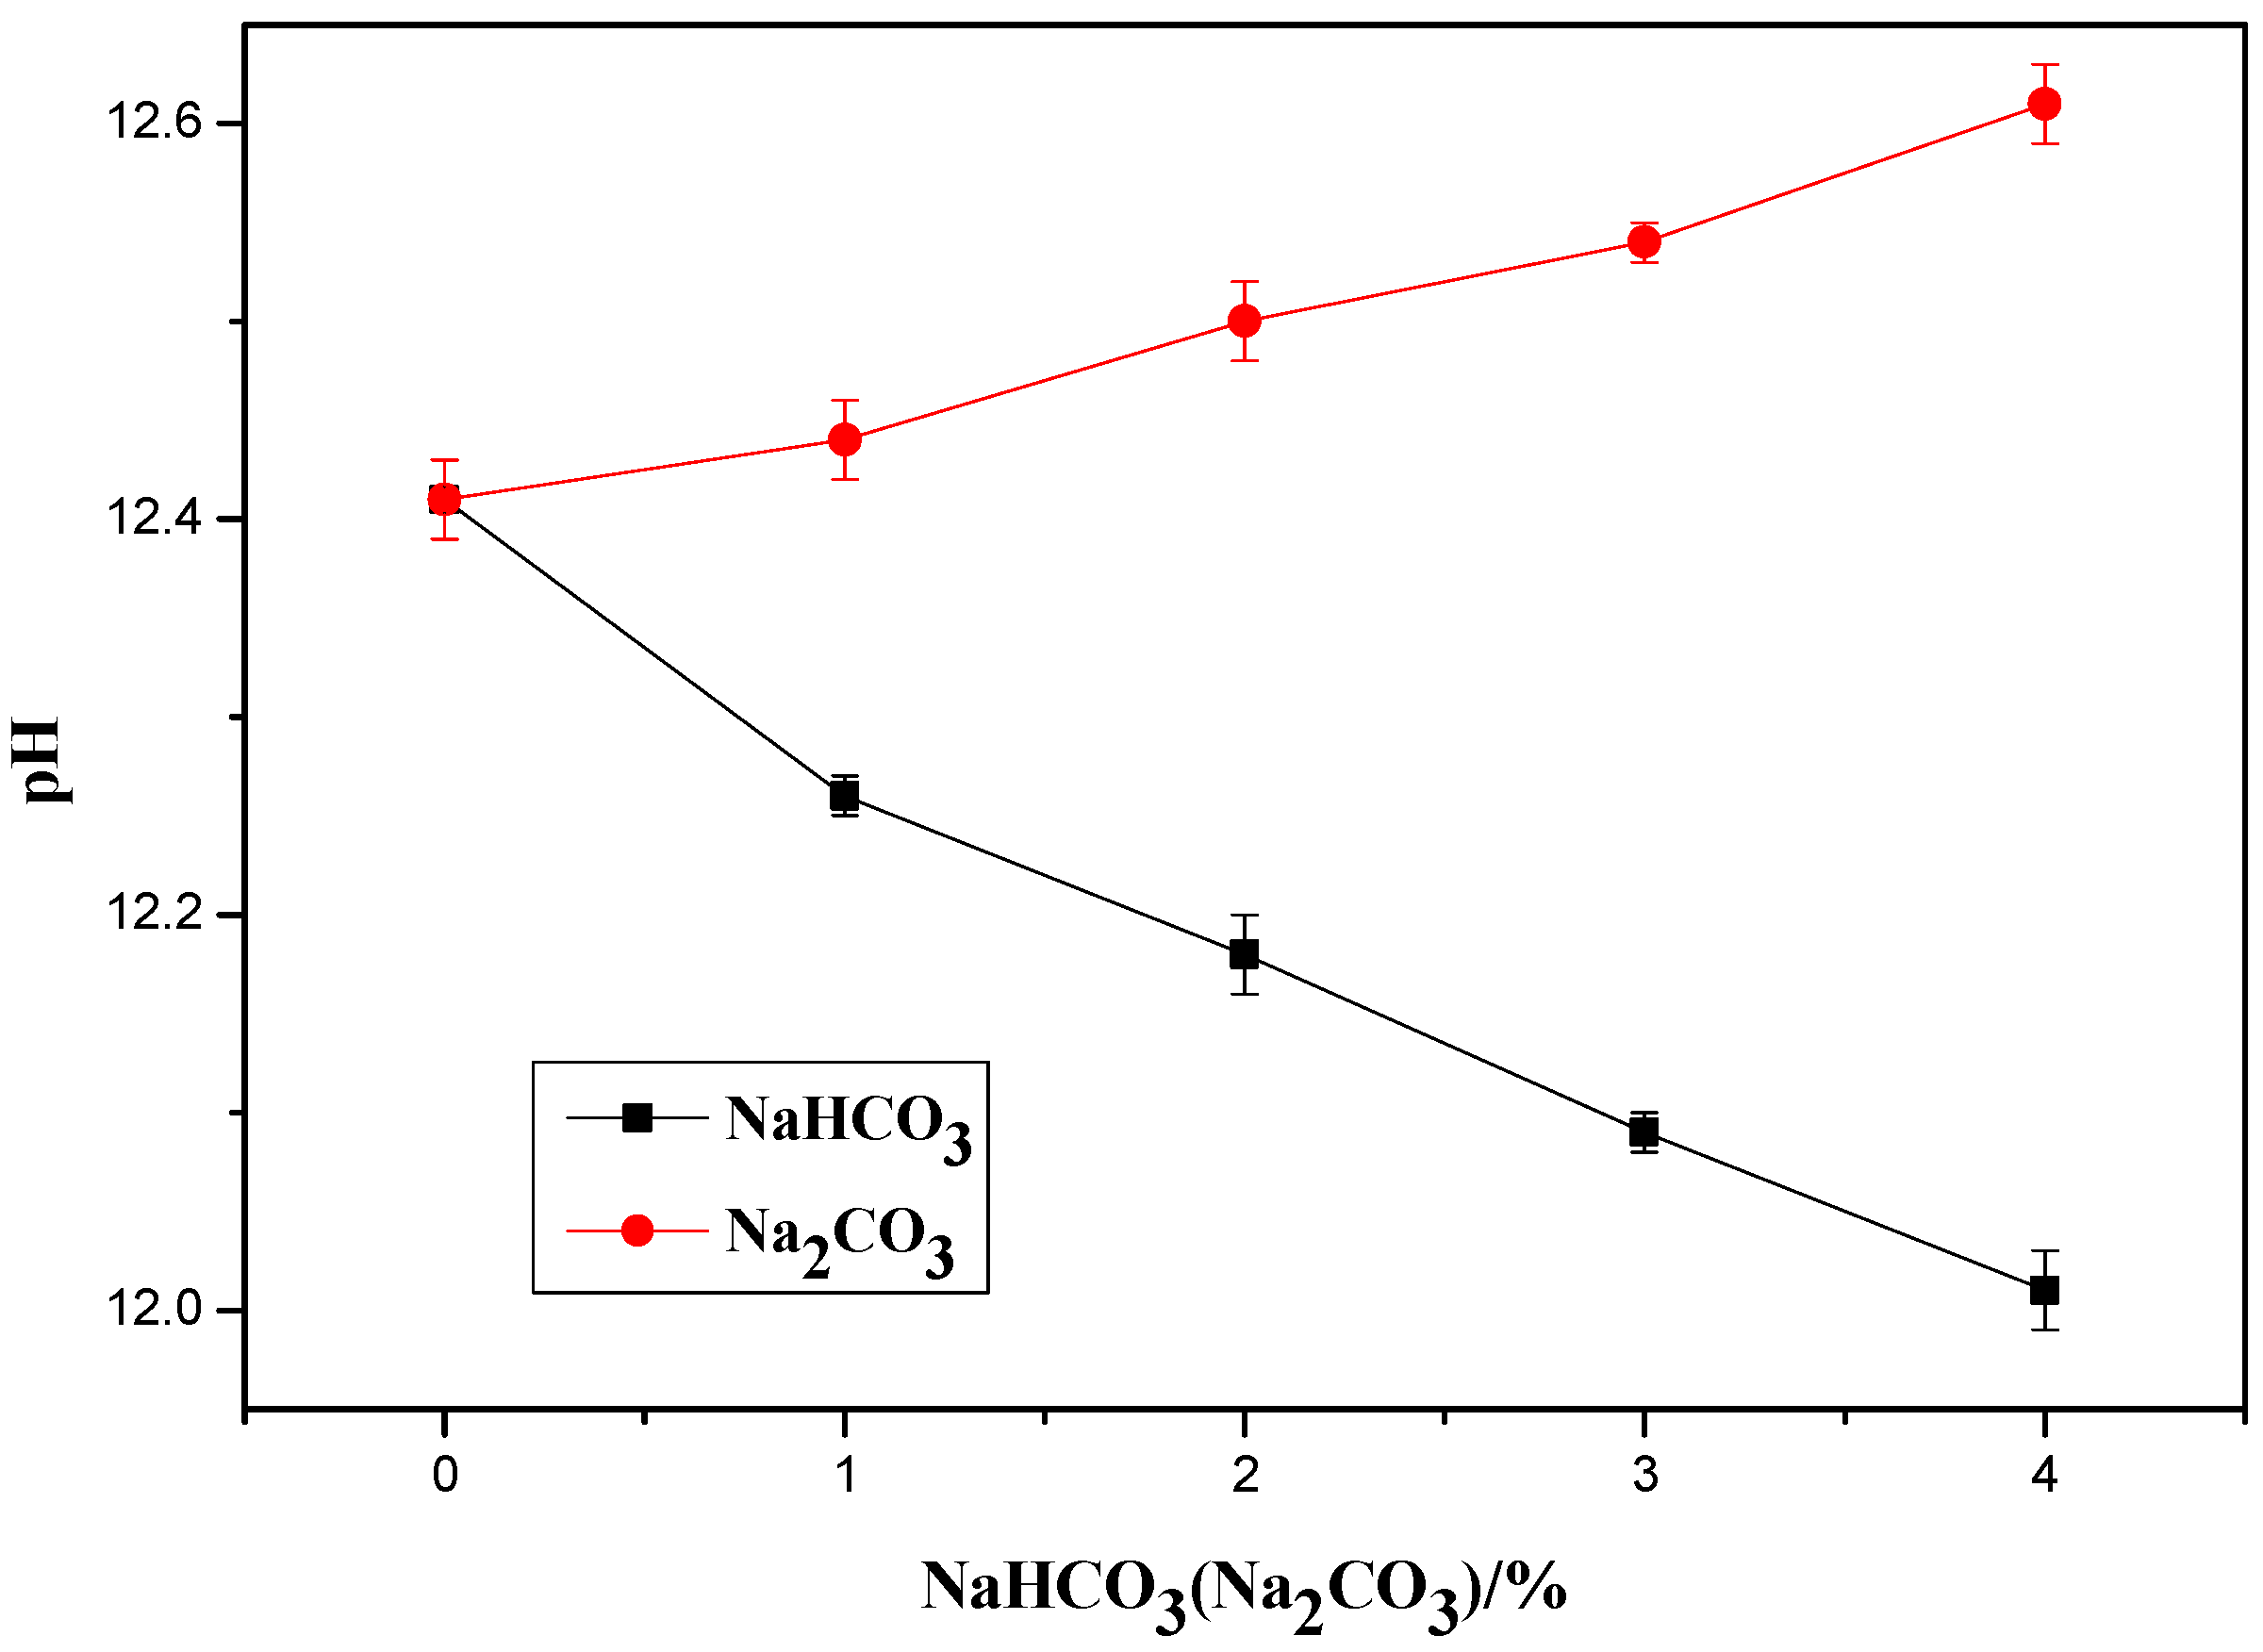
4.1. Influence of Na2CO3/NaHCO3 on the PH of OPC Paste
4.2. Influence of Na2CO3/NaHCO3 on the Introduced CO2
4.3. Influence of Na2CO3/NaHCO3 on the Formation of Ettringite and CaCO3
4.4. Influence of Na2CO3/NaHCO3 on the Enthalpies of the Reactions with C3S
5. Conclusions
- (1)
- The initial and final setting time of OPC paste decreased with the increase of either NaHCO3 or Na2CO3.
- (2)
- The addition of either NaHCO3 or Na2CO3 could increase the early age compressive strength (1 and 7 days) depending on the content added but they could decrease the compressive strength at later ages, such as 28 days, with the increase of content added.
- (3)
- As an accelerator, the optimum content of NaHCO3 and Na2CO3 were found to be in the same level as 1% of the weight of OPC. The addition 1% of either of the two accelerators could significantly shorten the setting time, increase the early age strength and did not have an obvious detrimental effect on the later age strength.
- (4)
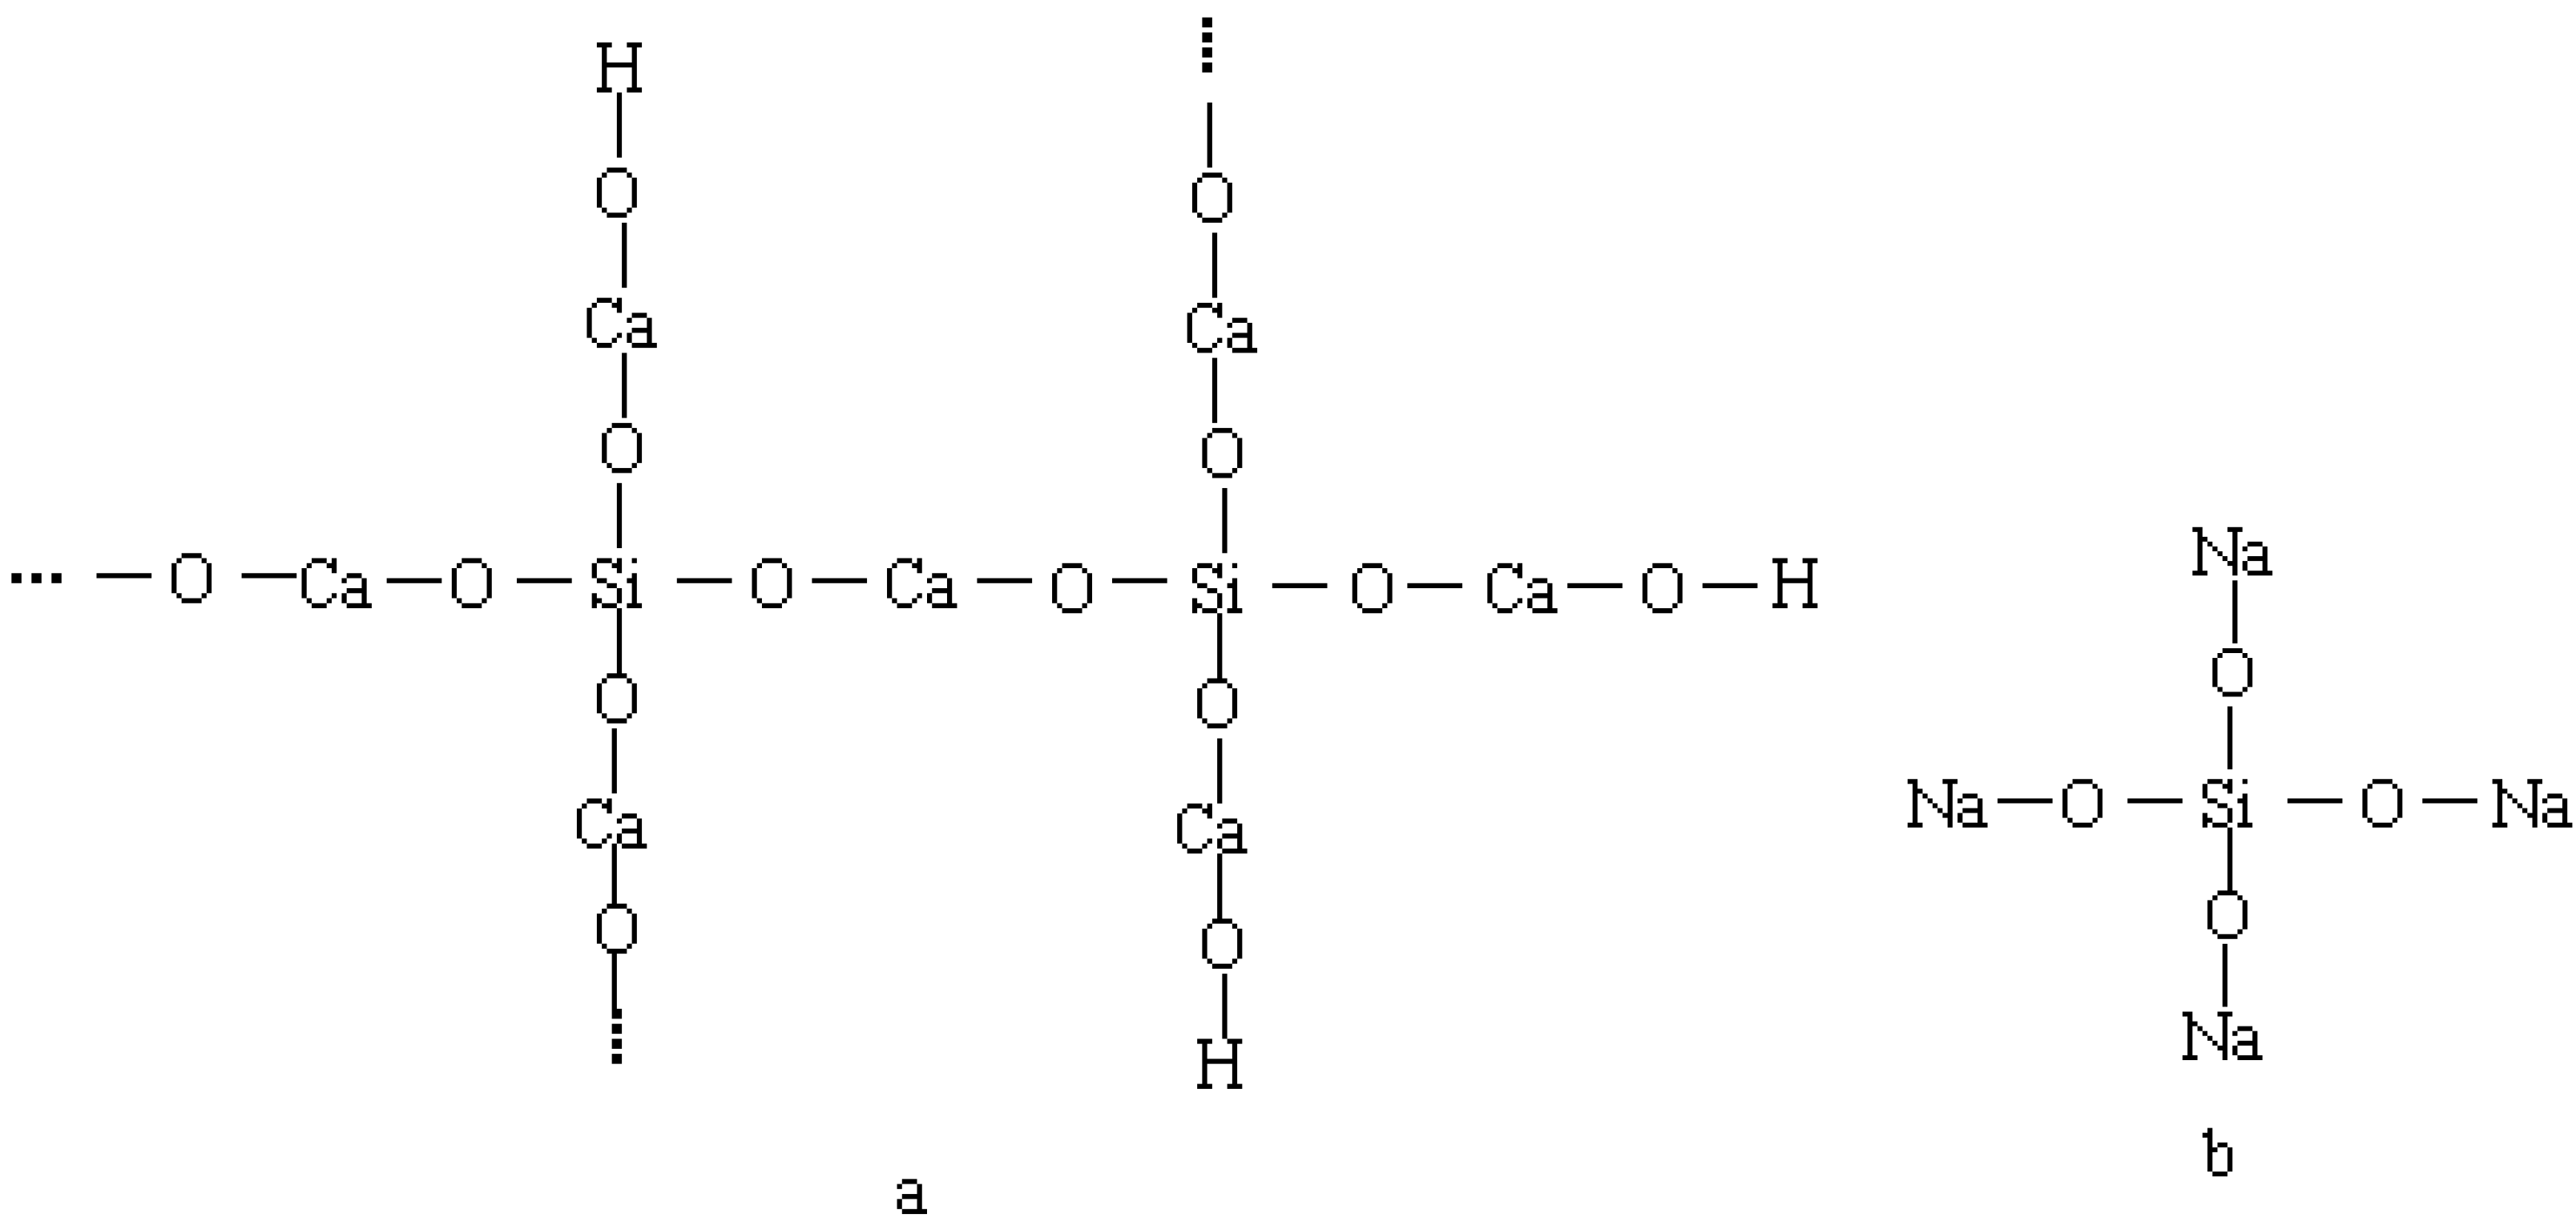
- Further increase of NaHCO3 and Na2CO3 above 1% could decrease the compressive strength of OPC paste although the ettringite formation was accelerated and increased. This decay was mainly caused by the Na+ ions introduced and the Na+ could partly replace the Ca2+ in the C-S-H gel and cause the discontinuity of the C-S-H gel.
- (5)
- NaHCO3 was seen to be a better option as an accelerator compared to Na2CO3. The reaction between NaHCO3 and C3S was found to be much easier than the reaction between Na2CO3 and C3S. The same amount addition of NaHCO3 resulted a higher compressive strength at all ages compared to NaHCO3. Besides, NaHCO3 the introduced less Na+ and more CO2 in the cementitious system than the Na2CO3 when the same amount of the two were used.
Author Contributions
Funding
Conflicts of Interest
References
- Ma, B.; Ma, M.; Shen, X.; Li, X.; Wu, X. Compatibility between a polycarboxylate superplasticizer and the belite-rich sulfoaluminate cement: Setting time and the hydration properties. Constr. Build. Mater. 2014, 51, 47–54. [Google Scholar] [CrossRef]
- Bamonte, P.; Gambarova, P.G.; Nafarieh, A. High-temperature behavior of structural and non-structural shotcretes. Cem. Concr. Compos. 2016, 73, 42–53. [Google Scholar] [CrossRef]
- De Belie, N.; Grosse, C.U.; Kurz, J.; Reinhardt, H. Ultrasound monitoring of the influence of different accelerating admixtures and cement types for shotcrete on setting and hardening behaviour. Cem. Concr. Res. 2005, 35, 2087–2094. [Google Scholar] [CrossRef]
- Won, J.; Choi, B.; Lee, J. Experimental and statistical analysis of the alkali–silica reaction of accelerating admixtures in shotcrete. Constr. Build. Mater. 2012, 30, 330–339. [Google Scholar] [CrossRef]
- Xie, J.; Wang, J.; Rao, R.; Wang, C.; Fang, C. Effects of combined usage of GGBS and fly ash on workability and mechanical properties of alkali activated geopolymer concrete with recycled aggregate. Compos. B Eng. 2019, 164, 179–190. [Google Scholar] [CrossRef]
- Hou, P.; Kawashima, S.; Kong, D.; Corr, D.J.; Qian, J.; Shah, S.P. Modification effects of colloidal nano SiO2 on cement hydration and its gel property. Compos. B Eng. 2013, 45, 440–448. [Google Scholar] [CrossRef]
- Meng, T.; Yu, Y.; Wang, Z. Effect of nano-CaCO3 slurry on the mechanical properties and micro-structure of concrete with and without fly ash. Compos. B Eng. 2017, 117, 124–129. [Google Scholar] [CrossRef]
- Nazari, A.; Riahi, S. The effects of zinc dioxide nanoparticles on flexural strength of self-compacting concrete. Compos. B Eng. 2011, 42, 167–175. [Google Scholar] [CrossRef]
- Jalal, M.; Ramezanianpour, A.A.; Pool, M.K. Split tensile strength of binary blended self compacting concrete containing low volume fly ash and TiO2 nanoparticles. Compos B Eng. 2013, 55, 324–337. [Google Scholar] [CrossRef]
- Brough, A.R.; Atkinson, A. Sodium silicate-based. alkali-activated slag mortars: Part I. Strength, hydration and microstructure. Cem. Concr. Res. 2002, 32, 865–879. [Google Scholar] [CrossRef]
- Li, G.; Li, C.; Zhou, W.; Wu, Y. Factors affecting the liquid sodium aluminate accelerated agent. Concrete 2005, 7, 54–58. [Google Scholar]
- Han, J.; Wang, K.; Shi, J.; Wang, Y. Influence of sodium aluminate on cement hydration and concrete properties. Constr. Build. Mater. 2014, 64, 342–349. [Google Scholar] [CrossRef]
- Tu, Z.; Shi, C.; Farzadnia, N. Effect of Limestone Powder Content on the Early-Age Properties of CO2-Cured Concrete. J. Mater. Civ. Eng. 2018, 30, 04018164. [Google Scholar] [CrossRef]
- Chong, L.; Shi, C.; Yang, J.; Jia, H. Effect of limestone powder on the water stability of magnesium phosphate cement-based materials. Constr. Build. Mater. 2017, 148, 590–598. [Google Scholar] [CrossRef]
- Wu, Z.; Shi, C.; Khayat, K.H. Multi-scale investigation of microstructure, fiber pullout behavior, and mechanical properties of ultra-high performance concrete with nano-CaCO3 particles. Cem. Concr. Compos. 2018, 86, 255–265. [Google Scholar] [CrossRef]
- Li, W.; Huang, Z.; Zu, T.; Shi, C.; Duan, W.H.; Shah, S.P. Influence of Nanolimestone on the Hydration, Mechanical Strength, and Autogenous Shrinkage of Ultrahigh-Performance Concrete. J. Mater. Civ. Eng. 2016, 28, 04015068. [Google Scholar] [CrossRef]
- Tu, Z.; Guo, M.; Poon, C.S.; Shi, C. Effects of limestone powder on CaCO3 precipitation in CO2 cured cement pastes. Cem. Concr. Compos. 2016, 72, 9–16. [Google Scholar] [CrossRef]
- Monosi, S.; Moriconi, G.; Collepardi, M. Combined effect of lignosulfonate and carbonate on pure portland clinker compounds hydration. III. Hydration of tricalcium silicate alone and in the presence of tricalcium aluminate. Cem. Concr. Res. 1982, 12, 425–435. [Google Scholar] [CrossRef]
- Krismahariyanto, M.; Saing, B.; Widodo, H. The Effects of Sodium Carbonate on the Properties and the Hydration of the Cement Mixed with the Hardening Accelerator Based on Calcium-Aluminate. AIP Conf. Proc. 2017, 1877, 090002. [Google Scholar]
- Jang, J.G.; Kim, H.J.; Park, S.M.; Lee, H.K. The influence of sodium hydrogen carbonate on the hydration of cement. Constr. Build. Mater. 2015, 94, 746–749. [Google Scholar] [CrossRef]
- Yang, H.; Che, Y. Effects of Nano-CaCO3/Limestone Composite Particles on the Hydration Products and Pore Structure of Cementitious Materials. Adv. Mater. Sci. Eng. 2018, 2018, 8. [Google Scholar] [CrossRef]
- Bernardi, A.; Bortoluzzi, E.A.; Felippe, W.T.; Felippe, M.C.S.; Wan, W.S.; Teixeira, C.S. Effects of the addition of nanoparticulate calcium carbonate on setting time, dimensional change, compressive strength, solubility and pH of MTA. Int. Endod. J. 2017, 50, 97–105. [Google Scholar] [CrossRef] [PubMed]
- Mathur, R.; Sharma, S.K. Magnesium oxysulphate cement: Change in properties on admixing sodium bicarbonate as an additive. Rasayan J.Chem. 2008, 1, 620–630. [Google Scholar]
- Chandrawat, M.P.S.; Yadav, R.N. Effect of sodium carbonate on some properties of magnesia cement. J. Indian Chem. Soc. 2001, 78, 389–391. [Google Scholar]
- Kunther, W.; Lothenbach, B.; Scrivener, K. Influence of bicarbonate ions on the deterioration of mortar bars in sulfate solutions. Cem. Concr. Res. 2013, 44, 77–86. [Google Scholar] [CrossRef]
- Kerui, Y.; Caiwen, Z.; Zhigang, L. The influence of calcium lignosulphonate–sodium bicarbonate on the status of ettringite crystallization in fly ash cement paste. Cem. Concr. Res. 2002, 32, 51–56. [Google Scholar] [CrossRef]
- Reddy, V.V.; Rao, H.S.; Jayaveera, K.N. Influence of strong alkaline substances (sodium carbonate and sodium bicarbonate) in mixing water on strength and setting properties of concrete. Indian J. Eng. Mater. Soc. 2006, 13, 123–128. [Google Scholar]
- Reddy, L.V.G.; Krishna, B. Influence of Na2CO3, NaHCO3 and Organic Substances (Algae) in Water on Physical Properties of Blended Pozzolonic Portland Cement. Int. J. Eng. Res. Technol. (IJERT). 2014, 3, 35–41. [Google Scholar]
- Golewski, G.L. Evaluation of morphology and size of cracks of the Interfacial Transition Zone (ITZ) in concrete containing fly ash (FA). J. Hazard. Mater. 2018, 357, 298–304. [Google Scholar] [CrossRef]
- Golewski, G.L. An assessment of microcracks in the Interfacial Transition Zone of durable concrete composites with fly ash additives. Compos. Struct. 2018, 200, 515–520. [Google Scholar] [CrossRef]
- Standardization Administration of the People’s Republic of China. GB175-2007: Common Portland Cement; China Architecture and Building Press: Beijing, China, 2007. [Google Scholar]
- Ministry of Housing and Urban-Rural Development. JC 477-2005 Flash Setting Admixtures for Shotcrete; Ministry of Housing and Urban-Rural Development: Beijing, China, 2005.
- Zhang, Y.; Wang, Y.; Li, T.; Xiong, Z.; Sun, Y. Effects of lithium carbonate on performances of sulphoaluminate cement-based dual liquid high water material and its mechanisms. Constr. Build. Mater. 2018, 161, 374–380. [Google Scholar] [CrossRef]
- Xiong, Z.; Wang, P.; Wang, Y. Hydration Behaviors of Portland Cement with Different Lithologic Stone Powders. Int. J. Concr. Struct. Mater. 2015, 9, 55–60. [Google Scholar] [CrossRef]
- Bensted, J.; Barnes, P. Structure & Performance of Cements; Taylor & Francis e-Library: London, UK; New York, NY, USA, 2008; pp. 90–91. [Google Scholar]
- Bullard, J.W.; Jennings, H.M.; Livingston, R.A.; Nonat, A.; Scherer, G.W.; Schweitzer, J.S.; Scrivener, K.L.; Thomas, J.J. Mechanisms of cement hydration. Cem. Concr. Res. 2011, 41, 1208–1223. [Google Scholar] [CrossRef]
- Edwards, G.C.; Angstadt, R.L. The effect of some soluble inorganic admixtures on the early hydration of portland cement. J. Appl. Chem. 2007, 16, 166–168. [Google Scholar] [CrossRef]
- Abdalqader, A.F.; Jin, F.; Al-Tabbaa, A. Development of greener alkali-activated cement: Utilisation of sodium carbonate for activating slag and fly ash mixtures. J. Clean. Prod. 2016, 113, 66–75. [Google Scholar] [CrossRef]
- Yuan, B.; Straub, C.; Segers, S.; Yu, Q.L.; Brouwers, H.J.H. Sodium carbonate activated slag as cement replacement in autoclaved aerated concrete. Ceram. Int. 2017, 43, 6039–6047. [Google Scholar] [CrossRef]
- Kresse, G.; Furthmuller, J. Efficient iterative schemes for ab initio total-energy calculations using a plane-wave basis set. Phys. Rev. B 1996, 54, 11169–11186. [Google Scholar] [CrossRef]


| Fineness/% | Stability | Setting Time/min | Flexural Strength/MPa | Compressive Strength/MPa | |||
|---|---|---|---|---|---|---|---|
| Initial | Final | 3 days | 28 days | 3 days | 28 days | ||
| 1.5 | Qualified | 181 | 378 | 5.1 | 9.3 | 25.3 | 51.6 |
| SiO2 | CaO | Al2O3 | Fe2O3 | MgO | Na2O | K2O | LOI |
|---|---|---|---|---|---|---|---|
| 22.96 | 63.87 | 5.73 | 3.31 | 2.64 | 0.32 | 0.23 | 0.18 |
| C3S | C2S | C3A | C4AF |
|---|---|---|---|
| 54.5 | 19.23 | 8.36 | 10.14 |
| Mix ID | OPC/% | Superplasticizer/% | NaHCO3/% | Na2CO3/% | W/C |
|---|---|---|---|---|---|
| 1 | 100 | 0.5 | 0 | 0 | 0.35 |
| 2 | 1 | - | |||
| 3 | 2 | - | |||
| 4 | 3 | - | |||
| 5 | 4 | - | |||
| 6 | - | 1 | |||
| 7 | - | 2 | |||
| 8 | - | 3 | |||
| 9 | - | 4 |
© 2019 by the authors. Licensee MDPI, Basel, Switzerland. This article is an open access article distributed under the terms and conditions of the Creative Commons Attribution (CC BY) license (http://creativecommons.org/licenses/by/4.0/).
Share and Cite
Wang, Y.; He, F.; Wang, J.; Hu, Q. Comparison of Effects of Sodium Bicarbonate and Sodium Carbonate on the Hydration and Properties of Portland Cement Paste. Materials 2019, 12, 1033. https://doi.org/10.3390/ma12071033
Wang Y, He F, Wang J, Hu Q. Comparison of Effects of Sodium Bicarbonate and Sodium Carbonate on the Hydration and Properties of Portland Cement Paste. Materials. 2019; 12(7):1033. https://doi.org/10.3390/ma12071033
Chicago/Turabian StyleWang, Yuli, Fengxia He, Junjie Wang, and Qianku Hu. 2019. "Comparison of Effects of Sodium Bicarbonate and Sodium Carbonate on the Hydration and Properties of Portland Cement Paste" Materials 12, no. 7: 1033. https://doi.org/10.3390/ma12071033
APA StyleWang, Y., He, F., Wang, J., & Hu, Q. (2019). Comparison of Effects of Sodium Bicarbonate and Sodium Carbonate on the Hydration and Properties of Portland Cement Paste. Materials, 12(7), 1033. https://doi.org/10.3390/ma12071033