Abstract
In the present study, the groups of cutting conditions that minimize surface roughness and its variability are determined, in ball-end milling operations. Design of experiments is used to define experimental tests performed. Semi-cylindrical specimens are employed in order to study surfaces with different slopes. Roughness was measured at different slopes, corresponding to inclination angles of 15°, 45°, 75°, 90°, 105°, 135° and 165° for both climb and conventional milling. By means of regression analysis, second order models are obtained for average roughness Ra and total height of profile Rt for both climb and conventional milling. Considered variables were axial depth of cut ap, radial depth of cut ae, feed per tooth fz, cutting speed vc, and inclination angle Ang. The parameter ae was the most significant parameter for both Ra and Rt in regression models. Artificial neural networks (ANN) are used to obtain models for both Ra and Rt as a function of the same variables. ANN models provided high correlation values. Finally, the optimal machining strategy is selected from the experimental results of both average and standard deviation of roughness. As a general trend, climb milling is recommended in descendant trajectories and conventional milling is recommended in ascendant trajectories. This study will allow the selection of appropriate cutting conditions and machining strategies in the ball-end milling process.
1. Introduction
In order to increase productivity and reduce costs, it is important to choose appropriate cutting conditions in high speed milling (HSM) processes because they will influence surface roughness and the dimensional precision obtained. For example, the tool inclination angle significantly influences the surface roughness obtained. When the tool is perpendicular to the workpiece’s surface, cutting speed is zero at the tool tip [1,2]. This implies that the tool tends to crush the material instead of cutting it.
In mathematical modeling of machining processes several methods can be used, such as statistical regression techniques, artificial neural network modeling techniques (ANN), and fuzzy set theory-based modeling [3]. Neural networks provide a relationship between input and output variables by means of mathematical functions, to which different weights are applied. A training algorithm is defined that consists of adjusting the weights of a network that minimize error between actual and desired outputs [4]. In recent times, neural networks have been used for modeling and predicting surface roughness in different machining operations. For example, Feng et al. modeled roughness parameters related to the Abbott–Firestone curve by means of ANN in honing operations [5] and in turning processes [6]. Özel et al. [7] and Sonar et al. [8] also employed ANN for modeling average roughness Ra, in turning processes. Moreover, simulations of machined surfaces have also been extensively investigated. Among many other studies, T. Gao et al. [9] developed a new method for the prediction of the machined surface topography in the milling process and Honeycutt and Schmitz [10] employed time domain simulation and experimental results for surface location error and surface roughness prediction. Vallejo and Morales-Menendez [11] used neural networks for modeling Ra in peripheral milling, with different input variables, such as feed per tooth, cutting tool diameter, radial depth of cut, and Brinell hardness. Zain et al. [12] modeled surface roughness with cutting speed, feed rate and radial rake angle as input variables in peripheral milling, and Quintana et al. [13] employed neural networks for studying average roughness in vertical milling. Regarding ball-end milling processes, Zhou et al. [14] used grey relational analysis (GRA) with neural network and particle swarm (PSO) algorithm to model 3D root mean square deviation of height value Sq, and compressive residual stresses, with tilt angle, cutting speed and feed as variables.
With regard to the modeling of milling processes by conventional regression models, several models have been developed, but most studies do not consider the variability which occurs as a consequence of the slope variations and which is developed in this study. Vivancos et al. [15] obtained mathematical models for arithmetic average roughness in ball-end milling operations by means of design of experiments, while Dhokia et al. [16] used design of experiments in ball-end milling to obtain models as a function of speed, feed and depth of cut. Oktem et al. [17] searched for minimum values in end milling taking into account cutting speed, feed rate, axial and radial depth of cut, and machining tolerance as input variables. In addition, they compared a response surface model with a neural network model [18]. It was observed that ANN lead to more accurate models than response surface methodology (RSM). Karkalos et al. [19] also compared regression models with ANN models in ball-end milling, with cutting speed, feed and depth of cut as variables and surface roughness as response. They found a higher correlation coefficient for ANN models than for RSM models. Vakondios et al. [20] obtained third order regression models for average maximum height of the profile Rz, as a function of axial depth of cut, radial depth of cut, feed rate and inclination angle, taking into account different manufacturing strategies. Wojciechowski and et al. [21] obtained a model for determining cutter displacements in ball-end milling. They took into account cutting conditions, surface inclination angle, run out, and the tool’s deflection. They found that both the cutter’s runout and surface inclination strongly influence cutter displacement. Wojciechowski and Mrozek optimized cutting forces and efficiency of the ball-end milling as a function of cutting speed and surface inclination angle [22]. Regarding Taguchi design of experiments, Pillai et al. [23] optimized machining time and surface roughness as a function of tool path strategic, spindle speed and feed rate in end milling with a single flute tool.
The main purpose of this study is to select an optimal machining strategy between climb and conventional milling in ball-end milling processes. For doing this, first mathematical models for roughness as a function of main process parameters were found. Unlike other works, in the present paper inclination angle of the surface to be machined is taken into account. Specifically, regression models and neural network models were obtained for parameters average roughness Ra, and total height of profile Rt. Finally, an optimal machining strategy was selected between climb and conventional milling for the different inclination angles considered. This will help molds and dies manufacturers to select appropriate strategies and cutting conditions in finish operations of surfaces with different inclination angles.
2. Experimental Procedure
2.1. Milling Tests
In the present study a factorial design of experiments was used for selecting experimental conditions in the ball-end milling process. The purpose of experimental tests is to analyze variability in the machining process of parts for injection molds, by means of several measurements performed on different areas of the machined workpieces with different inclinations. Two strategies were considered: climb milling and conventional milling.
The workpieces were manufactured in an HSM center with vertical-spindle Deckel Maho DMU 50 Evolution (DMG Mori Seiki Co, Nakamura-ku, Nagoya, Japan) with Heidenhain control TNC 430 (Dr. Johannes Heidenhain GmbH, Traunreut, Germany), as shown in Figure 1, and tool holder MST Ref. DN40AD-CTH20-75. Tool details are presented in Table 1.
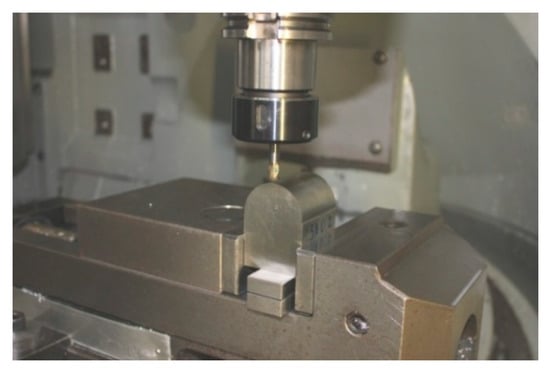
Figure 1.
Manufactured part and high-speed machining center employed.

Table 1.
Tool details.
Tools employed were new or had little wear (average flank wear VB < 0.1 mm), in order to avoid influence of wear on surface roughness. Only three axes (X-Y-Z) were used.
Semi-cylindrical workpieces were machined in order to assess the effect of slope on surface roughness (Figure 2a). The material used for manufacturing the parts was a hot work tool steel W-Nr. 1.2344, hardened steel (50-54 HRC), with an approximate composition of 0.39% C, 1.10% Si, 0.40% Mn, 5.20% Cr, 1.40% Mo and 0.95% V.
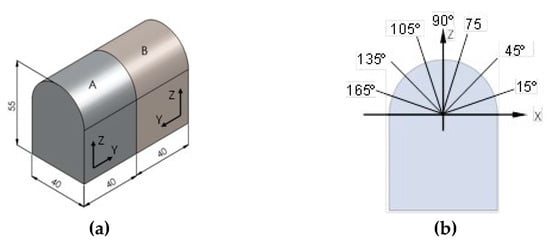
Figure 2.
Schematic drawing of (a) machined workpiece (units in mm), (b) measured position angles.
A central composite design was chosen for modeling the behavior of both Ra and Rt, consisting of a two level factorial design with 4 factors (24 = 16 experiments), with 4 central points. Since first-order models turned out to be inadequate for modeling both behavior of Ra and Rt, 8 star points were added, thus providing an orthogonal design with star points located at an axial distance of 1.60717. Selected factors were feed per tooth (fz), axial depth (ap), cutting speed (vc), and radial depth (ae). The study was developed for finish machining. Low and high levels for the different factors are shown in Table 2.
Table 2.
Low and high levels for factors ae, ap, fz and vc.
For each experiment, roughness was measured at different angular positions corresponding to different inclination angles of the workpiece’s surface, as explained in Section 2.2 (Figure 2).
2.2. Roughness Measurement
Roughness was measured along different generatrices of the semi-cylindrical part in Figure 2a, corresponding to different angular positions (15°, 45°, 75°, 90°, 105°, 135° and 165°) in Figure 2b. Moreover, influence of milling strategy, either climb (down) milling (Figure 3a) or conventional (up) milling (Figure 3b), on surface roughness was also analyzed (Figure 3).
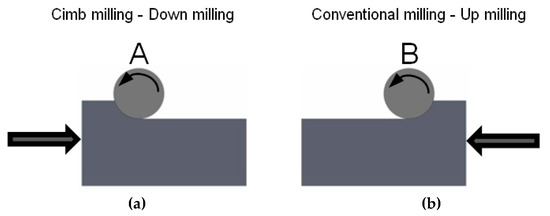
Figure 3.
Schematic drawing of milling strategies. (a) climb (down) milling; (b) conventional (up) milling.
Roughness parameters Ra and Rt were measured using a Taylor-Hobson Form Taylsurf Series 2 profile roughness tester (as Figure 4b shows). An evaluation length of 4.8 mm (6 × 0.8 mm) was used, and a 2 μm radius stylus tip was used in conjunction with a 0.8 Gaussian cut-off filter and a bandwidth ratio of 320:1 to evaluate the Ra and Rt parameters. A stylus speed of 0.5 mm/s was used in conjunction with a 0.8 mN static stylus force and the stylus cone angle used was 90°.
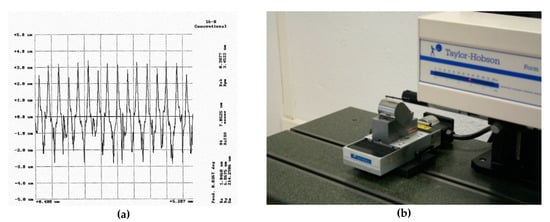
Figure 4.
(a) Example of roughness profile; (b) Taylor-Hobson Form Taylsurf Series 2 profile roughness tester.
Figure 4a shows an example of a roughness profile. A quite regular profile with higher peaks than valleys was observed, which corresponds to ball-end milling. Although a high number of roughness parameters were measured, as shown in Figure 4a, parameters Ra and Rt were selected in order to obtain results related to a high averaging parameter (Ra) and a low averaging parameter (Rt). In addition, both roughness parameters are commonly used in roughness characterization [13,24].
2.3. Photographs
A Leica S8AP0 binocular magnifier (Leica Camera AG, Wetzlar, Germany) was used to obtain photographs of the workpiece’s surface at 80× magnification.
3. Surface Roughness Results
In Table 3, as an example, roughness values of experiment 16 are compared, considering both A and B manufacturing strategies, respectively, at different angles which correspond to ascendant and descendant trajectories. Experiment 16 was chosen because it corresponds to high ap, ae, fz, and vc values (cutting conditions shown in Table 2), which lead to higher roughness values. In the images, changes of surface topography can be observed as a function of machining strategy (conventional or climb milling), position angle of the machined surface, and whether the tool displacement along fz trajectory is ascendant or descendant. According to the methodology explained in Section 2, different slopes of the machined semi-cylindrical workpieces were considered. For 15°, 45° and 75° in climb milling (Figure 3a), corresponding to 165°, 135° and 105° in conventional milling (Figure 3b), the tool displacement is ascendant. For 105°, 135° and 165° in climb milling, corresponding to 75°, 45° and 15° in conventional milling, the tool displacement is descendant.
In climb milling, roughness values remain almost constant between 15° and 45° and decrease significantly from 45° to 75° in the ascendant trajectory. Values increase at 90° because of a lack of cutting speed and decrease at 105°. In the descendant trajectory, values decrease slightly between 105° and 135° and remain almost constant between 105° and 165°. In conventional milling, similar results were obtained. As a general trend, lower roughness values were obtained for conventional milling than for climb milling in the ascendant trajectory, and higher roughness values were obtained for conventional milling than for climb milling in the descendant trajectory.
In Figure 5, machined surfaces of experiment 16 are presented.
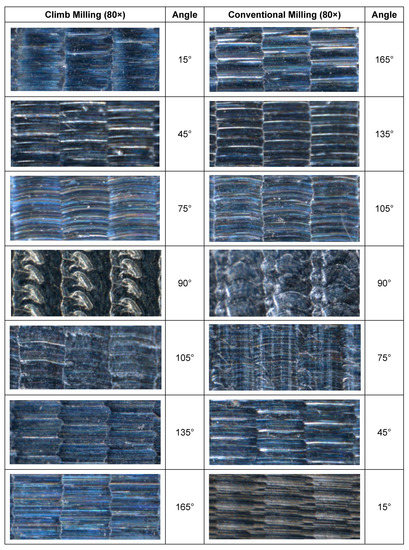
Figure 5.
Machined surfaces corresponding to experiment 16.
In experiment 16, for each angle considered, surface topography obtained in climb milling is similar to that obtained in conventional milling. However, Table 3 shows that in general, when fz trajectory is ascendant, roughness is lower for conventional milling (165° to 135°) than for climb milling (15° to 45°). On the other hand, when fz trajectory is descendant, roughness is lower for climb milling (135° to 165°) than for conventional milling (45° to 15°). At 90°, instead of straight cutting marks, semicircular cutting marks are observed, suggesting that the tool does not cut properly because of zero cutting speed [1,2].
4. Models for Surface Roughness
In this study, first the main cutting conditions that minimize Ra and Rt roughness parameters and their variability were selected. In addition to strategies and cutting conditions, inclination of the machined surface was considered, as there seems to be a lack of knowledge on the attained roughness in the manufacturing process of molds when different slopes have to be machined. Within the range of ae and fz values studied, surface topography is mainly determined by roughness in the transversal direction, which is perpendicular to tool marks in the feed fz direction. Along tool marks the roughness level is remarkably low, since fz < ae [24,25]. For this reason, 2D roughness was studied along the transversal direction (perpendicular to tool marks).
Vivancos et al. [15] previously analyzed this behavior by considering four factors (ap, ae, fz and vc) in regression models and by taking into account average roughness values in the whole workpiece without considering influence of each position angle separately. In order to obtain a more accurate analysis, it is necessary to consider the effect of each surface slope on obtained roughness, which is one of the core points of this work. Vakondios et al. [20] considered surface inclination in regression models for average maximum height of the profile, Rz. In the present study, regression analysis was carried out considering not only cutting conditions but also position angle of the surface on two different roughness parameters, Ra and Rt. Both regression and neural networks models were obtained. All regression analyses were carried out using Statgraphics® Centurion XVI. Regarding neural network models, the results found in this study were obtained by using the Neural Network ToolboxTM (São Paulo, Brazil) of MatlabTM (Mathworks, Natick, MA, USA). In addition, the optimal cutting strategy between climb and conventional milling was selected for different cutting conditions and inclination angles.
4.1. Regression Models and Analysis of Arithmetic Average Roughness, Ra
Ra was modeled by means of regression analysis, taking into account variability due to cylindrical geometry of the workpiece studied in this present work. In order to model the behavior of Ra for both manufacturing strategies (climb milling and conventional milling), second-order models were selected after analyzing p-values obtained from the lack-of-fit test performed with the first order modeling (3.0 × 10⁻¹² and 3.04 × 10⁻⁴, respectively). Since these p-values for the lack-of-fit are less than 0.05, there is a statistically significant lack-of-fit at the 95.0% confidence level, which means that first order models do not adequately represent the data. R2 and adjusted-R2 were 68.43% and 67.25% for climb milling, respectively, while R2 and adjusted-R2 were 69.40% and 68.26% for conventional milling, respectively.
Since there is lack of fit with the first order model, second order models were considered. For Ra in climb milling, the R2 and adjusted-R2 are 79.48% and 77.64%, respectively, and equations were obtained so that adjusted- R2 is maximized. Four main effects (ae, Ang, vc and fz) turned out to be relevant in the model in order to obtain the highest adjusted-R2. Parameters ae and ae 2 turned out to be the most significant for a confidence level of 95% (α = 0.05) (p-values ≤ 0.01). As can be observed in Figure 6, surface roughness remains almost constant with respect to ap, vc and fz. Moreover, it can be shown that Ra has a quadratic tendency with regard to ae, where ae is the parameter that most influences Ra. Therefore, minimization of ae will lead to a reduction in roughness values. This can be attributed to the fact that ae determines width of machining marks, and in addition fz values are low. In the study the rest of the factors are kept at their central values. Moreover, it can be shown that Ra has a quadratic tendency with regard to Ang.
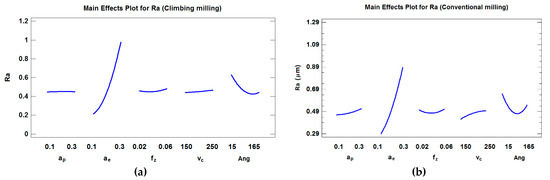
Figure 6.
Main effects plot for Ra (considering the position angle) in (a) climb milling and (b) conventional milling.
Equations (1) and (2) show the proposed modeling for Ra using both climb and conventional milling. For Ra in conventional milling, R2 and adjusted-R2 are 76.52% and 73.84%, respectively. Four main effects (ae, vc, Ang and ap,) turned out to be relevant in the model in order to obtain the highest adjusted-R2. Similar to the results obtained in climb milling, ae and ae2 were the most significant factors at a confidence level of 95% (α = 0.05) (p-values ≤ 0.01).
As can be observed in Figure 6, surface roughness has a quadratic tendency with regard to ae, and a slight slope with respect to both ap and vc. In this case, factor fz was not significant in the model that provides the highest adjusted-R2. Moreover, a quadratic tendency with regard to the angle was observed. Conventional milling (Figure 6b) follows a similar tendency to climb milling (Figure 6a) regarding ae, which is the most significant parameter. However, this influence is smaller than that obtained in climb milling.
4.2. Regression Models and Analysis of Maximum Peak-to-Valley Roughness Rt
Similar to the results obtained for Ra, the behavior of Rt was modeled, taking into account variability due to cylindrical geometry of the workpiece studied. In order to model the behavior of Rt in both manufacturing strategies (climb and conventional milling), second-order models were selected after analyzing p-values obtained from the lack-of-fit test performed with the first order modeling (5.52 × 10⁻⁵ and 1.14 × 10⁻²⁶, respectively). In all cases, obtained equations were simplified in order to obtain models with the highest adjusted-R2.
For Rt, in climb milling the R2 and adjusted-R2 are 78.04% and 75.53%, respectively. Four main effects (ae, Ang, fz and ap,) were present in the model in order to obtain the highest adjusted-R2. The parameters ae and ae2 were the most important parameters at a confidence level of 95% (α = 0.05) (p-values ≤ 0.01) (Figure 7a). For Rt, in conventional milling R2 and adjusted-R2 were 63.03% and 58.80%, respectively. Three main effects (ae, ap, and Ang) were present in the model in order to obtain the highest adjusted-R2. Similar to the result obtained for climb milling, ae and ae2 were the most important parameters at a confidence level of 95% (α = 0.05) (p-values ≤ 0.01) (Figure 7b). Equations (3) and (4) show the regression analysis for Rt, taking the angle into account and considering both climb milling and conventional milling.
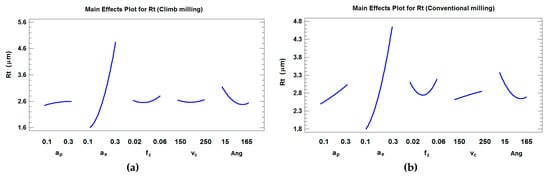
Figure 7.
Main effects plot for Rt (considering the position angle) in (a) climb milling and (b) conventional milling.
As can be observed in Figure 6, ae is the most influential parameter on Rt in both climb and conventional milling, which is similar to the results obtained for Ra in the present paper and for Rz parameter in other works [19,20]. Surface roughness has a quadratic behavior with respect to ae in climb and conventional milling, and a slight slope with both ap and vc in conventional milling. In climb milling, surface roughness remains almost constant with respect to ap, fz and vc. The fact that ae has a greater influence on roughness than fz in ball-end milling processes can be explained by the fact that at low radial depth of cut ae, the influence of feed per tooth fz is minimized by the tool performing very close successive passes in the ae direction. Very close parallel grooves will be obtained. Thus, very similar roughness values will be achieved regardless of fz employed for the same ae value [24].
4.3. ANN Modeling for Ra and Rt
An artificial neural network (ANN) was also employed in this present study for modeling both Ra and Rt. This ANN was made up of an input layer, a hidden layer, and an output layer. The neural network considered in this work has a 5-1-4 configuration, which corresponds with five inputs (the four cutting conditions uses in regression analysis (ae, ap, fz, and vc) and the position angle of the surface (Ang), which is related to the slope of the surface to be machined. The network has one neuron in the hidden layer, and four outputs, one for each of the roughness parameters and machining strategies considered. Equation (5) shows the roughness parameters Ra and Rt for both machining strategies as a function of ap, ae, fz, vc, and Ang.
where Climb. corresponds to climb milling and Conv. Corresponds to conventional milling.
The design of experiments, previously shown in Table 2, was used to train the ANN. It was decided to choose one neural network with four outputs, since the results obtained were similar to those obtained for independent networks for each output. With this ANN a correlation value of 0.914 was obtained. This value is similar to that obtained by other authors with ANN models [19]. Hence, ANN 5-1-4 provides a relatively simple model with high precision, which in a compact way allows approximation of Ra and Rt roughness parameters in both machining strategies studied. This might be attributed to the fact that roughness parameters are related and they show similar variability.
4.4. Optimal Manufacturing Strategy Selection
In order to compare both machining strategies, a diagram of both average roughness values and standard deviations of roughness values obtained at different inclination angles for the 28 experiments considered is shown in Figure 7 and Figure 8, for Ra and Rt, respectively. From these figures it is possible to determine which machining strategy is more appropriate for the cutting conditions selected in this present work.
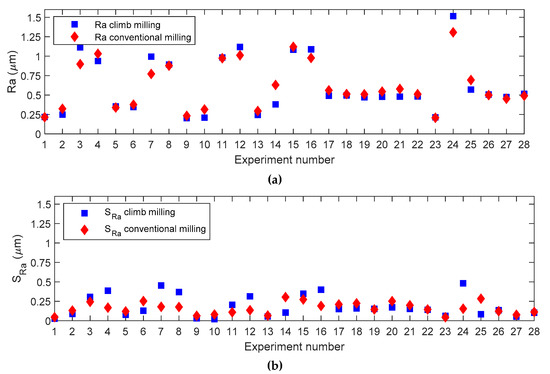
Figure 8.
Experimental deviation plots for Ra considering both manufacturing strategies: (a) Mean, (b) standard deviation.
Figure 8a shows that average Ra values are very similar for both climb milling and conventional milling, if the same experiment is taken into consideration. However, in surfaces with variable inclinations, such as those found in injection molds, it is interesting not only to minimize roughness average values, but also its variability for different inclination angles. This will lead to a more uniform surface roughness. Then, in order to minimize variability (Figure 8b), the use of conventional milling is recommended in experiments 3, 4, 7, 8, 11, 12, 15, 16, and 24. Those experiments have a general tendency to exhibit high ae values (ae = 0.3 mm). Using climb milling is recommended in experiments 2, 5, 6, 9, 10, 14, 17, 18, 20, 21, 25, and 27, which in general correspond with low and medium ae values (ae = 0.1 mm and ae = 0.2 mm, respectively).
For the remainder of experiments, similar values were obtained for both conventional and climb milling. Figure 9a also shows that average Rt values are similar for both machining strategies. However, variability (Figure 9b) determines that conventional milling is recommended in experiments 7, 11, 12, 13, 15, 16, and 24. As a general trend, those experiments correspond to high ae values (ae = 0.3 mm), with high vc values (vc = 250 m/min). Climb milling is recommended in experiments 2, 3, 4, 5, 6, 10, 14, 17, 18, 19, 20, 21, 22, 25, and 26, which correspond to maximum ae with minimum vc, minimum ae with maximum vc, or medium ae with medium vc values. For the rest of experiments, the values obtained are similar.
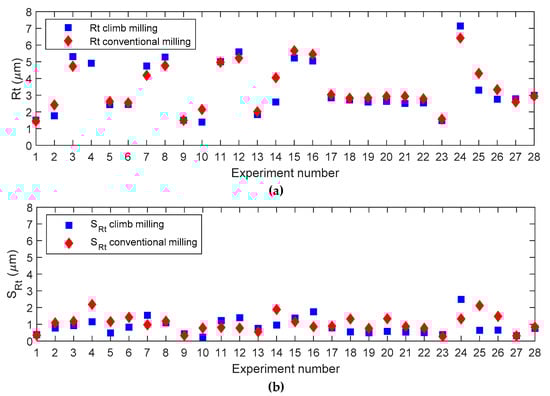
Figure 9.
Experimental deviation plots for Rt considering both manufacturing strategies: (a) Mean, (b) standard deviation.
Ra and Rt average values do not vary significantly between climb and conventional milling. Given that mold manufacturers require roughness uniformity at different inclination angles of the machined surface, the most appropriate process will be chosen between conventional and climb milling, taking variability into account in the experiments studied (Table 4). Therefore, a manufacturing strategy will be selected that minimizes variability of roughness values in different angular positions. If Ra and Rt show opposite tendencies, a manufacturing strategy will be preferred that minimizes Rt, since Ra is a high-averaging parameter and, therefore, tends to mask errors on the machined surface. This does not happen with Rt. In the case where both strategies lead to the same Rt variability, then the strategy minimizing Ra variability will be chosen.
Table 4.
Optimal machining strategy selection.
Table 4 summarizes the type of machining strategy that is recommended for each cutting condition and for each cutting strategy. The table shows that in 17 of 28 cutting conditions tested, climb milling is preferred. Conventional milling is only preferred in 8 cutting conditions, which in general corresponds with high ae with high vc. For the rest of the experiments, it makes no difference whether one or the other machining strategy is used. As was stated earlier, minimization of Rt has priority with respect to minimization of Ra. Std means standard deviation of roughness values for the different inclination angles. Conv. Milling stands for conventional milling.
Regarding influence of angle, for both strategies (climb and conventional milling), when angle increases roughness decreases. However, it should be taken into account that high angles in climb milling (descendant trajectory) correspond to low angles in conventional milling (descendant trajectory), and low angles in climb milling (ascendant trajectory) correspond to high angles in conventional milling (ascendant trajectory). With all this, it is recommended to use climb milling in descendant trajectories and conventional milling in ascendant trajectories.
5. Conclusions
In the present study, as a general tendency climb milling is preferred to conventional milling. In general, conventional milling is only recommended at a high radial depth of cut with high cutting speed values. In order to reduce roughness values, in ascendant trajectories conventional milling is preferred and in descendant trajectories climb milling is recommended.
From the results obtained, it was determined that radial depth of cut was the most relevant factor on Ra and Rt for both climb and conventional milling. Axial depth of cut, cutting speed and feed per tooth have a slight influence on roughness within the range studied in this study. Regression models for average roughness showed high adjusted-R2 values (above 73%) in all cases. Moreover, a correlation value of 0.914 was obtained with the neural network model employed.
Experimental roughness values obtained with both strategies (climb and conventional milling) were similar. However, in complex surfaces with variable inclination, such as those of injection molds, it is recommended not only to minimize roughness average values, but also its variability for different inclination angles. This will lead to more uniform surfaces. In the present study, it was found that the standard deviation of roughness parameters varies depending on the machining strategy chosen, for the different experiments carried out.
Author Contributions
All the authors of this present manuscript have approximately equally contributed to most of the research tasks.
Funding
This research was funded by the Spanish Ministry of Science and Technology, grant number DPI 2003-04727.
Acknowledgments
The authors thank Ramón Casado-López and Alejandro Domínguez-Fernández for their help with experimental tests and roughness measurements.
Conflicts of Interest
The authors declare no conflict of interest.
References
- Denkena, B.; Böß, V.; Nespor, D.; Gilge, P.; Hohenstein, S.; Seume, J. Prediction of the 3D Surface Topography after Ball End Milling and its Influence on Aerodynamics. Procedia CIRP 2015, 31, 221–227. [Google Scholar] [CrossRef]
- Toh, C.K. Surface topography analysis in high speed finish milling inclined hardened steel. Precis. Eng. 2014, 28, 386–398. [Google Scholar] [CrossRef]
- Mukherjee, I.; Ray, P.K. A review of optimization techniques in metal cutting processes. Comput. Ind. Eng. 2006, 50, 15–34. [Google Scholar] [CrossRef]
- Asiltürk, I.; Çunkas, M. Modeling and prediction of surface roughness in turning operations using artificial neural network and multiple regression method. Expert Syst. Appl. 2011, 38, 5826–5832. [Google Scholar] [CrossRef]
- Feng, C.X.; Wang, X.; Yu, Z. Neural networks modeling of honing surface roughness parameters defined by ISO 13565. J. Manuf. Syst. 2003, 21, 395–408. [Google Scholar] [CrossRef]
- Feng, C.X.; Wang, X.F. Development of empirical models for surface roughness prediction in finish turning. Int. J. Adv. Manuf. Technol. 2002, 20, 348–356. [Google Scholar]
- Özel, T.; Esteves Correia, A.; Paulo Davim, J. Neural network process modeling for turning of steel parts using conventional and wiper inserts. Int. J. Mater. Product Technol. 2009, 35, 246–258. [Google Scholar] [CrossRef]
- Sonar, D.K.; Dixit, U.S.; Ojha, D.K. The application of a radial basis function neural network for predicting the surface roughness in a turning process. Int. J. Adv. Manuf. Technol. 2006, 27, 661–666. [Google Scholar] [CrossRef]
- Gao, T.; Zhang, W.; Qiu, K.; Wan, M. Numerical Simulation of Machined Surface Topography and Roughness in Milling Process. J. Manuf. Sci. Eng. 2015, 128, 96–103. [Google Scholar] [CrossRef]
- Honeycutt, A.; Schmitz, T.L. Surface Location Error and Surface Roughness for Period-N Milling Bifurcations. J. Manuf. Sci. Eng. 2017, 139, 061010. [Google Scholar] [CrossRef]
- Vallejo, A.J.; Morales-Menendez, R. Cost-effective supervisory control system in peripheral milling using HSM. Annu. Rev. Control 2010, 34, 155–162. [Google Scholar] [CrossRef]
- Zain, A.M.; Haron, H.; Sharif, S. Prediction of surface roughness in the end milling machining using Artificial Neural Network. Expert Syst. Appl. 2010, 37, 1755–1768. [Google Scholar] [CrossRef]
- Quintana, G.; Rudolf, T.; Ciurana, J.; Brecher, C. Using kernel data in machine tools for the indirect evaluation of surface roughness in vertical milling operations. Robot. Comput.-Integr. Manuf. 2011, 27, 1011–1018. [Google Scholar] [CrossRef]
- Zhou, J.; Ren, J.; Yao, C. Multi-objective optimization of multi-axis ball-end milling Inconel 718 via grey relational analysis coupled with RBF neural network and PSO algorithm. Measurement 2017, 102, 271–285. [Google Scholar] [CrossRef]
- Vivancos, J.; Luis, C.J.; Costa, L.; Ortiz, J.A. Optimal machining parameters selection in high speed milling of hardened steels for injection moulds. J. Mater. Process. Technol. 2004, 155, 1505–1512. [Google Scholar] [CrossRef]
- Dhokia, V.G.; Kumar, S.; Vichare, P.; Newman, S.T. An intelligent approach for the prediction of surface roughness in ball-end machining of polypropylene. Robot. Comput-Integr. Manuf. 2008, 24, 835–842. [Google Scholar] [CrossRef]
- Oktem, H.; Erzurumlu, T.; Erzincanli, F. Prediction of minimum surface roughness in end milling mold parts using neural network and genetic algorithm. Mater. Des. 2006, 27, 735–744. [Google Scholar] [CrossRef]
- Erzurumlu, T.; Oktem, H. Comparison of response surface model with neural network in determining the surface quality of moulded parts. Mater. Des. 2007, 28, 459–465. [Google Scholar] [CrossRef]
- Karkalos, N.E.; Galanis, N.I.; Markopoulos, A.P. Surface roughness prediction for the milling of Ti-6Al-4V ELI alloy with the use of statistical and soft computing techniques. Measurement 2016, 90, 25–35. [Google Scholar] [CrossRef]
- Vakondios, D.; Kyratsis, P.; Yaldiz, S.; Antoniadis, A. Influence of milling strategy on the Surface roughness in ball end milling of the aluminium alloy Al7075-T6. Measurement 2012, 45, 1480–1488. [Google Scholar] [CrossRef]
- Wojciechowski, S.; Chwalczuk, T.; Twardowski, P.; Krolczyk, G.M. Modeling of cutter displacements during ball end milling of inclined surfaces. Arch. Civil Mech. Eng. 2015, 15, 798–805. [Google Scholar] [CrossRef]
- Wojciechowski, S.; Mrozek, K. Mechanical and technological aspects of micro ball end milling with various tool inclinations. Int. J. Mech. Sci. 2017, 134, 424–435. [Google Scholar] [CrossRef]
- Pillai, J.U.; Sanghrajka, I.; Shunmugavel, M.; Muthurmalingam, T.; Goldberg, M.; Littlefair, G. Optimisation of multiple response characteristics on end milling of aluminium alloy using Taguchi-Grey relational approach. Measurement 2018, 124, 291–298. [Google Scholar] [CrossRef]
- Buj-Corral, I.; Vivancos-Calvet, J.; Domínguez-Fernández, A. Surface topography in ball-end milling processes as a function of feed per tooth and radial depth of cut. Int. J. Mach. Tools Manuf. 2012, 53, 151–159. [Google Scholar] [CrossRef]
- Chen, J.S.B.; Huang, Y.K.; Chen, M.S. Feedrate optimization and tool profile modification for the high-efficiency ball-end milling process. Int. J. Mach. Tools Manuf. 2005, 45, 1070–1076. [Google Scholar] [CrossRef]
© 2019 by the authors. Licensee MDPI, Basel, Switzerland. This article is an open access article distributed under the terms and conditions of the Creative Commons Attribution (CC BY) license (http://creativecommons.org/licenses/by/4.0/).