Environmental Assessment of Ultra-High-Performance Concrete Using Carbon, Material, and Water Footprint

 , , , and
Abstract
1. Introduction
2. Materials and Methods
2.1. Reference Mixtures of Concrete
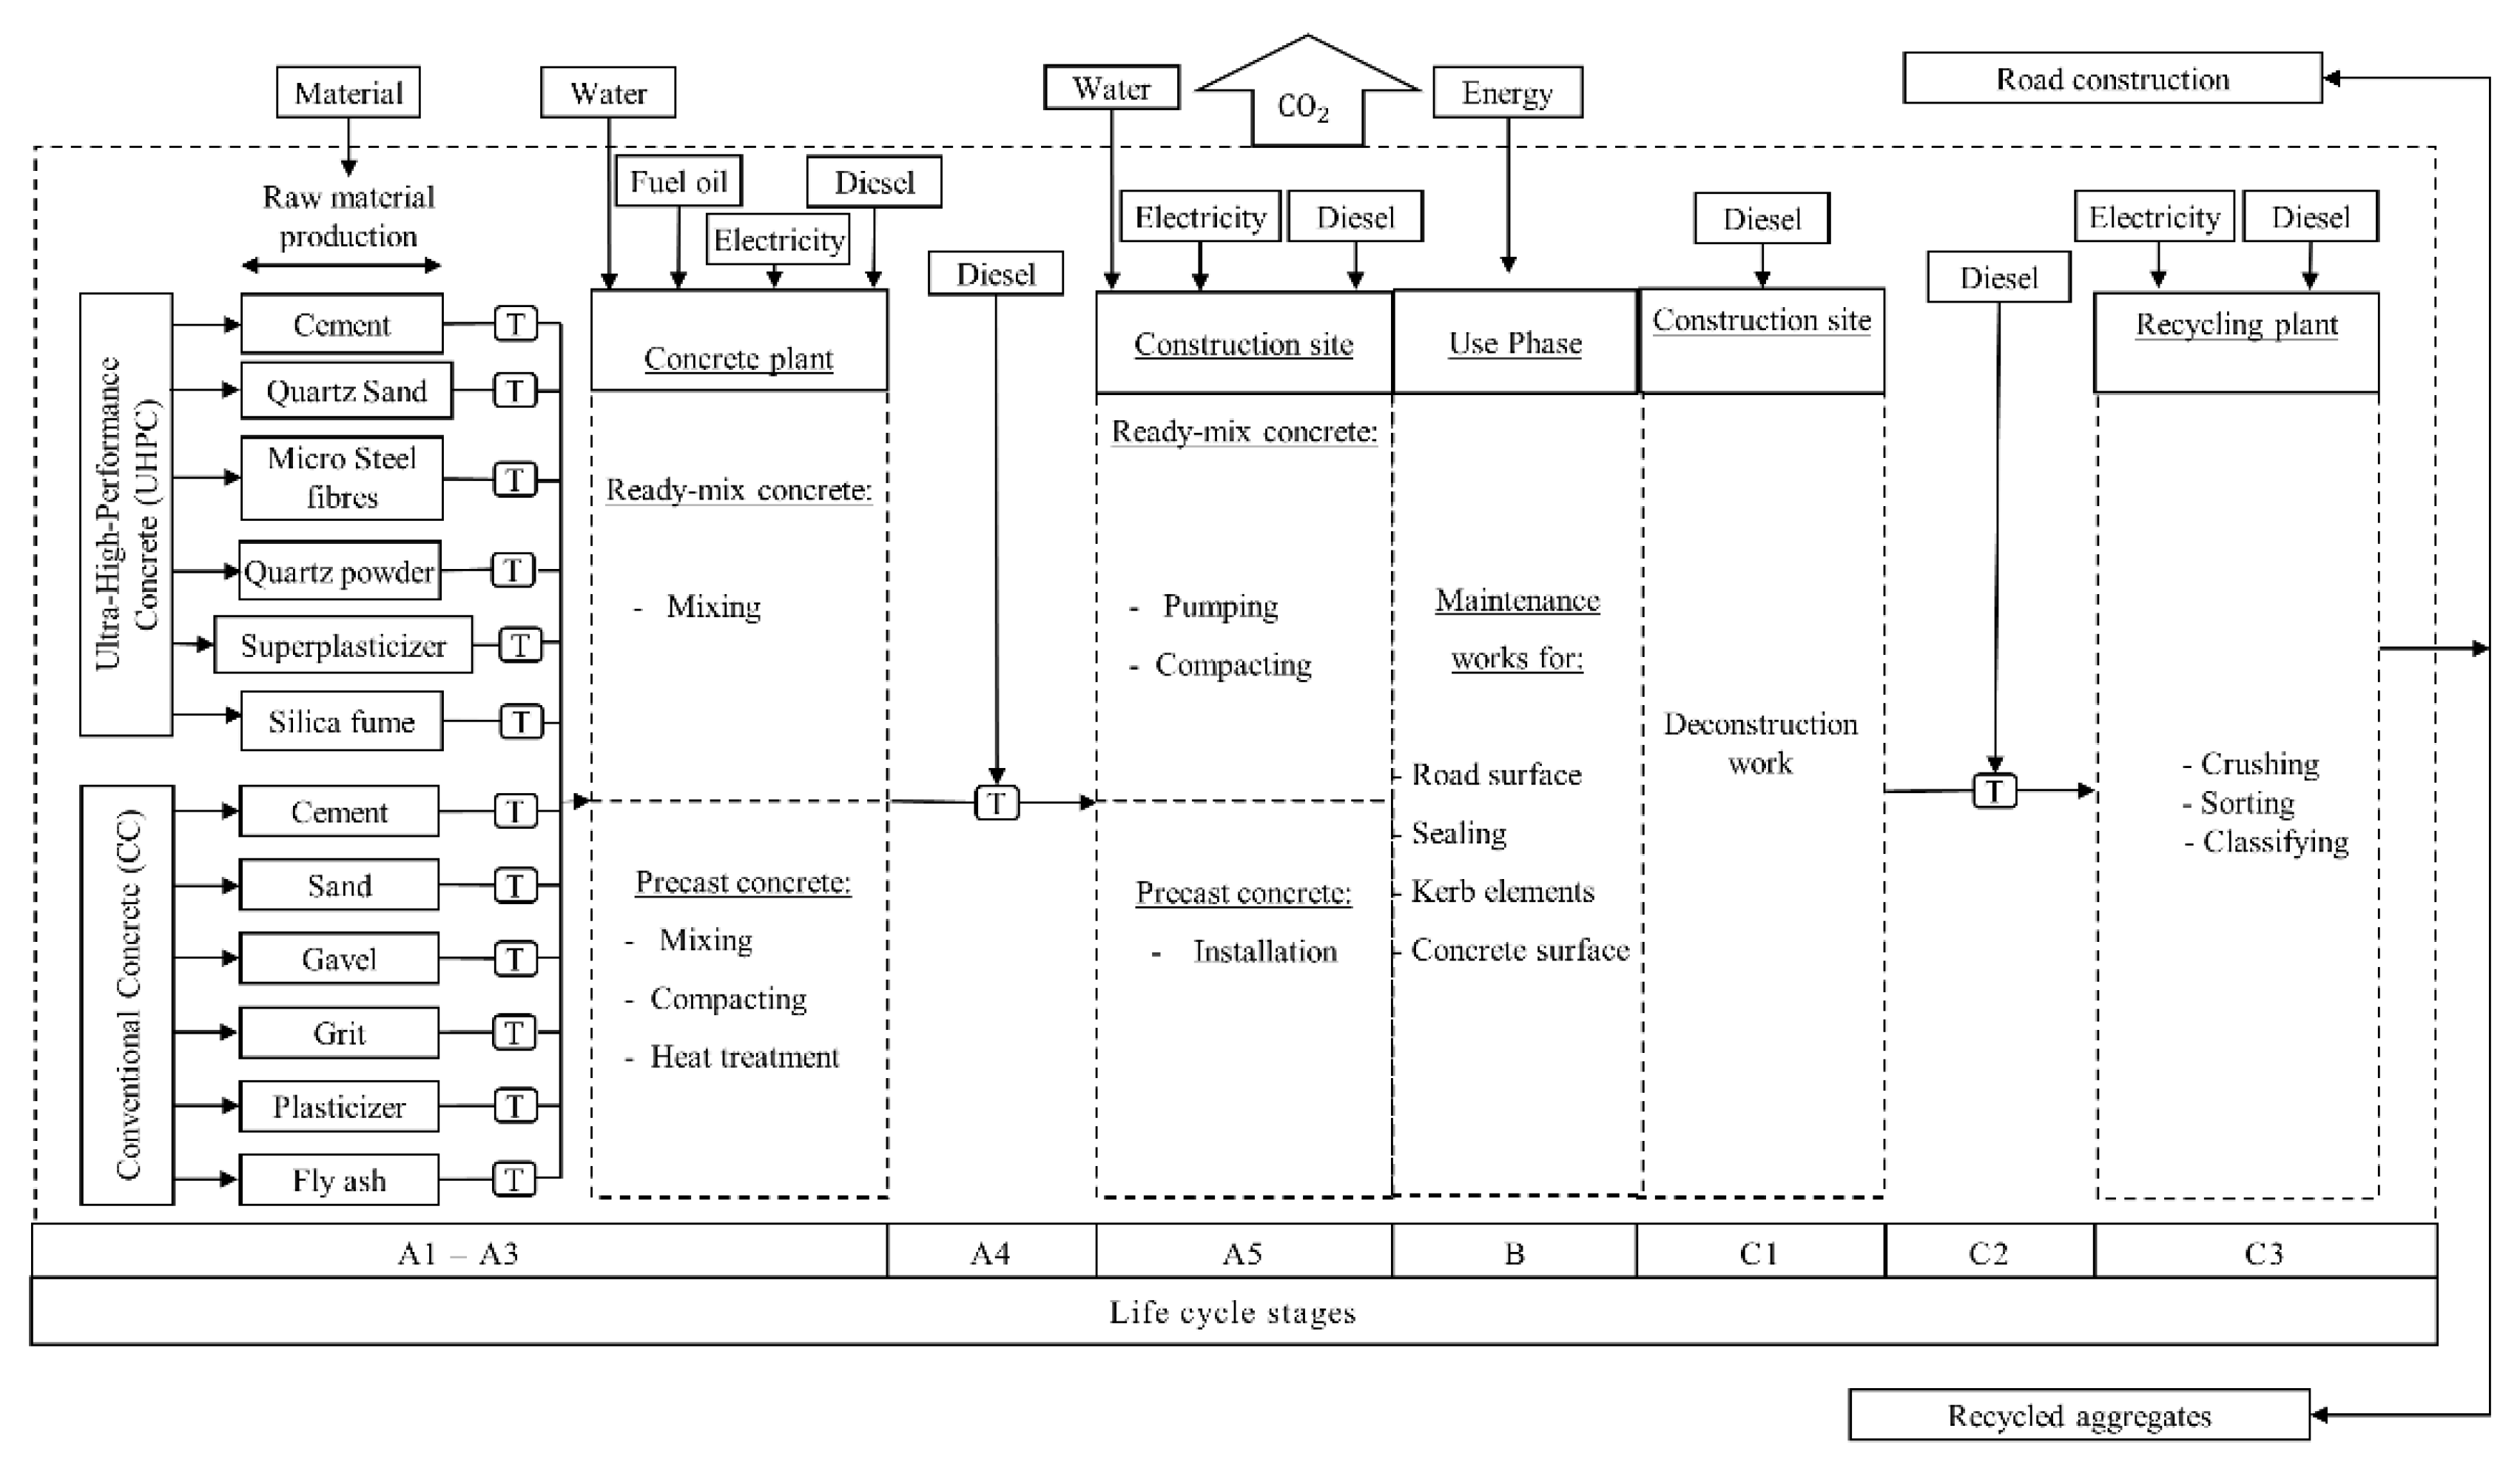
2.2. Life Cycle Assessment
2.2.1. Life Cycle Stages A1–A3
2.2.2. Life Cycle Stages A4–A5
2.2.3. Life Cycle Stages C1–C3
2.3. Footprint Categories
2.3.1. Carbon Footprint
2.3.2. Material Footprint
2.3.3. Water Footprint
2.4. Case Study Description
2.5. Definition of The Functional Unit
3. Results and Discussion
3.1. Construction Materials Level
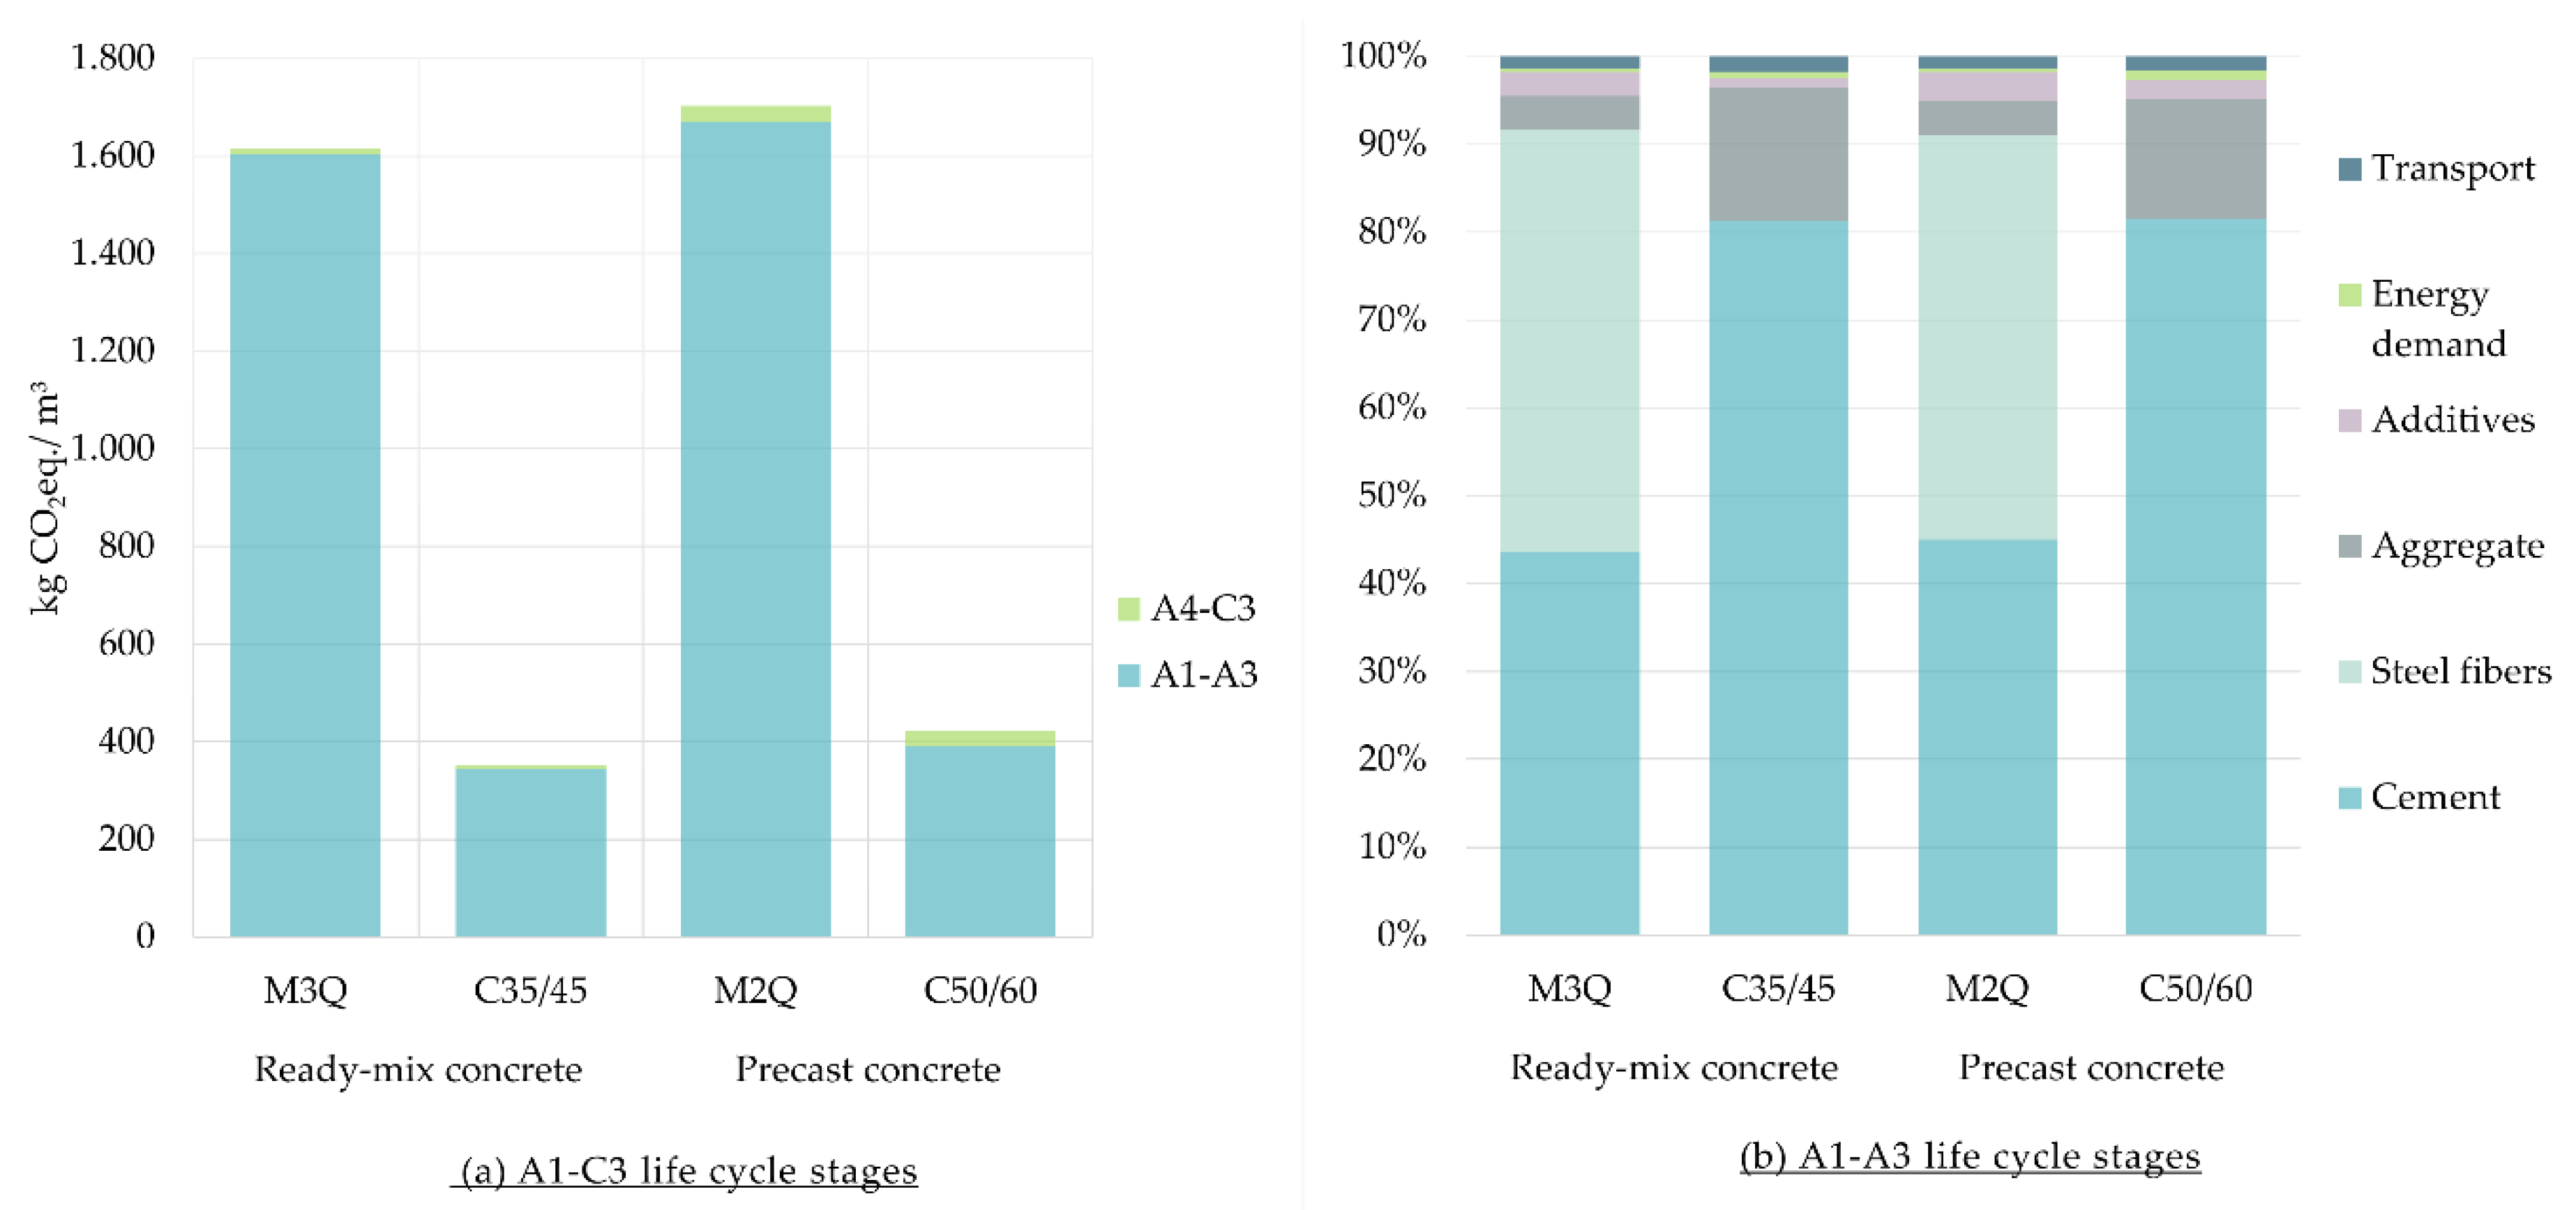
3.1.1. Carbon Footprint at Construction Materials Level
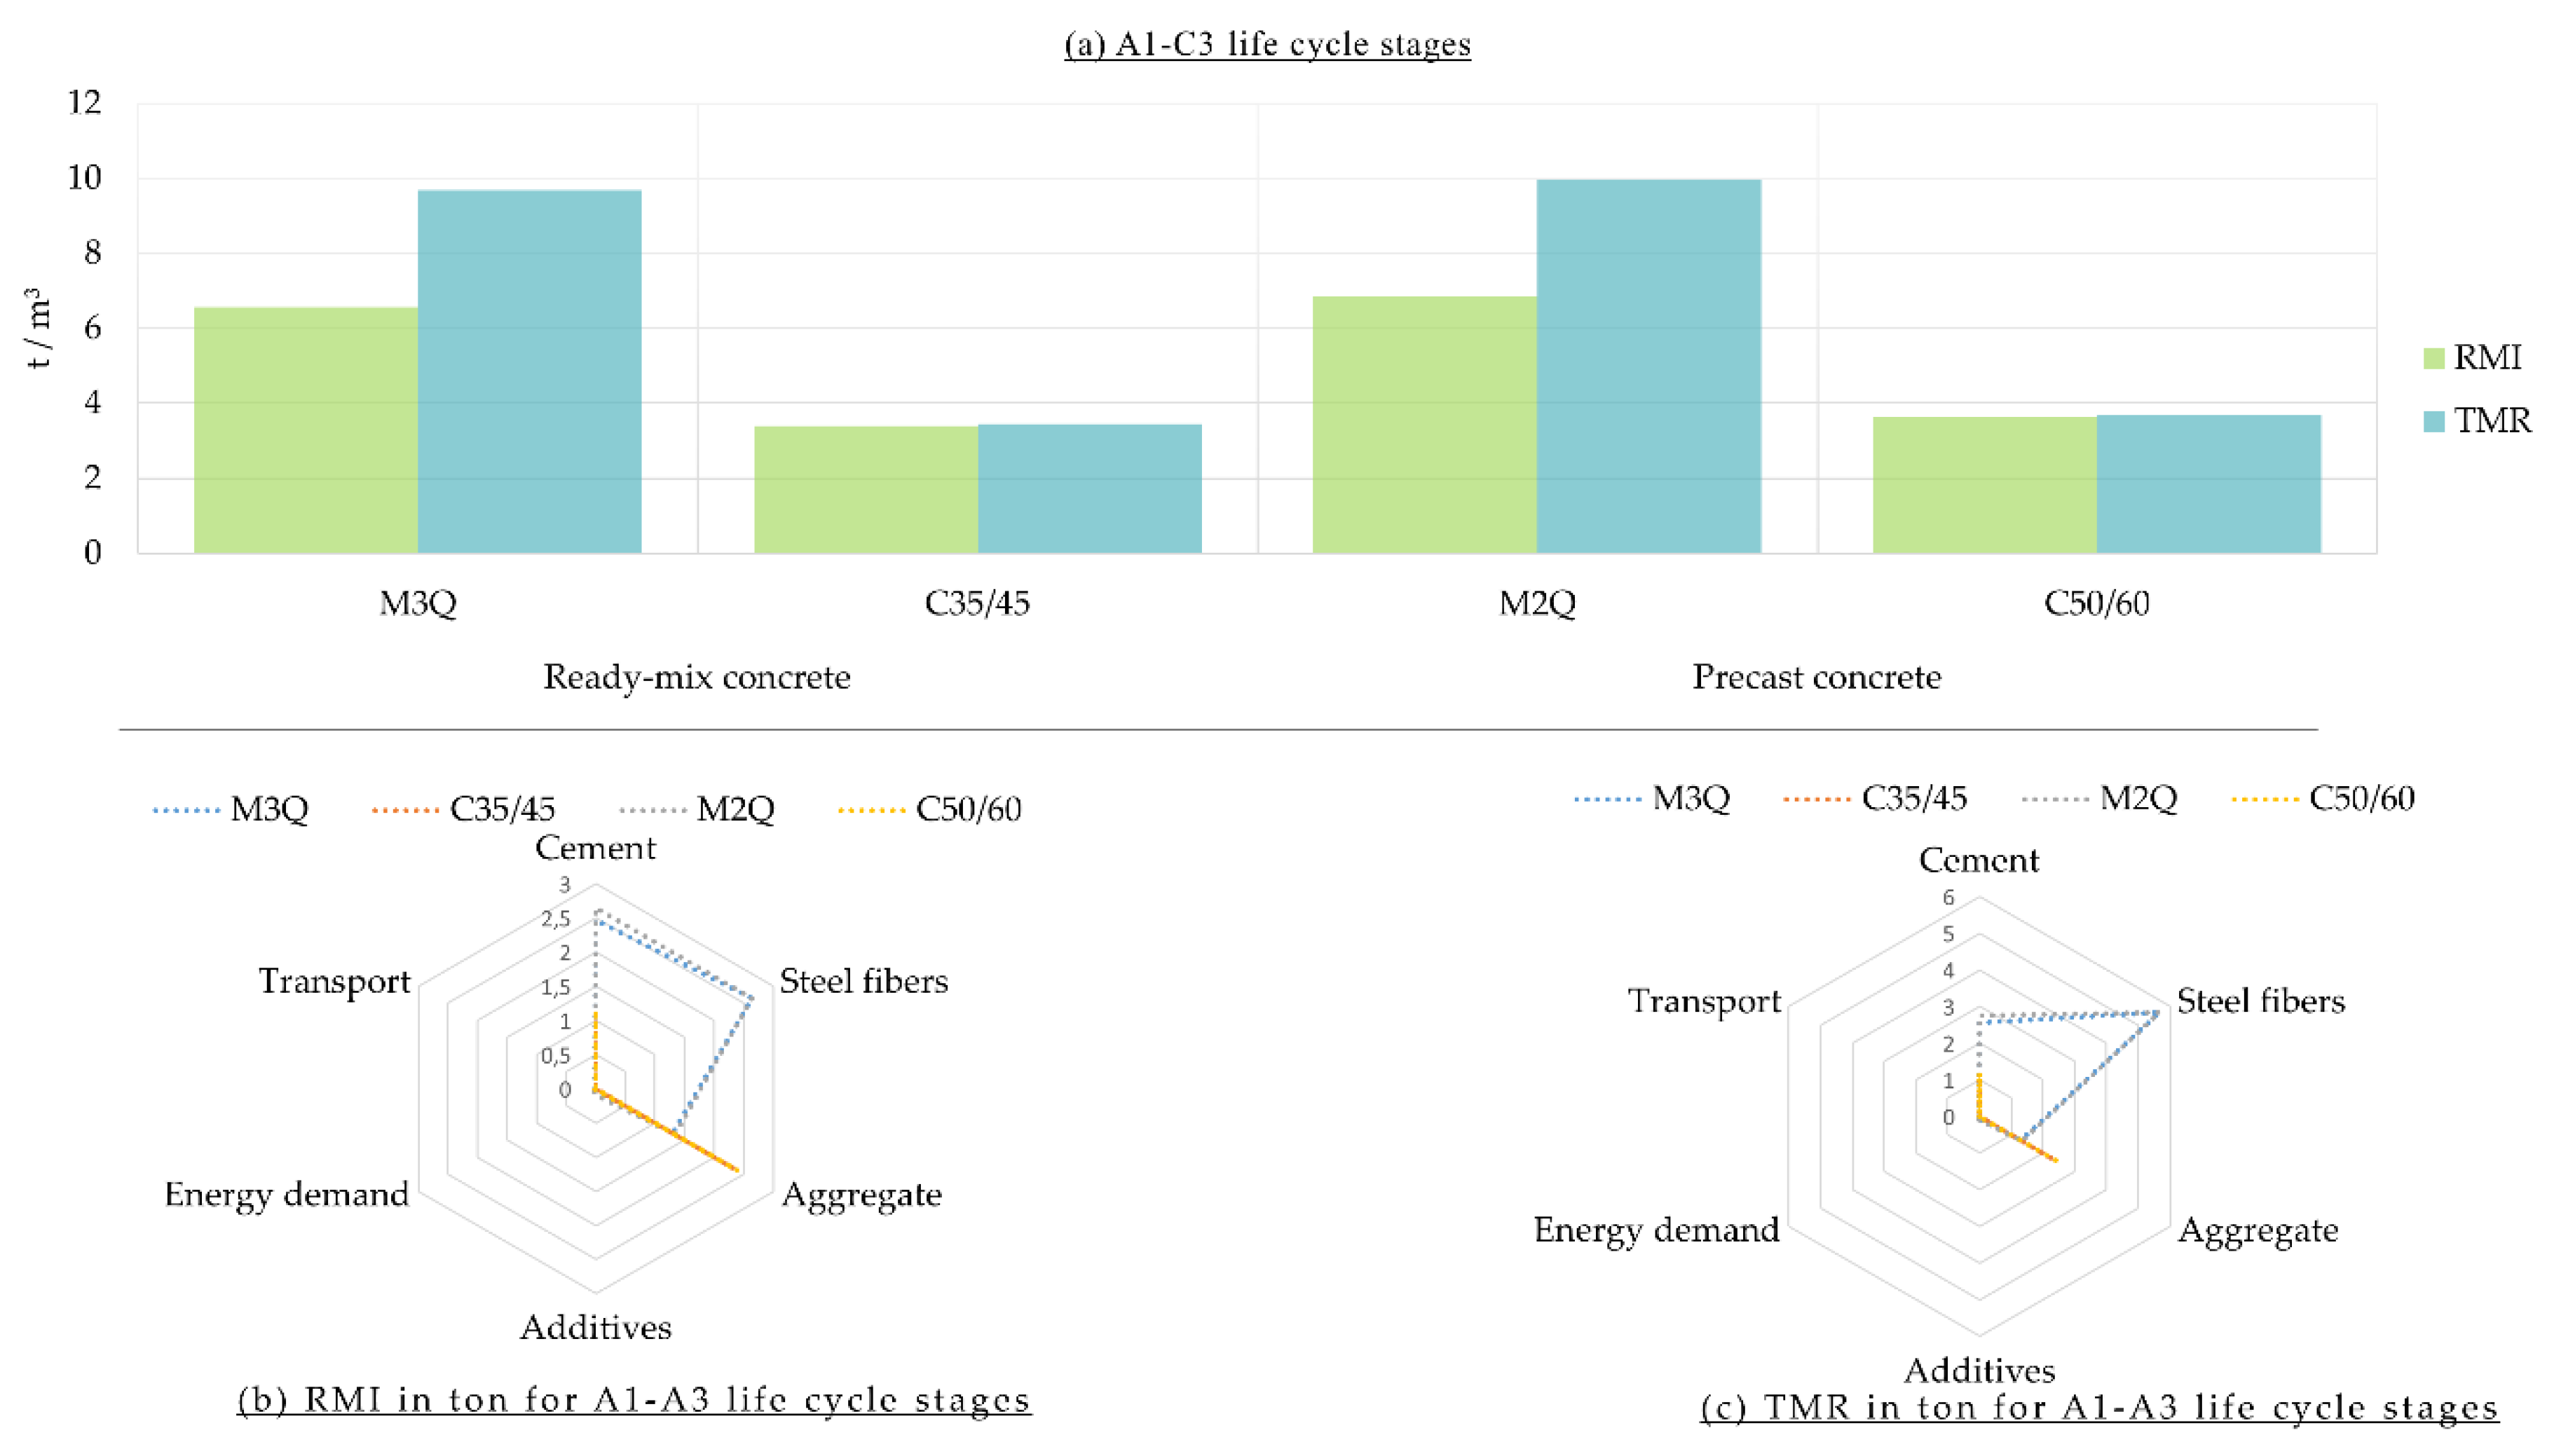
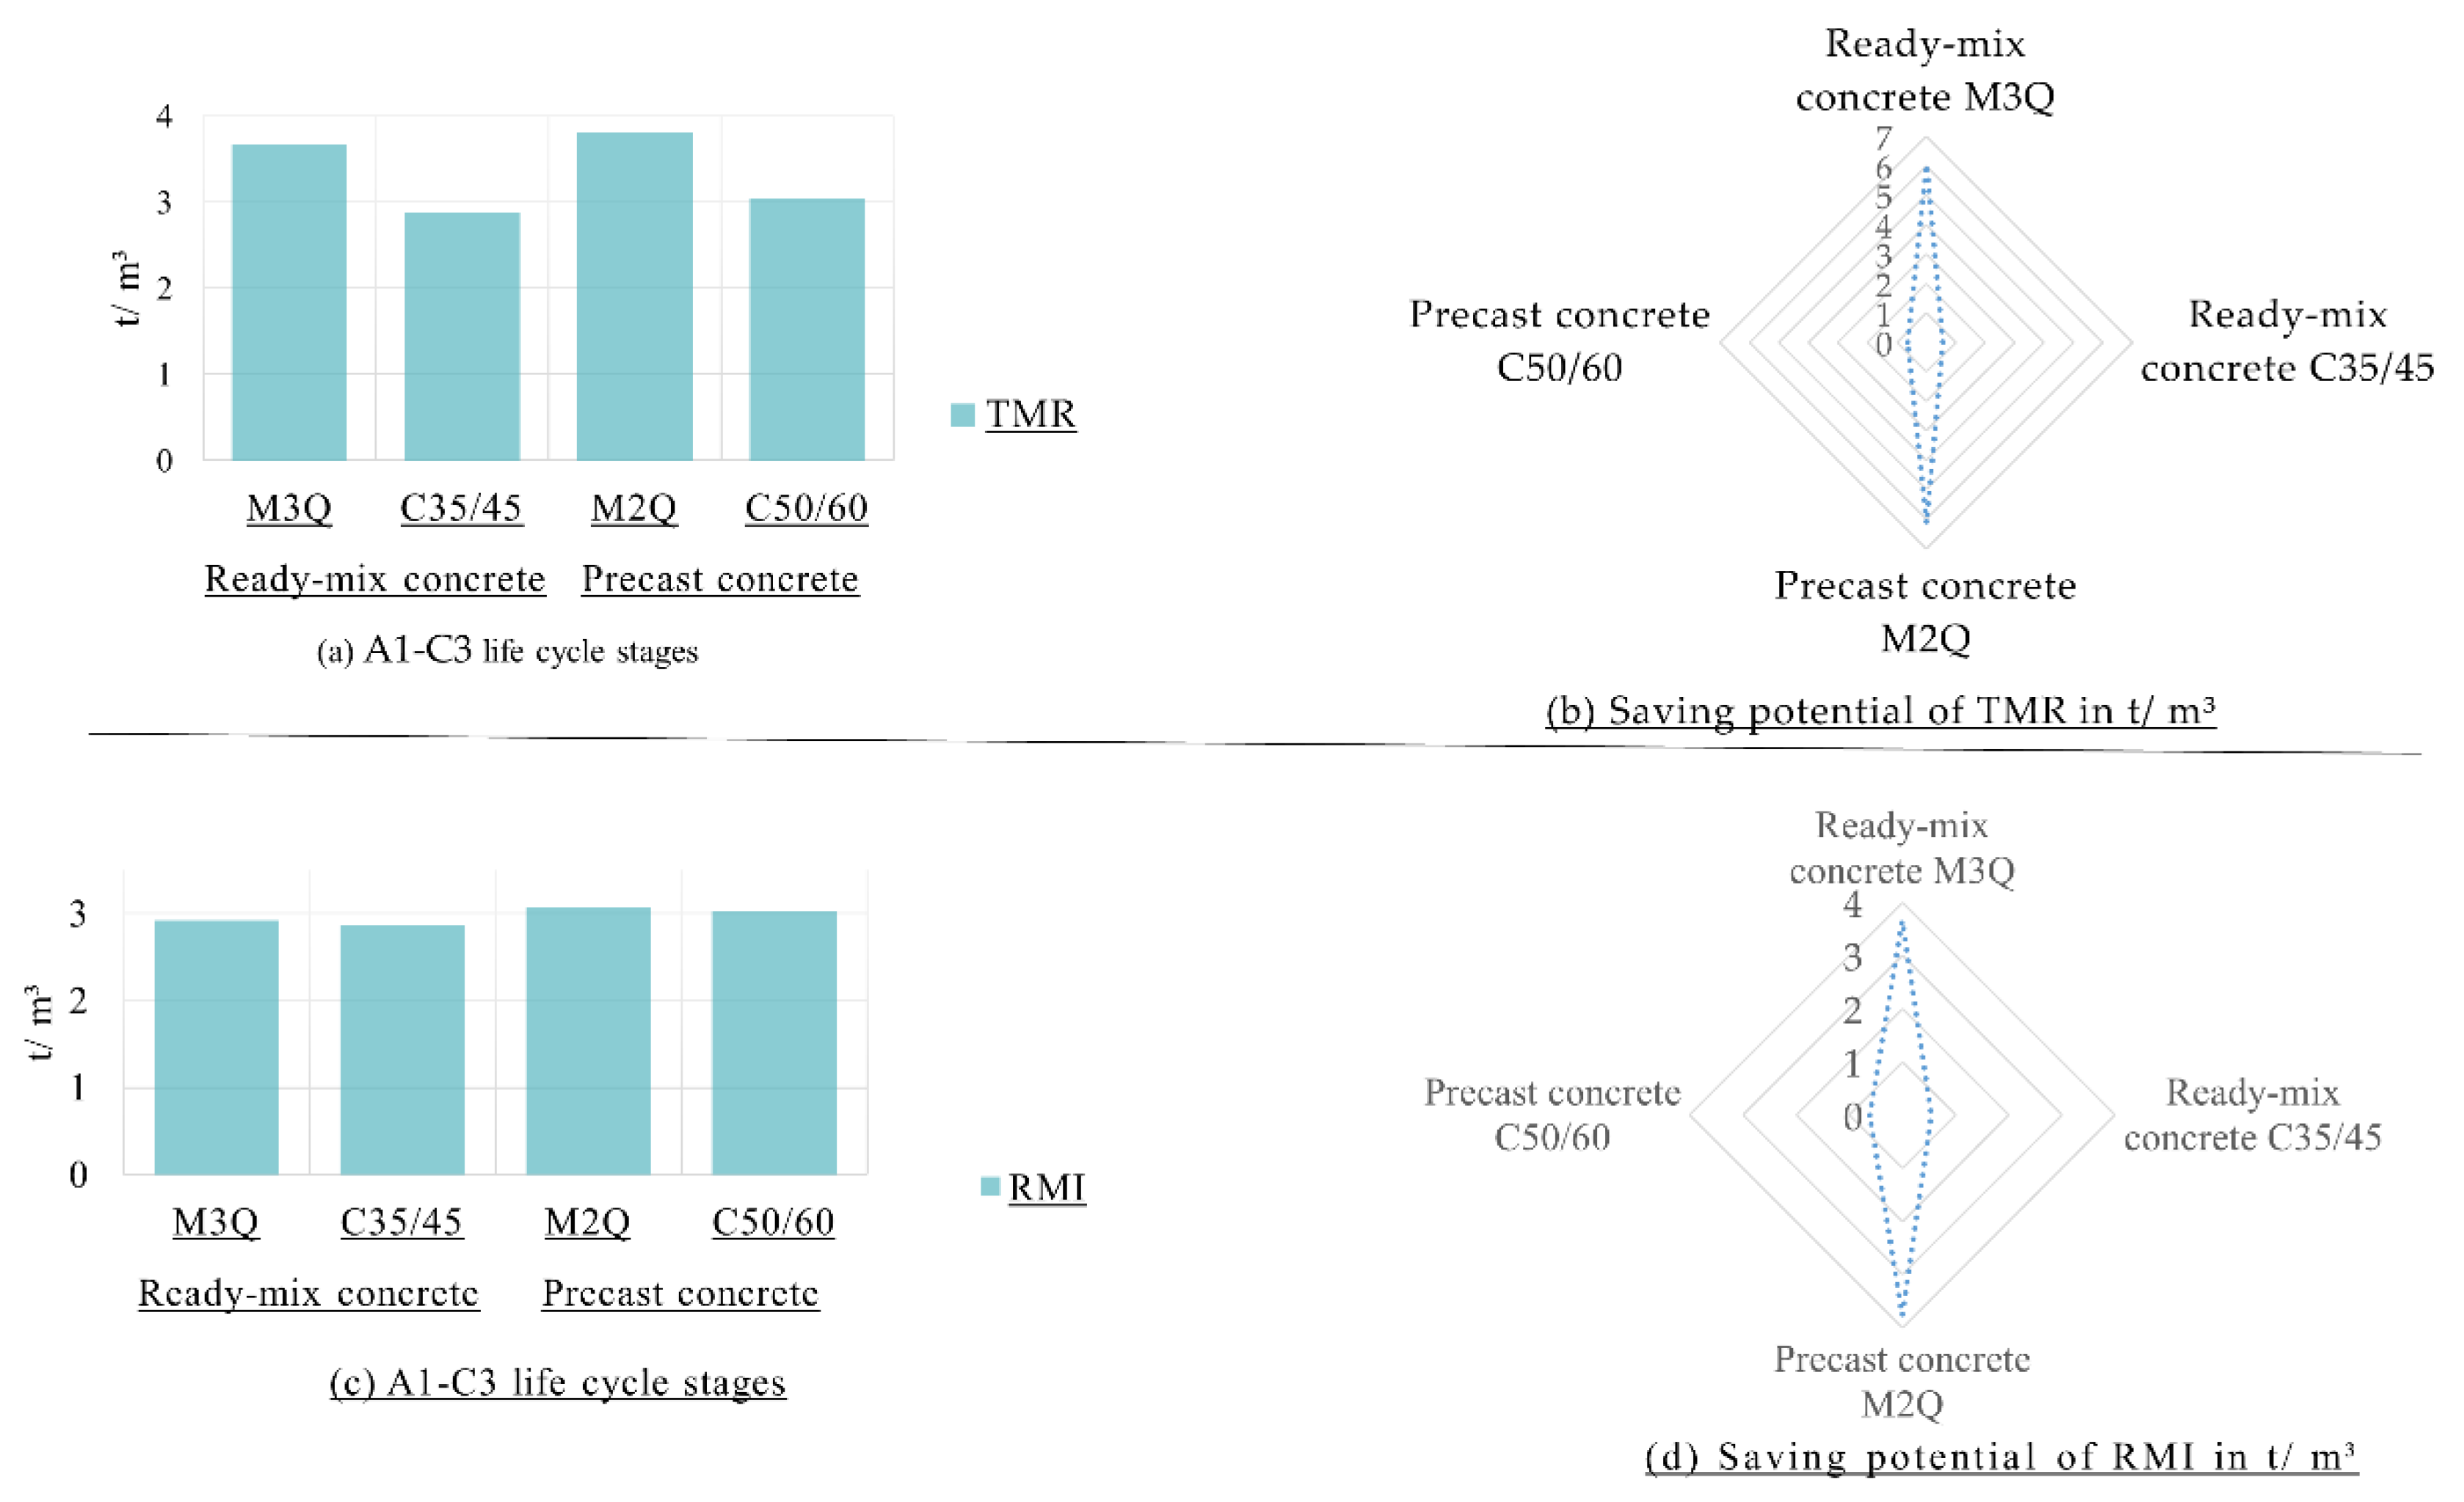
3.1.2. Material Footprint at Construction Materials Level
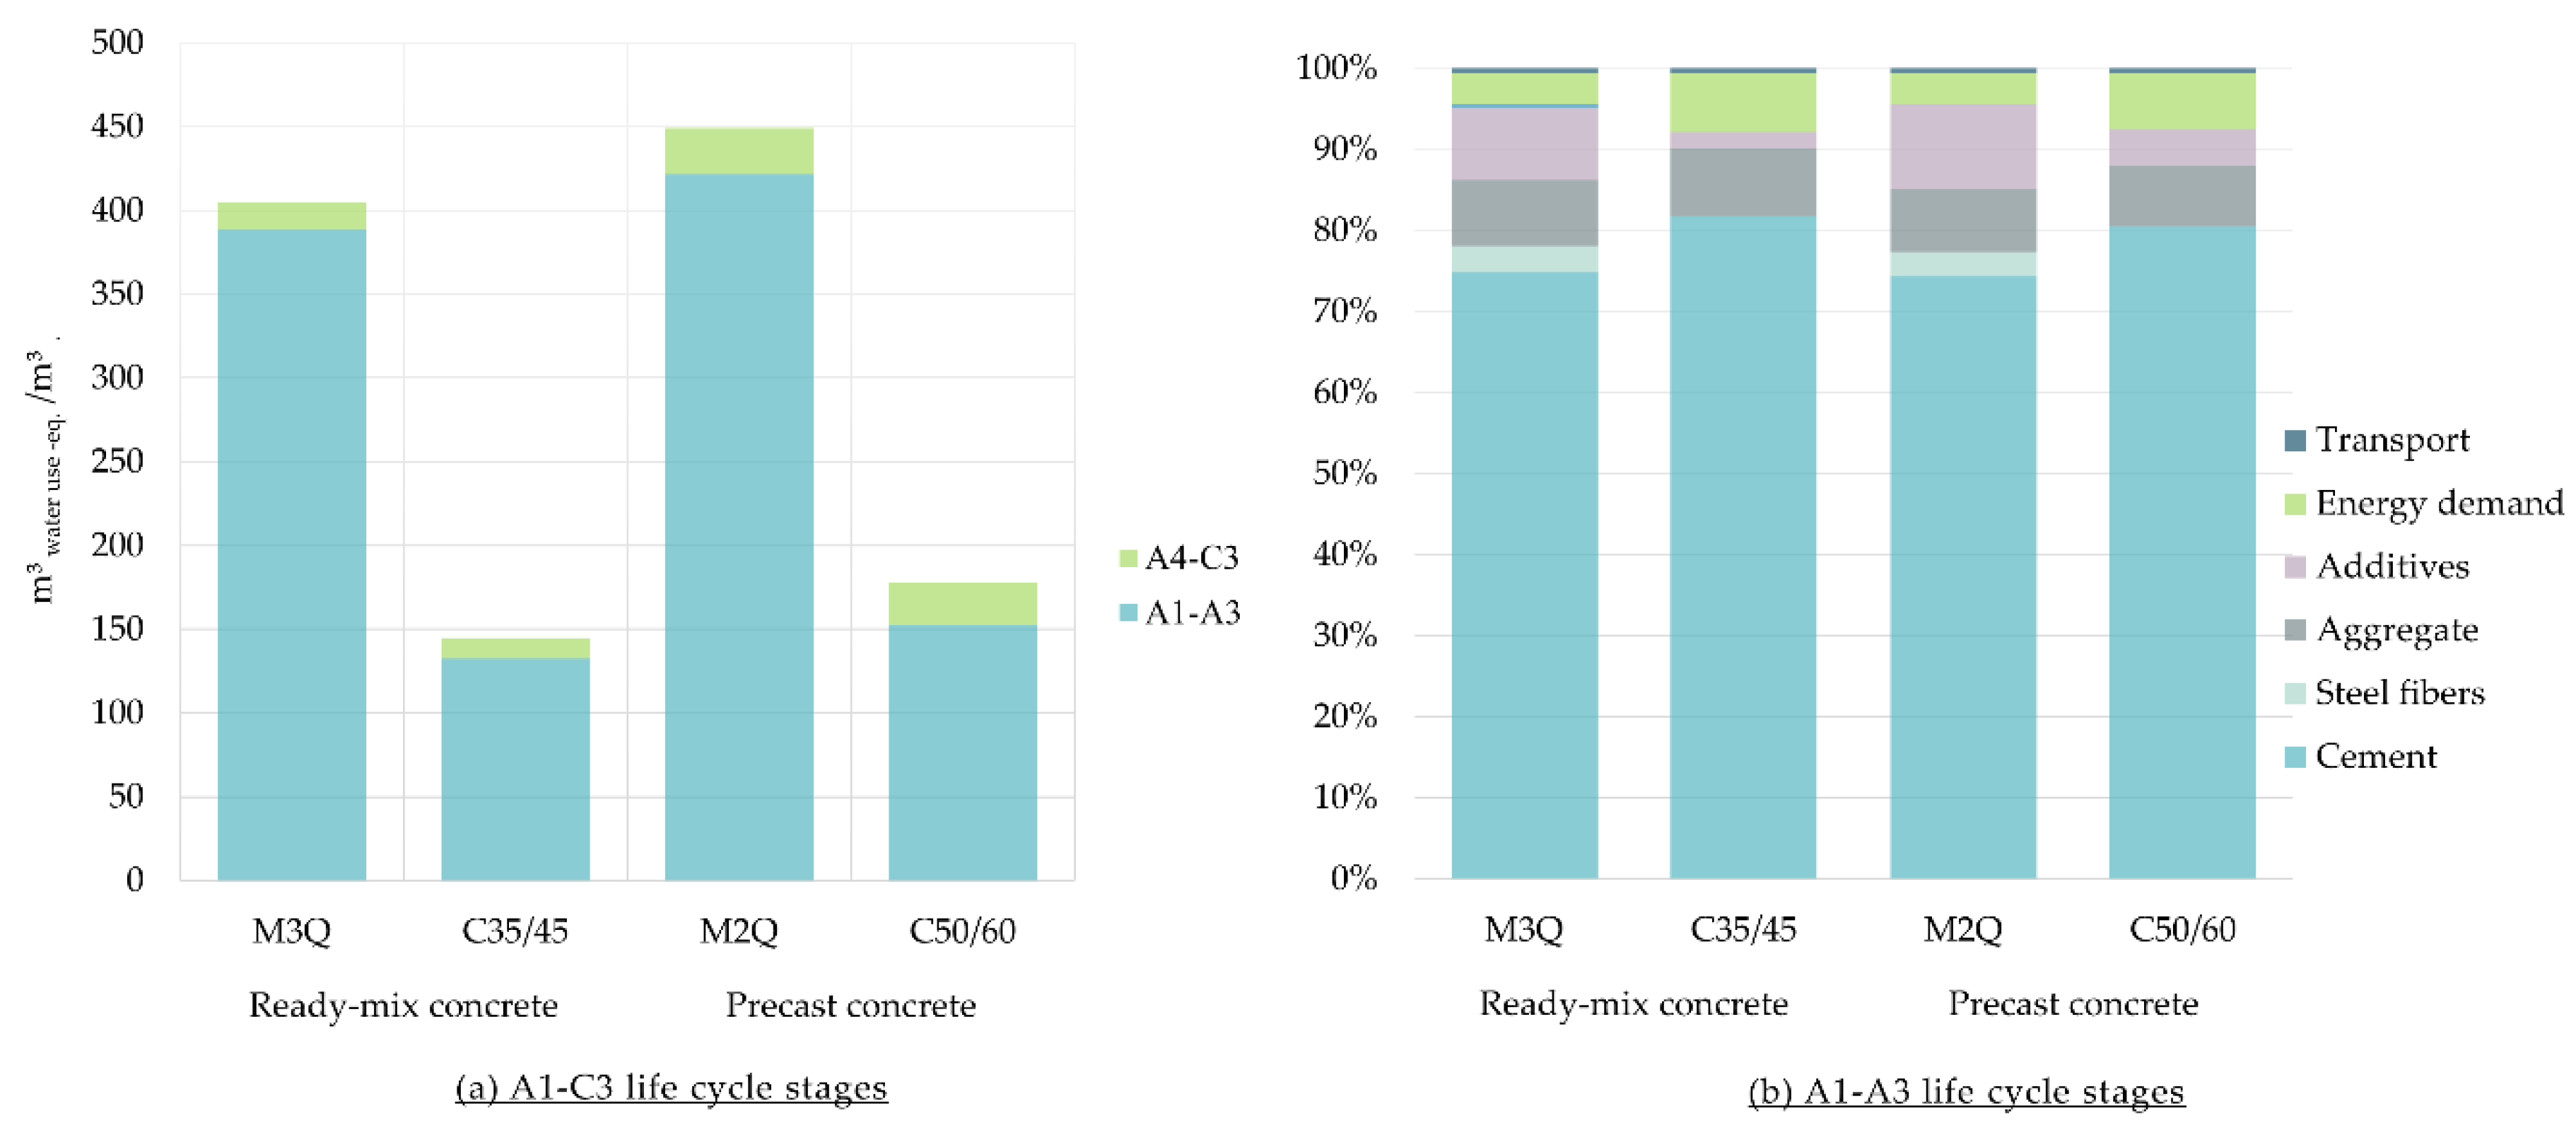
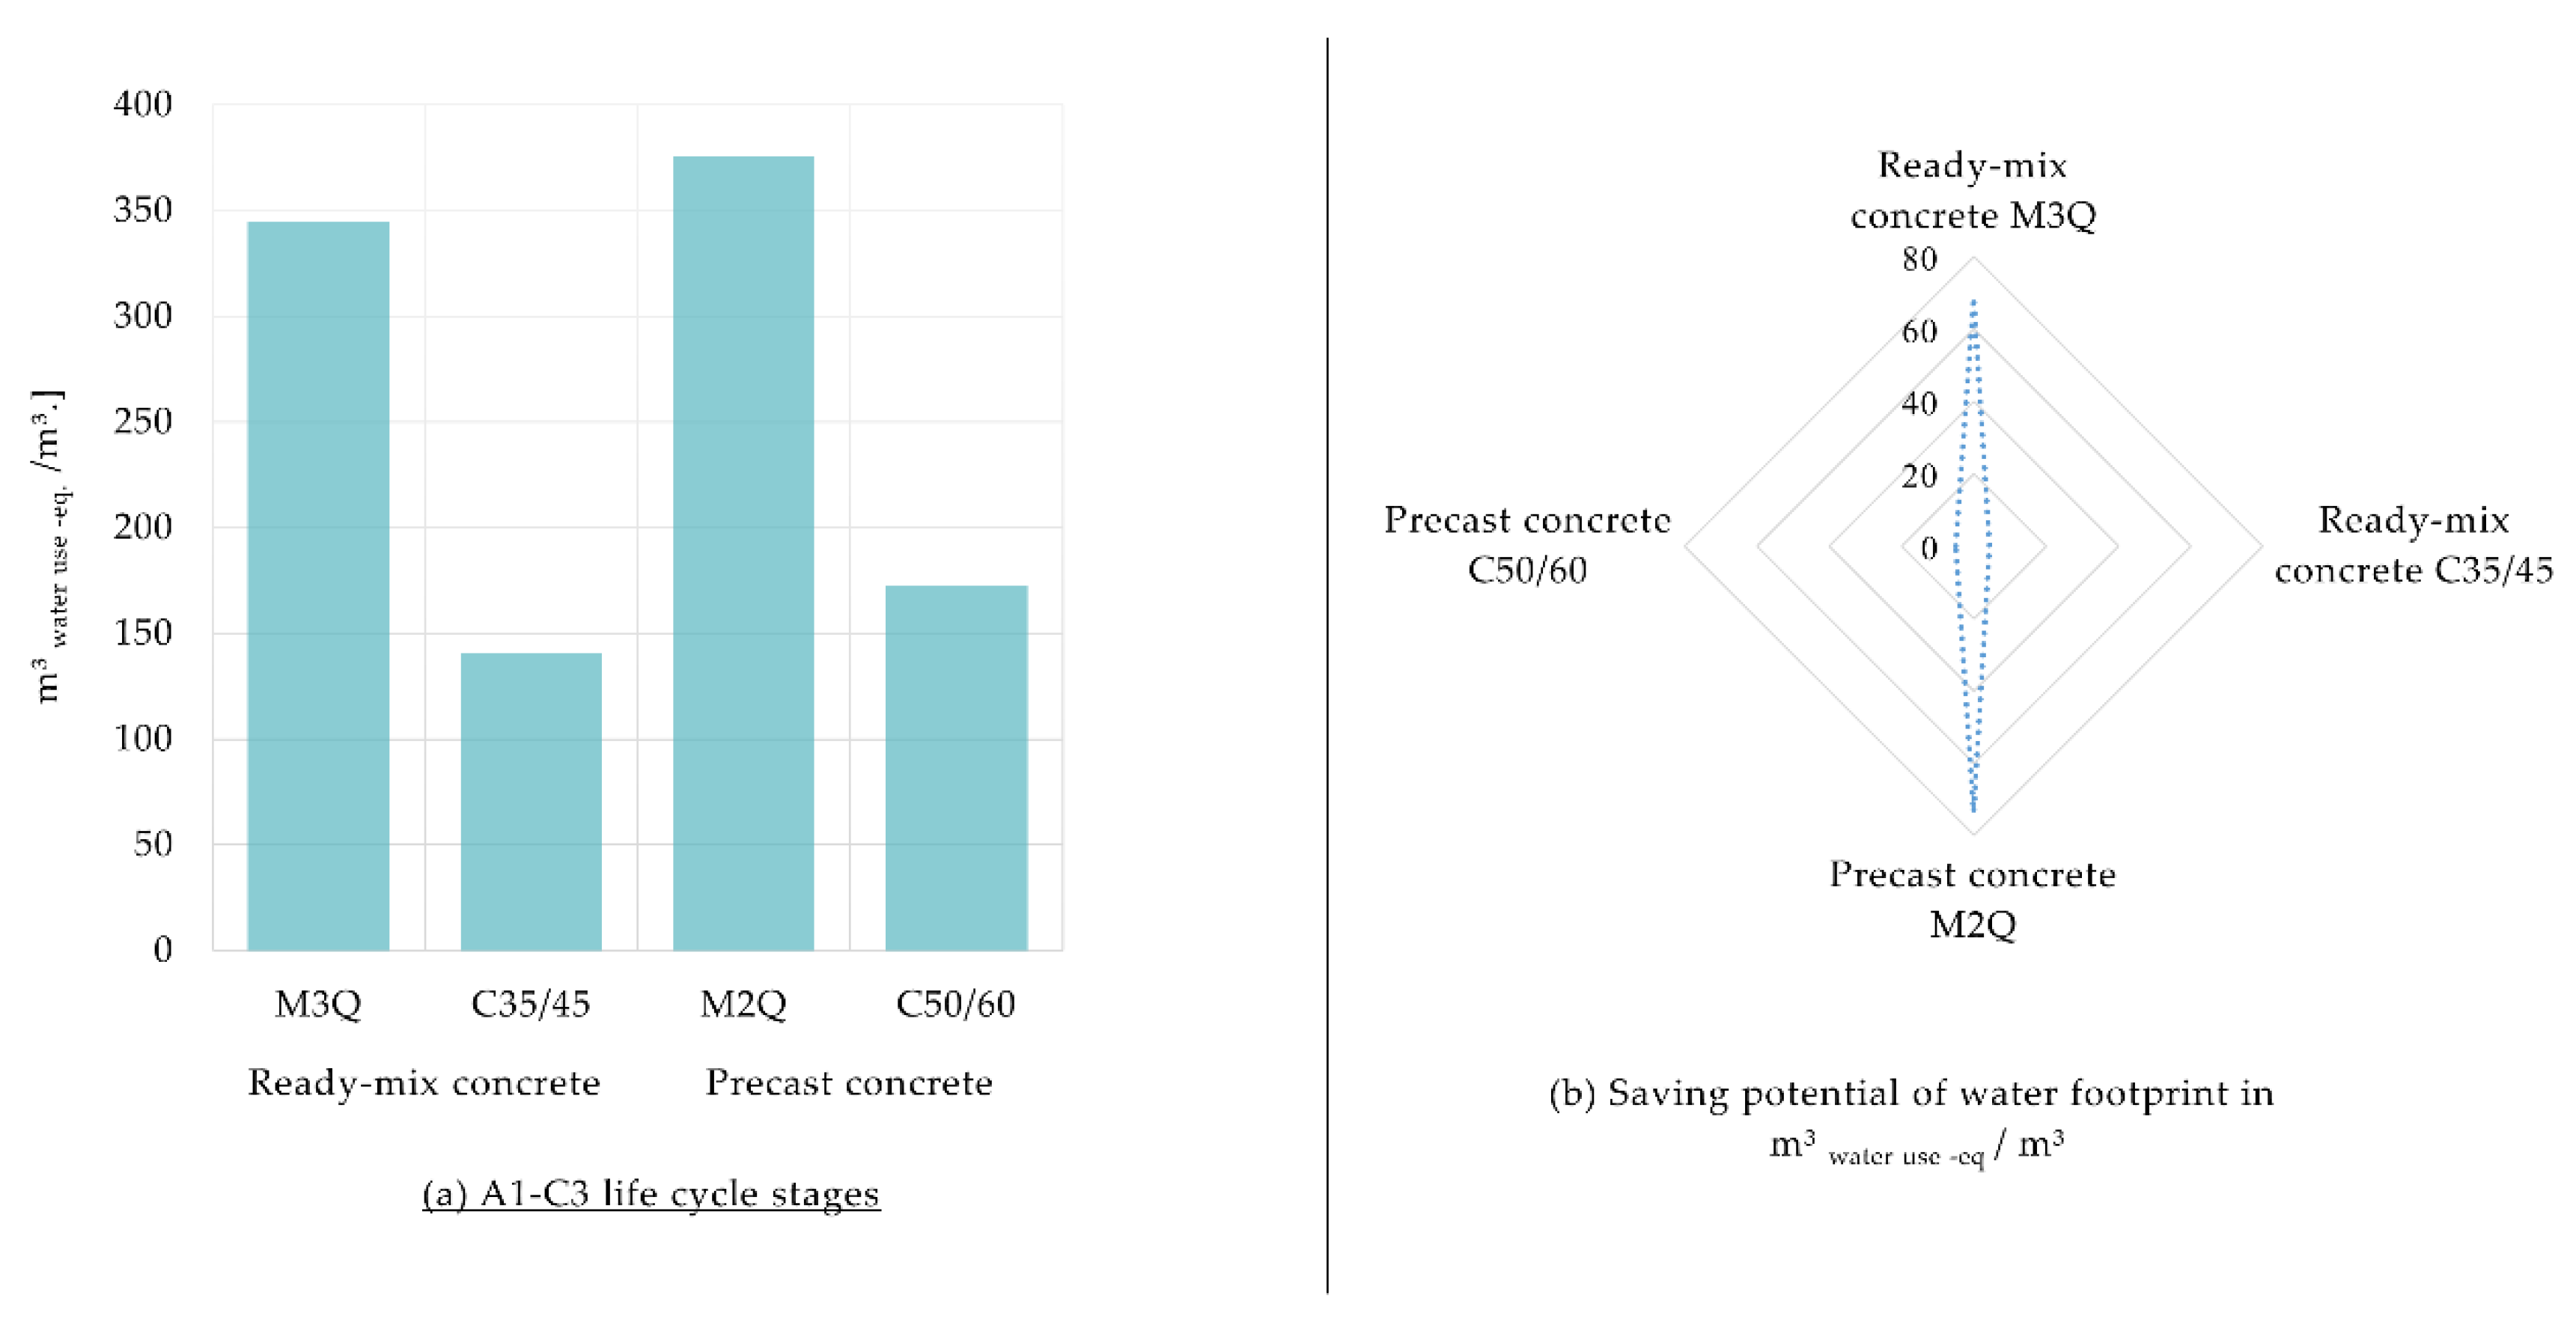
3.1.3. Water Footprint at Construction Materials Level
3.2. Sensitivity Analysis at The Construction Materials Level
- Type of cement.
- Production process of micro steel fibers.
3.2.1. Type of Cement
3.2.2. Production Process of Steel Fibers
3.2.3. Results of The Sensitivity Analysis
3.3. Case Study Level
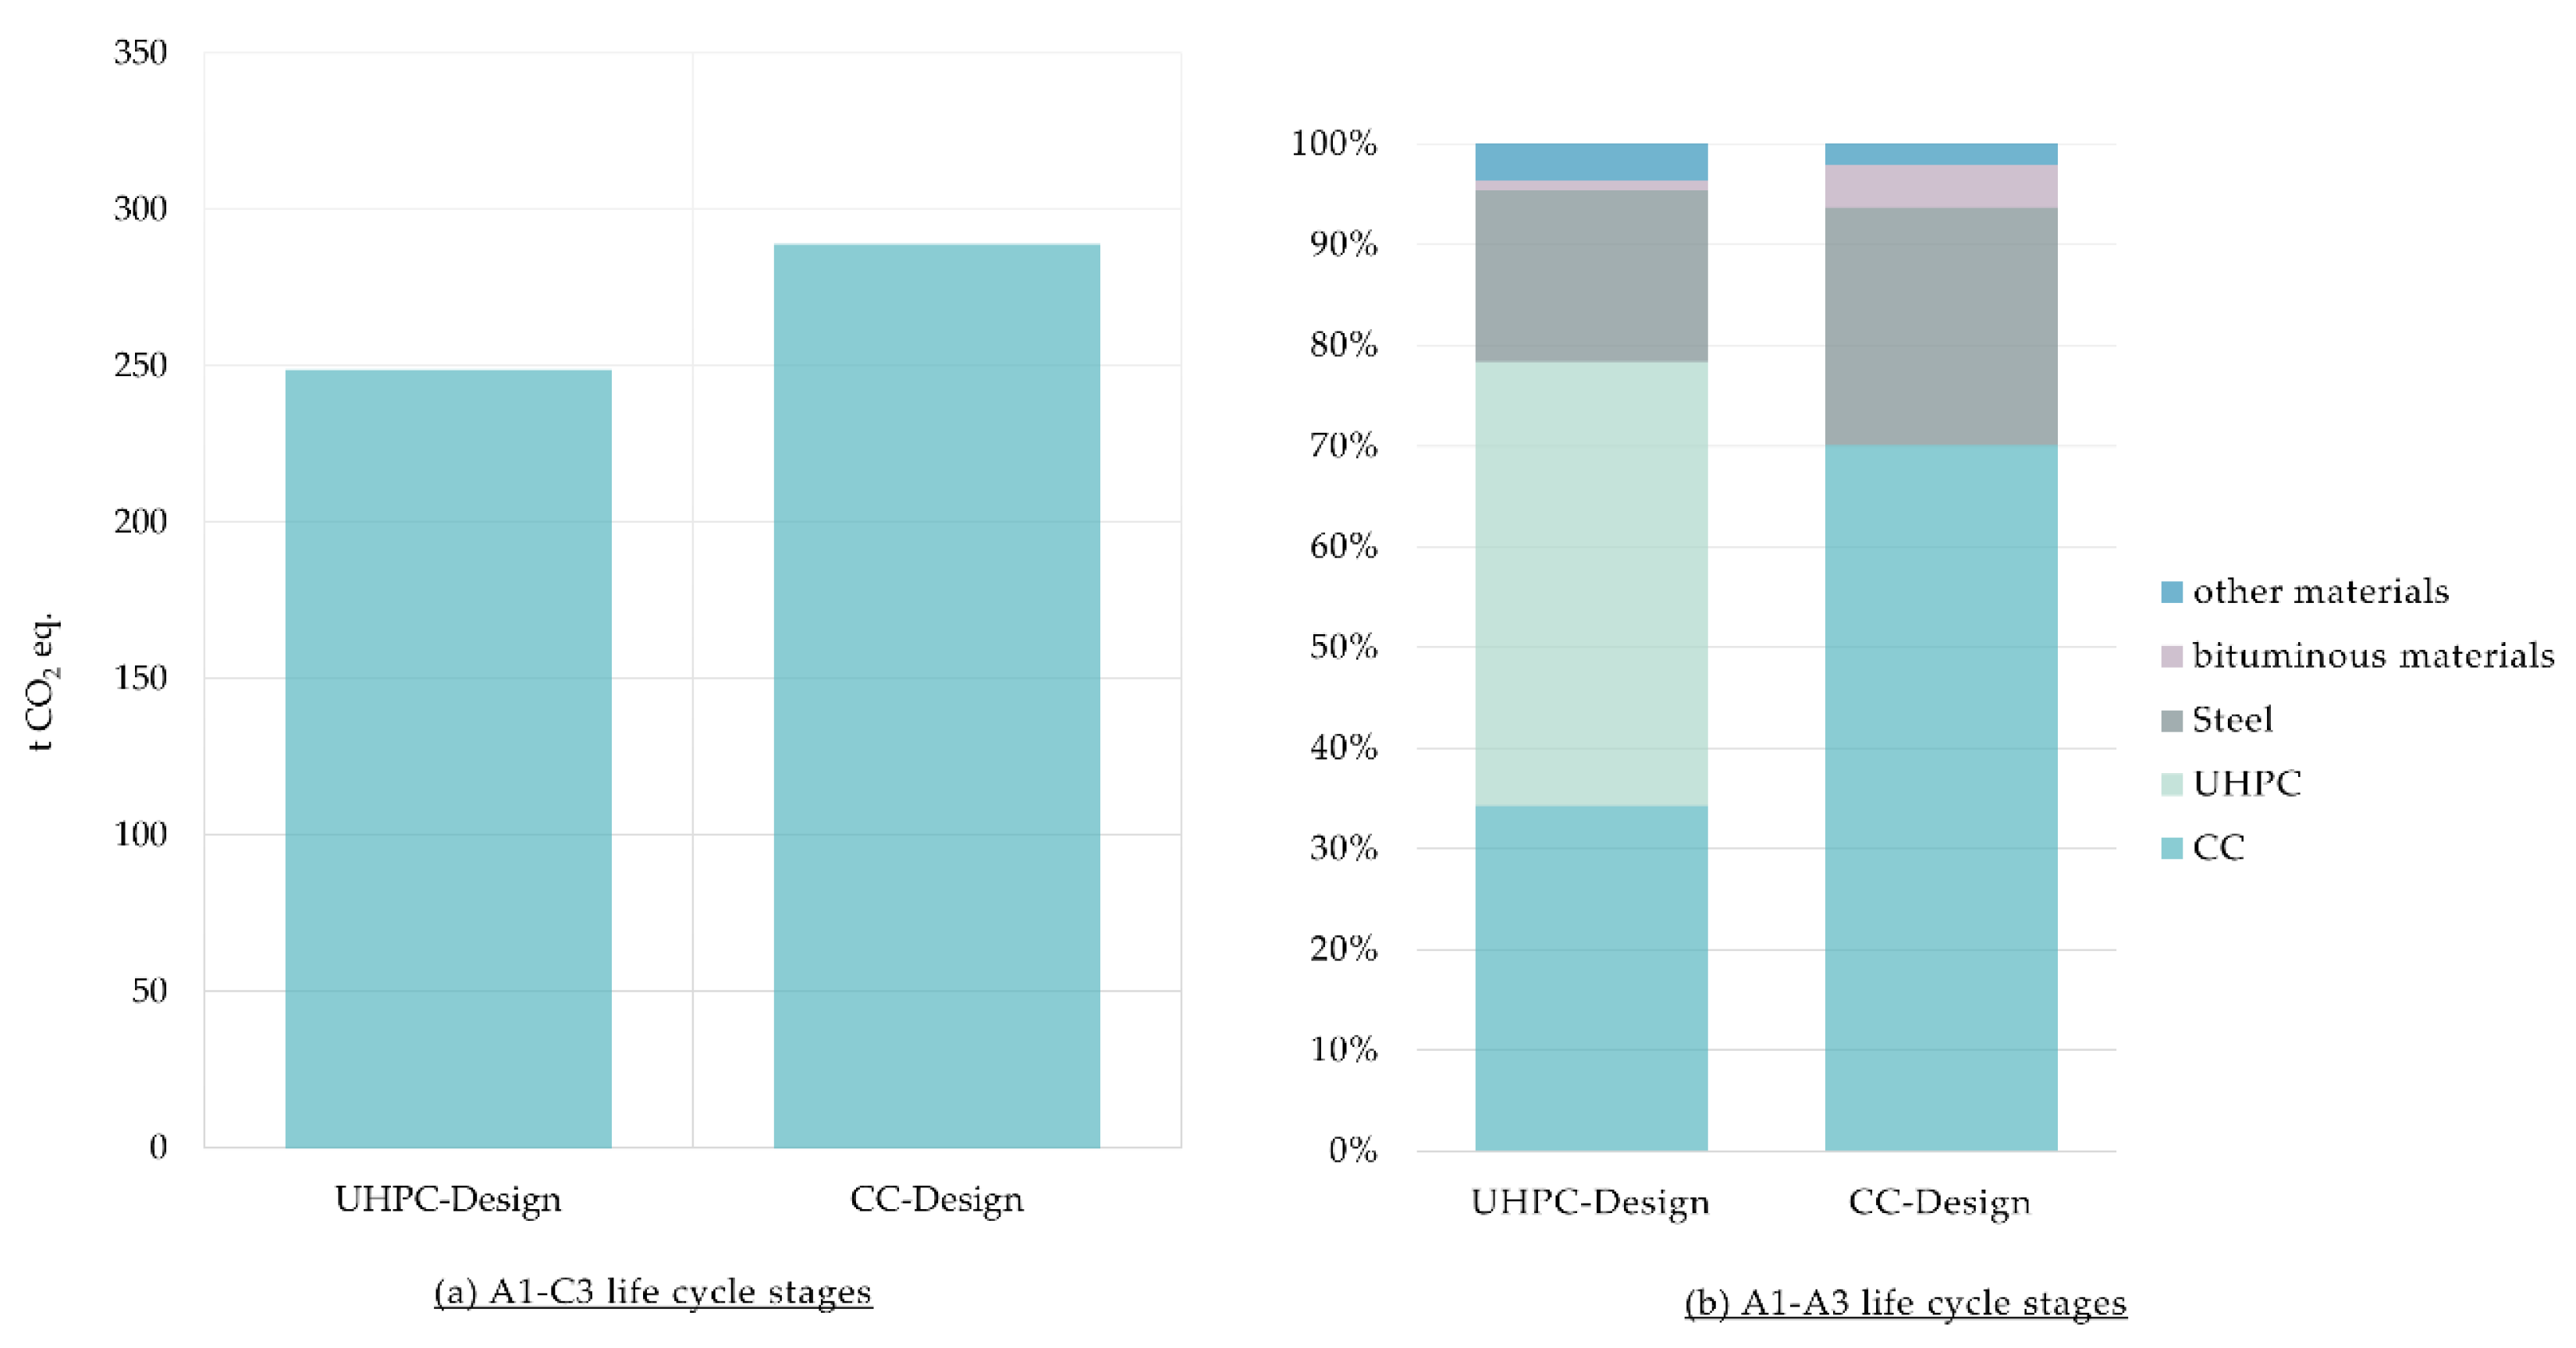
3.3.1. Carbon Footprint at Case Study Level
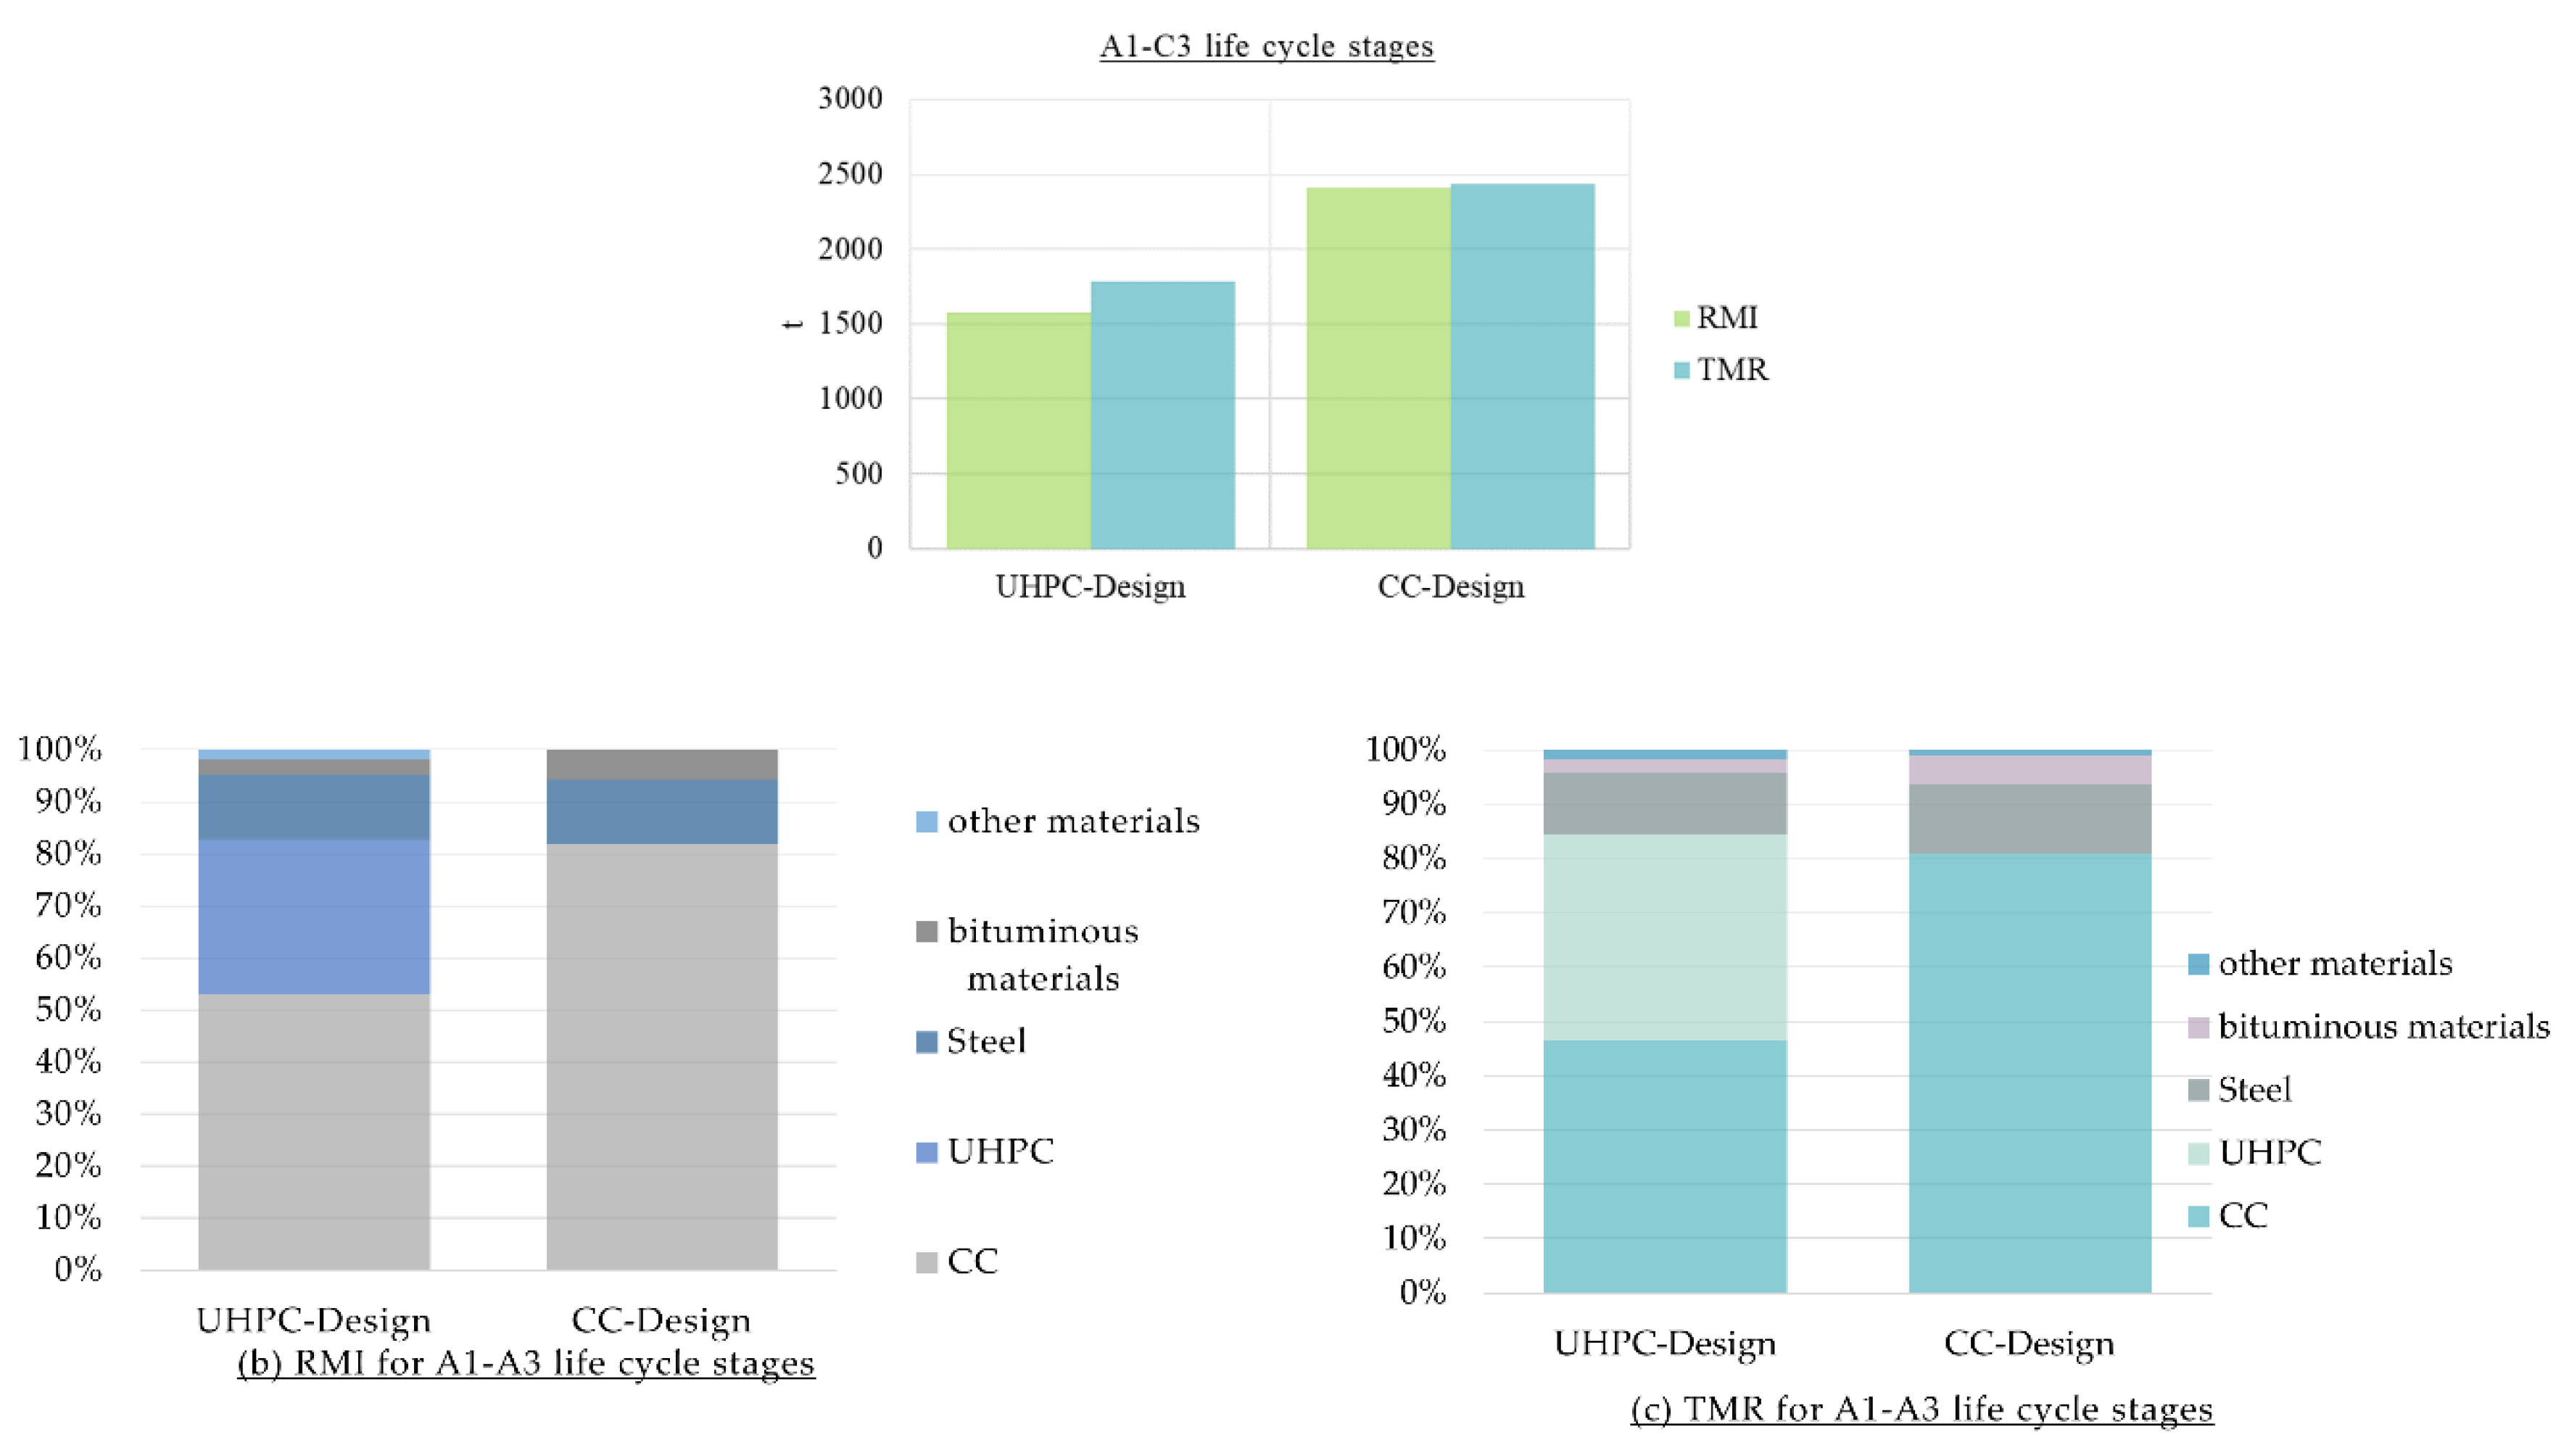
3.3.2. Material Footprint at Case Study Level
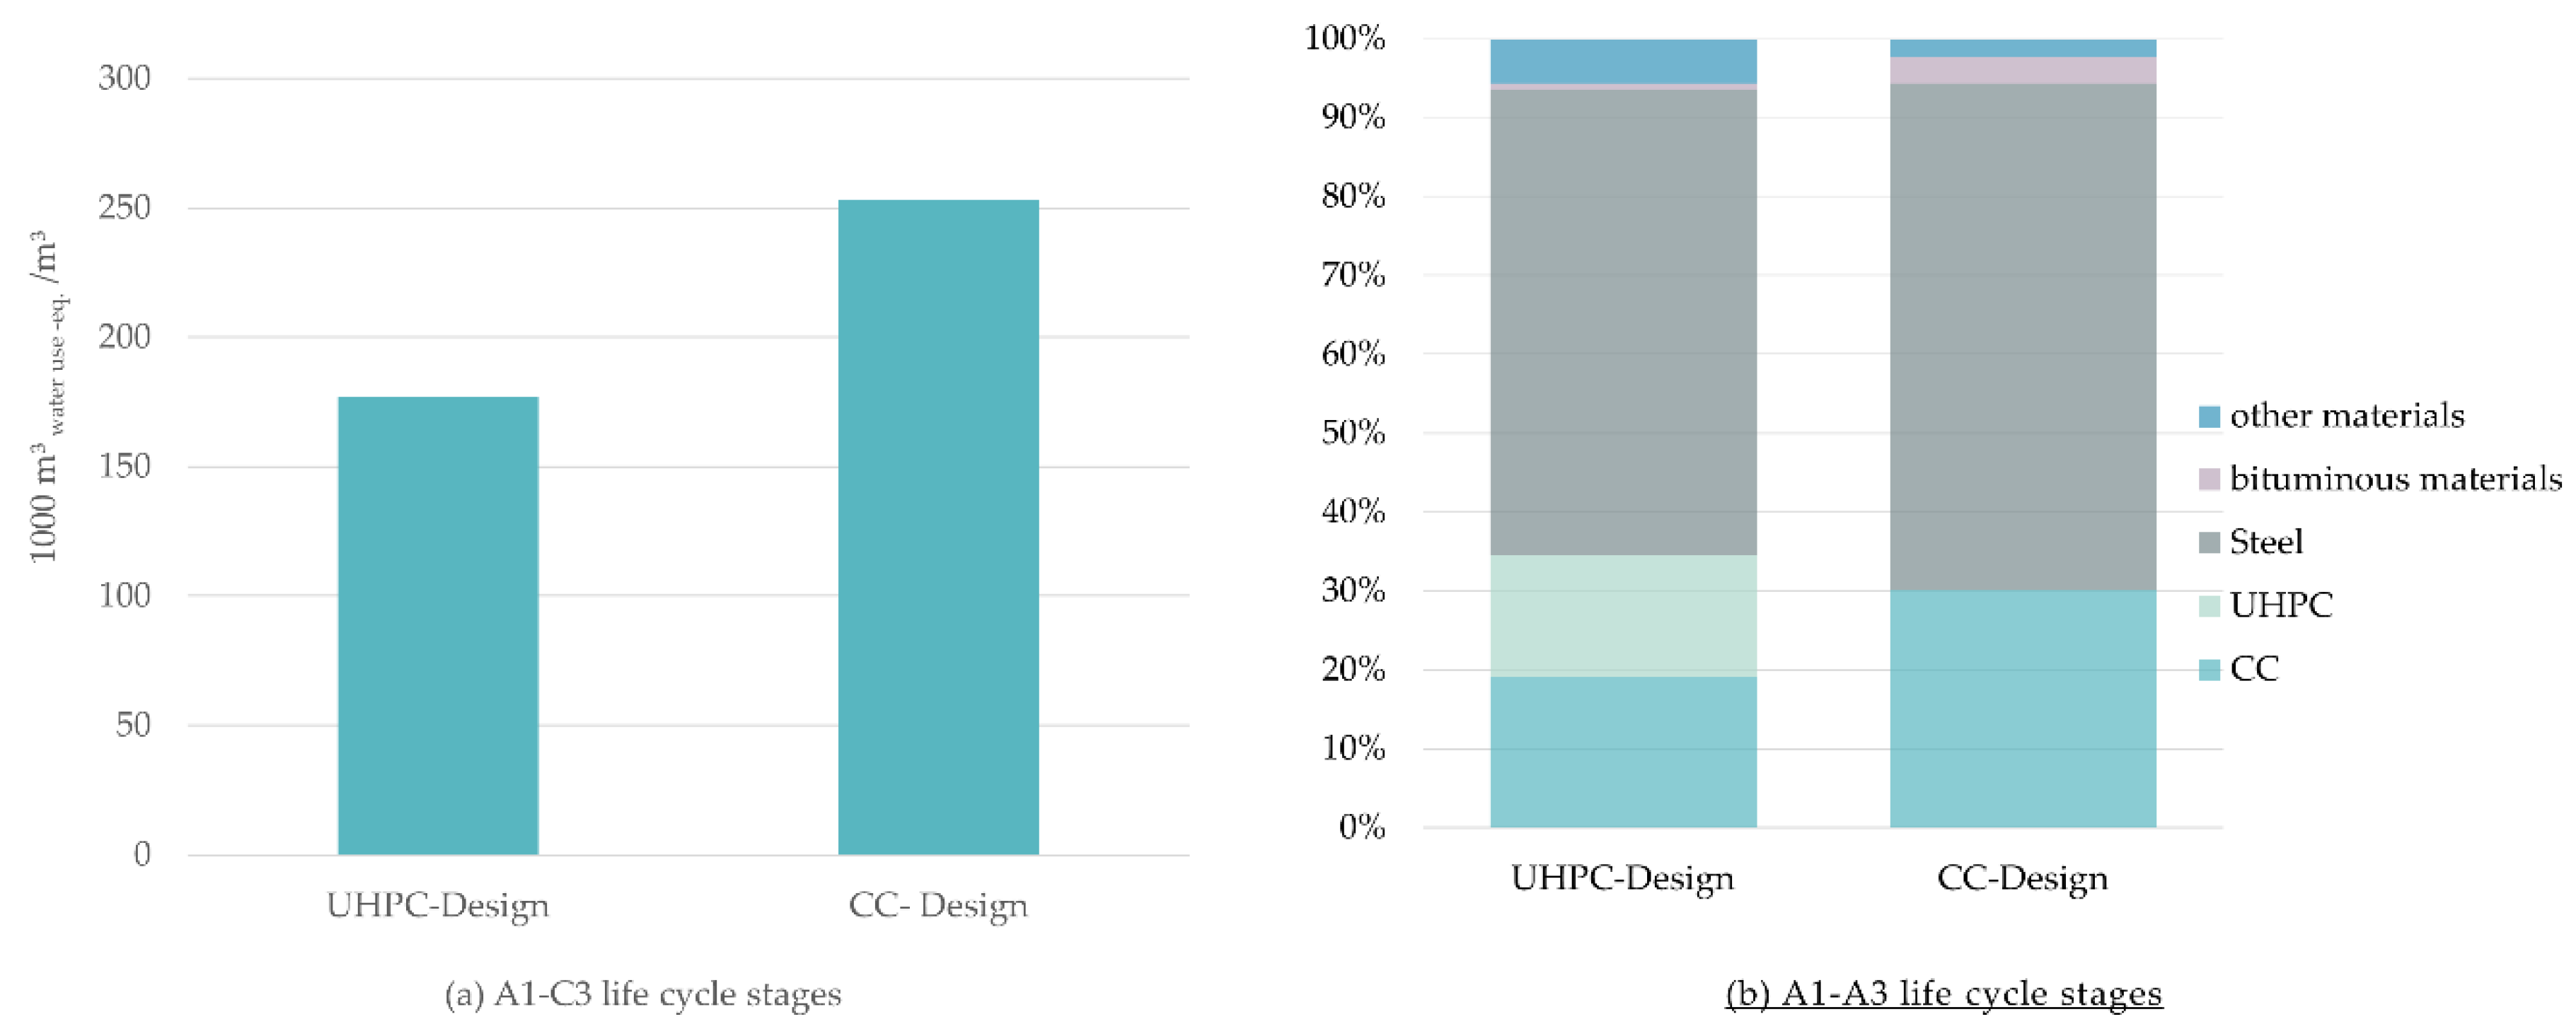
3.4. Water Footprint at Case Study Level
3.5. Summary of Analyses at Material and Case Study Level
4. Conclusions
Author Contributions
Funding
Acknowledgments
Conflicts of Interest
Appendix A
Appendix A.1. Life Cycle Inventory of UHPC

| Flow | Quantity | Unit | Process |
|---|---|---|---|
| Cement (CEM I) | 775.00 | kg | Cement (CEM I 52.5) (EN15804 A1-A3), production mix, at plant, technology mix, CEM I 52.5, DE |
| Quartz sand (0/2) | 946.00 | kg | Silica sand (Excavation and processing), production mix, at plant, technology mix, sand, diameter < 2 mm, DE |
| Very fine milled silica sand d50 = 20 micrometer | 193.00 | kg | Very fine milled silica sand d50 = 20 micrometer, at plant, Production, median diameter of silica sand grains is 20 micrometers, EU-27 |
| Plasticizer | 23.50 | kg | Concrete admixtures Plasticizer and superplasticizer—Deutsche Bauchemie e.V. (DBC) (A1–A3), production mix, association/model EPD, valid for Germany, technology mix, 1 kg; density: 1–1.6 kg/l, DE |
| Water, ground | 183.00 | kg | - |
| Transporting capacity | 7.31 * | tkm | Transportation by rail (EN15804 A4), production mix, at plant, technology mix, DE |
| Transporting capacity | 9.20 ** | tkm | Container ship (EN15804 A4), production mix, at plant, technology mix, heavy fuel oil driven, cargo, Average, DE |
| Transporting capacity | 398.58 *** | tkm | Truck (EN15804 A4), production mix, at plant, technology mix, DE |
| Electricity | 7.09 | kWh | Electricity grid mix 1 kV–60 kV, consumption mix, to consumer, AC, technology mix, 1 kV–60 kV, DE |
| Light fuel oil | 0.21 | kg | Light fuel oil at refinery (EN15804 B6), production mix, at refinery, from crude oil, 0.1 wt.% sulphur, DE |
| Diesel | 0.07 | kg | Diesel mix at filling station, consumption mix, at filling station, from crude oil and bio components, 8.37 wt.% bio components, DE |
| Micro steel fibers | 192 | kg | See production of 1 kg micro steel fibers |
| Flow | Quantity | Unit | Process |
|---|---|---|---|
| Cement (CEM I) | 832.00 | kg | Cement (CEM I 52.5) (EN15804 A1–A3), production mix, at plant, technology mix, CEM I 52.5, DE |
| Quartz sand (0/2) | 975.00 | kg | Silica sand (Excavation and processing), production mix, at plant, technology mix, sand, diameter < 2 mm, DE |
| Very fine milled silica sand d50 = 20 micrometer | 207.00 | kg | Very fine milled silica sand d50 = 20 micrometer, at plant, Production, median diameter of silica sand grains is 20 micrometers, EU-27 |
| Plasticizer | 29.40 | kg | Concrete admixtures Plasticizer and superplasticizer—Deutsche Bauchemie e.V. (DBC) (A1–A3), production mix, association / model EPD, valid for Germany, technology mix, 1 kg; density: 1–1.6 kg/l, DE |
| Water, ground | 166.00 | kg | - |
| Transporting capacity | 7.85 * | tkm | Transportation by rail (EN15804 A4), production mix, at plant, technology mix, DE |
| Transporting capacity | 9.88 ** | tkm | Container ship (EN15804 A4), production mix, at plant, technology mix, heavy fuel oil driven, cargo, Average, DE |
| Transporting capacity | 389.37 *** | tkm | Truck (EN15804 A4), production mix, at plant, technology mix, DE |
| Electricity | 26.42 | MJ | Electricity grid mix 1 kV–60 kV, consumption mix, to consumer, AC, technology mix, 1 kV–60 kV, DE |
| Light fuel oil | 2.73 | kg | Light fuel oil at refinery (EN15804 B6), production mix, at refinery, from crude oil, 0.1 wt.% sulphur, DE |
| Diesel | 0.07 | kg | Diesel mix at filling station, consumption mix, at filling station, from crude oil and bio components, 8.37 wt.% bio components, DE |
| Micro steel fibers | 192 | kg | See production of 1 kg micro steel fibers |
| Description | Flow | Quantity | Unit | Process |
|---|---|---|---|---|
| crude steel production | steel, low-alloyed, RER | 1.005362 | kg | steel production, converter, low-alloyed, cut-off, U, RER |
| Hot rolling to wire | Hot rolling, steel, RER | 1.005362 | kg | hot rolling, steel, cut-off, U, RER |
| Descaling | Electricity, low voltage, DE | 0.0357 | kWh | BKV: electricity voltage transformation from medium to low voltage, grid 2030 |
| Industrial machine, heavy, unspecified, RER | 1.42 × 10⁻⁵ | kg | industrial machine production, heavy, unspecified, cut-off, U, RER | |
| Dry drawing | Electricity, low voltage, DE | 0.114 | kWh | BKV: electricity voltage transformation from medium to low voltage, grid 2030 |
| Industrial machine, heavy, unspecified, RER | 1.38 × 10⁻⁴ | kg | industrial machine production, heavy, unspecified, cut-off, U, RER | |
| Soap, RER | 0.012 | kg | soap production, cut-off, U, RER | |
| wet drawing | Electricity, low voltage, DE | 2.452 | kWh | BKV: electricity voltage transformation from medium to low voltage, grid 2030 |
| Industrial machine, heavy, unspecified, RER | 9.74 × 10⁻⁴ | kg | industrial machine production, heavy, unspecified, cut-off, U, RER | |
| Lubricating oil, RER | 0.002 | kg | lubricating oil production, cut-off, U, RER | |
| Tap water, Europe without Switzerland | 0.02 | kg | market for tap water, cut-off, U, Europe without Switzerland | |
| Annealing | Electricity, low voltage, DE | 0.126 | kWh | BKV: electricity voltage transformation from medium to low voltage, grid 2030 |
| Industrial machine, heavy, unspecified, RER | 2.28 × 10⁻⁴ | kg | industrial machine production, heavy, unspecified, cut-off, U, RER | |
| stranding | Electricity, low voltage, DE | 0.937 | kWh | BKV: electricity voltage transformation from medium to low voltage, grid 2030 |
| Industrial machine, heavy, unspecified, RER | 2.60·10−3 | kg | industrial machine production, heavy, unspecified, cut-off, U, RER | |
| Cutting | Electricity, low voltage, DE | 0.033 | kWh | BKV: electricity voltage transformation from medium to low voltage, grid 2030 |
| Industrial machine, heavy, unspecified, RER | 1.56 × 10⁻⁴ | kg | industrial machine production, heavy, unspecified, cut-off, U, RER |
Appendix A.2. Life Cycle Inventory of Conventional Concrete
| Flow | Quantity | Unit | Process |
|---|---|---|---|
| Cement (CEM II/A) | 356.00 | kg | Cement (CEM II/A) (EN15804 A1–A3), production mix, at plant, technology mix, CEM II/A, DE |
| Gravel (2/32) | 1168.00 | kg | Gravel grain 2–32 mm, production mix, at plant, technology mix, dried, DE |
| Plasticizer | 1.80 | kg | Concrete admixtures plasticizer and superplasticizer - Deutsche Bauchemie e.V. (DBC) (A1–A3), production mix, association/model EPD, valid for Germany, technology mix, 1 kg; density: 1–1.6 kg/l DE |
| Sand (0/2) | 640.00 | kg | Sand grain 0–2 mm (dried) (EN15804 A1–A3), production mix, at plant, technology mix, grain size 0–2 mm, DE |
| Water | 165.00 | kg | - |
| Transporting capacity | 4.70 * | tkm | Transportation by rail (EN15804 A4), production mix, at plant, technology mix, DE |
| Transporting capacity | 11.35 ** | tkm | Container ship (EN15804 A4), production mix, at plant, technology mix, heavy fuel oil driven, cargo, Average, DE |
| Transporting capacity | 97.08 *** | tkm | Truck (EN15804 A4), production mix, at plant, technology mix, DE |
| Electricity | 4.43 | kWh | Electricity grid mix 1 kV–60 kV, consumption mix, to consumer, AC, technology mix, 1 kV–60 kV, DE |
| Light fuel oil | 0.21 | kg | Light fuel oil at refinery (EN15804 B6), production mix, at refinery, from crude oil, 0.1 wt.% sulphur, DE |
| Diesel | 0.07 | kg | Diesel mix at filling station, consumption mix, at filling station, from crude oil and bio components, 8.37 wt.% bio components, DE |
| Flow | Quantity | Unit | Process |
|---|---|---|---|
| Cement (CEM II/A) | 405.00 | kg | Cement (CEM II/A) (EN15804 A1–A3), production mix, at plant, technology mix, CEM II/A, DE |
| Gravel (2/32) | 1198.00 | kg | Gravel grain 2–32 mm, production mix, at plant, technology mix, dried, DE |
| Plasticizer | 4.60 | kg | Concrete admixtures Plasticizer and superplasticizer, Deutsche Bauchemie e.V. (DBC) (A1–A3), production mix, association/model EPD, valid for Germany, technology mix, 1 kg; density: 1–1.6 kg/l DE |
| Sand (0/2) | 654.00 | kg | Sand grain 0–2 mm (dried) (EN15804 A1–A3), production mix, at plant, technology mix, grain size 0–2 mm, DE |
| Water | 141.00 | kg | - |
| Transporting capacity | 5.19 * | tkm | Transportation by rail (EN15804 A4), production mix, at plant, technology mix, DE |
| Transporting capacity | 12.10 ** | tkm | Container ship (EN15804 A4), production mix, at plant, technology mix, heavy fuel oil driven, cargo, Average, DE |
| Transporting capacity | 100.82 *** | tkm | Truck (EN15804 A4), production mix, at plant, technology mix, DE |
| Electricity | 16.85 | MJ | Electricity grid mix 1 kV–60 kV, consumption mix, to consumer, AC, technology mix, 1 kV–60 kV, DE |
| Light fuel oil | 2.73 | kg | Light fuel oil at refinery (EN15804 B6), production mix, at refinery, from crude oil, 0.1 wt.% sulphur, DE |
| Diesel | 0.07 | kg | Diesel mix at filling station, consumption mix, at filling station, from crude oil and bio components, 8.37 wt.% bio components, DE |
Appendix A.3. Life Cycle Inventory of Transport to Construction Site (A4 Life Cycle Stage) and Construction (A5 Life Cycle Stage)
| Flow | Quantity | Unit | Process |
|---|---|---|---|
| Transporting capacity | 281.99 * | tkm | Truck (EN15804 A4), production mix, at plant, technology mix, DE |
| Diesel | 1.79 ** | kg | Diesel mix at filling station, consumption mix, at filling station, from crude oil and bio components, 8.37 wt.% bio components, DE |
| Flow | Quantity | Unit | Process |
|---|---|---|---|
| Transporting capacity | 4860.00 * | tkm | Road train (EN15804 A4), production mix, at plant, technology mix, DE |
| Type of Concrete | Flow | Quantity | Unit | Process |
|---|---|---|---|---|
| C35/45 | Electricity | 0.90 | MJ | Electricity grid mix 1 kV–60 kV, consumption mix, to consumer, AC, technology mix, 1 kV–60 kV, DE |
| M3Q | Diesel | 0.33 | kg | Diesel mix at filling station, consumption mix, at filling station, from crude oil and bio components, 8.37 wt.% bio components, DE |
| C50/60 M2Q | Electricity | 19.20 | MJ | Electricity grid mix 1 kV–60 kV, consumption mix, to consumer, AC, technology mix, 1 kV–60 kV, DE |
Appendix A.4. Life Cycle Inventory of C1–C3 Life Cycle Stages
| Type of Concrete | Flow | Quantity | Unit | Process |
|---|---|---|---|---|
| CC | Diesel | 0.51 | kg | Diesel mix at filling station, consumption mix, at filling station, from crude oil and bio components, 8.37 wt.% bio components, DE |
| UHPC | 5.92 |
| Flow | Quantity | Unit | Process |
|---|---|---|---|
| Transporting capacity | 810.00 * | tkm | Road train (EN15804 A4), production mix, at plant, technology mix, DE |
| Type of Concrete | Flow | Quantity | Unit | Process |
|---|---|---|---|---|
| CC | Electricity | 18.26 | MJ | Electricity grid mix 1 kV-60 kV, consumption mix, to consumer, AC, technology mix, 1 kV–60 kV, DE |
| UHPC | 21.21 | |||
| CC | Diesel | 0.76 | kg | Diesel mix at filling station, consumption mix, at filling station, from crude oil and bio components, 8.37 wt.% bio components, DE |
| UHPC | 0.87 |
Appendix B. Life Cycle Inventory of the Sensitivity Analysis
| Material | Process | Database |
|---|---|---|
| CEM III/A | Cement (CEM III A) (EN15804 A1–A3), production mix, at plant, technology mix, CEM III A | GaBi construction material database |
| steel (electric production) | steel production, electric, low-alloyed, cut-off, U | Ecoinvent 3.1 database |
Appendix C. Life Cycle Inventory of The Case Study
Appendix C.1. Life Cycle Inventory for A1–A3 Life Cycle Stages
| Material | Quantity | Unit | Process |
|---|---|---|---|
| Bitumen | 169.54 | kg | Bitumen at refinery, production mix, at refinery, from crude oil, DE |
| Bitumen sheets | 3064.36 | kg | Bitumen sheets PYE-PV 200 S5 (not slated) (EN15804 A1–A3), production mix, at plant, technology mix, 5,2 kg/m2, DE |
| Bitumen sheets | 30.42 | kg | Bitumen sheet v 60 (EN15804 A1–A3), production mix, at plant, technology mix, 5 kg/m2, DE |
| Quartz sand (0/2) | 843.00 | kg | Silica sand (Excavation and processing), production mix, at plant, technology mix, sand, diameter < 2 mm, DE |
| C25/30, A1–A3 | 59.00 | m3 | C25/30, A1–A3 |
| C35/45, A1–A3 | 159.00 | m3 | C35/45, A1–A3 |
| C50/60, A1–A3 | 142.00 | m3 | C50/60, A1–A3 |
| Epoxy resin | 562.00 | kg | Epoxy Resin (EP) Mix, consumption mix, to consumer, from Bisphenol A and epichlorohydrin, approx. 1.15 g/cm3, DE |
| Melted asphalt, integrated | 56.45 | t | Mastic asphalt (EN15804 A1–A3), production mix, at plant, technology mix, 2400 kg/m3, DE |
| Split (2/15) | 1950.00 | kg | Crushed stone grain 2–15 mm (EN15804 A1–A3), production mix, at plant, technology mix, dried, DE |
| Steel wire | 68.00 | t | Reinforced steel (wire) (EN15804 A1–A3), production mix, at plant, EAF route, wire, DE |
| Material | Quantity | Unit | Process |
|---|---|---|---|
| Bitumen | 96.58 | kg | Bitumen at refinery, production mix, at refinery, from crude oil, DE |
| C35/45, A1–A3 | 25.00 | m3 | C35/45, A1–A3 |
| C50/60, A1–A3 | 180.00 | m3 | C50/60, A1–A3 |
| Crushed sand (0/2) | 900.00 | kg | Limestone, crushed stone fines (Grain size 0/4) (EN15804 A1–A3), production mix, at plant, technology mix, grain size 0/4, DE |
| Epoxy resin | 1.24 | t | Epoxy Resin (EP) Mix, consumption mix, to consumer, from Bisphenol A and epichlorohydrin, approx. 1.15 g/cm3, DE |
| Melted asphalt, integrated | 1.73 | t | Mastic asphalt (EN15804 A1–A3), production mix, at plant, technology mix, 2400 kg/m3, DE |
| Sikaflex-651 S LVP | 122.85 | kg | PUR sealing compound (EN15804 A1–A3), production mix, at plant, technology mix, PUR, DE |
| Steel wire | 61.90 | t | Reinforced steel (wire) (EN15804 A1–A3), production mix, at plant, EAF route, wire, DE |
| Stone mastic asphalt | 28.80 | t | Stone mastic asphalt SMA (EN15804 A1–A3), production mix, at plant, technology mix, SMA, DE |
| UHPC M2Q, A1–A3, ready-mix concrete | 1.10 | m3 | UHPC M2Q, A1–A3, Transport |
| UHPC M2Q, A1–A3 | 33.00 | m3 | UHPC M2Q, A1–A3 |
| UHPC M3Q+, A1–A3 | 27.50 | m3 | UHPC M3Q+, A1–A3 |
| Micro steel fibers | 11.83 * | t | See input data for production of 1 kg steel fibers |
Appendix C.2. Life Cycle Inventory of A4 LIFE CYCLE STAGE
| Material | Quantity | Means of Transport | Trips | Utilization | Distance | Payload | Transport Capacity |
|---|---|---|---|---|---|---|---|
| (Quantity) | (%) | (km) | (t) | ||||
| C35/45 | 159.00 m3 | Truck | 42 | 50 | 16.3 | 17.3 | 5978.19 tkm + 39.38 kg Diesel |
| 2 | 10 | 16.3 | 17.3 | ||||
| C50/60 | 142.00 m3 | Road Train | 20 | 50 | 180 | 34.08 * | 61,344.00 tkm |
| C25/30 | 59.00 m3 | Truck | 16 | 50 | 16.3 | 17.3 | 2255.92 tkm + 14.32 kg Diesel |
| Epoxy resin | 0.56 t | Van | 2 | 6 | 30 | 5 | 18.00 tkm |
| Quartz sand | 0.84 t | Small Truck | 2 | 5 | 30 | 9.3 | 27.90 tkm |
| Bituminous sheeting | 3.09 t | Van | 2 | 30 | 30 | 5 | 90.00 tkm |
| Mastic asphalt | 56.45 t | Road Train | 4 | 50 | 30 | 27 | 1620.00 tkm + 6.10 kg Diesel + 2.65 kg heating oil |
| Joint sealant | 0.17 t | Van | 2 | 2 | 30 | 5 | 5.10 tkm |
| Spreading material | 1.95 t | Small Truck | 2 | 10 | 30 | 9.3 | 55.80 tkm |
| Steel | 68.00 t | Road Train | 4 | 50 | 150 | 27 | 10125 tkm |
| 2 | 25 | 150 | 27 |
| Medium | Quantity | Unit | Delivery Process |
|---|---|---|---|
| Diesel | 59.80 | kg | Diesel mix at filling station, consumption mix, at filling station, from crude oil and bio components, 8.37 wt.% bio components, DE |
| Light fuel oil | 2.65 | kg | Light fuel oil at refinery (EN15804 B6), production mix, at refinery, from crude oil, 0.1 wt.% sulphur, DE |
| Transporting capacity | 113.10 | tkm | Delivery van (EN15804 A4), production mix, at plant, technology mix, diesel driven, cargo, DE |
| Transporting capacity | 83.70 | tkm | Small truck (EN15804 A4), production mix, at plant, technology mix, DE |
| Transporting capacity | 8234.11 | tkm | Truck (EN15804 A4), production mix, at plant, technology mix, DE |
| Transporting capacity | 73,089.00 | tkm | Road train (EN15804 A4), production mix, at plant, technology mix, DE |
| Material | Quantity | Transport Medium | Rides | Workload | Distance | Payload | Transport Capacity |
|---|---|---|---|---|---|---|---|
| (Quantity) | (%) | (km) | (t) | ||||
| C35/45 | 25.00 m3 | Truck | 6 | 50 | 16.3 | 17.3 | 930.57 tkm + 7.16 kg Diesel |
| 2 | 15 | 16.3 | 17.3 | ||||
| C50/60 | 180.00 m3 | Road Train | 20 | 50 | 180 | 43.2 * | 77,760.00 tkm |
| M3Q+ | 27.50 m3 | Truck | 6 | 50 | 16.3 | 17.3 | 1015.16 tkm + 7.16 kg Diesel |
| 2 | 30 | 16.3 | 17.3 | ||||
| M2Q | 1.1 m3 | Truck | 2 | 10 | 16.3 | 17.3 | 56.40 tkm + 1.79 kg diesel |
| 33.00 m3 | Road Train | 6 | 50 | 180 | 27 | 14,580.00 tkm | |
| Polyurethane cement | 0.12 t | Van | 2 | 1 | 30 | 5 | 3.00 tkm |
| Mastic asphalt | 1.73 t | Small Truck | 2 | 10 | 30 | 9.3 | 55.80 tkm + 3.04 kg diesel + 1.33 kg heating oil |
| Sma | 28.80 | Road Train | 2 | 50 | 30 | 27 | 810.00 tkm |
| Joint sealant | 0.10 t | Van | 2 | 1 | 30 | 5 | 3.00 tkm |
| Spreading material | 0.90 t | Small Truck | 2 | 5 | 30 | 9.3 | 27.90 tkm |
| Epoxy resin | 1.86 t | Van | 2 | 19 | 30 | 5 | 57.00 tkm |
| Steel | 61.90 t | Road Train | 4 | 50 | 150 | 27 | 9315 tkm |
| 2 | 15 | 150 | 27 |
| Medium | Quantity | Unit | Delivery Process |
|---|---|---|---|
| Diesel | 19.15 | kg | Diesel mix at filling station, consumption mix, at filling station, from crude oil and bio components, 8.37 wt.% bio components, DE |
| Light fuel oil | 1.33 | kg | Light fuel oil at refinery (EN15804 B6), production mix, at refinery, from crude oil, 0.1 wt.% sulphur, DE |
| Transporting capacity | 63.00 | tkm | Delivery van (EN15804 A4), production mix, at plant, technology mix, diesel driven, cargo, DE |
| Transporting capacity | 83.70 | tkm | Small truck (EN15804 A4), production mix, at plant, technology mix, DE |
| Transporting capacity | 2002.13 | tkm | Truck (EN15804 A4), production mix, at plant, technology mix, DE |
| Transporting capacity | 102,465.00 | tkm | Road train (EN15804 A4), production mix, at plant, technology mix, DE |
Appendix C.3. Life Cycle Inventory of A5 Life Cycle Stage
| Component | Construction Machine | Specific Consumption | Quantity | Needs | Energy Carriers |
|---|---|---|---|---|---|
| Sealing layer | Surface welding installation device | 0.33 kg/m2 | 612.70 m2 | 202.19 kg | Propane |
| Cross member | Truck concrete pump | 0.39 L/m3 | 159.00 m3 | 61.85 L | Diesel |
| Internal vibrator | 0.9 MJ/m3 | 143.10 MJ | Electricity | ||
| Side member | Crane | 19.2 MJ/m3 | 142.00 m3 | 2726.40 MJ | Electricity |
| Topping | Cooker | 8.00 L/h | 0.40 h | 3.20 L | Diesel |
| 3.50 L/h | 1.40 L | Fuel oil | |||
| Plank | 5.00 L/h | 2.00 L | Diesel | ||
| Potting stove | 0.60 kg/h | 7.70 h | 4.62 kg | Propane | |
| Rubber wheeled roller | 8.00 L/h | 0.09 h | 0.72 L | Diesel | |
| Smooth roller | 8.00 L/h | 0.11 h | 0.88 L | Diesel | |
| Road caps | Truck concrete pump | 0.39 L/m3 | 59.00 m3 | 22.95 L | Diesel |
| Internal vibrator | 0.9 MJ/m3 | 53.10 MJ | Electricity | ||
| Steel | Crane | 8 MJ/t | 68.00 t | 544.00 MJ | Electricity |
| Medium | Quantity | Unit | Delivery Process |
|---|---|---|---|
| Diesel | 77.40 | kg | Diesel mix at filling station, consumption mix, at filling station, from crude oil and bio components, 8.37 wt.% bio components, DE |
| Electricity | 3466.60 | MJ | Electricity grid mix 1 kV–60 kV, consumption mix, to consumer, AC, technology mix, 1 kV–60 kV, DE |
| Light fuel oil | 1.18 | kg | Light fuel oil at refinery (EN15804 B6), production mix, at refinery, from crude oil, 0.1 wt.% sulphur, DE |
| Liquefied petroleum gas | 206.81 | kg | Liquefied Petroleum Gas (LPG) (EN15804 B6), production mix, at refinery, Mix of 70% propane and 30% butane, DE |
| Component | Construction Machine | Specific Consumption | Quantity | Need | Energy Carriers |
|---|---|---|---|---|---|
| Cross member | Truck concrete pump | 0.39 L/m3 | 25.00 m3 | 9.73 L | Diesel |
| Internal vibrator | 0.9 MJ/m3 | 22.50 MJ | Electricity | ||
| Side member | Crane | 19.2 MJ/m3 | 180.00 m3 | 3456.00 MJ | Electricity |
| Truck concrete pump | 0.39 L/m3 | 27.50 m3 | 10.70 L | Diesel | |
| Internal vibrator | 0.9 MJ/m3 | 24.75 MJ | Electricity | ||
| Concrete Joints | Truck concrete pump | 0.39 L/m3 | 1.1 m3 | 0.43 L | Diesel |
| Internal vibrator | 0.9 MJ/m3 | 0.99 MJ | Electricity | ||
| Topping | Cooker | 8.00 L/h | 0.33 h | 2.64 L | Diesel |
| 3.50 L/h | 1.16 L | Heating oil | |||
| Finisher | 8.5 L/h | 0.18 h | 1.53 L | Diesel | |
| Potting stove | 0.6 kg/h | 4.40 h | 2.64 kg | Propane | |
| Roller | 6.00 L/h | 0.18 h | 1.08 L | Diesel | |
| Steel | Crane | 8 MJ/t | 61.90 t | 495.20 MJ | Electricity |
| Medium | Quantity | Unit | Delivery Process |
|---|---|---|---|
| Diesel | 22.05 | kg | Diesel mix at filling station, consumption mix, at filling station, from crude oil and bio components, 8.37 wt.% bio components, DE |
| Electricity | 4633.04 | MJ | Electricity grid mix 1 kV–60 kV, consumption mix, to consumer, AC, technology mix, 1 kV–60 kV, DE |
| Light fuel oil | 0.97 | kg | Light fuel oil at refinery (EN15804 B6), production mix, at refinery, from crude oil, 0.1 wt.% sulphur, DE |
| Liquefied petroleum gas | 2.64 | kg | Liquefied Petroleum Gas (LPG) (EN15804 B6), production mix, at refinery, Mix of 70% propane and 30% butane, DE |
Appendix C.4. Life Cycle Inventory for B Life Cycle Stage
| Task | Construction Machine | Specific Consumption | Quantity | Need | Energy Carriers |
|---|---|---|---|---|---|
| Removal | Milling machine | 2.54 L/m3 | 23.67 m3 | 60.12 L | Diesel |
| Excavator with peeling device | 0.2 L/m2 | 612.70 m2 | 122.54 L | Diesel | |
| 0.13 L/m2 | 79.65 L | Propane | |||
| Editing | Treatment facility | 13.00 MJ/t | 63.06 t | 819.78 MJ | Diesel |
| 10.00 MJ/t | 630.60 MJ | Electricity | |||
| Renewal | Surface welding installation device | 0.33 | 612.70 | 202.19 kg | Propane |
| Cooker + plank | 13.00 | 0.40 | 5.20 L | Diesel | |
| Cooker | 3.50 | 0.40 | 1.40 L | Heating oil | |
| Potting stove | 0.60 | 7.70 | 4.62 kg | Propane | |
| Rubber wheeled roller | 8.00 | 0.09 | 0.72 L | Diesel | |
| Smooth roller | 8.00 | 0.11 | 0.88 L | Diesel |
| Material | Quantity | Means of Transport | Rides | Workload | Distance | Payload | Transport Capacity |
|---|---|---|---|---|---|---|---|
| (Quantity) | (%) | (km) | (t) | ||||
| Outward transport | |||||||
| Covering + sealing | 63.06 t | Road Train | 4 | 50 | 30 | 27 | 1863.00 t km |
| 2 | 15 | 30 | 27 | ||||
| Delivery transport | |||||||
| Epoxy resin | 0.56 t | Van | 2 | 6 | 30 | 5 | 18.00 t km |
| Quartz sand | 0.84 t | Small Truck | 2 | 5 | 30 | 9.3 | 27.90 t km |
| Bituminous sheeting | 3.09 t | Van | 2 | 30 | 30 | 5 | 90.00 t km |
| Mastic asphalt | 56.45 t | Road Train | 4 | 50 | 30 | 27 | 1620.00 t km + 6.10 kg Diesel + 2.65 kg heating oil |
| Joint sealant | 0.17 t | Van | 2 | 2 | 30 | 5 | 5.10 t km |
| Spreading material | 1.95 t | Small Truck | 2 | 10 | 30 | 9.3 | 55.80 t km |
| Material | Quantity | Unit | Delivery Process |
|---|---|---|---|
| Bitumen | 169.54 | kg | Bitumen at refinery, production mix, at refinery, from crude oil, DE |
| Bitumen sheets | 3064.36 | kg | Bitumen sheets PYE-PV 200 S5 (not slated) (EN15804 A1–A3), production mix, at plant, technology mix, 5.2 kg/m2, DE |
| Bitumen sheets | 30.42 | kg | Bitumen sheet v 60 (EN15804 A1–A3), production mix, at plant, technology mix, 5 kg/m2, DE |
| Epoxy resin | 562.00 | kg | Epoxy Resin (EP) Mix, consumption mix, to consumer, from Bisphenol A and epichlorohydrin, approx. 1.15 g/cm3, DE |
| Quartz sand (0/2) | 843.00 | kg | Silica sand (Excavation and processing), production mix, at plant, technology mix, sand, diameter < 2 mm, DE |
| Diesel | 188.52 | kg | Diesel mix at filling station, consumption mix, at filling station, from crude oil and bio components, 8.37 wt.% bio components, DE |
| Electricity | 630.60 | MJ | Electricity grid mix 1 kV–60 kV, consumption mix, to consumer, AC, technology mix, 1 kV–60 kV, DE |
| Light fuel oil | 5.16 | kg | Light fuel oil at refinery (EN15804 B6), production mix, at refinery, from crude oil, 0.1 wt.% sulphur, DE |
| Liquefied petroleum gas | 206.97 | kg | Liquefied Petroleum Gas (LPG) (EN15804 B6), production mix, at refinery, Mix of 70% propane and 30% butane, DE |
| Melted asphalt | 56.45 | t | Mastic asphalt (EN15804 A1–A3), production mix, at plant, technology mix, 2400 kg/m3, DE |
| Split (2/15) | 1950.00 | kg | Crushed stone grain 2–15 mm (EN15804 A1–A3), production mix, at plant, technology mix, dried, DE |
| Transporting capacity | 113.10 | tkm | Delivery van (EN15804 A4), production mix, at plant, technology mix, diesel driven, cargo, DE |
| Transporting capacity | 83.70 | tkm | Small truck (EN15804 A4), production mix, at plant, technology mix, DE |
| Transporting capacity | 3483.00 | tkm | Road train (EN15804 A4), production mix, at plant, technology mix, DE |
| Task | Construction Machine | Specific Consumption | Quantity | Needs | Energy Carriers |
|---|---|---|---|---|---|
| Removal | Hydraulic hammer, steel cutting + loading | 17.60 L/m3 | 59.00 m3 | 1038.40 L | Diesel |
| Pneumatic hammer | 0.43 L/m2 | 108.18 m2 | 46.52 L | Diesel | |
| Sandblasting | 0.48 L/m2 | 51.93 L | Diesel | ||
| Editing | Dredgers | 0.30 L/m3 | 63.33 m3 | 19.00 L | Diesel |
| Wheel loader | 0.60 L/m3 | 38.00 L | Diesel | ||
| Treatment facility | 18.26 MJ/m3 | 1156.35 MJ | Electricity | ||
| Treatment facility | 13.00 MJ/t | 8.00 t | 104.00 MJ | Diesel | |
| 10.00 MJ/t | 80.00 MJ | Electricity | |||
| Renew | Truck concrete pump | 0.39 L/m3 | 59.00 m3 | 22.95 L | Diesel |
| Internal vibrator | 0.90 MJ/m3 | 53.10 MJ | Electricity | ||
| Shotcrete | 0.40 L/m2 | 43.27 L | Diesel | ||
| Crane | 8.00 MJ/t | 8.00 t | 64.00 MJ | Electricity |
| Material | Quantity | Means of Transport | Rides | Workload | Distance | Payload | Transport Capacity |
|---|---|---|---|---|---|---|---|
| (Quantity) | (%) | (km) | (t) | ||||
| Outward transport | |||||||
| Concrete fracture | 152 t | Road Train | 10 | 50 | 30 | 27 | 4536.00 tkm |
| 2 | 30 | 30 | 27 | ||||
| Steel | 8.00 t | Small Truck | 2 | 43 | 150.00 | 9.30 | 1199.70 tkm |
| Delivery transport | |||||||
| C25/30 | 59.00 m3 | Truck | 16 | 50 | 16.30 | 17.30 | 2255.92 tkm + 14.32 kg Diesel |
| Steel | 8.00 t | Small Truck | 2 | 43 | 150.00 | 9.30 | 1199.70 tkm |
| Shotcrete | 4.33 m3 | Truck | 2 | 30 | 16.30 | 17.30 | 169.19 + 1.79 kg Diesel |
| Material | Quantity | Unit | Delivery Process |
|---|---|---|---|
| C25/30, A1–A3 | 59.00 | m3 | C25/30. A1-A3 |
| C35/45, A1–A3 | 4.33 | m3 | C35/45, A1-A3 |
| Steel wire | 8.00 | t | Reinforced steel (wire) (EN15804 A1–A3), production mix, at plant, EAF route, wire, DE |
| Diesel | 1083.31 | kg | Diesel mix at filling station, consumption mix, at filling station, from crude oil and bio components, 8.37 wt.% bio components, DE |
| Electricity | 1353.45 | MJ | Electricity grid mix 1 kV–60 kV, consumption mix, to consumer, AC, technology mix, 1 kV–60 kV, DE |
| Transporting capacity | 2425.11 | tkm | Truck (EN15804 A4), production mix, at plant, technology mix, DE |
| Transporting capacity | 4536.00 | tkm | Road train (EN15804 A4), production mix, at plant, technology mix, DE |
| Transporting capacity | 2399.40 | tkm | Small truck (EN15804 A4), production mix, at plant, technology mix, DE |
| Task | Construction Machine | Specific Consumption | Quantity | Needs | Energy Carrier |
|---|---|---|---|---|---|
| Removal | Milling machine | 2.54 L/m3 | 12.81 m3 | 32.54 L | Diesel |
| Editing | Treatment facility | 13.00 MJ/t | 31.52 t | 409.76 MJ | Diesel |
| 10.00 MJ/t | 315.20 MJ | Electricity | |||
| Renew | Cooker | 8.00 L/h | 0.33 h | 2.64 L | Diesel |
| 3.50 L/h | 1.16 L | Heating oil | |||
| Finisher | 8.50 L/h | 0.18 h | 1.53 L | Diesel | |
| Potting stove | 0.60 kg/h | 4.40 h | 2.64 kg | Propane | |
| Roller | 6.00 L/h | 0.18 h | 1.08 l | Diesel |
| Material | Quantity | Mean of Transportation | Rides | Workload | Distance | Payload | Transport Capacity |
|---|---|---|---|---|---|---|---|
| (Quantity) | (%) | (km) | (t) | ||||
| Outward transport | |||||||
| Topping | 31.52 t | Road Train | 2 | 50 | 30 | 27 | 972.00 tkm |
| 2 | 10 | 30 | 27 | ||||
| Delivery transport | |||||||
| Mastic asphalt | 1.73 t | Small Truck | 2 | 10 | 30 | 9,3 | 55.80 tkm + 3.04 kg Diesel + 1.33 kg heating oil |
| SMA | 28.80 t | Road Train | 2 | 50 | 30 | 27 | 810.00 tkm |
| Joint sealant | 0.10 t | Van | 2 | 1 | 30 | 5 | 3.00 tkm |
| Spreading material | 0.90 t | Small Truck | 2 | 5 | 30 | 27.90 | 27.90 tkm |
| Material | Quantity | Unit | Delivery Proces |
|---|---|---|---|
| Bitumen | 96.58 | kg | Bitumen at refinery, production mix, at refinery, from crude oil, DE |
| Crushed sand (0/2) | 900.00 | kg | Limestone, crushed stone fines (Grain size 0/4) (EN15804 A1–A3), production mix, at plant, technology mix, grain size 0/4, DE |
| Diesel | 44.61 | kg | Diesel mix at filling station, consumption mix, at filling station, from crude oil and bio components, 8.37 wt.% bio components, DE |
| Electricity | 315.20 | MJ | Electricity grid mix 1 kV–60 kV, consumption mix, to consumer, AC, technology mix, 1 kV–60 kV, DE |
| Light fuel oil | 2.3 | kg | Light fuel oil at refinery (EN15804 B6), production mix, at refinery, from crude oil, 0.1 wt.% sulphur, DE |
| Liquefied petroleum gas | 2.64 | kg | Liquefied Petroleum Gas (LPG) (EN15804 B6), production mix, at refinery, Mix of 70% propane and 30% butane, DE |
| Melted asphalt, integrated | 1728.00 | kg | Mastic asphalt (EN15804 A1–A3), production mix, at plant, technology mix, 2400 kg/m3,DE |
| Stone mastic asphalt | 28.80 | t | Stone mastic asphalt SMA (EN15804 A1–A3), production mix, at plant, technology mix, SMA, DE |
| Transporting capacity | 3.00 | tkm | Delivery van (EN15804 A4), production mix, at plant, technology mix, diesel driven, cargo, DE |
| Transporting capacity | 83.70 | tkm | Small truck (EN15804 A4), production mix, at plant, technology mix, DE |
| Transporting capacity | 1782.00 | tkm | Road train (EN15804 A4), production mix, at plant, technology mix, DE |
Appendix C.5. Life Cycle Inventory for C1–C3 Life Cycle Stages
| Measure | Construction Machine | Spec. Consumption | Quantity | Needs | Energy Carrier |
|---|---|---|---|---|---|
| Discontinuance | Milling machine | 2.54 L/m3 | 23.67 m3 | 60.12 L | Diesel |
| Excavator with peeling device | 0.2 L/m2 | 612.70 m2 | 122.54 L | Diesel | |
| 0.13 L/m2 | 79.65 L | Propane | |||
| Demolition machines | 17.60 L/m3 | 360.00 m3 | 6336.00 L | Diesel | |
| Editing | Treatment facility | 13.00 MJ/t | 131.06 t | 1703.78 MJ | Diesel |
| 10.00 MJ/t | 1310.60 MJ | Electricity | |||
| Dredgers | 0.30 L/m3 | 360.00 m3 | 108.00 L | Diesel | |
| Wheel loader | 0.60 L/m3 | 216.00 L | Diesel | ||
| Concrete preparation plant | 18.26 MJ/m3 | 6573.60 MJ | Electricity |
| Material | Quantity | Mean of Transportation | Rides | Workload | Distance | Payload | Transport Capacity |
|---|---|---|---|---|---|---|---|
| (Quantity) | (%) | (km) | (t) | ||||
| Covering + sealing | 63.06 t | Road Train | 4 | 50 | 30 | 27 | 1863.00 tkm |
| 2 | 15 | 30 | 27 | ||||
| Concrete fracture | 864.00 t | Road Train | 64 | 50 | 30 | 27 | 25,920.00 tkm |
| Steel | 68.00 t | Road Train | 4 | 50 | 30 | 27 | 2025.00 tkm |
| 2 | 25 | 30 | 27 |
| Medium | Quantity | Einheit | Delivery Process |
|---|---|---|---|
| Diesel | 5822.14 | kg | Diesel mix at filling station, consumption mix, at filling station, from crude oil and bio components, 8.37 wt.% bio components, DE |
| Electricity | 7884.20 | MJ | Electricity grid mix 1 kV–60 kV, consumption mix, to consumer, AC, technology mix, 1 kV–60 kV, DE |
| Liquefied petroleum gas | 0.16 | kg | Liquefied Petroleum Gas (LPG) (EN15804 B6), production mix, at refinery, Mix of 70% propane and 30% butane, DE |
| Transporting capacity | 29,808.00 | tkm | Road train (EN15804 A4), production mix, at plant, technology mix, DE |
| Construction Machine | Specific Consumption | Quantity | Need | Energy Carrier |
|---|---|---|---|---|
| Milling machine | 2.54 L/m3 | 12.81 m3 | 32.54 L | Diesel |
| Demolition machines | 17.60 L/m3 | 205.00 m3 | 3608.00 L | Diesel |
| 35.20 L/m3 | 61.60 m3 | 2168.32 L | Diesel | |
| Treatment facility | 13.00 MJ/t | 93.42 t | 1214.46 MJ | Diesel |
| 10.00 MJ/t | 934.20 MJ | Electricity | ||
| Excavator, NC | 0.30 L/m3 | 205.00 m3 | 61.50 L | Diesel |
| Wheel loader, NC | 0.60 L/m3 | 123.00 L | Diesel | |
| Concrete preparation plant NC | 18.26 MJ/m3 | 3743.30 MJ | Electricity | |
| Excavator, UHPC | 0.43 L/m3 | 61.60 m3 | 26.49 L | Diesel |
| Wheel loader, UHPC | 0.60 L/m3 | 36.96 L | Diesel | |
| Concrete preparation plant UHPC | 21.21 MJ/m3 | 1306.54 MJ | Electricity |
| Material | Quantity | Mean of Transportation | Rides | Workload | Distance | Payload | Transport Capacity |
|---|---|---|---|---|---|---|---|
| (Quantity) | (%) | (km) | (t) | ||||
| Surface | 31.52 t | Road Train | 2 | 50 | 30 | 27 | 972.00 tkm |
| 2 | 10 | 30 | 27 | ||||
| CC Concrete demolishing | 492.00 t | Road Train | 36 | 50 | 30 | 27 | 14,742.00 tkm |
| 2 | 10 | 30 | 27 | ||||
| UHPC | 148.00 t | Road Train | 10 | 50 | 30 | 27 | 4455.00 tkm |
| 2 | 25 | 30 | 27 | ||||
| Concrete demolishing | 61.90 t | Road Train | 4 | 50 | 30 | 27 | 1863.00 tkm |
| 2 | 15 | 30 | 27 |
| Flow | Quantity | Unit | Delivery Process |
|---|---|---|---|
| Diesel | 5146.58 | kg | Diesel mix at filling station, consumption mix, at filling station, from crude oil and bio components, 8.37 wt.% bio components, DE |
| Electricity | 5984.04 | MJ | Electricity grid mix 1 kV–60 kV, consumption mix, to consumer, AC, technology mix, 1 kV–60 kV, DE |
References
- Huang, L.; Krigsvoll, G.; Johansen, F.; Liu, Y.; Zhang, X. Carbon emission of global construction sector. Renew. Sustain. Energy Rev. 2018, 81, 1906–1916. [Google Scholar] [CrossRef]
- Fischedick, M.; Görner, K.; Thomeczek, M. CO2: Abtrennung, Speicherung, Nutzung: Ganzheitliche Bewertung im Bereich von Energiewirtschaft und Industrie [CO2: Separation, Storage, Use: Holistic Assessment in the Field of Energy Industry and Industry]; Springer: Berlin/Heidelberg, Germany, 2015. [Google Scholar] [CrossRef]
- Di Maria, A.; Salman, M.; Dubois, M.; van Acker, K. Life cycle assessment to evaluate the environmental performance of new construction material from stainless steel slag. Int. J. Life Cycle Assess. 2018. [Google Scholar] [CrossRef]
- Huntzinger, D.N.; Eatmon, T.D. A life-cycle assessment of Portland cement manufacturing: Comparing the traditional process with alternative technologies. J. Clean. Prod. 2009, 17, 668–675. [Google Scholar] [CrossRef]
- Sameer, H.; Bringezu, S. Life cycle input indicators of material resource use for enhancing sustainability assessment schemes of buildings. J. Build. Eng. 2018. [Google Scholar] [CrossRef]
- European Commision. Raw Materials Scoreboard—European Innovation Partnership on Raw Materials; European Commision: Brussels, Belgium, 2016. [Google Scholar] [CrossRef]
- Gerbens-Leenes, P.W.; Hoekstra, A.Y.; Bosman, R. The blue and grey water footprint of construction materials: Steel, cement and glass. Water Resour. Ind. 2018, 19, 1–12. [Google Scholar] [CrossRef]
- Schorcht, F.; Kourti, I.; Scalet, B.M.; Roudier, S.; Sancho, L.D. Best available techniques (BAT) for the Production of Cement. Lime Magnes. Oxide 2013. [Google Scholar] [CrossRef]
- Schneider, M. Process technology for efficient and sustainable cement production. Cem. Concr. Res. 2015, 78, 14–23. [Google Scholar] [CrossRef]
- Miller, S.A.; John, V.M.; Pacca, S.A.; Horvath, A. Carbon dioxide reduction potential in the global cement industry by 2050. Cem. Concr. Res. 2018, 114, 115–124. [Google Scholar] [CrossRef]
- Lim, J.; Raman, S.; Safiuddin, M.; Zain, M.; Hamid, R. Autogenous Shrinkage, Microstructure, and Strength of Ultra-High Performance Concrete Incorporating Carbon Nanofibers. Materials 2019, 12, 320. [Google Scholar] [CrossRef] [PubMed]
- Liu, K.; Yu, R.; Shui, Z.; Li, X.; Ling, X.; He, W.; Yi, S.; Wu, S. Effects of pumice-based porous material on hydration characteristics and persistent shrinkage of Ultra-High Performance Concrete (UHPC). Materials 2018, 12, 11. [Google Scholar] [CrossRef] [PubMed]
- Wetzel, A.; Umbach, C.; Fehling, E.; Middendorf, B. Multifunctional prefabricated walls made of UHPC and foam concrete. Insights Innov. Struct. Eng. Mech. Comput. 2016, 86, 143–148. [Google Scholar] [CrossRef]
- Schmidt, M.; Fehling, E.; Fröhlich, S.; Thiemicke, J. Sustainable Building with Ultra-High Performance Concrete-Results of the German Priority Programme 1182 funded by Deutsche Forschungsgemeinschaft (DFG); Kassel University Press: Kassel, Germany, 2014; Available online: http://www.upress.uni-kassel.de/katalog/abstract.php?978-3-86219-480-3 (accessed on 12 March 2019).
- Wille, K.; Naaman, A.E.; Parra-Montesinos, G.J. Ultra-High Performance Concrete with compressive strength exceeding 150 MPa (22 ksi): A simpler way. ACI Mater. J. 2011, 108, 34–46. [Google Scholar]
- Roux, N.; Andrade, C.; Sanjuán, M.A. Experimental Study of Reactive Powder Concretes (RPC). J. Mater. Civil Eng. ASCE 1996, 8, 1–6. [Google Scholar] [CrossRef]
- Hansen, T.B.; Aarup, B. Engineering challenges in international application of UHPFRC. Concr. Eng. Int. 2015, 13. [Google Scholar]
- MShafieifar, O.; Farzad, M.; Azizinamini, A. Experimental and numerical study on mechanical properties of Ultra High Performance Concrete (UHPC). Constr. Build. Mater. 2017, 156, 402–411. [Google Scholar] [CrossRef]
- Schmidt, M.; Bunje, K.; Dehn, F.; Droll, K.; Fehling, E.; Greiner, S.; Horvarth, J.; Kleen, E.; Müller, C.; Reineck, K.-H.; et al. Sachstandsbericht Ultrahochfester Beton [Progress Report Ultra-High-Performance Concrete]. DAFSTB-HEFT 561. Beuth, 2008. Available online: https://www.beuth.de/de/publikation/heft-561-dafstb/107880416 (accessed on 26 October 2018).
- Schmidt, C. Konstruktion und Wirtschaftlichkeit von Whitetopping aus Hochleistungsbeton für Fahrbahnen Whitetopping of Asphalt and Concrete Pavements with Thin Layers of Ultra High Performance Concrete-Construction and Economic Efficiency [Construction and Efficiency of Whitetopping of High Performance Concrete for Roadways Whitetopping of Asphalt and Concrete Pavements with Ultra Thin Films Concrete-Construction and Economic Efficiency]. 2012. Available online: http://www.uni-kassel.de/upress/online/frei/978-3-86219-342-4.volltext.frei.pdf (accessed on 26 October 2018).
- Bringezu, S. Possible Target Corridor for Sustainable Use of Global Material Resources. Resources 2015, 4, 25–54. [Google Scholar] [CrossRef]
- Miller, S.A.; Monteiro, P.J.M.; Ostertag, C.P.; Horvath, A. Comparison indices for design and proportioning of concrete mixtures taking environmental impacts into account. Cem. Concr. Compos. 2016, 68, 131–143. [Google Scholar] [CrossRef]
- Celik, K.; Meral, C.; Gursel, A.P.; Mehta, P.K.; Horvath, A.; Monteiro, P.J.M. Mechanical properties, durability, and life-cycle assessment of self-consolidating concrete mixtures made with blended portland cements containing fly ash and limestone powder. Cem. Concr. Compos. 2015, 56, 59–72. [Google Scholar] [CrossRef]
- Miller, S.A.; Monteiro, P.J.M.; Ostertag, C.P.; Horvath, A. Concrete mixture proportioning for desired strength and reduced global warming potential. Constr. Build. Mater. 2016, 128, 410–421. [Google Scholar] [CrossRef]
- Colangelo, F.; Forcina, A.; Farina, I.; Petrillo, A. Life Cycle Assessment (LCA) of Different Kinds of Concrete Containing Waste for Sustainable Construction. Buildings 2018, 8, 70. [Google Scholar] [CrossRef]
- Association of German Engineers (VDI). VDI 4800 Part 2 Resource Efficiency Evaluation of Raw Material Demand; VDI: Düsseldorf, Germany, 2018. [Google Scholar]
- Boulay, A.M.; Bare, J.; Benini, L.; Berger, M.; Lathuillière, M.J.; Manzardo, A.; Margni, M.; Motoshita, M.; Núñez, M.; Pastor, A.V.; et al. The WULCA consensus characterization model for water scarcity footprints: Assessing impacts of water consumption based on available water remaining (AWARE). Int. J. Life Cycle Assess. 2018, 23, 368–378. [Google Scholar] [CrossRef]
- Gursel, A.P.; Masanet, E.; Horvath, A.; Stadel, A. Life-cycle inventory analysis of concrete production: A critical review. Cem. Concr. Compos. 2014, 51, 38–48. [Google Scholar] [CrossRef]
- Association of German Engineers (VDI). Resource Efficiency Methodological Principles and Strategies; VDI 4800 Part 1; VDI: Düsseldorf, Germany, 2016. [Google Scholar]
- Association of German Engineers (VDI). Ressourceneffizienz Bewertung des Rohstoffaufwands [Resource Efficiency—Evaluation of the Use of Raw Materials]; VDI 4800 Part 2 Draft; VDI: Düsseldorf, Germany, 2016. [Google Scholar]
- BMUB (German Federal Ministry for the Environment Nature Conservation Building and Nuclear Safety). German Resource Effciency Programme II/Programme for the Sustainable Use and Conservation of Natural Resources [Brochure], Berlin. 2016. Available online: http://www.bmub.bund.de/en/service/publications/broschueren-bestellen/#cr1 (accessed on 14 October 2018).
- EN 15804. Sustainability of Construction Works—Environmental Product Declarations—Core Rules for the Product Category of Construction Products, German version EN 15804; CEN: Brussels, Belgium, 2012. [Google Scholar]
- European Environment Agency (EEA). More from Less—Material Resource Efficiency in Europe. 2015 Overview of Policies, Instruments and Targets in 31 Countries; EEA: København, Denmark, 2016. [Google Scholar] [CrossRef]
- Stengel, T.; Schießl, P. Life Cycle Assessment of Uhpc Bridge Constructions: Sherbrooke Footbridge, Kassel Gärtnerplatz Footbridge and Wapello Road Bridge. Archit. Civ. Eng. Environ. 2009, 1, 109–118. [Google Scholar]
- Randl, N.; Steiner, T.; Ofner, S.; Baumgartner, E.; Mészöly, T. Development of UHPC mixtures from an ecological point of view. Constr. Build. Mater. 2014, 67, 373–378. [Google Scholar] [CrossRef]
- Hester, J.; Miller, T.R.; Gregory, J.; Kirchain, R. Actionable insights with less data: Guiding early building design decisions with streamlined probabilistic life cycle assessment. Int. J. Life Cycle Assess. 2018, 23, 1903–1915. [Google Scholar] [CrossRef]
- Finkbeiner, M.; Inaba, A.; Tan, R.B.H.; Christiansen, K.; Klüppel, H.J. The new international standards for life cycle assessment: ISO 14040 and ISO 14044. Int. J. Life Cycle Assess. 2006, 11, 80–85. [Google Scholar] [CrossRef]
- Bringezu, S.; Potocnik, J.; Schandl, H.; Lu, Y.; Ramaswami, A.; Swilling, M.; Suh, S. Multi-scale governance of sustainable natural resource use-Challenges and opportunities for monitoring and institutional development at the national and global level. Sustainability 2016, 8, 778. [Google Scholar] [CrossRef]
- DIN EN 206. Beton—Festlegung, Eigenschaften, Herstellung und Konformität [Concrete—Specification, Performance, Production and Conformity]; Deutsche Fassung EN 206:2013+A1:2016 [German Version EN 206:2013+A1:2016]; Beuth Verlag GmbH: Berlin, Germany, 2017. [Google Scholar] [CrossRef]
- Becke, A.; Reiners, J.; Sülün, C. Erläuterungen zu den Umweltproduktdeklarationen für Beton [Explanations to the Environmental Product Declarations of Concrete]; InformationsZentrum Beton GmbH: Düsseldorf, Germany, 2014; Available online: https://betonshop.de/media/wysiwyg/PDF/epd_broschuere_2014.pdf (accessed on 12 March 2019).
- BS EN 197-1:2011. Cement. Composition, Specifications and Conformity Criteria for Common Cements; DIN: Berlin, Germany, 2011. [Google Scholar]
- Eyerer, P.; Hans-Wolf, R. (Eds.) Ökologische Bilanzierung von Baustoffen und Gebäuden: Wege zu einer ganzheitlichen Bilanzierung (BauPraxis). Ecological balancing of building materials and buildings: ways to a holistic balancing (construction practice; InformationsZentrum Beton GmbH: Erkrath, Germany, 2000. [Google Scholar]
- Thinkstep GaBi, Extension Database XIV: Construction Materials. Available online: http://www.gabi-software.com/support/gabi/gabi-database-2018-lci-documentation/extension-database-xiv-construction-materials/ (accessed on 7 April 2018).
- GreenDelta, Download|openLCA.org. 2018. Available online: http://www.openlca.org/download/ (accessed on 26 February 2018).
- Ecoinvent, Ecoinvent Version 3. Available online: https://www.ecoinvent.org/database/database.html (accessed on 12 August 2018).
- German Association Deutsche Bauchemie (DBC). Betonzusatzmittel und Umwelt [Concrete Admixtures and the Environment], Deutsche Bauchemie e.V., Frankfurt am Main. 2016. Available online: https://deutsche-bauchemie.de/fileadmin/sites/public/dbc/publikationen/DBC_214_SB-D-2016.pdf (accessed on 12 March 2019).
- Stengel, T.; Schießl, P. Sustainability Analysis of UHPC Using Inventory Analysis and Impact Assessment. University of Kassel: Kassel, Germany, 2014. Available online: http://www.upress.uni-kassel.de/katalog/abstract.php?978-3-86219-480-3 (accessed on 12 March 2019).
- German Ready-Mixed Concrete Association, Ökobilanzielle Baustoffprofile für Transportbeton [Life Cycle Assessment of Construction Materials for Ready-Mix Concrete]. Düsseldorf. 2007. Available online: https://www.transportbeton.org/about-btb/ (accessed on 12 March 2019).
- Dorer, C.; Hahn, J. Energetische Optimierung der Betonherstellung im Transportbetonwerk—Bestandsaufnahme und Ableitung von Optimierungspotenzialen [Energetic Optimization of Concrete Production in the Ready-Mix Concrete Plant—Inventory and Derivation of Optimization Poten. 2015. Available online: https://www.transportbeton.org/fileadmin/user_upload/Abschlussbericht_Energetische_Optimierung-2015-03-06-.pdf (accessed on 12 March 2019).
- Heyn, S.; Mettke, A. Ökologische Prozessbetrachtungen—RC-Beton (Stofffluss, Energieaufwand, Emissionen) [Ecological Process Considerations-RC Concrete (Material flow, energy consumption, emissions)]; Brandenburgische Technische Universität Cottbus: Cottbus, Germany, 2010. [Google Scholar]
- Quack, D.; Liu, R. Ökobilanz Betondecken Eine Vergleichende Analyse von Spannbeton-Fertigdecken mit Halbfertigteildecken und Massivdecken aus Ortbeton [Life Cycle Assessment of Concrete slab. A Comparative Analysis of Pre-Stressed Concrete Slabs with Semi-Finished Slabs and in-situ concrete slabs]; Öko-Institut e.V.: Freiburg, Germany, 2010. [Google Scholar]
- Bundesverband der Deutschen Transportbetonindustrie e.V. German Federation of the Ready-Mixed Concrete, Jahresbericht 2016/2017 [26/5000 Annual Report 2016/2017]; Bundesverband der Deutschen Transportbetonindustrie e.V. (BTB): Berlin, Germany, 2017. [Google Scholar]
- Toppel, C.O. Technische und Ökonomische Bewertung Verschiedener Abbruchverfahren im Industriebau [Technical and Economic Evaluation of Various Demolition Methods in Industrial Construction]. University of Darmstadt, 2003. Available online: http://tuprints.ulb.tu-darmstadt.de/439/1/dissertation.pdf (accessed on 12 March 2019).
- European Commission. ILCD Handbook: Interational Reference Life Cycle Data System, Recommendations for Life Cycle Impact Assessment in the European Context; European Commission: Brussels, Belgium, 2011. [Google Scholar] [CrossRef]
- Myhre, G.; Shindell, D.; Bréon, F.-M.; Collins, W.; Fuglestvedt, J.; Huang, J.; Koch, D.; Lamarque, J.-F.; Lee, D.; Mendoza, B.; et al. Anthropogenic and Natural Radiative Forcing; Cambridge University Press: Cambridge, UK, 2013. [Google Scholar] [CrossRef]
- Ritthoff, M.; Rohn, H.; Liedtke, C. Calculating MIPS: Resource Productivity of Products and Services; Wuppertal Institute for Climate, Environment and Energy: Wuppertal, Germany, 2002; Available online: http://epub.wupperinst.org/frontdoor/index/index/docId/1577 (accessed on 12 March 2019).
- Mostert, C.; Ostrander, B.; Bringezu, S.; Kneiske, T. Comparing Electrical Energy Storage Technologies Regarding Their Material and Carbon Footprint. Energies 2018, 11, 3386. [Google Scholar] [CrossRef]
- Saurat, M.; Ritthoff, M. Calculating MIPS 2.0. Resources 2013, 2, 581–607. [Google Scholar] [CrossRef]
- Murguia, D.I. Global Area Disturbed and Pressures on Biodiversity by Large-Scale Metal Mining. 2015. Available online: http://www.uni-kassel.de/upress/online/OpenAccess/978-3-7376-0040-8.OpenAccess.pdf (accessed on 12 March 2019).
- Hoppe, W. Systemanalytischer Vergleich rohstofflicher Nutzungsoptionen von CO2 bei Verwendung regenerativer Energien unter besonderer Berücksichtigung der Ressourceneffizienz und Treibhausgasbilanz [System-Analytical Comparison of Feedstock Utilization Options of CO2]; Kassel University: Kassel, Germany, 2017. [Google Scholar]
- WU. materialflows.net: Indicators on the Economy-Wide Level. Vienna University of Economics and Business, Institute for Ecological Economics, 2016. Available online: http://www.materialflows.net/materialflowsnet/background/accounting/indicators-on-the-economy-wide-level/ (accessed on 25 June 2017).
- ISO 14046. Water Footprint—Principles, Requirements and Guidelines; ISO: Geneva, Switzerland, 2014. [Google Scholar]
- Brühwiler, E.; Fehling, E.; Bunje, K.; Pelke, E. Design of an innovative composite bridge combining reinforced concrete with Ultra-High Performance Fibre Reinforced Concrete, IABSE Symp. Report. Int. Assoc. Bridge Struct. Eng. 2007, 93, 17–24. [Google Scholar] [CrossRef]
- Schmidt, M.; Brühwiler, E.; Fehling, E.; Denarié, E.; Leutbecher, T.; Teichmann, T. Mix design and properties of Ultra-High Performance Fibre Reinforced Concrete for the construction of a composite UHPFRC—Concrete Bridge. Int. Assoc. Bridge Struct. Eng. 2007, 466–476. [Google Scholar]
- Lünser, H. Ökobilanzen im Brückenbau—Eine Umweltbezogene, Ganzheitliche Bewertung [Life Cycle Assessments in Bridge Construction—An Environmental, Holistic Assessment]; Birkhäuser: Basel, Switzerland, 2013. [Google Scholar]
- Fehling, E.; Schmidt, M.; Walraven, J.; Leutbecher, T.; Fröhlich, S. Ultra-High Performance Concrete UHPC: Fundamentals, Design, Examples; John Wiley & Sons: Hoboken, NJ, USA, 2014. [Google Scholar]
- ISO 14040. Environmental Management—Life Cycle Assessment—Principles and Framework; ISO: Geneva, Switzerland, 1997. [Google Scholar] [CrossRef]
- Ngo, T. Application of UHPC in Long Span Bridge Design. 2016. Available online: https://repository.tudelft.nl/islandora/object/uuid:128b5606-28b3-46ec-bb78-4830f7319eee (accessed on 12 March 2019).
- Blesl, M.; Alois, K. Energieeffizienz in der Industrie [Energy Efficiency in Industry]; Springer: Berlin, Germany, 2013. [Google Scholar]


| Material | Unit | UHPC | CC | ||
|---|---|---|---|---|---|
| Ready-mix | Precast | Ready-mix | Precast | ||
| M3Q | M2Q | C35/45 | C50/60 | ||
| Cement/CEM I 52.5 R-HS/NA (SR 3) | kg/m3 | 775 | 832 | - | - |
| Cement/CEM II/A | kg/m3 | - | - | 356 | 405 |
| Quartz sand | kg/m3 | 946 | 975 | - | - |
| Sand | kg/m3 | - | - | 640 | 654 |
| Gravel | kg/m3 | - | - | 806 | 827 |
| Grit | kg/m3 | - | - | 362 | 371 |
| Water | kg/m3 | 183 | 166 | 165 | 141 |
| Quartz powder | kg/m3 | 193 | 207 | - | - |
| Silica fume | kg/m3 | 164 | 135 | - | - |
| Fly ash | kg/m3 | - | - | 47 | 25 |
| Superplasticizer | kg/m3 | 23.50 | 29.40 | - | - |
| Plasticizer | kg/m3 | - | - | 1.80 | 4.60 |
| Micro steel fibers | kg/m3 | 192 | 192 | - | - |
| Total | kg/m3 | 2476.50 | 2536.40 | 2377.80 | 2427.60 |
| Material | Transport Distance (km) | Type of Transport | Reference | ||
|---|---|---|---|---|---|
| Truck % | Train % | Ship % | |||
| Sand; Gravel; Grit | 39 | 88 | 1.90 | 10.10 | [45] |
| Cement | 106 | 79.90 | 8.90 | 11.20 | [45] |
| Fly ash | 100 | 100 | - | - | [45] |
| Plasticizers | 100 | 100 | - | - | [45] |
| Quartz sand; Quartz powder | 150 | 100 | - | - | Interviews |
| Silica fume | 700 | 100 | - | - | Interviews |
| Steel fibers | 230 | 100 | - | - | Interviews |
| Energy Carrier | UHPC | CC | ||
|---|---|---|---|---|
| Ready-mix | Precast | Ready-mix | Precast | |
| M3Q | M2Q | C35/45 | C50/60 | |
| mixing and plant operation | ||||
| Electricity (kWh/m3) | 7.09 | 4.43 | ||
| Fuel oil (L/m3) | 0.26 | |||
| Diesel | 0.09 | |||
| Compacting of precast concrete | ||||
| Electricity (kWh/m3) | - | 0.90 | - | 0.90 |
| Heat treatment of precast concrete | ||||
| Fuel oil (L/m3) | - | 3.00 | - | |
| Bridge Structure Element | UHPC Design | Quantity | CC-Design | Quantity |
|---|---|---|---|---|
| Abutments and middle support with 5 single piers | C35/45 | 25.00 m3 | C35/45 | 40.00 m3 |
| Reinforcing steel | 6.50 t | Reinforcing steel | 27.00 t | |
| Support over the 5 middle single piers | Concrete hinges with UHPC cast on site (M2Q) | 1.10 m3 | - | - |
| Main girders (longitudinal) | Precast concrete C50/60 | 180.00 m3 | Precast concrete C50/60 | 142.00 m3 |
| Reinforcing + Prestressing steel | 54.80 t | Reinforcing + Prestressing steel | 33.00 t | |
| Polyurethane putty | 0.12 t | C35/45 | 119.00 m3 | |
| M3Q | 7.00 m3 | - | - | |
| Sealing | M3Q | 20.50 m3 | Epoxy resin | 0.56 t |
| - | - | Quartz sand | 0.84 t | |
| - | - | Bitumen sheets | 3.09 t | |
| Road surface | Poured asphalt | 1.73 t | Poured asphalt | 56.45 t |
| Stone mastic asphalt (SMA) | 28.80 t | - | - | |
| Jointing material | 0.09 t | Jointing material | 0.16 t | |
| High-grade chippings (0/5) | 0.90 t | Aggregates (2/5), (5/8) | 1.95 t | |
| Kerb elements | Epoxy resin | 1.24 t | - | - |
| M2Q | 33.00 m3 | Ready-mix concrete C25/30 | 59.00 m3 |
| Element | Renewal | |
|---|---|---|
| UHPC Design (Number) | CC-Design (Number) | |
| Road surface | 4 | 4 |
| Sealing | - | 4 |
| Kerb elements | - | 2 |
| Concrete surface | - | 2 |
| Type of Concrete | Quantity (kg/m3) | Ex-Ante Type of Cement | Replaced by | |
|---|---|---|---|---|
| Ready-mix concrete | UHPC M3Q | 775 | CEM I 52.5 | CEM III/A |
| C35/45 | 356 | CEM II/A | ||
| Precast concrete | UHPC M2Q | 832 | CEM I 52.5 | |
| C50/60 | 405 | CEM II/A | ||
© 2019 by the authors. Licensee MDPI, Basel, Switzerland. This article is an open access article distributed under the terms and conditions of the Creative Commons Attribution (CC BY) license (http://creativecommons.org/licenses/by/4.0/).
Share and Cite
Sameer, H.; Weber, V.; Mostert, C.; Bringezu, S.; Fehling, E.; Wetzel, A. Environmental Assessment of Ultra-High-Performance Concrete Using Carbon, Material, and Water Footprint. Materials 2019, 12, 851. https://doi.org/10.3390/ma12060851
Sameer H, Weber V, Mostert C, Bringezu S, Fehling E, Wetzel A. Environmental Assessment of Ultra-High-Performance Concrete Using Carbon, Material, and Water Footprint. Materials. 2019; 12(6):851. https://doi.org/10.3390/ma12060851
Chicago/Turabian StyleSameer, Husam, Viktoria Weber, Clemens Mostert, Stefan Bringezu, Ekkehard Fehling, and Alexander Wetzel. 2019. "Environmental Assessment of Ultra-High-Performance Concrete Using Carbon, Material, and Water Footprint" Materials 12, no. 6: 851. https://doi.org/10.3390/ma12060851
APA StyleSameer, H., Weber, V., Mostert, C., Bringezu, S., Fehling, E., & Wetzel, A. (2019). Environmental Assessment of Ultra-High-Performance Concrete Using Carbon, Material, and Water Footprint. Materials, 12(6), 851. https://doi.org/10.3390/ma12060851