Synthesis and Characterization of Flower-like Carbon-encapsulated Fe-C Nanoparticles for Application as Adsorbing Material

Abstract

1. Introduction
2. Materials and Methods
2.1. Materials
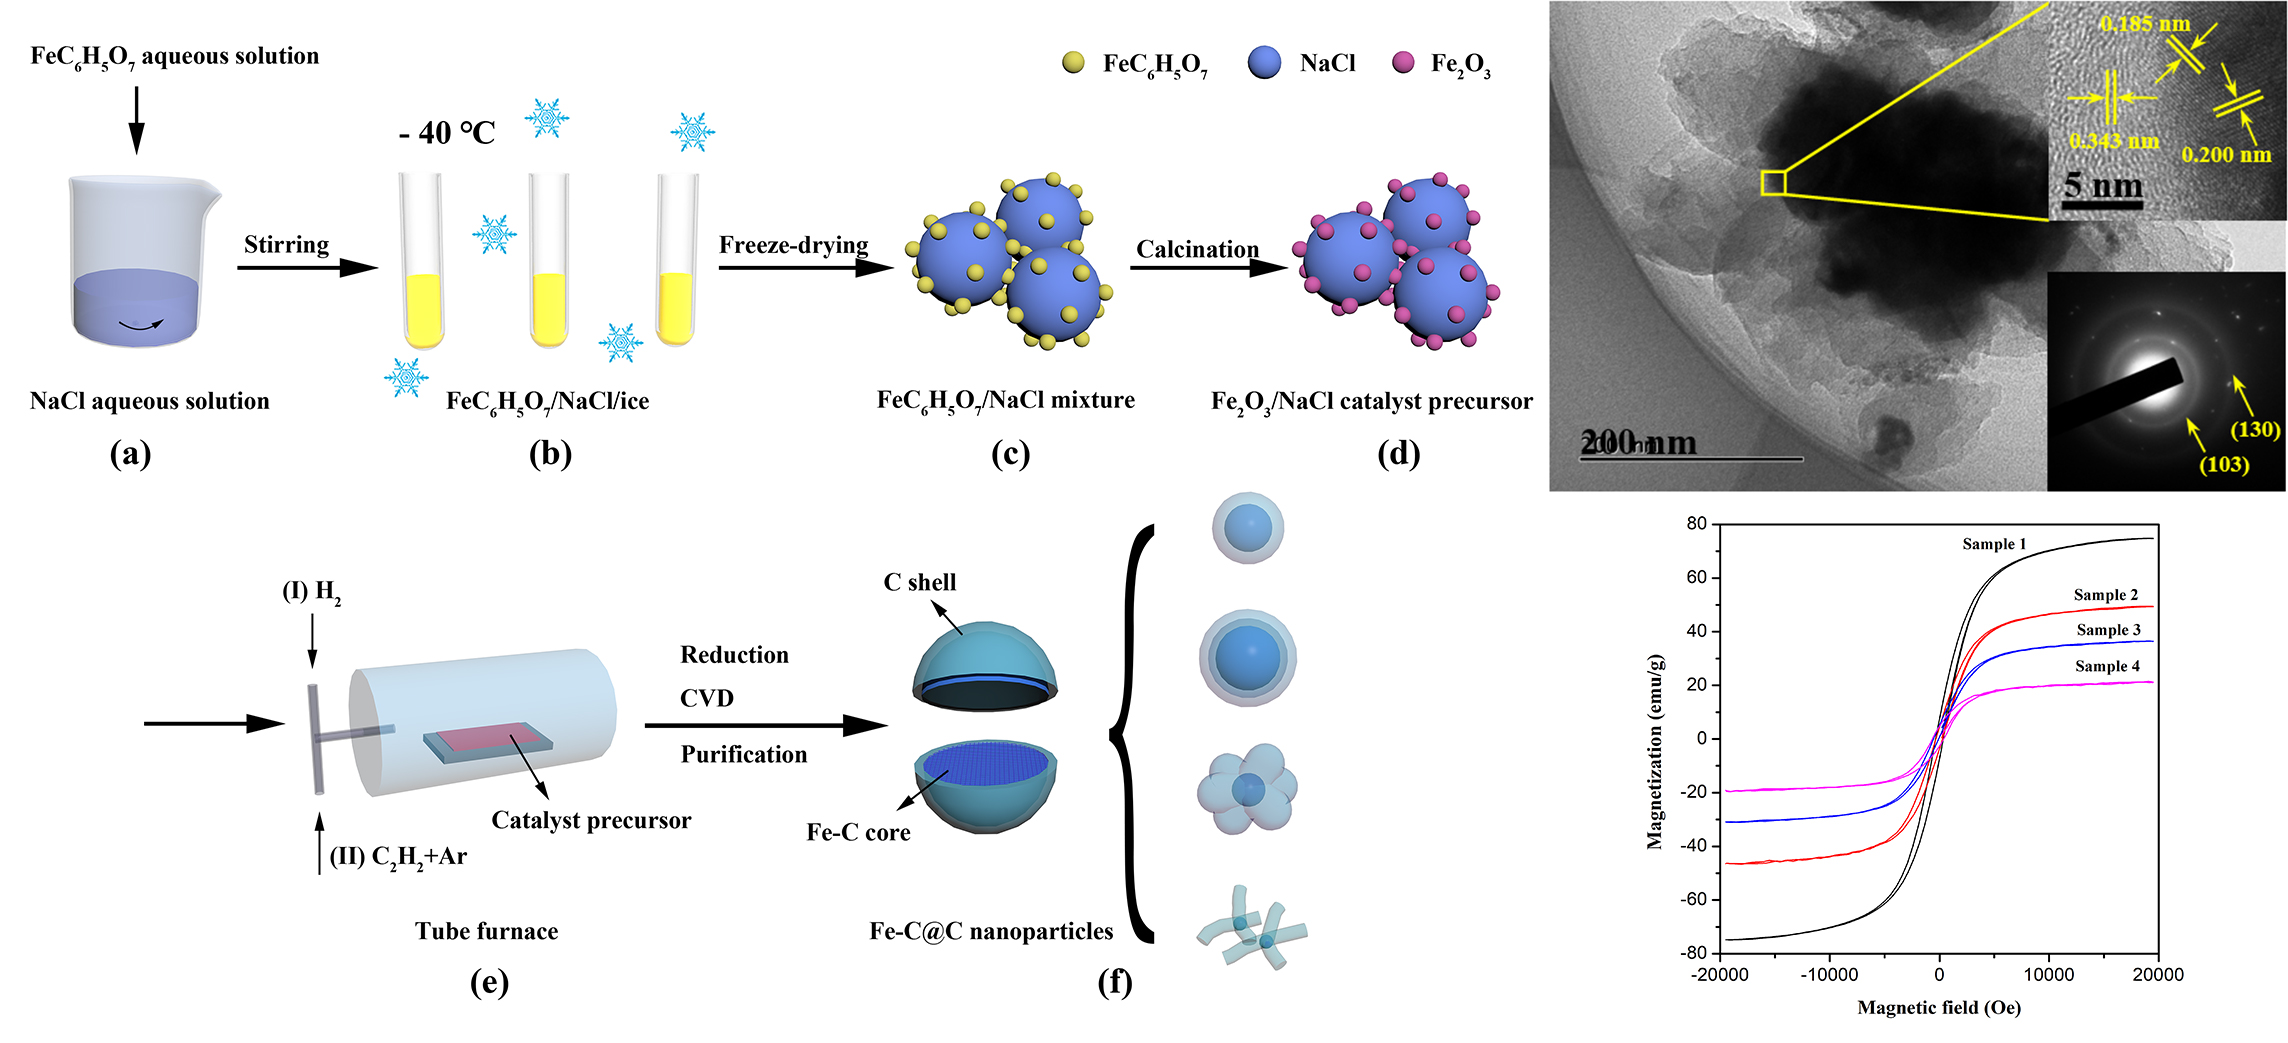
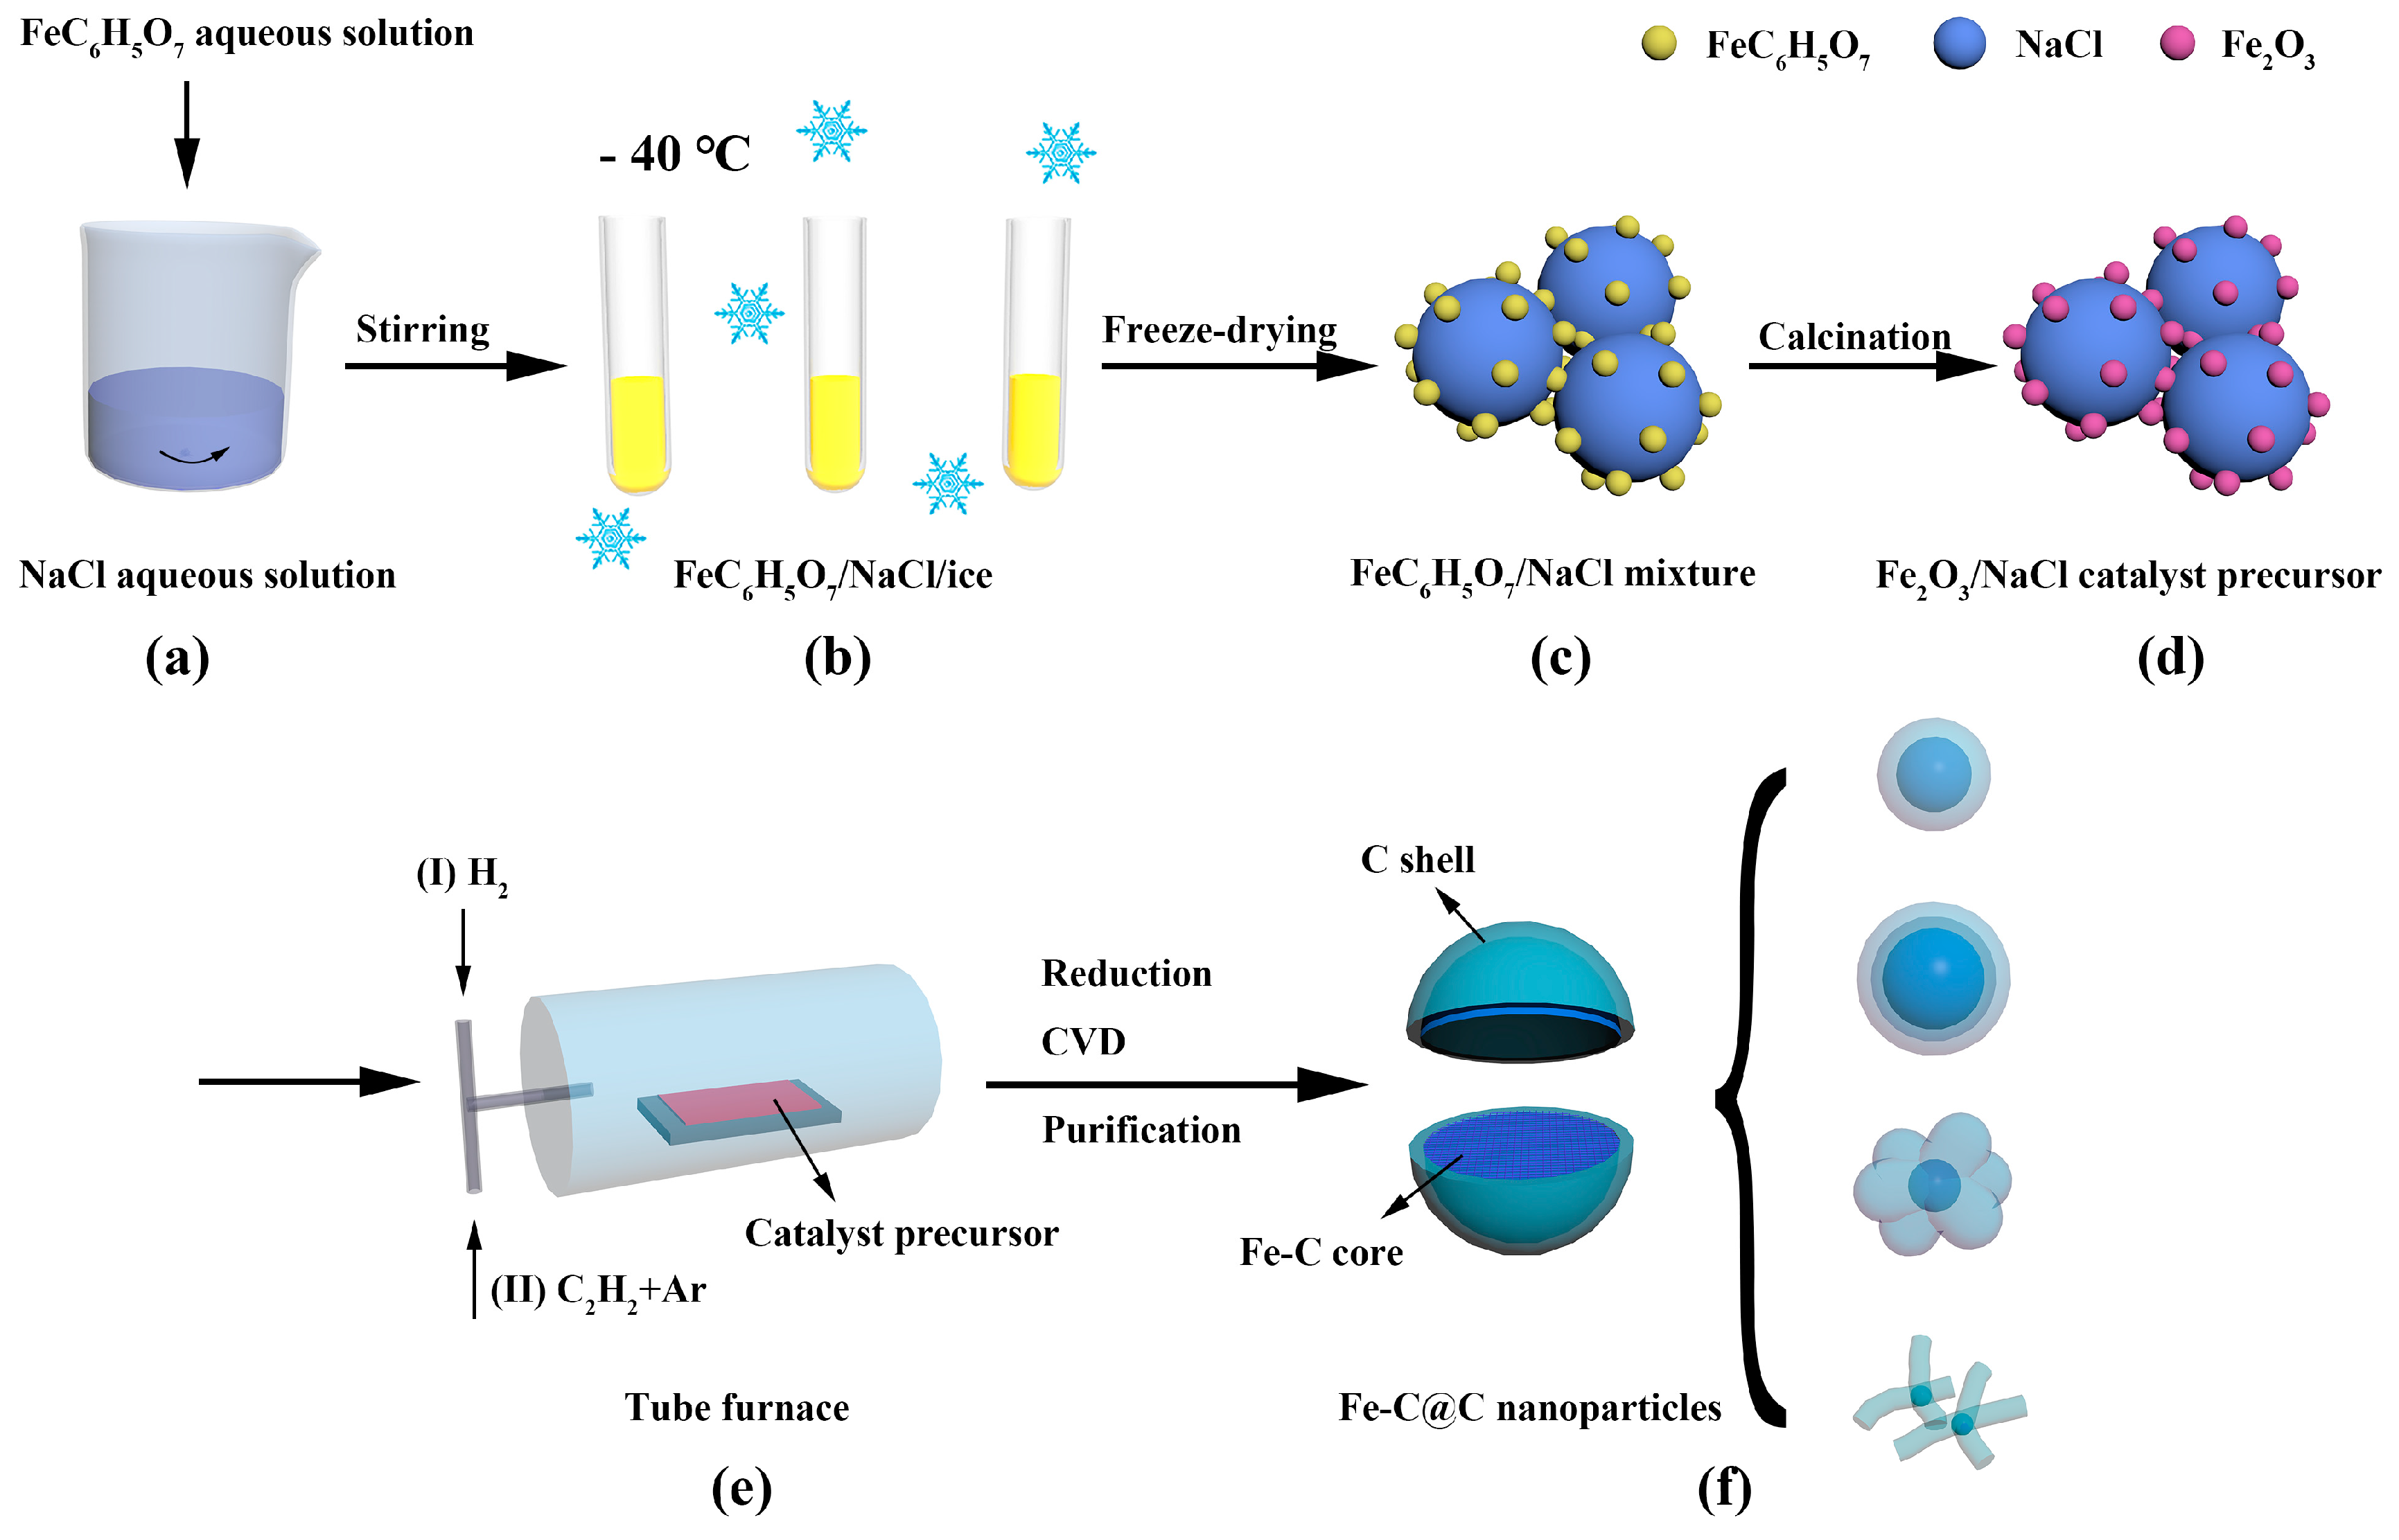
2.2. Synthesis of Fe-C@C Nanoparticles
2.3. Purification of Fe-C@C Nanoparticles
2.4. Adsorption Experiments
2.5. Characterization
3. Results and Discussion
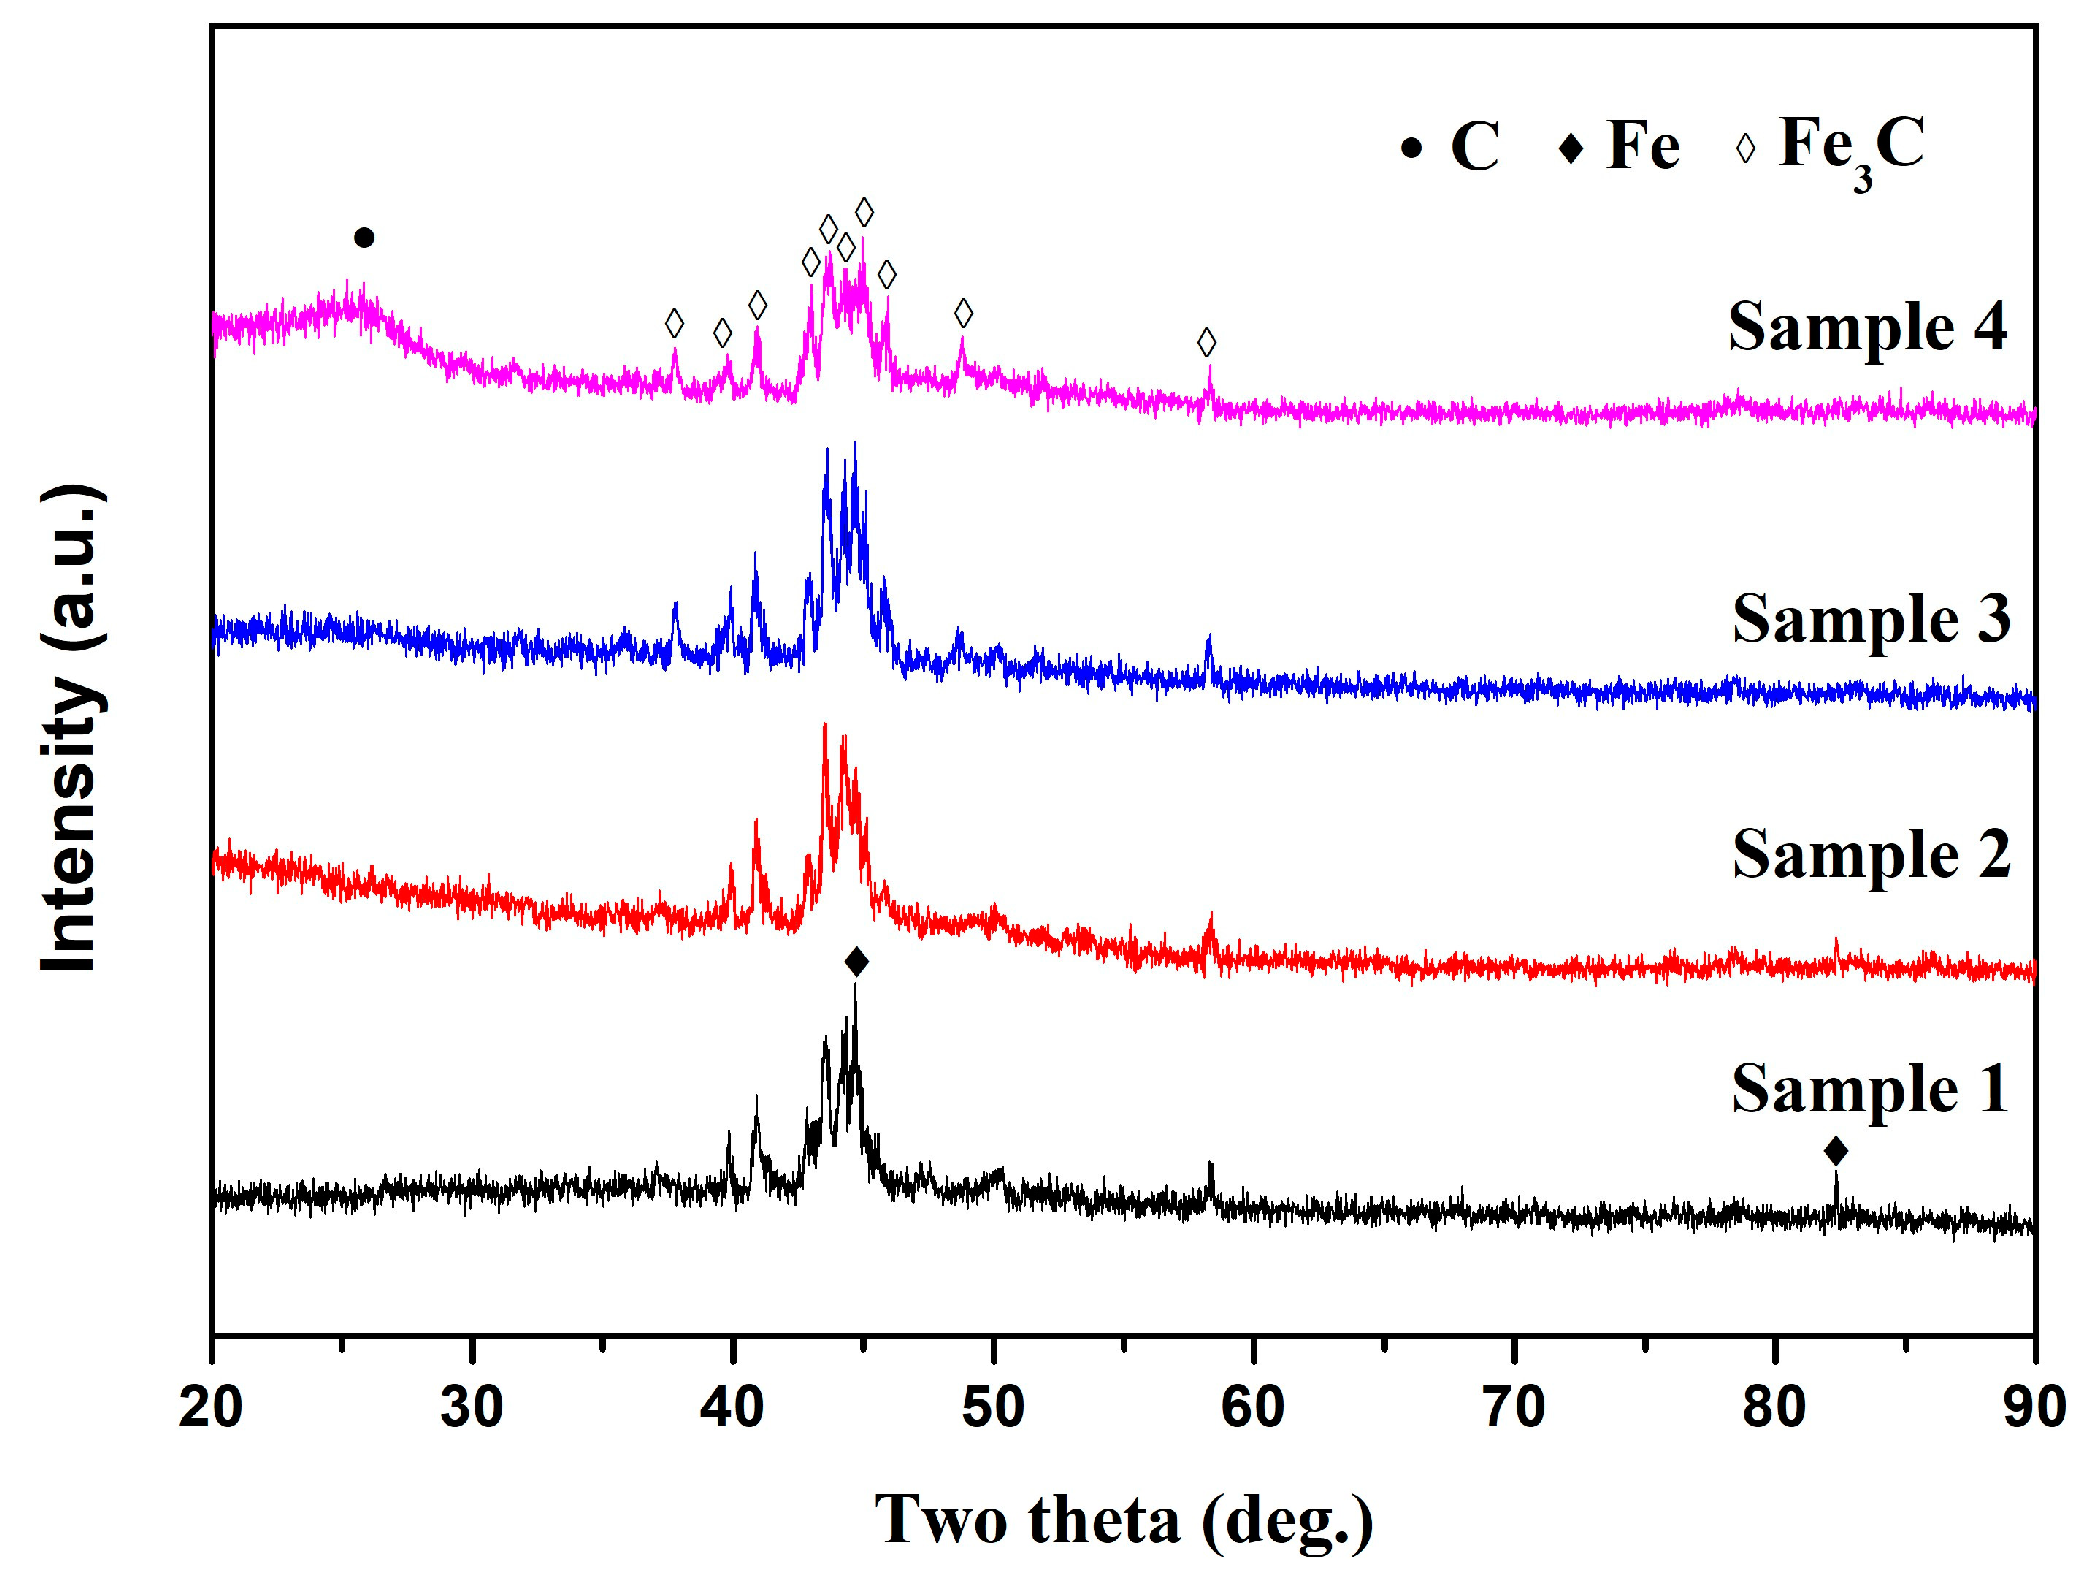
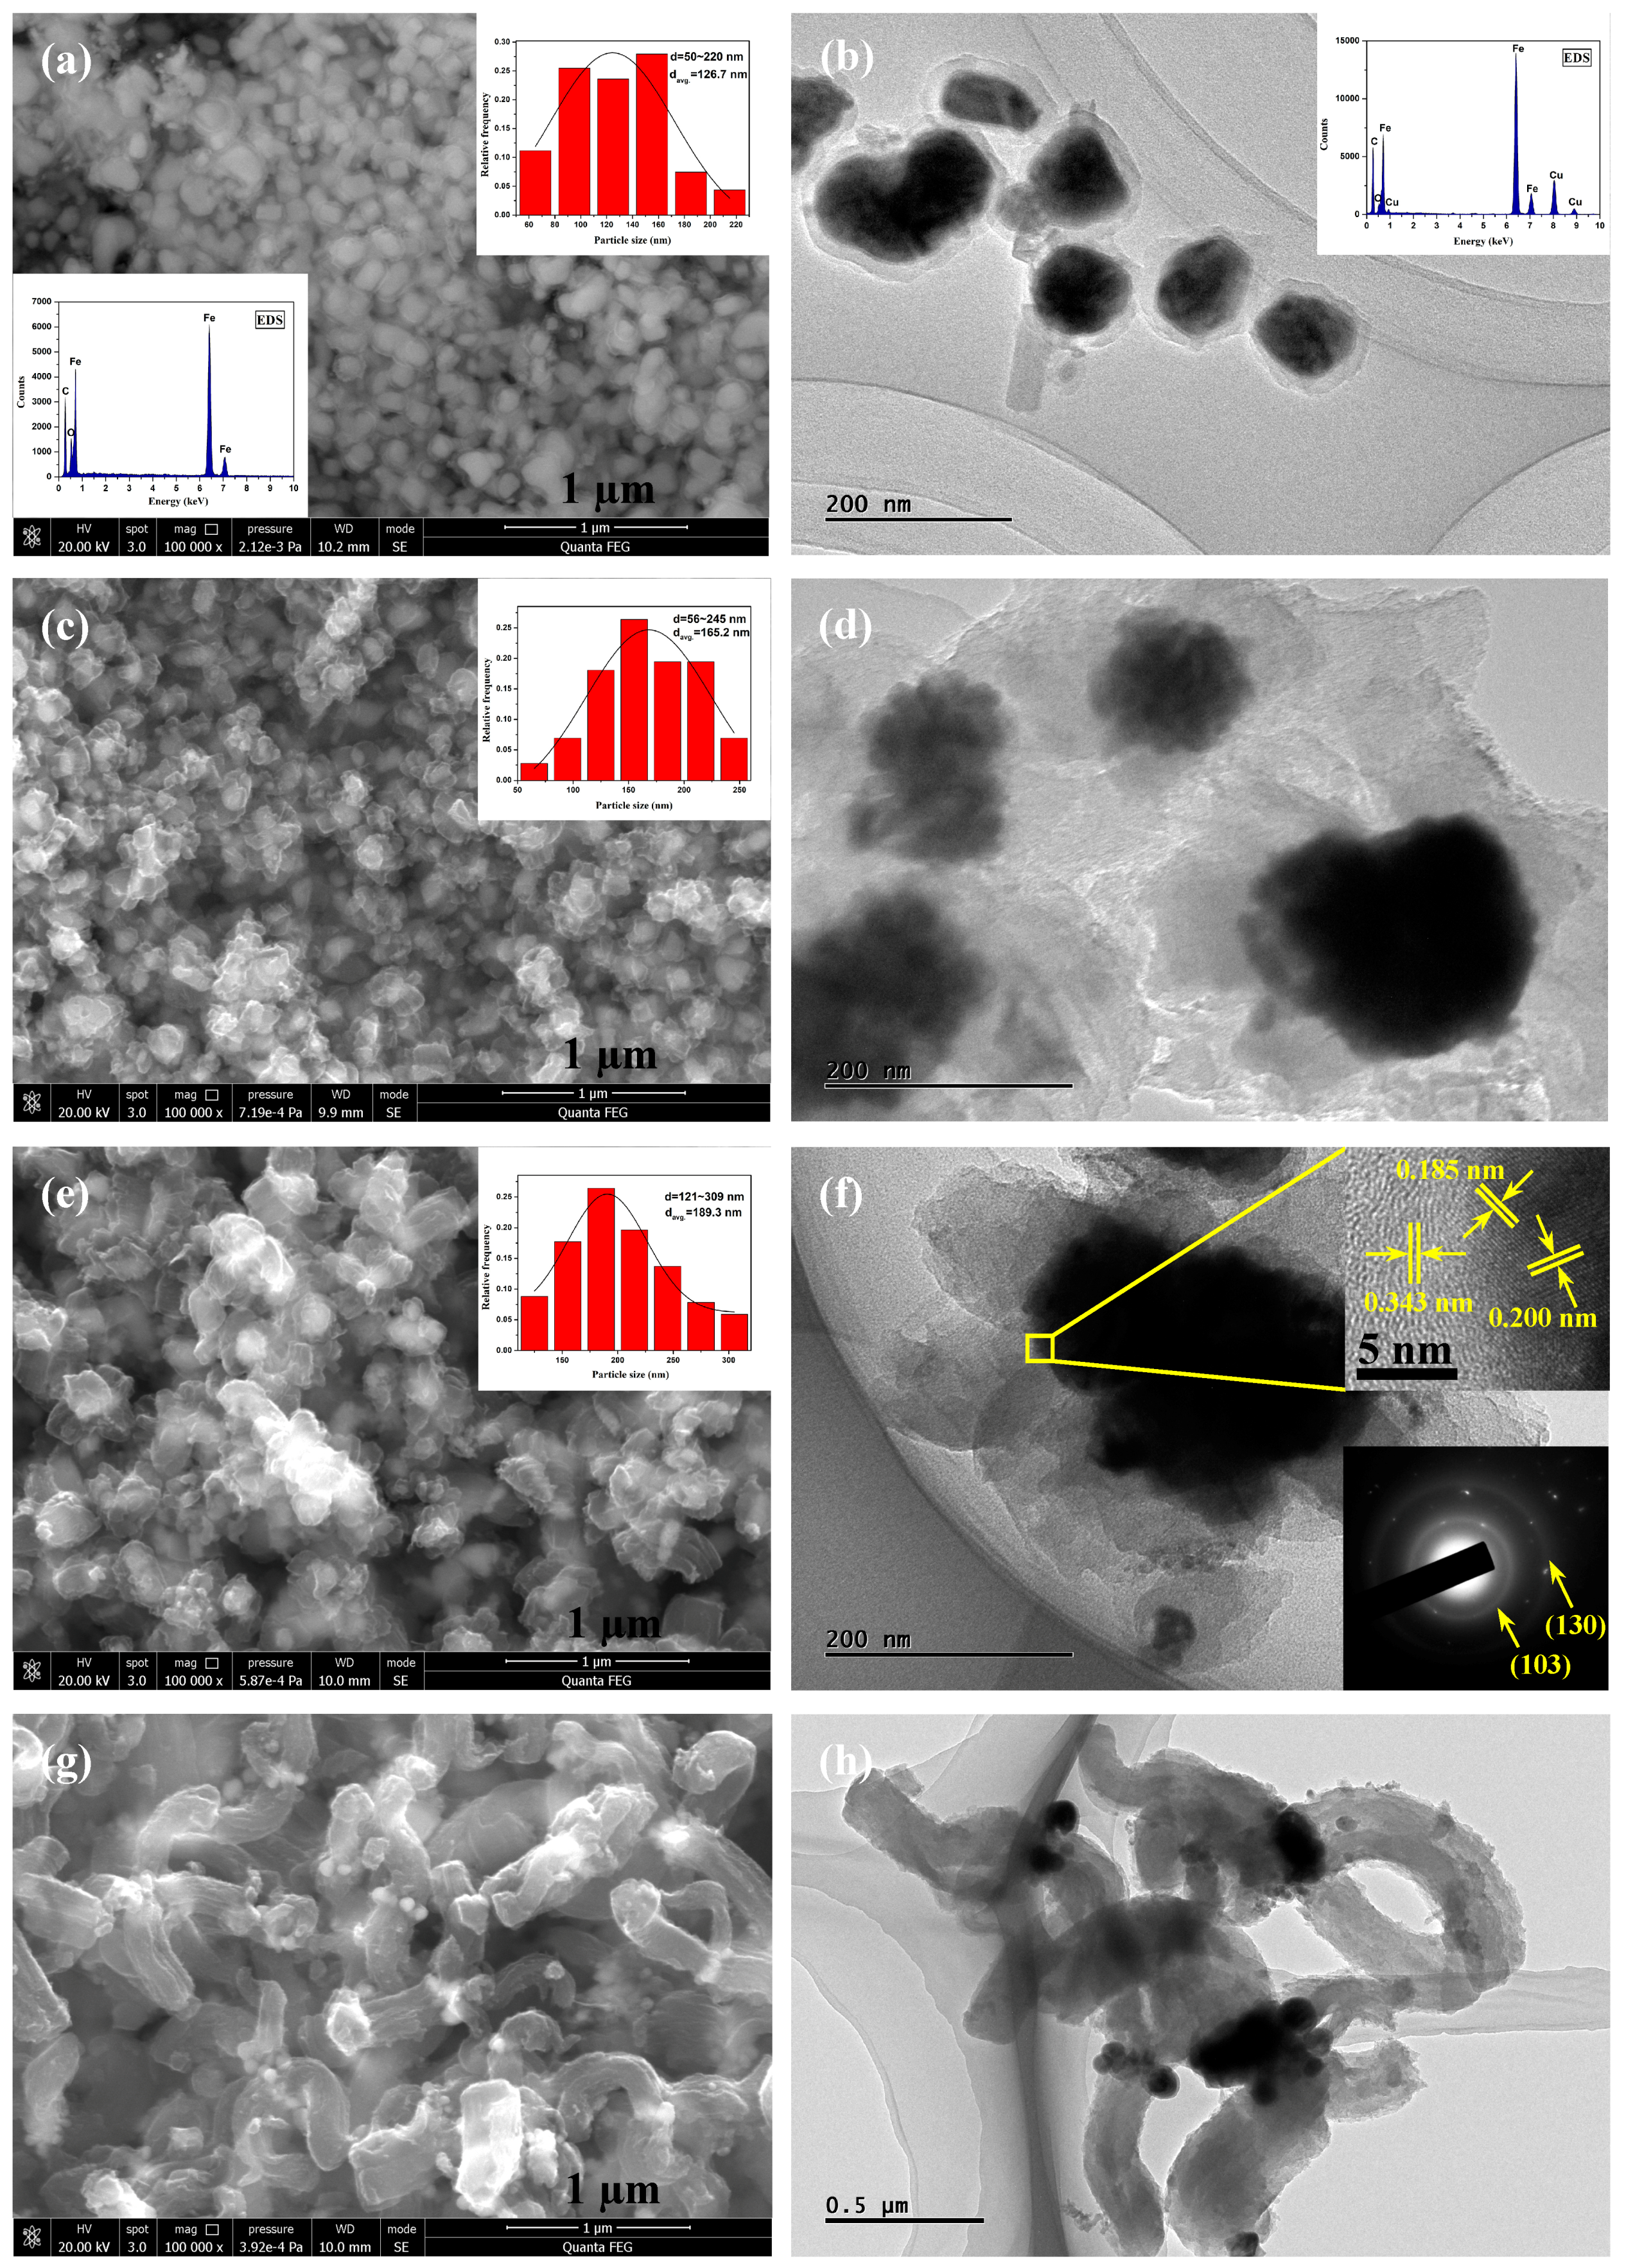
3.1. Morphology and Structure of Fe-C@C Nanoparticles
3.2. Magnetic Properties
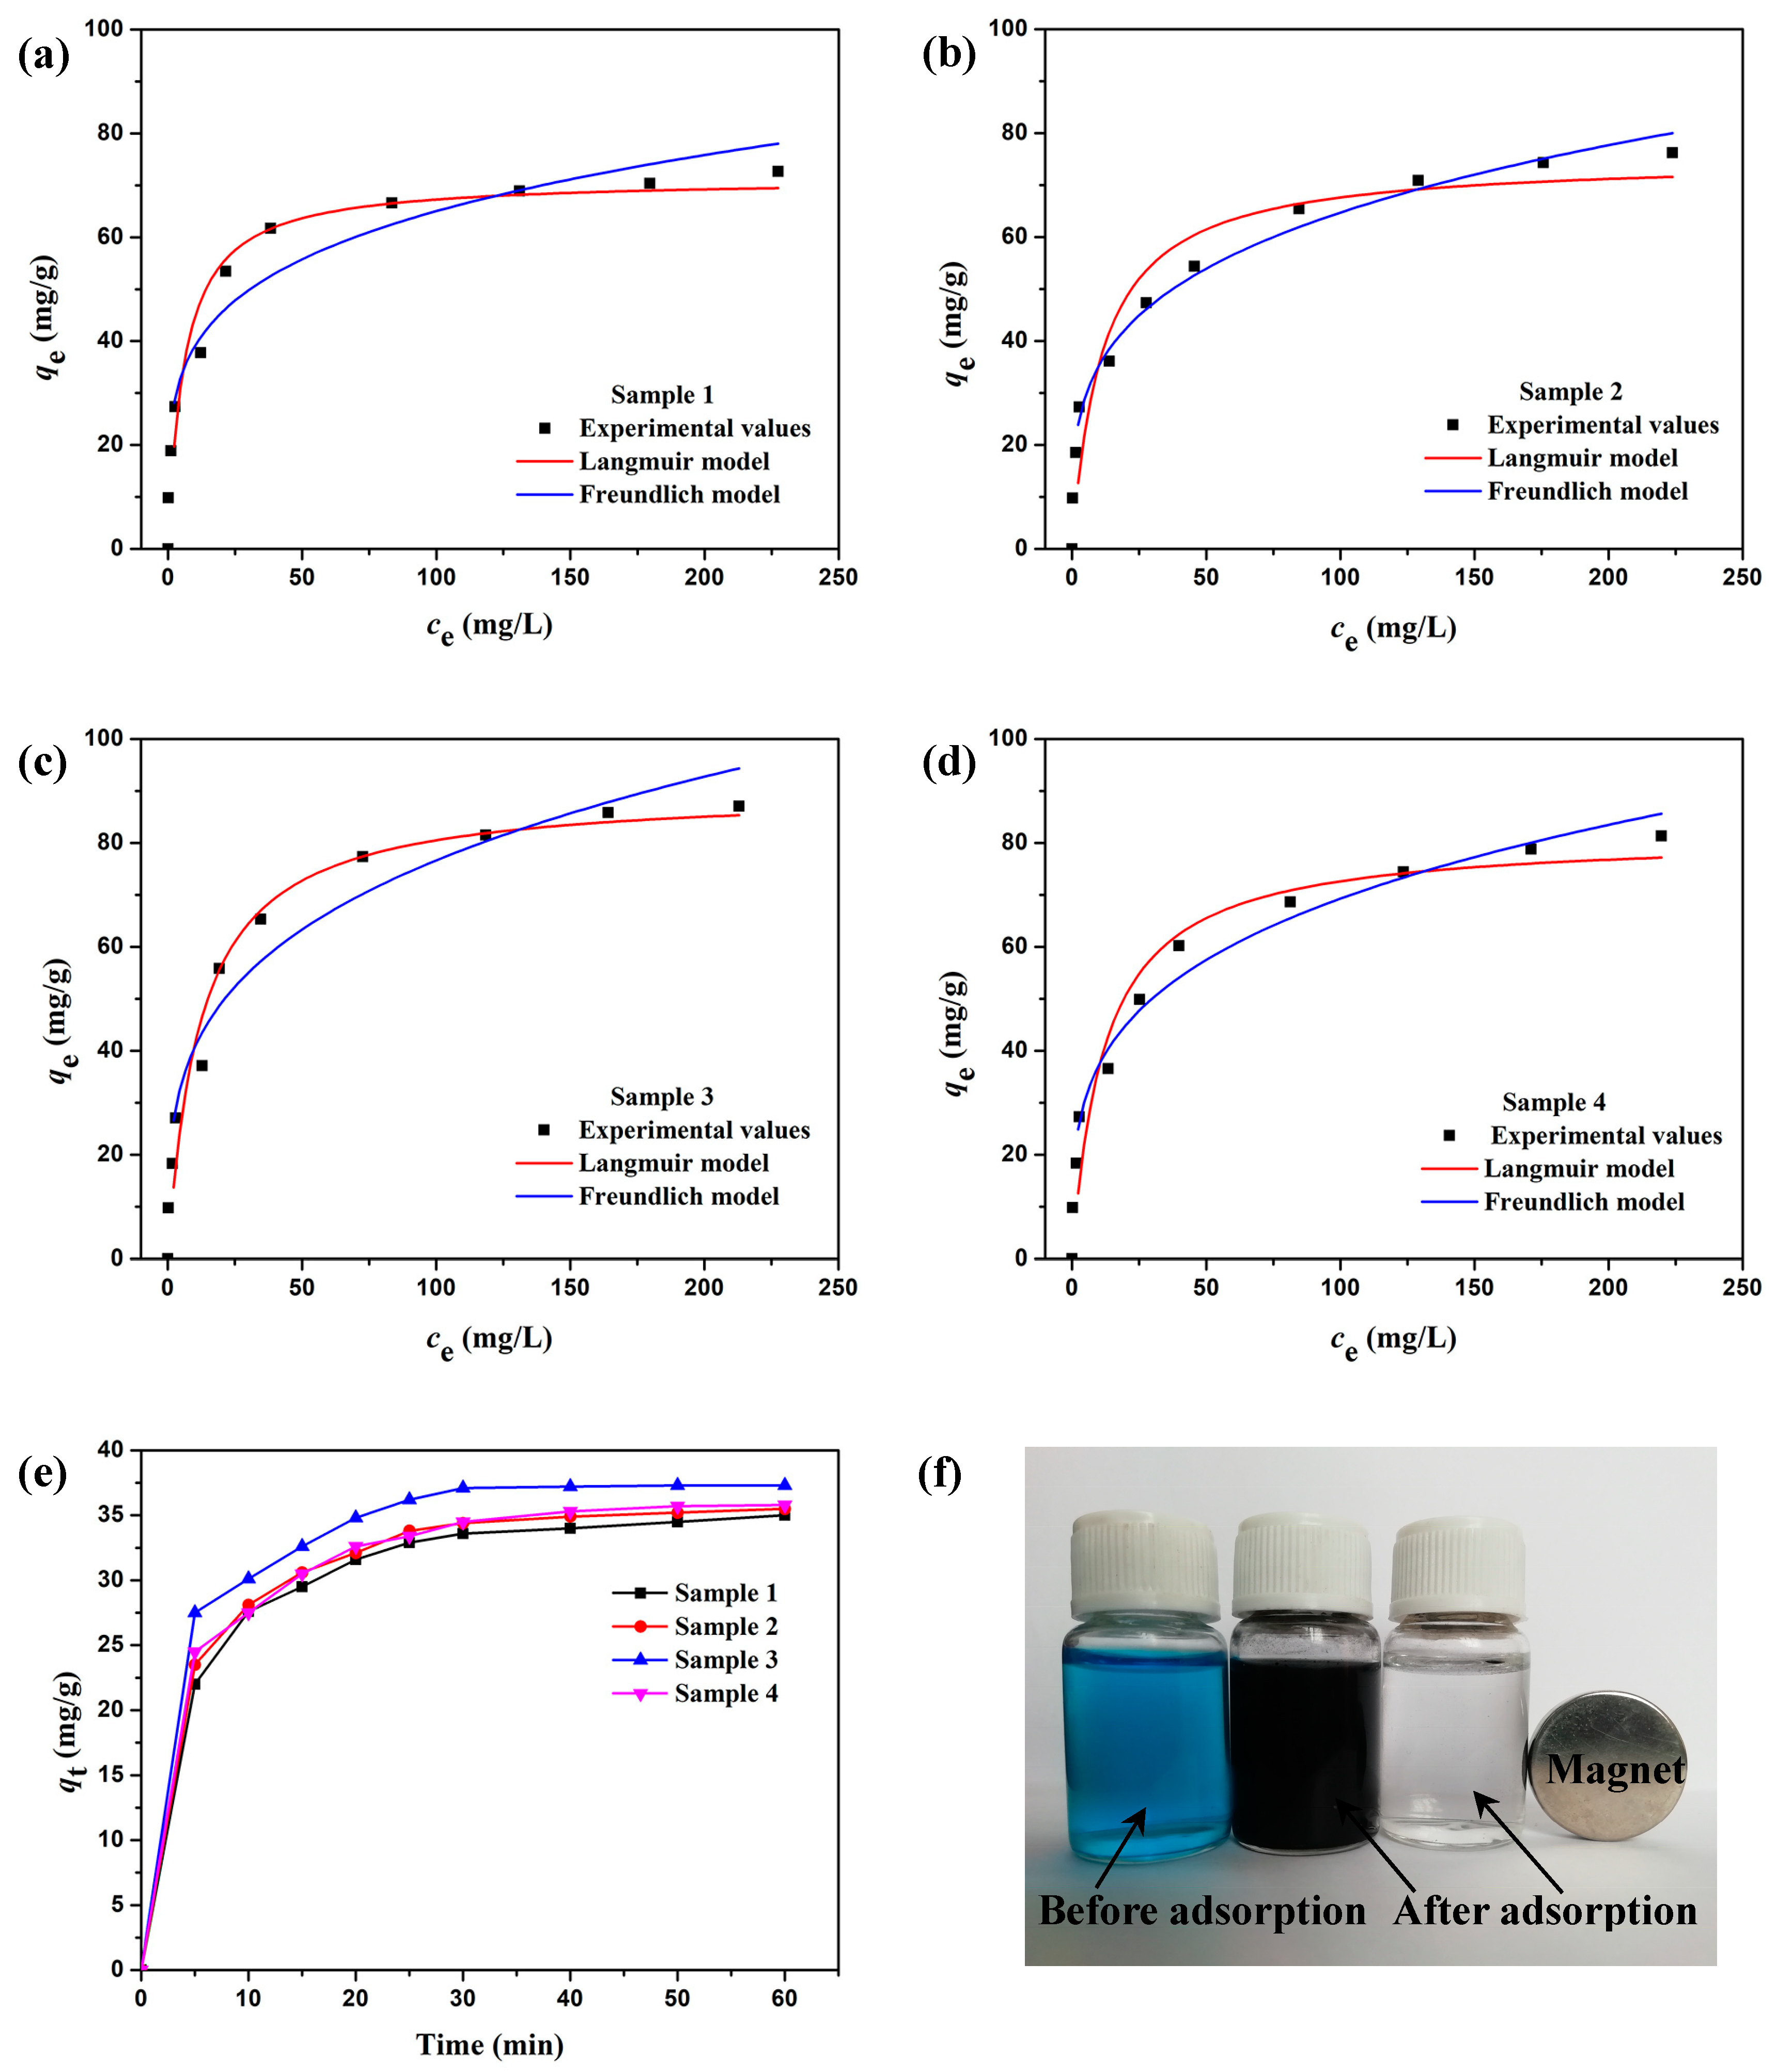
3.3. Adsorption Properties
4. Conclusions
Author Contributions
Funding
Conflicts of Interest
References
- Amaia, M.; Ignacio, L.J.; Ana, D.L. Analysis of primary degradation and decolourization of dyes in water by an H2O2/UV advanced oxidation process. J. Adv. Oxid. Technol. 2008, 11, 573–582. [Google Scholar] [CrossRef]
- Crini, G. Non-conventional low-cost adsorbents for dye removal: A review. Bioresour. Technol. 2006, 97, 1061–1085. [Google Scholar] [CrossRef] [PubMed]
- Qadri, S.; Ganoe, A.; Haik, Y. Removal and recovery of acridine orange from solutions by use of magnetic nanoparticles. J. Hazard. Mater. 2009, 169, 318–323. [Google Scholar] [CrossRef] [PubMed]
- Qu, S.; Huang, F.; Yu, S.N.; Chen, G.; Kong, J.L. Magnetic removal of dyes from aqueous solution using multi-walled carbon nanotubes filled with Fe2O3 particles. J. Hazard. Mater. 2008, 160, 643–647. [Google Scholar] [CrossRef]
- Zhao, G.X.; Jiang, L.; He, Y.D.; Li, J.X.; Dong, H.L.; Wang, X.K.; Hu, W.P. Sulfonated graphene for persistent aromatic pollutant management. Adv. Mater. 2011, 23, 3959–3963. [Google Scholar] [CrossRef]
- Zhao, G.X.; Wen, T.; Chen, C.L.; Wang, X.K. Synthesis of graphene-based nanomaterials and their application in energy-related and environmental-related areas. RSC Adv. 2012, 2, 9286–9303. [Google Scholar] [CrossRef]
- Zhang, Y.X.; Xu, S.C.; Luo, Y.Y.; Pan, S.S.; Ding, H.L.; Li, G.H. Synthesis of mesoporous carbon capsules encapsulated with magnetite nanoparticles and their application in wastewater treatment. J. Mater. Chem. 2011, 21, 3664–3671. [Google Scholar] [CrossRef]
- Liu, W.; Zhong, W.; Du, Y.W. Magnetic nanoparticles with core/shell structures. J. Nanosci. Nanotechnol. 2008, 8, 2781–2792. [Google Scholar] [CrossRef]
- Oliveira, A.A.S.; Tristão, J.C.; Ardisson, J.D.; Dias, A.; Lago, R.M. Production of nanostructured magnetic composites based on Fe0 nuclei coated with carbon nanofibers and nanotubes from red mud waste and ethanol. Appl. Catal. B Environ. 2011, 105, 163–170. [Google Scholar] [CrossRef]
- Sosnovik, D.E.; Nahrendorf, M.; Weissleder, R. Magnetic nanoparticles for MR imaging: Agents, techniques and cardiovascular applications. Basic Res. Cardiol. 2008, 103, 122–130. [Google Scholar] [CrossRef]
- Wang, X.B.; Zhang, P.; Wang, W.; Lei, X.; Zou, B.; Yang, H. Synthesis, structure and magnetic properties of graphite carbon encapsulated Fe3C nanoparticles for applications as adsorbents. RSC Adv. 2015, 5, 27857–27861. [Google Scholar] [CrossRef]
- Bystrzejewski, M. Synthesis of carbon-encapsulated iron nanoparticles via solid state reduction of iron oxide nanoparticles. J. Solid State Chem. 2011, 184, 1492–1498. [Google Scholar] [CrossRef]
- Zhu, K.R.; Chen, C.L.; Xu, M.W.C.; Chen, K.; Tan, X.L.; Wakeel, M.; Alharbi, N.S. In situ carbothermal reduction synthesis of Fe nanocrystals embedded into N-doped carbon nanospheres for highly efficient U (VI) adsorption and reduction. Chem. Eng. J. 2018, 331, 395–405. [Google Scholar] [CrossRef]
- Park, J.B.; Jeong, S.H.; Jeong, M.S.; Kim, J.Y.; Cho, B.K. Synthesis of carbon-encapsulated magnetic nanoparticles by pulsed laser irradiation of solution. Carbon 2008, 46, 1369–1377. [Google Scholar] [CrossRef]
- Jian, N.W.; Li, Z.; Fan, Y.; Zhao, M.S. Synthesis of carbon encapsulated magnetic nanoparticles with giant coercivity by a spray pyrolysis approach. J. Phys. Chem. B 2007, 111, 2119–2124. [Google Scholar] [CrossRef]
- Li, H.P.; Zhao, N.Q.; He, C.N.; Shi, C.S.; Du, X.W.; Li, J.J. Fabrication of carbon-coated cobalt nanoparticles by the catalytic method. J. Alloy. Compd. 2008, 458, 130–133. [Google Scholar] [CrossRef]
- Manawi, Y.M.; Samara, A.; Al-Ansari, T.; Atieh, M.A. A review of carbon nanomaterials’ synthesis via the chemical vapor deposition (CVD) method. Materials 2018, 11, 822. [Google Scholar] [CrossRef]
- Liu, X.G.; Wang, C.J.; Yang, Y.Z.; Guo, X.M.; Wen, H.R.; Xu, B.S. Synthesis of nano onion-like fullerenes by using Fe/Al2O3 as catalyst by chemical vapor deposition. Chin. Sci. Bull. 2009, 54, 137–141. [Google Scholar] [CrossRef]
- Zhang, C.G.; Li, J.J.; Liu, E.Z.; He, C.N.; Shi, C.S.; Du, X.W.; Hauge, R.H.; Zhao, N.Q. Synthesis of hollow carbon nano-onions and their use for electrochemical hydrogen storage. Carbon 2012, 50, 3513–3521. [Google Scholar] [CrossRef]
- Li, H.P.; Li, Y.; Zhang, Y.G.; Liang, C.Y.; Wang, H.S.; Li, B.; Adair, D.; Bakenov, Z. Fabrication and properties of carbon-encapsulated cobalt nanoparticles over NaCl by CVD. Nanoscale Res. Lett. 2016, 11, 432. [Google Scholar] [CrossRef]
- Ng, T.B.; Liu, W.K. Toxic effect of heavy metals on cells isolated from the rat adrenal and testis. In Vitro Cell. Dev. Biol. 1990, 26, 24–28. [Google Scholar] [CrossRef]
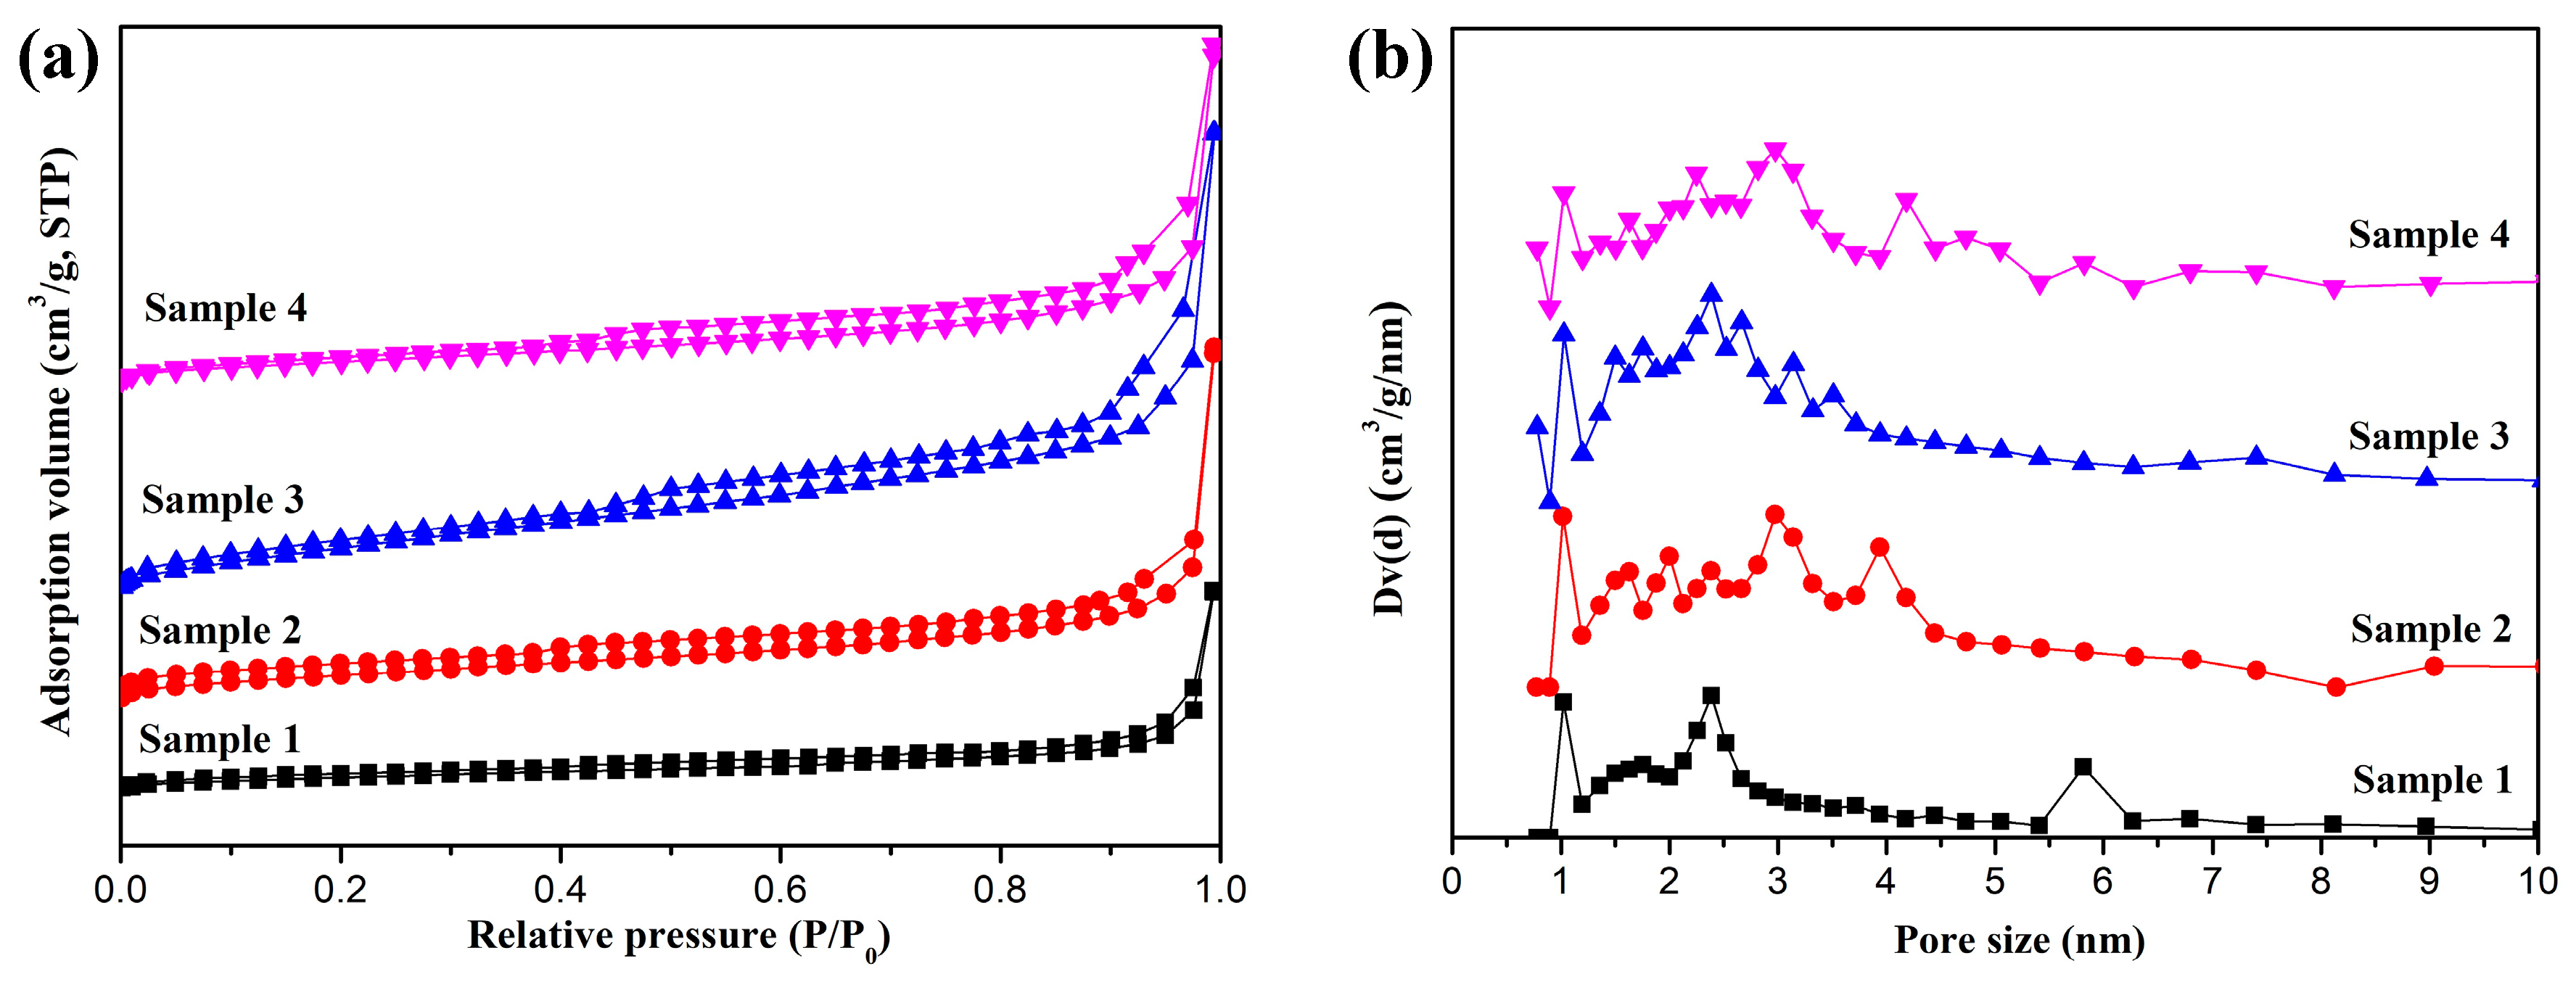
- Brunauer, S.; Emmett, P.H.; Teller, E. Adsorption of gases in multimolecular layers. J. Am. Chem. Soc. 1938, 60, 309–319. [Google Scholar] [CrossRef]
- Barrett, E.P.; Joyner, L.G.; Halenda, P.P. The determination of pore volume and area distributions in porous substances. I. Computations from nitrogen isotherms. J. Am. Chem. Soc. 1951, 73, 373–380. [Google Scholar] [CrossRef]
- Ağaoğulları, D.; Madsen, S.J.; Ögüt, B.; Koh, A.L.; Sinclair, R. Synthesis and characterization of graphite-encapsulated iron nanoparticles from ball milling-assisted low-pressure chemical vapor deposition. Carbon 2017, 124, 170–179. [Google Scholar] [CrossRef]
- Liu, J.; Yu, B.W.; Zhang, Q.K.; Hou, L.Z.; Huang, Q.L.; Song, C.R.; Wang, S.L.; Wu, Y.Q.; He, Y.H.; Zou, J.; et al. Synthesis and magnetic properties of Fe3C–C core–shell nanoparticles. Nanotechnology 2015, 26, 085601. [Google Scholar] [CrossRef]
- Ermakova, M.A.; Ermakov, D.Y.; Chuvilin, A.L.; Kuvshinov, G.G. Decomposition of methane over iron catalysts at the range of moderate temperatures: The influence of structure of the catalytic systems and the reaction conditions on the yield of carbon and morphology of carbon filaments. J. Catal. 2001, 201, 183–197. [Google Scholar] [CrossRef]
- He, C.N.; Zhao, N.Q.; Du, X.W.; Shi, C.S.; Ding, J.; Li, J.J.; Li, Y.D. Low-temperature synthesis of carbon onions by chemical vapor deposition using a nickel catalyst supported on aluminum. Scr. Mater. 2006, 54, 689–693. [Google Scholar] [CrossRef]
- He, C.N.; Du, X.W.; Ding, J.; Shi, C.S.; Li, J.J.; Zhao, N.Q.; Cui, L. Low-temperature CVD synthesis of carbon-encapsulated magnetic Ni nanoparticles with a narrow distribution of diameters. Carbon 2006, 44, 2330–2333. [Google Scholar] [CrossRef]
- Huang, C.W.; Wu, H.C.; Lin, W.H.; Li, Y.Y. Temperature effect on the formation of catalysts for growth of carbon nanofibers. Carbon 2009, 47, 795–803. [Google Scholar] [CrossRef]
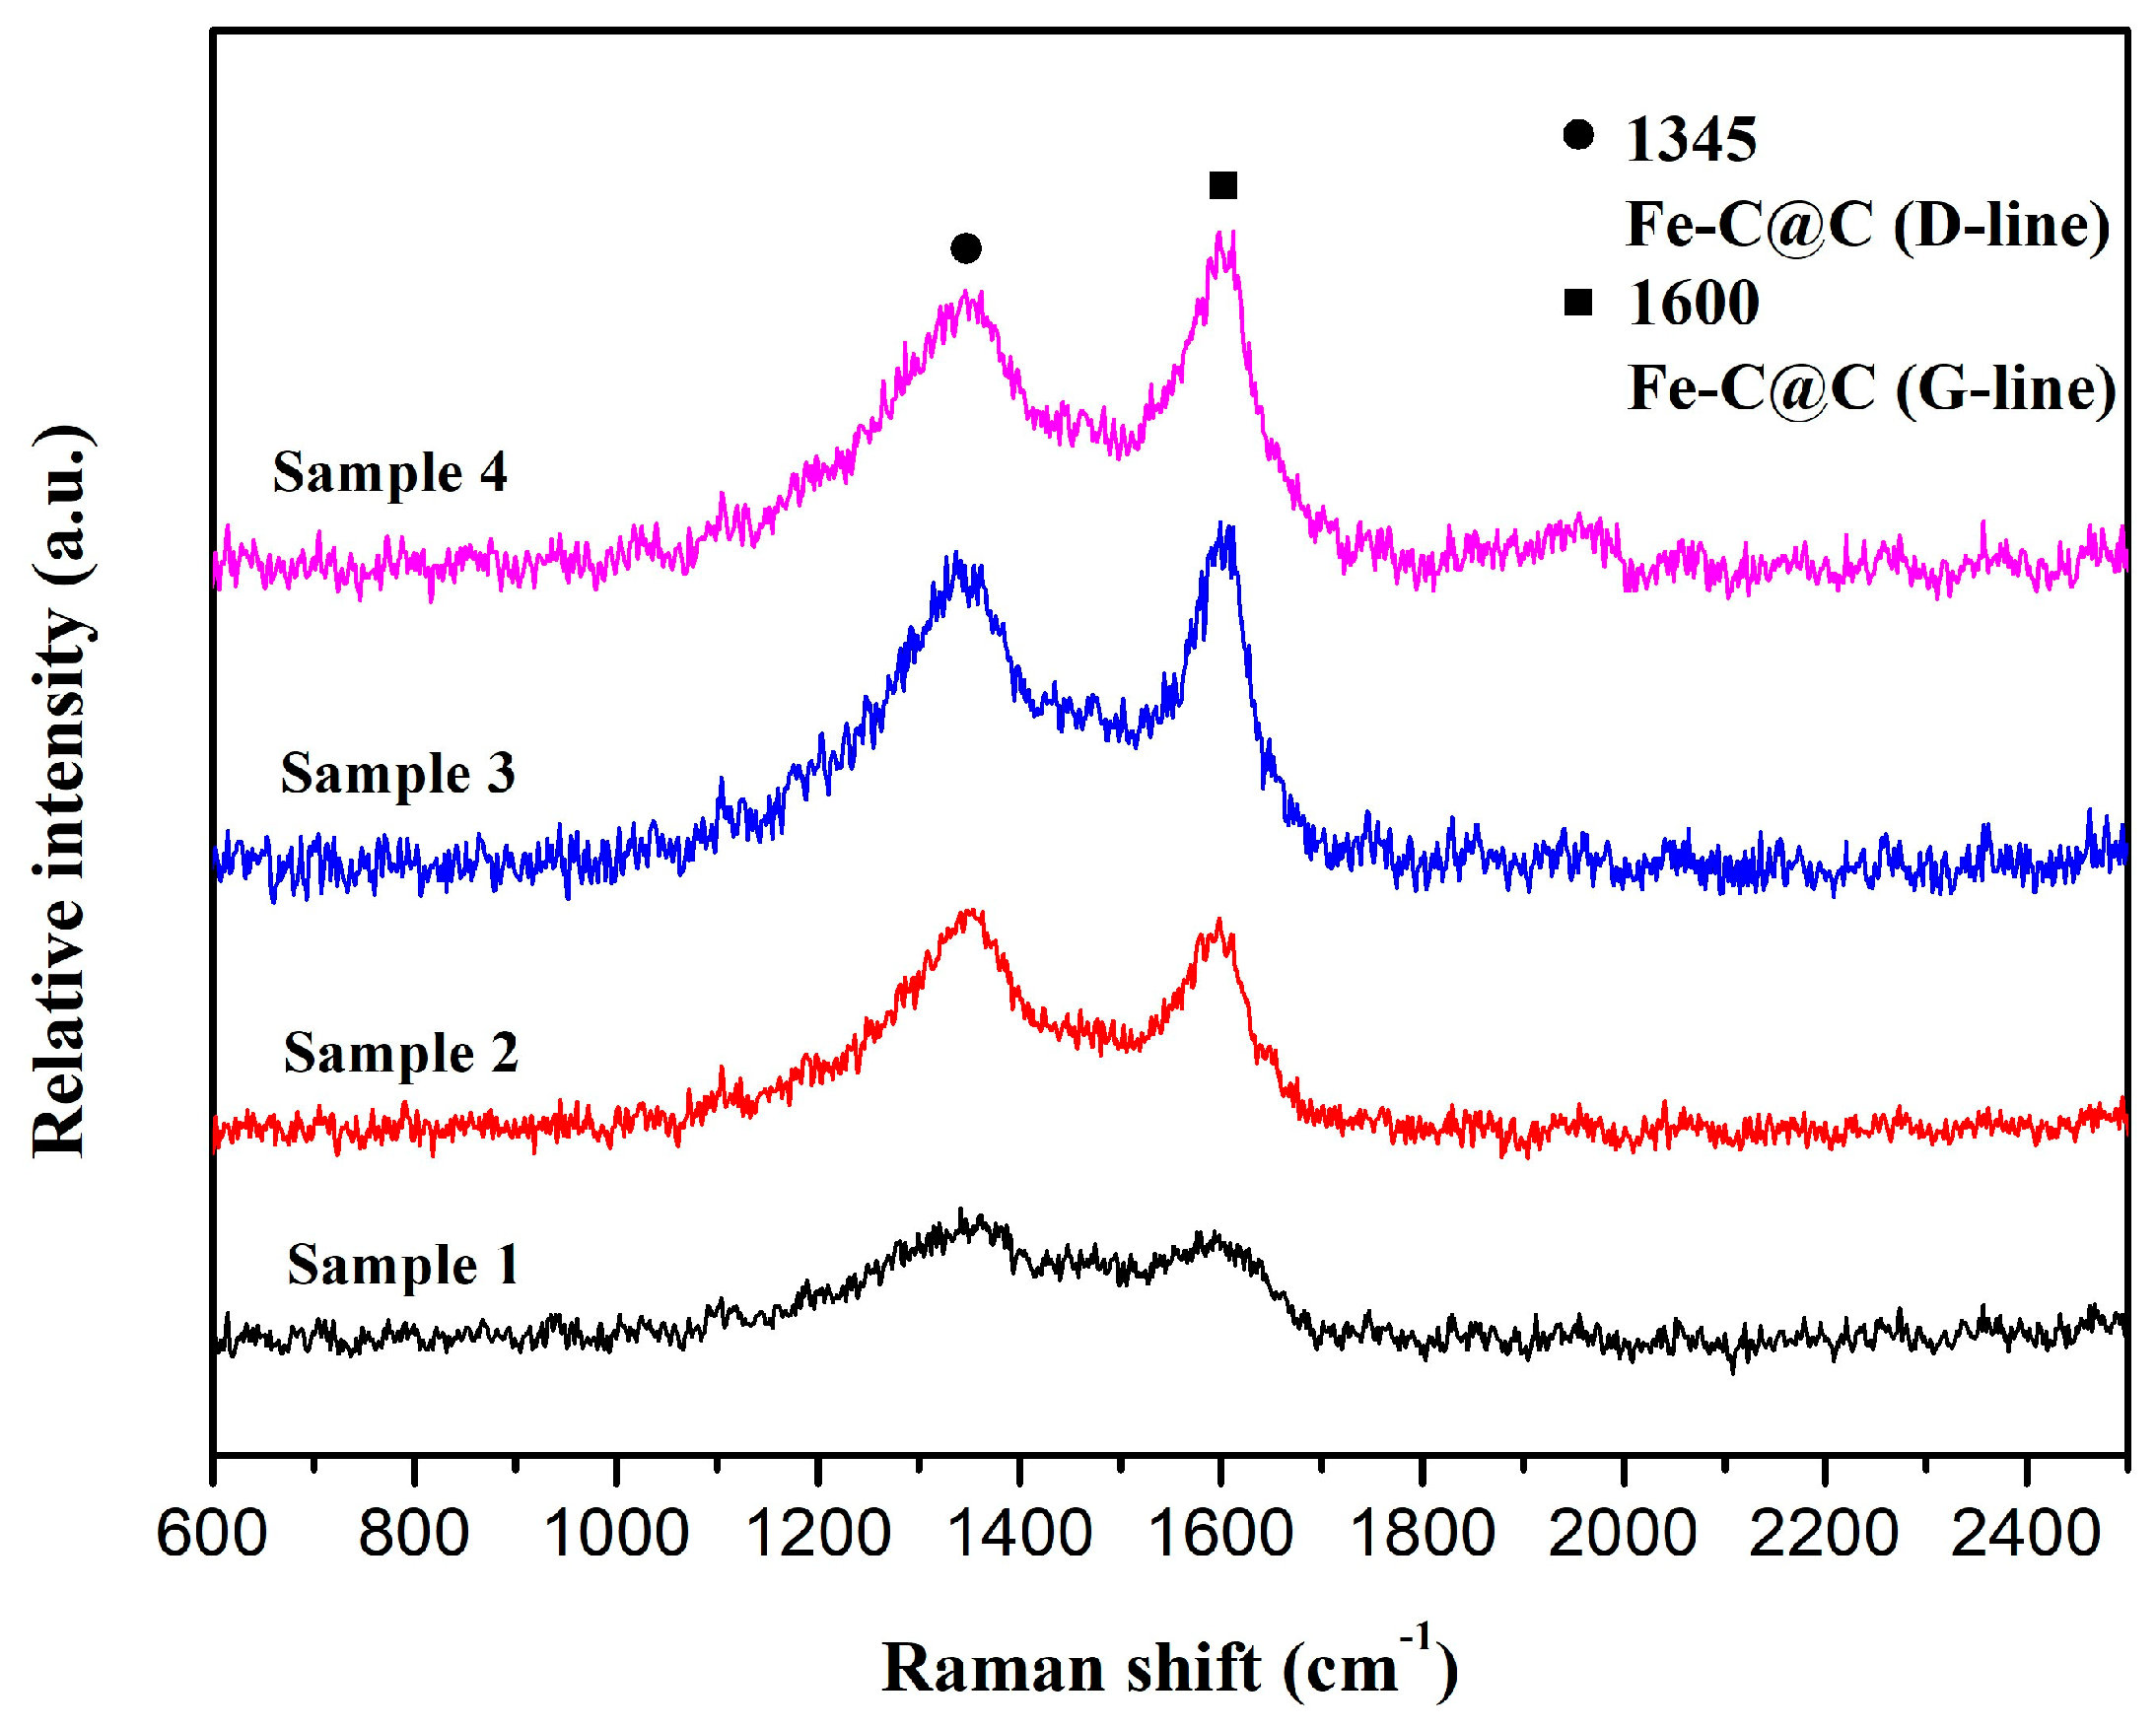
- Nemanich, R.J.; Solin, S.A. First- and second-order Raman scattering from finite-size crystals of graphite. Phys. Rev. B 1979, 20, 392. [Google Scholar] [CrossRef]
- Zhang, S.W.; Zeng, M.Y.; Li, J.X.; Li, J.; Xu, J.Z.; Wang, X.K. Porous magnetic carbon sheets from biomass as an adsorbent for the fast removal of organic pollutants from aqueous solution. J. Mater. Chem. A 2014, 2, 4391–4397. [Google Scholar] [CrossRef]
- McCusker, L.B.; Liebau, F.; Engelhardt, G. Nomenclature of structural and compositional characteristics of ordered microporous and mesoporous materials with inorganic hosts: (IUPAC recommendations 2001). Pure Appl. Chem. 2001, 73, 381–394. [Google Scholar] [CrossRef]
- Li, C.D.; Lu, J.J.; Li, S.M.; Tong, Y.B.; Ye, B. Synthesis of magnetic microspheres with sodium alginate and activated carbon for removal of methylene blue. Materials 2017, 10, 84. [Google Scholar] [CrossRef]
- Liu, D.H.; Guo, Y.; Zhang, L.H.; Li, W.C.; Sun, T.; Lu, A.H. Switchable transport strategy to deposit active Fe/Fe3C cores into hollow microporous carbons for efficient chromium removal. Small 2013, 9, 3852–3857. [Google Scholar] [CrossRef]
- Lust, E.; Vaarmets, K.; Nerut, J.; Tallo, I.; Valk, P.; Sepp, S.; Härk, E. Influence of specific surface area and microporosity-mesoporosity of pristine and Pt-nanoclusters modified carbide derived carbon electrodes on the oxygen electroreduction. Electrochim. Acta 2014, 140, 294–303. [Google Scholar] [CrossRef]
- Bystrzejewski, M.; Łabędź, O.; Kaszuwara, W.; Huczko, A.; Lange, H. Controlling the diameter and magnetic properties of carbon-encapsulated iron nanoparticles produced by carbon arc discharge. Powder Technol. 2013, 246, 7–15. [Google Scholar] [CrossRef]
- Sinclair, R.; Li, H.; Madsen, S.; Dai, H.J. HREM analysis of graphite-encapsulated metallic nanoparticles for possible medical applications. Ultramicroscopy 2013, 134, 167–174. [Google Scholar] [CrossRef]
- Liao, Y.P.; Pan, K.; Wang, L.; Pan, Q.J.; Zhou, W.; Miao, X.H.; Jiang, B.J.; Tian, C.G.; Tian, G.H.; Wang, G.F.; et al. Facile synthesis of high-crystallinity graphitic carbon/Fe3C nanocomposites as counter electrodes for high-efficiency dye-sensitized solar cells. ACS Appl. Mater. Inter. 2013, 5, 3663–3670. [Google Scholar] [CrossRef]
- He, C.N.; Zhao, N.Q.; Shi, C.S.; Li, J.J.; Li, H.P. Magnetic properties and transmission electron microscopy studies of Ni nanoparticles encapsulated in carbon nanocages and carbon nanotubes. Mater. Res. Bull. 2008, 43, 2260–2265. [Google Scholar] [CrossRef]
- Sergiienko, R.; Shibata, E.; Zentaro, A.; Shindo, D.; Nakamura, T.; Qin, G.W. Formation and characterization of graphite-encapsulated cobalt nanoparticles synthesized by electric discharge in an ultrasonic cavitation field of liquid ethanol. Acta Mater. 2007, 55, 3671–3680. [Google Scholar] [CrossRef]
- Ogawa, T.; Kura, H.; Takahashi, M. Simultaneous agglomeration of Fe/Au nanoparticles with controllability of magnetic dipole interaction. Scr. Mater. 2011, 64, 1067–1070. [Google Scholar] [CrossRef]
- Qiu, J.S.; Li, Q.X.; Wang, Z.Y.; Sun, Y.F.; Zhang, H.Z. CVD synthesis of coal-gas-derived carbon nanotubes and nanocapsules containing magnetic iron carbide and oxide. Carbon 2006, 44, 2565–2568. [Google Scholar] [CrossRef]
- Daneshvar, E.; Vazirzadeh, A.; Niazi, A.; Kousha, M.; Naushad, M.; Bhatnagar, A. Desorption of methylene blue dye from brown macroalga: Effects of operating parameters, isotherm study and kinetic modeling. J. Clean. Prod. 2017, 152, 443–453. [Google Scholar] [CrossRef]
- Baseri, H.; Tizro, S. Treatment of nickel ions from contaminated water by magnetite based nanocomposite adsorbents: Effects of thermodynamic and kinetic parameters and modeling with Langmuir and Freundlich isotherms. Process Saf. Environ. 2017, 109, 465–477. [Google Scholar] [CrossRef]
- Wu, J.; Yu, H.Q. Biosorption of 2, 4-dichlorophenol by immobilized white-rot fungus Phanerochaete chrysosporium from aqueous solutions. Bioresour. Technol. 2007, 98, 253–259. [Google Scholar] [CrossRef]
- Xu, L.; Guo, C.; Wang, F.; Zheng, S.; Liu, C.Z. A simple and rapid harvesting method for microalgae by in situ magnetic separation. Bioresour. Technol. 2011, 102, 10047–10051. [Google Scholar] [CrossRef]


| Materials | Specific Surface Area (m2/g) | Pore Volume (cm3/g) | Pore Size (nm) |
|---|---|---|---|
| Sample 1 | 79.4 | 0.25 | 2.37 |
| Sample 2 | 105.5 | 0.35 | 3.14 |
| Sample 3 | 169.4 | 0.50 | 2.18 |
| Sample 4 | 124.7 | 0.44 | 2.83 |
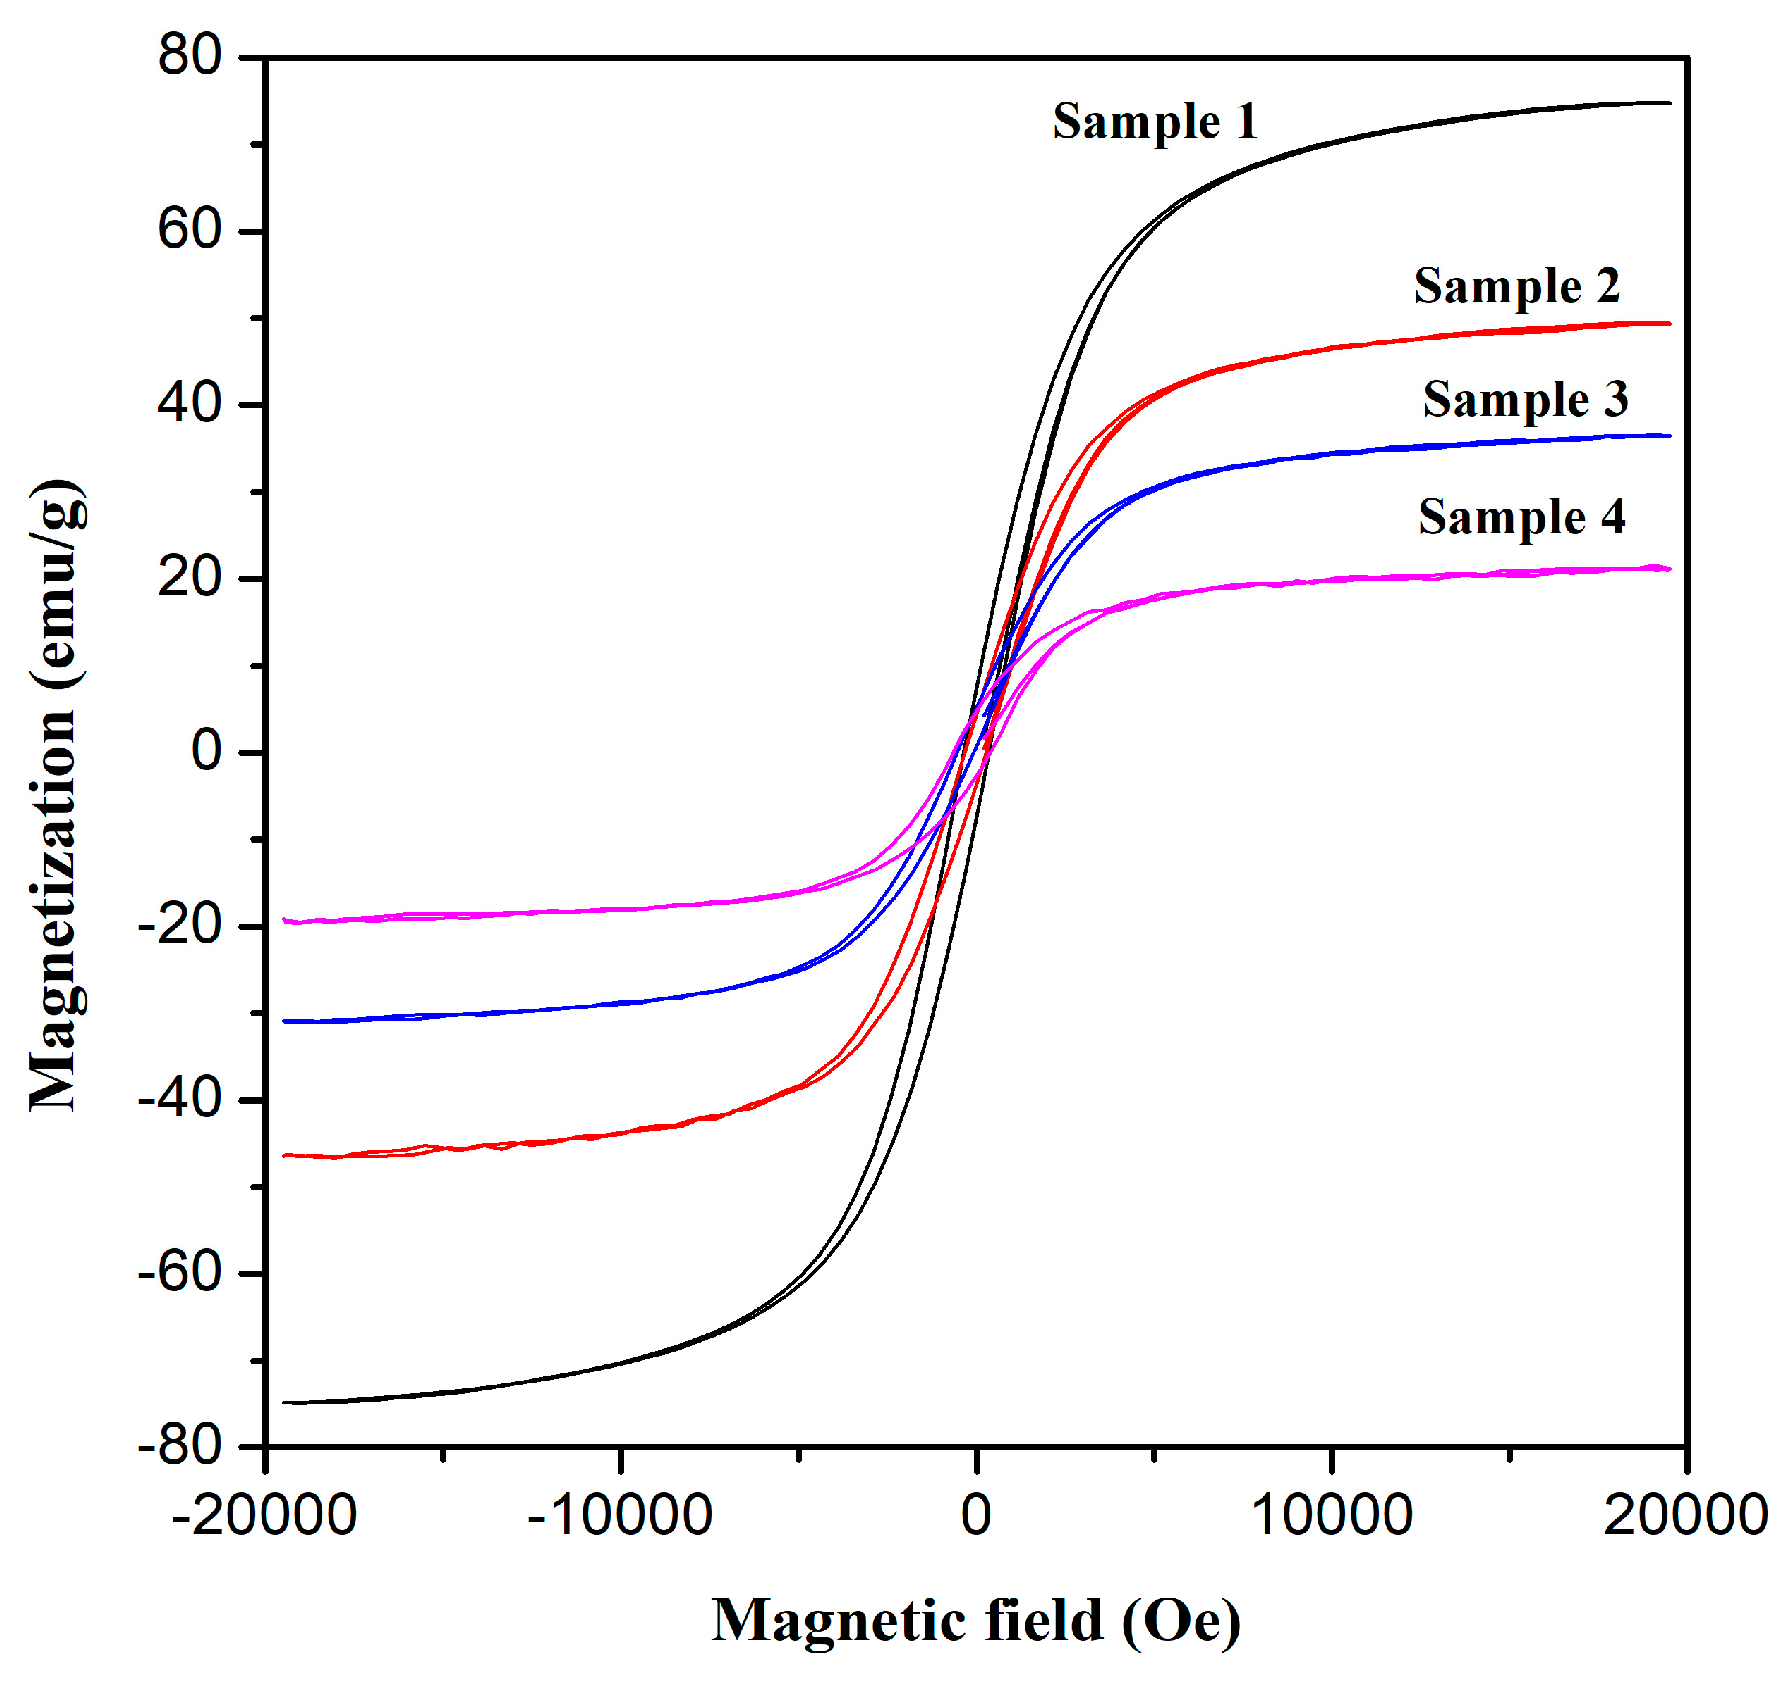
| Materials | Ms (emu/g) | Mr (emu/g) | Mr/Ms | Hc (Oe) |
|---|---|---|---|---|
| Sample 1 | 74.793 | 7.5955 | 0.102 | 358.83 |
| Sample 2 | 49.532 | 5.7361 | 0.116 | 426.90 |
| Sample 3 | 36.544 | 5.6221 | 0.154 | 560.61 |
| Sample 4 | 21.533 | 4.5716 | 0.212 | 621.33 |
| Materials | Langmuir Model | Freundlich Model | ||||
|---|---|---|---|---|---|---|
| Qmax (mg/g) | KL (L/mg) | R2 | KF [(mg/g)·(L/mg)1/n] | 1/n | R2 | |
| Sample 1 | 71.28 | 0.167 | 0.937 | 23.42 | 0.222 | 0.940 |
| Sample 2 | 75.16 | 0.090 | 0.897 | 19.26 | 0.263 | 0.987 |
| Sample 3 | 90.14 | 0.083 | 0.955 | 21.58 | 0.275 | 0.952 |
| Sample 4 | 81.45 | 0.083 | 0.925 | 20.07 | 0.269 | 0.979 |
© 2019 by the authors. Licensee MDPI, Basel, Switzerland. This article is an open access article distributed under the terms and conditions of the Creative Commons Attribution (CC BY) license (http://creativecommons.org/licenses/by/4.0/).
Share and Cite
Zhao, L.; Dai, X.; Li, B.; Wang, H.; Li, H.; Liang, C. Synthesis and Characterization of Flower-like Carbon-encapsulated Fe-C Nanoparticles for Application as Adsorbing Material. Materials 2019, 12, 829. https://doi.org/10.3390/ma12050829
Zhao L, Dai X, Li B, Wang H, Li H, Liang C. Synthesis and Characterization of Flower-like Carbon-encapsulated Fe-C Nanoparticles for Application as Adsorbing Material. Materials. 2019; 12(5):829. https://doi.org/10.3390/ma12050829
Chicago/Turabian StyleZhao, Lixin, Xibin Dai, Baoe Li, Hongshui Wang, Haipeng Li, and Chunyong Liang. 2019. "Synthesis and Characterization of Flower-like Carbon-encapsulated Fe-C Nanoparticles for Application as Adsorbing Material" Materials 12, no. 5: 829. https://doi.org/10.3390/ma12050829
APA StyleZhao, L., Dai, X., Li, B., Wang, H., Li, H., & Liang, C. (2019). Synthesis and Characterization of Flower-like Carbon-encapsulated Fe-C Nanoparticles for Application as Adsorbing Material. Materials, 12(5), 829. https://doi.org/10.3390/ma12050829