Effect of Different Pressures on Microstructure and Mechanical Performance of F-III Fibers in Supercritical Carbon Dioxide Fluid

Abstract
:1. Introduction
2. Materials and Methods
2.1. Materials
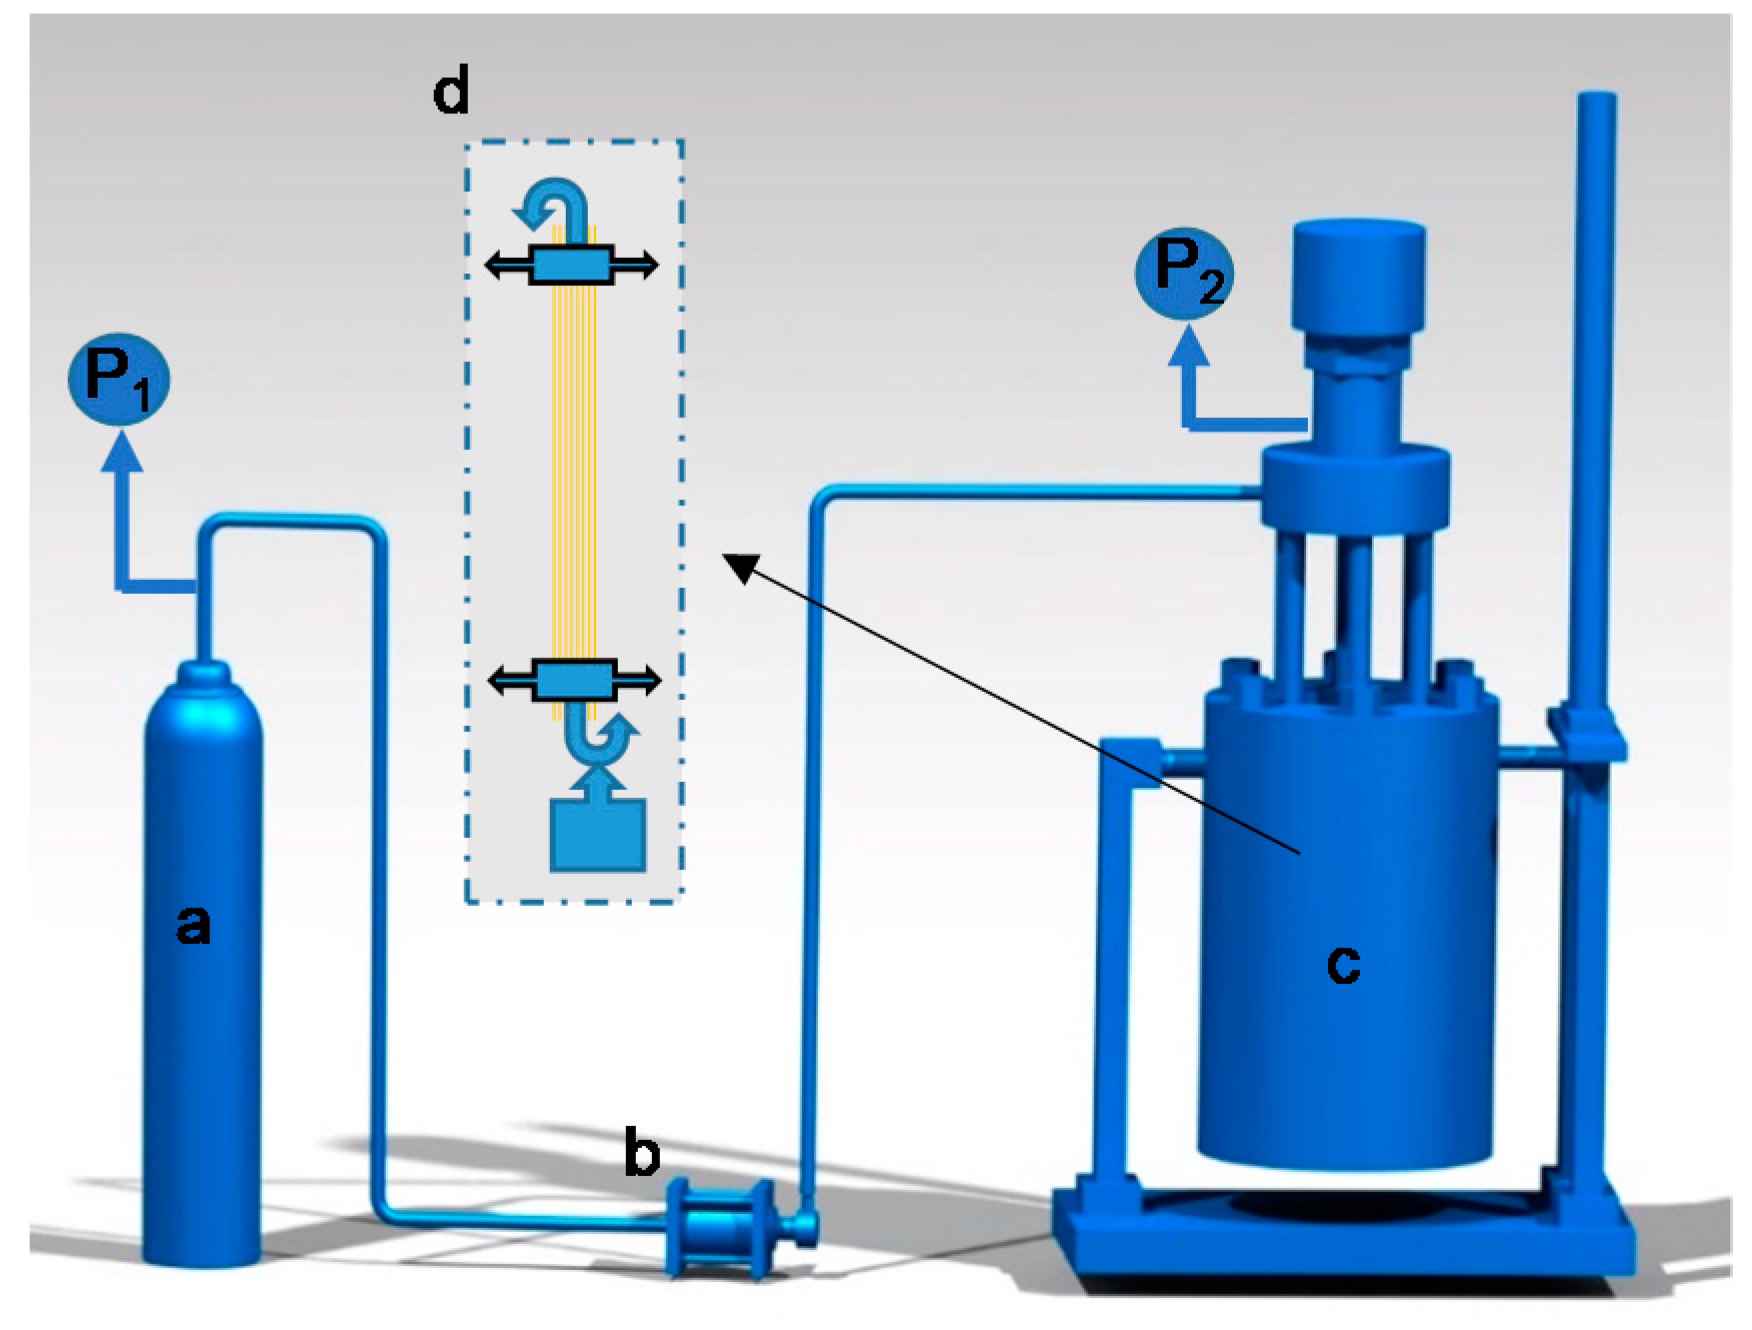
2.2. Preparation of Hot-Stretch Samples in the Sc-CO2 Reactor
2.3. Characterization of Samples
3. Results and Discussion
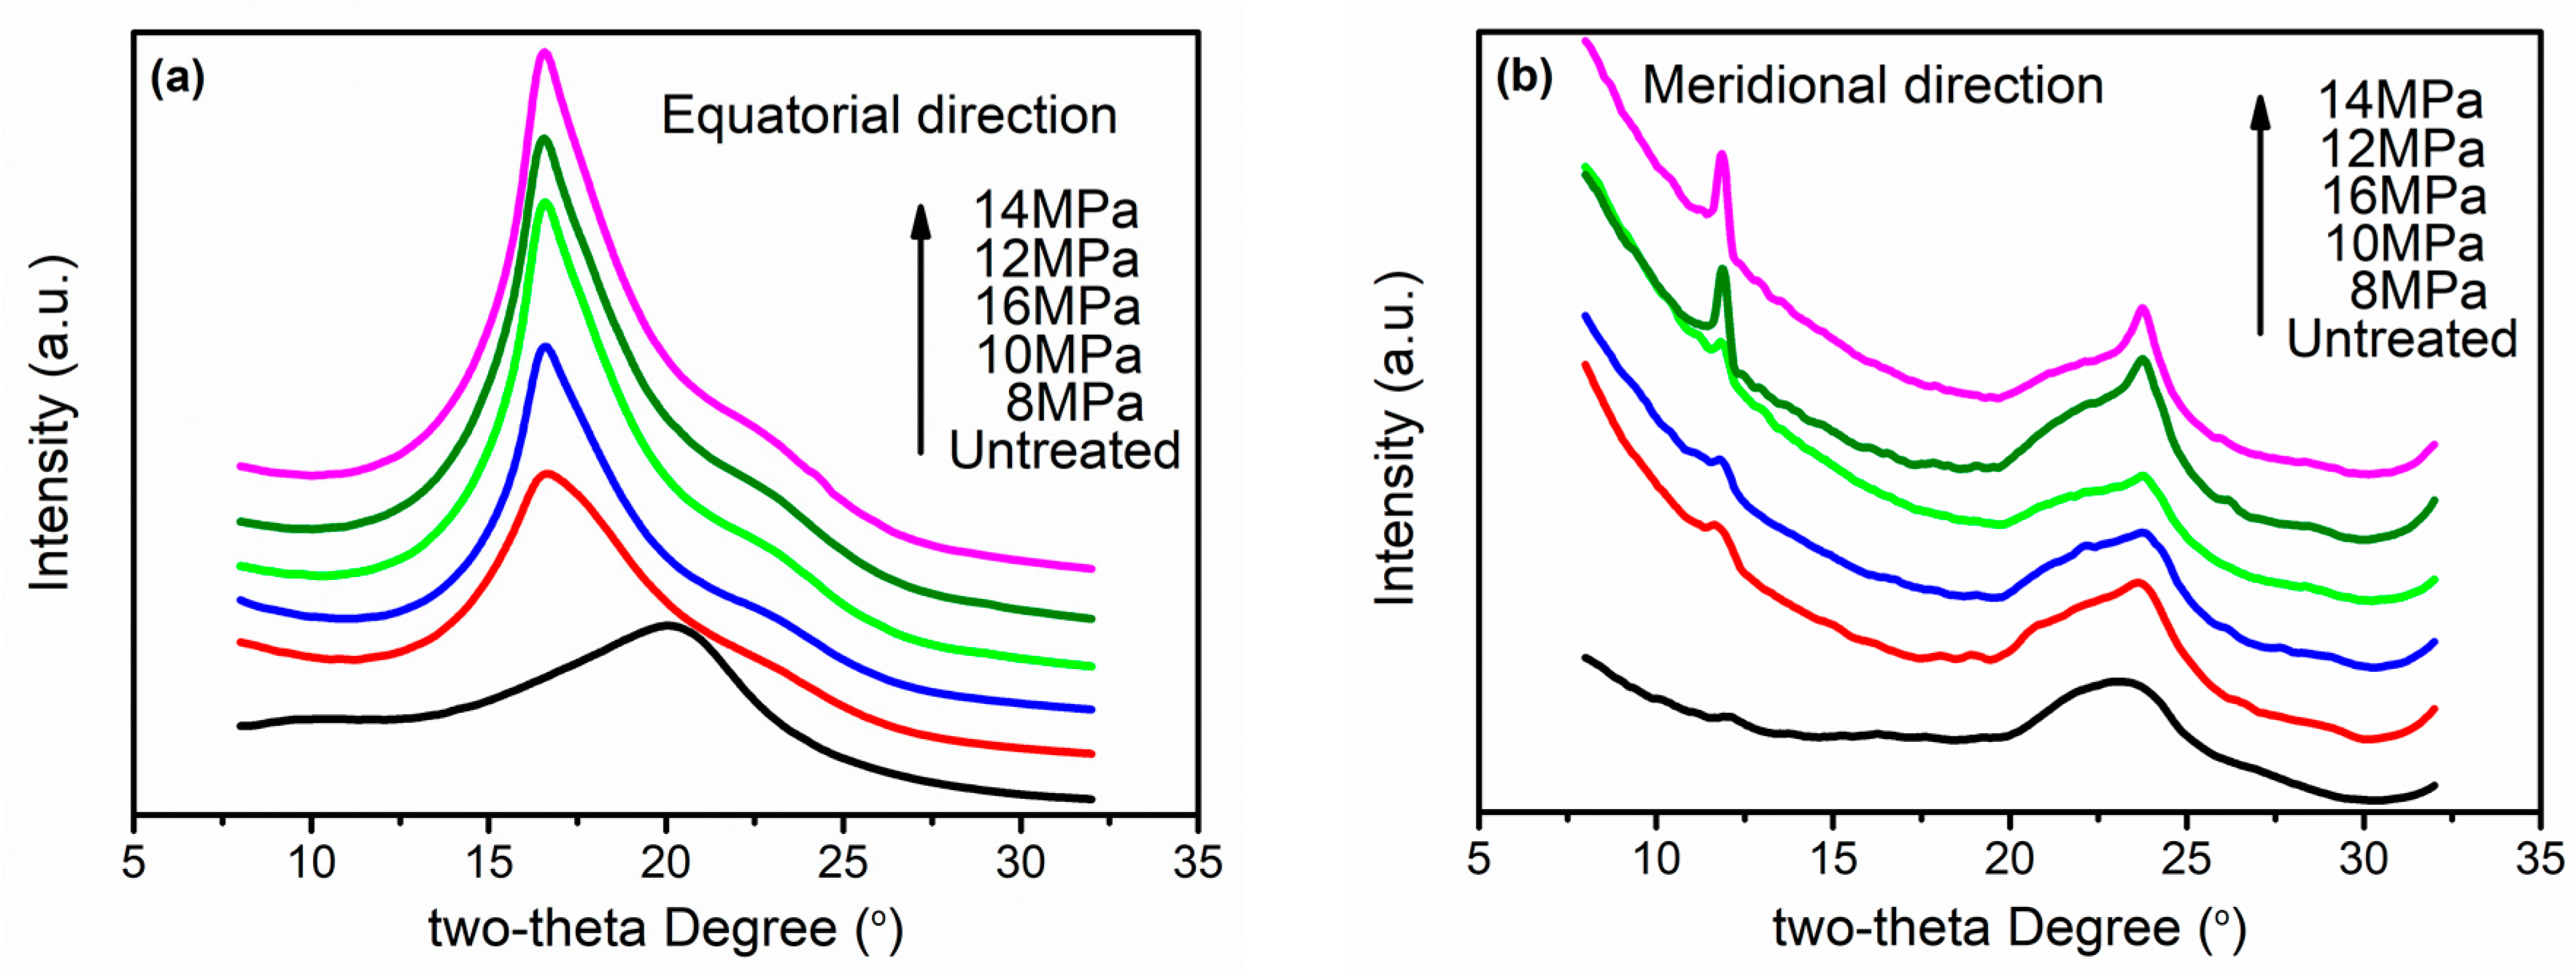
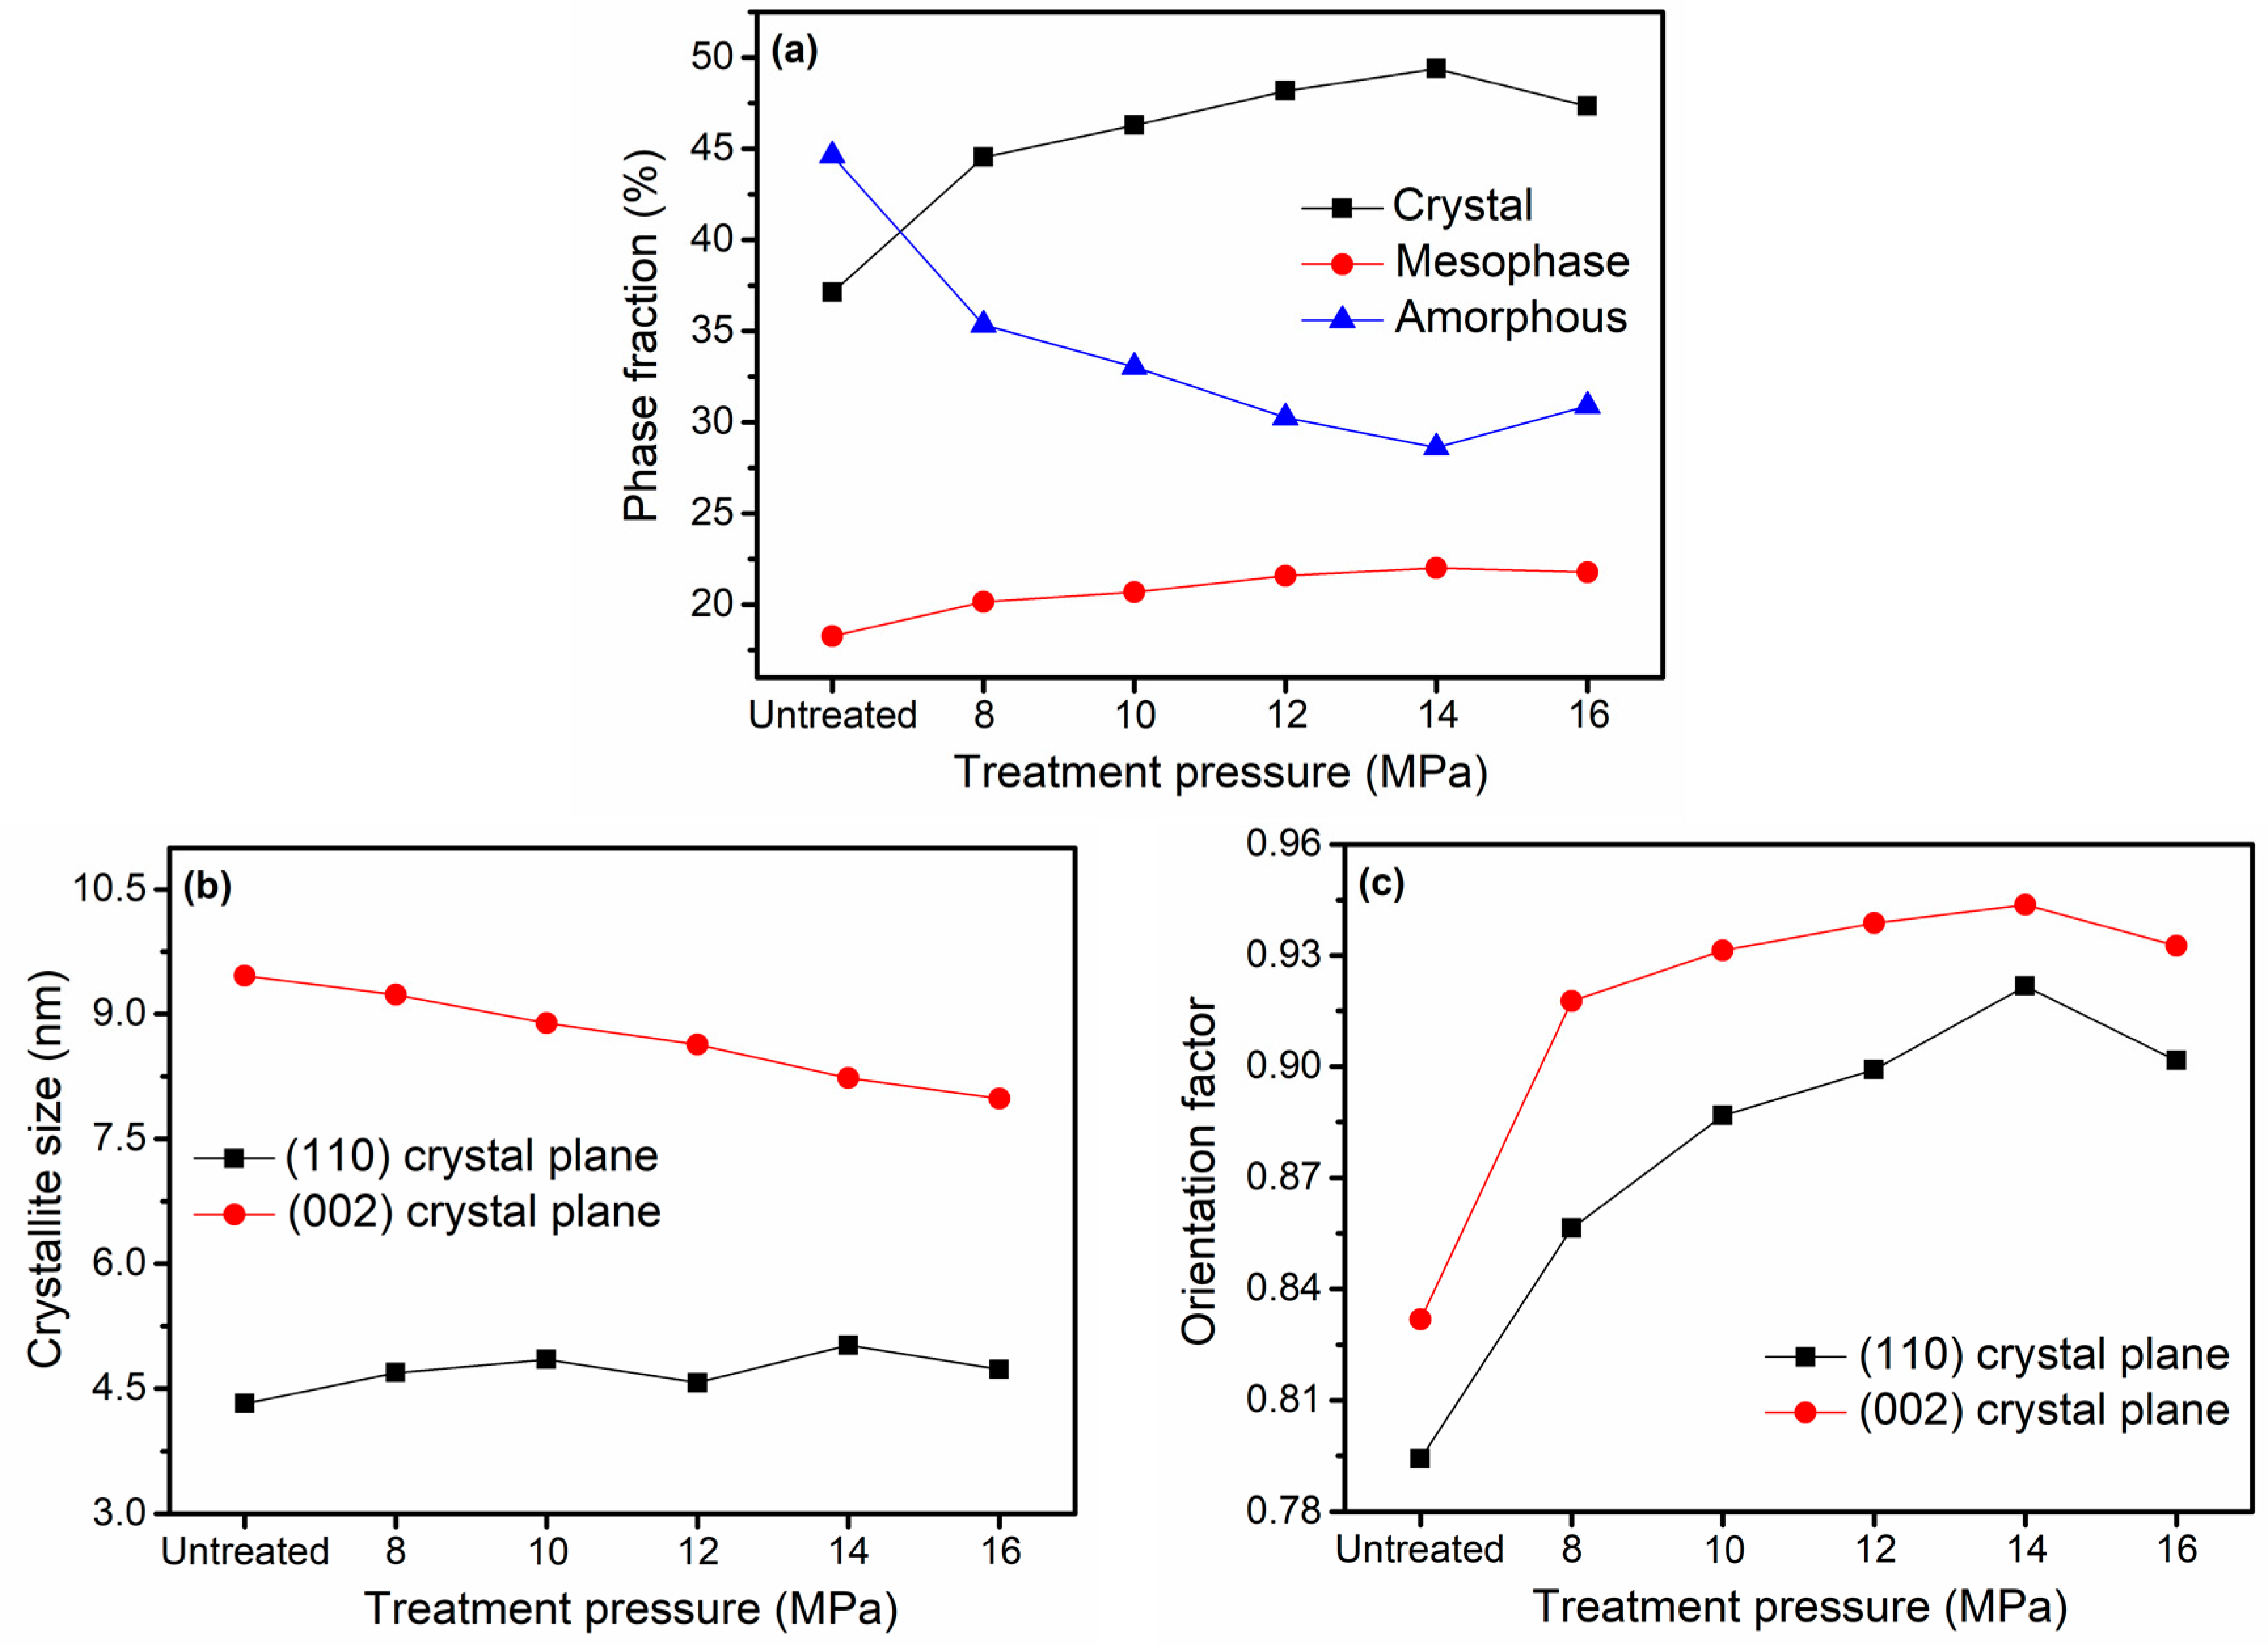
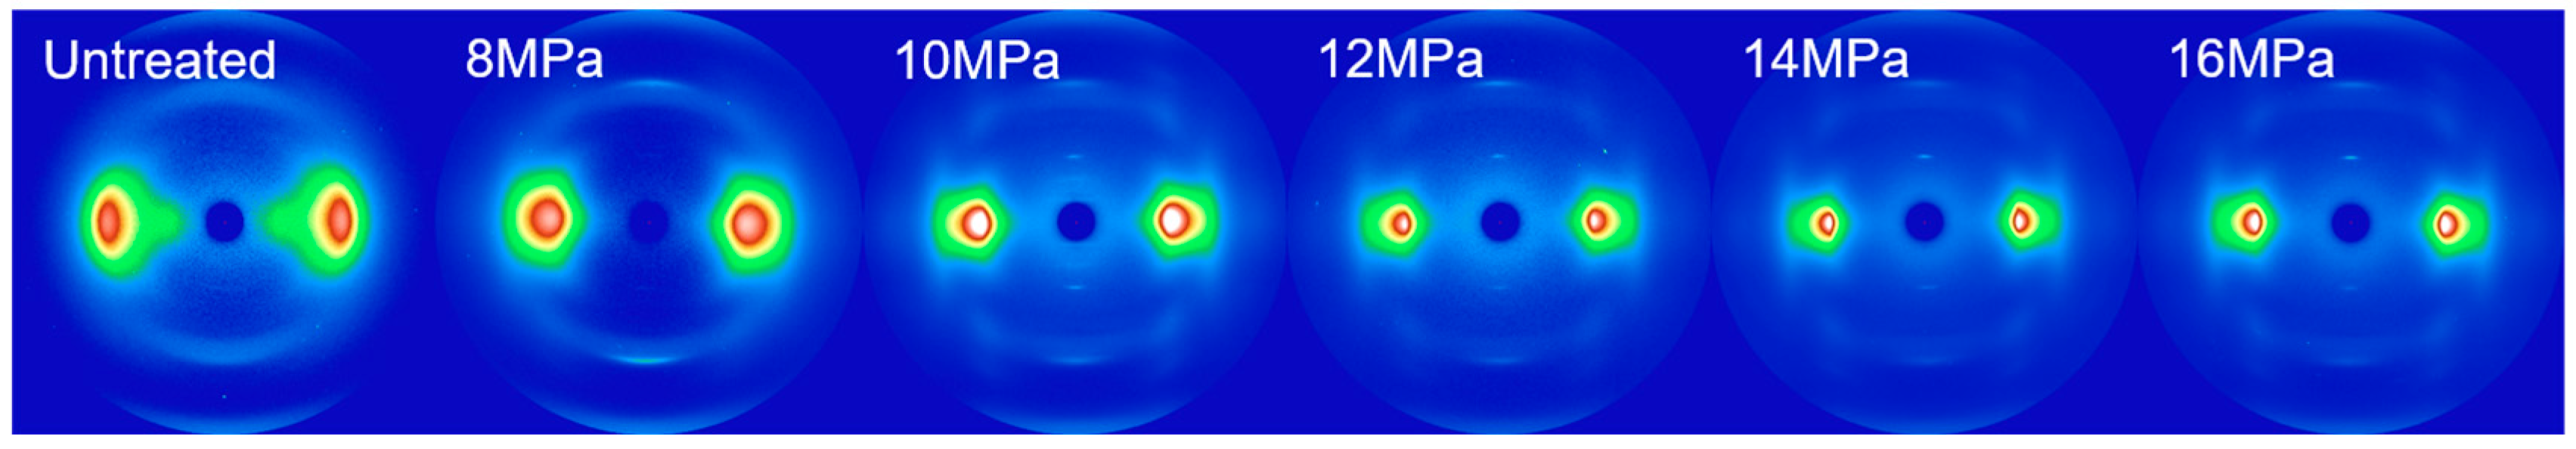
3.1. WAXS Analysis
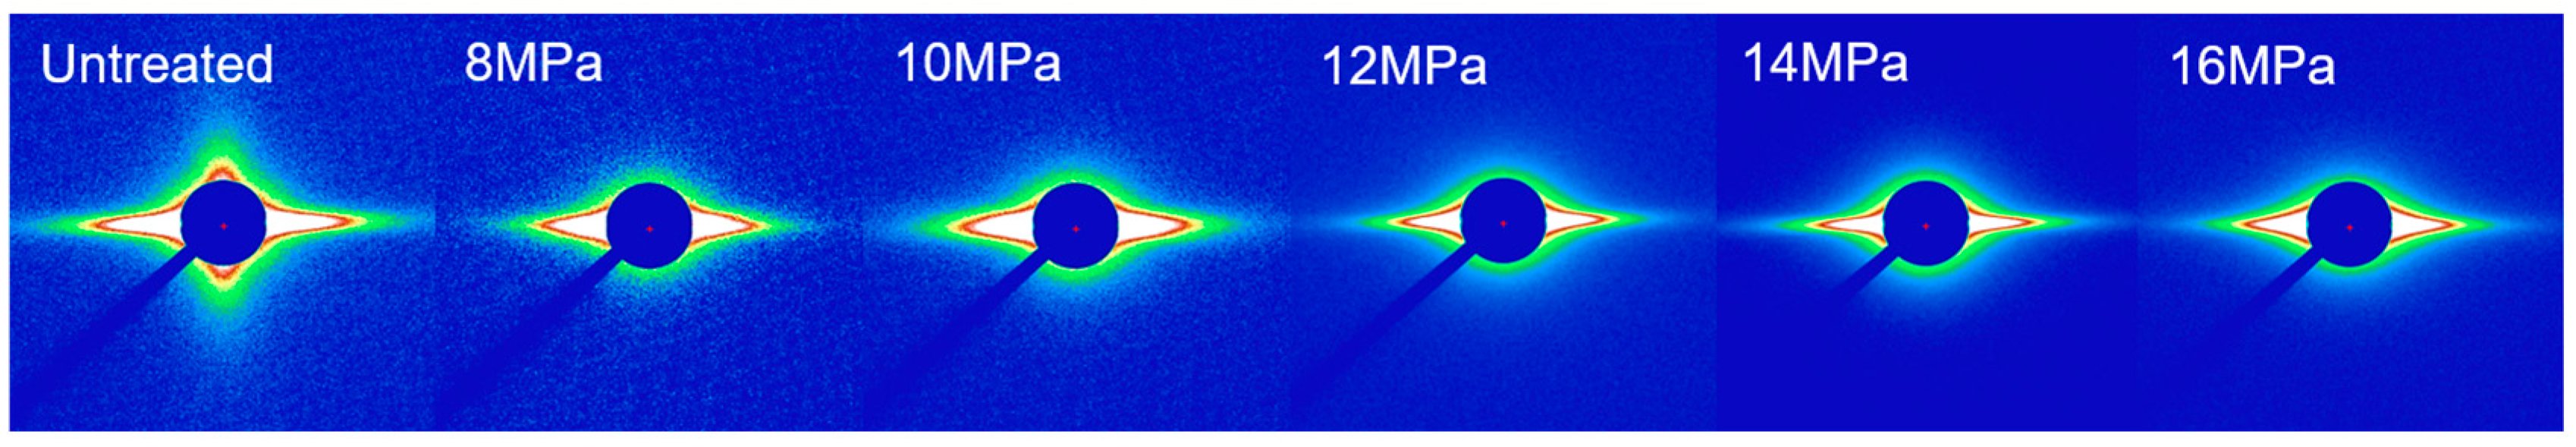
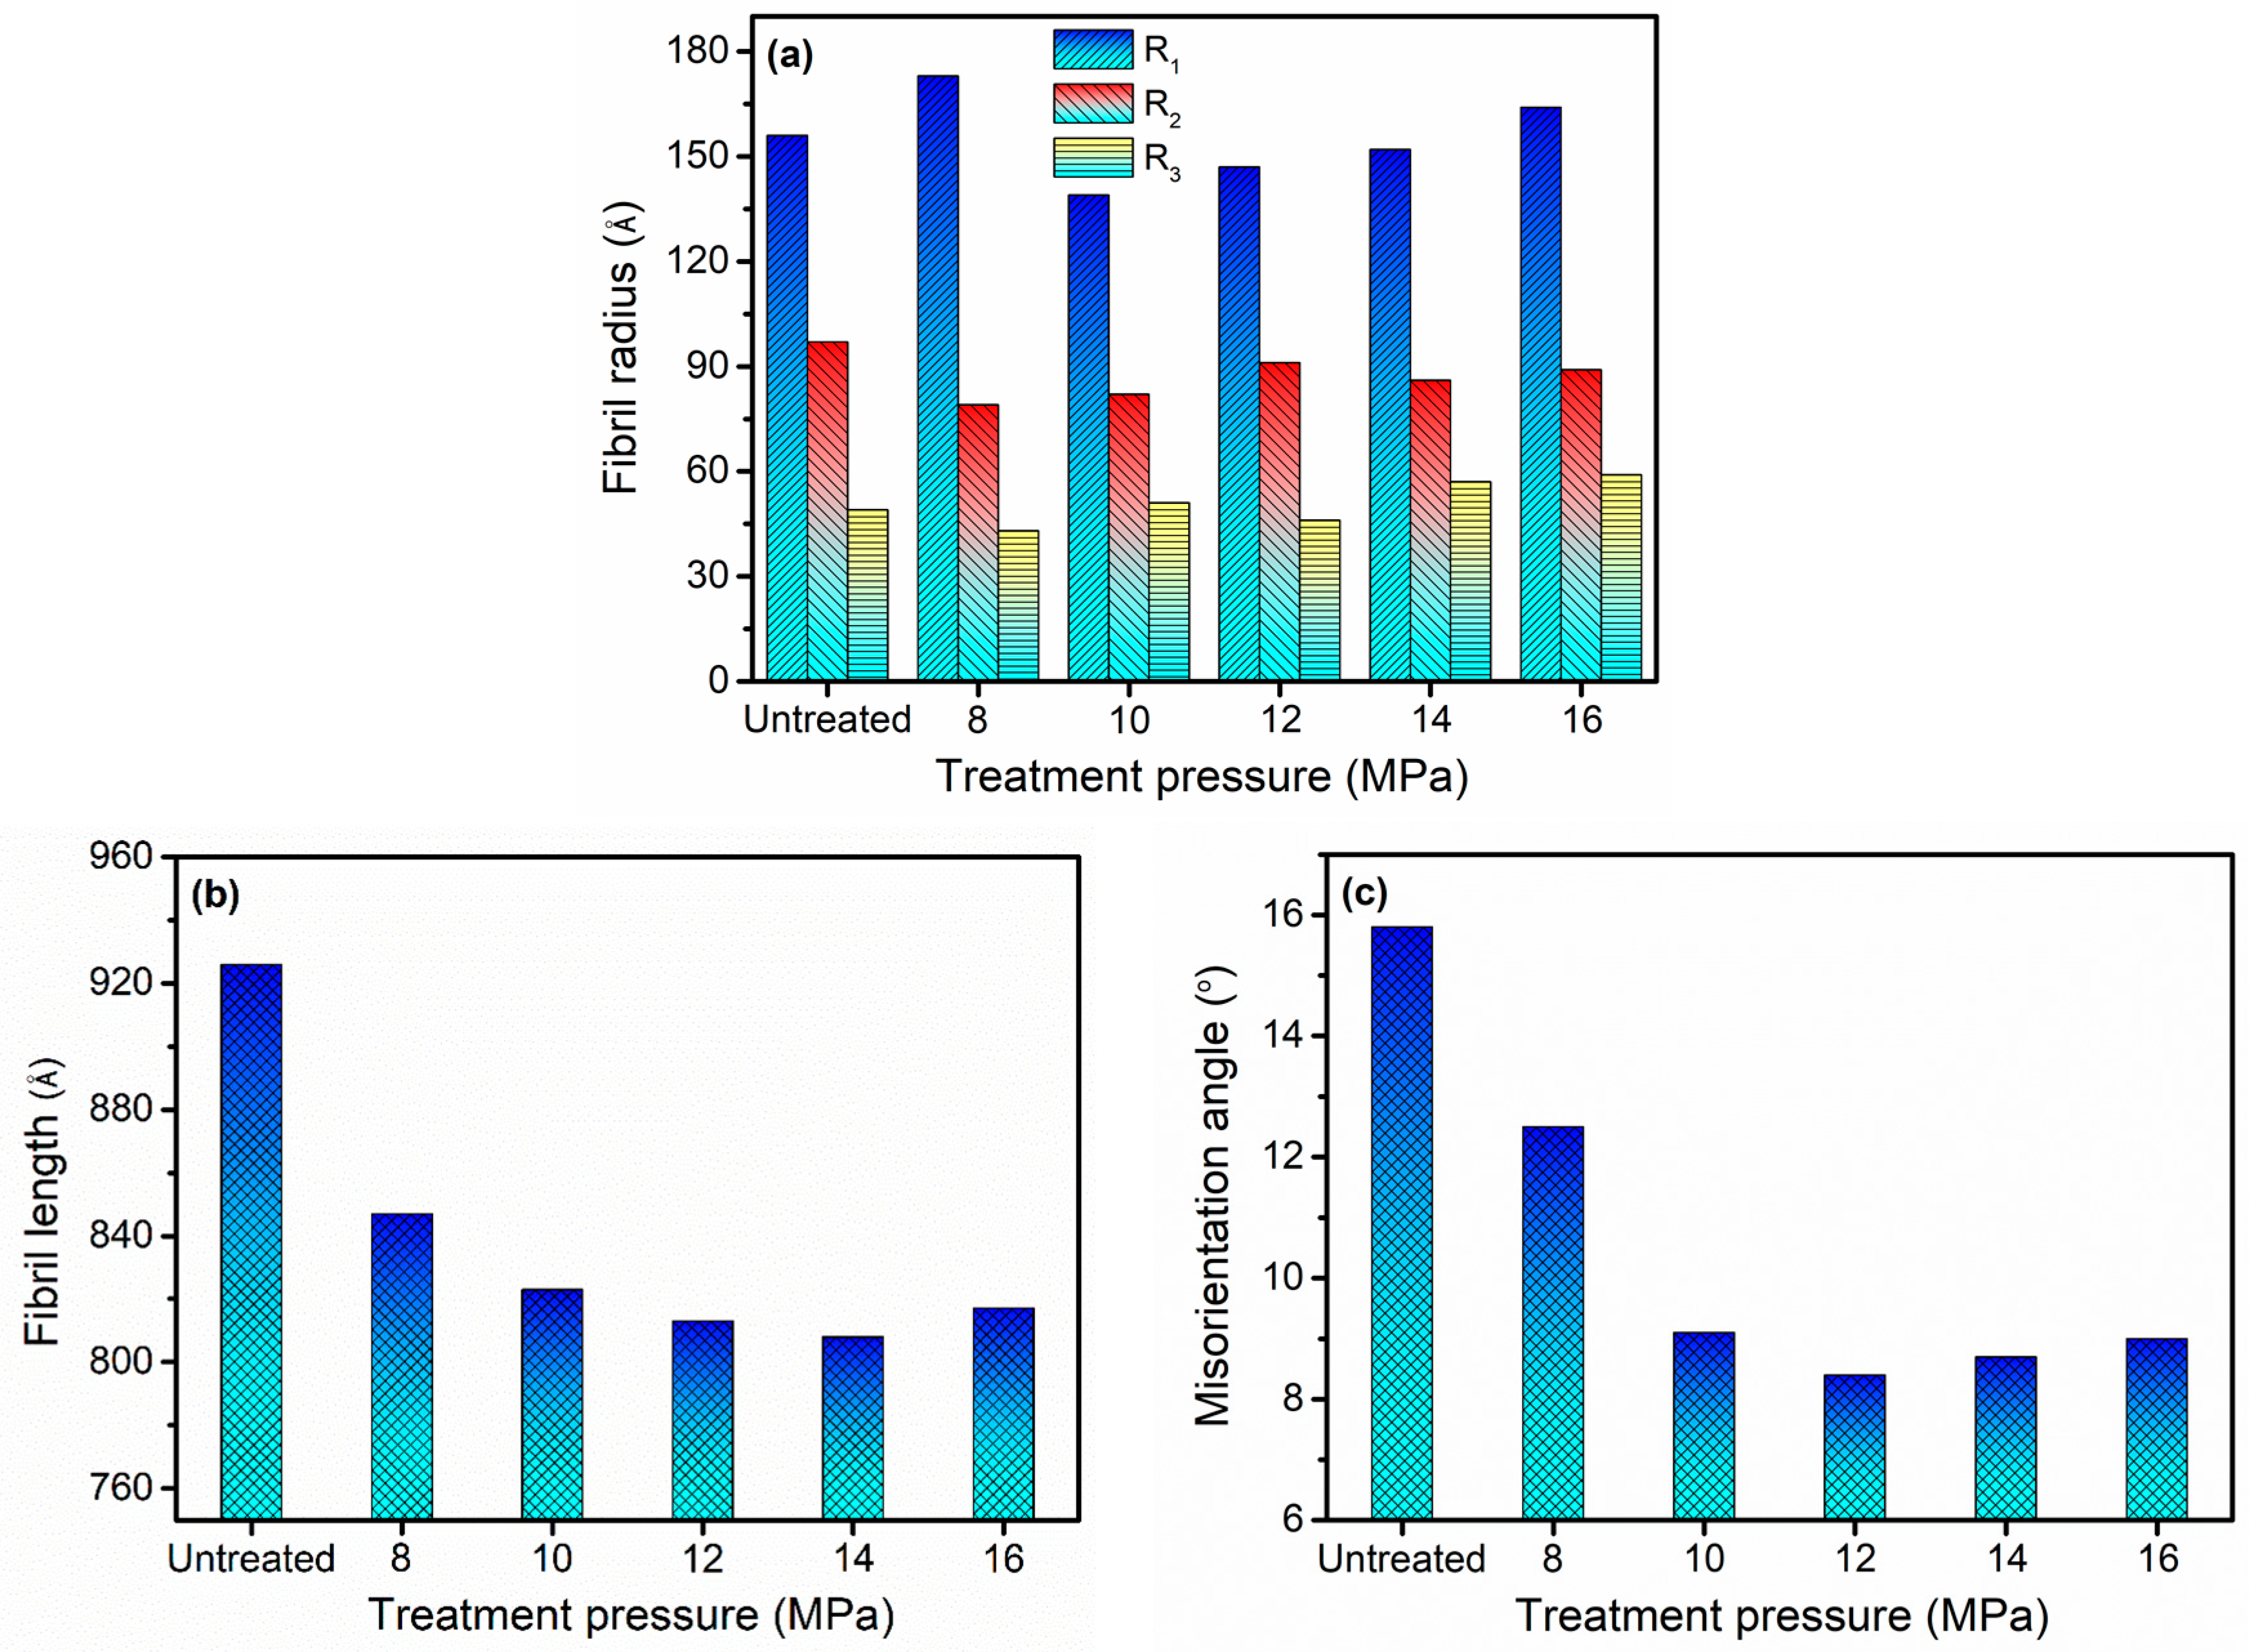
3.2. SAXS Analysis
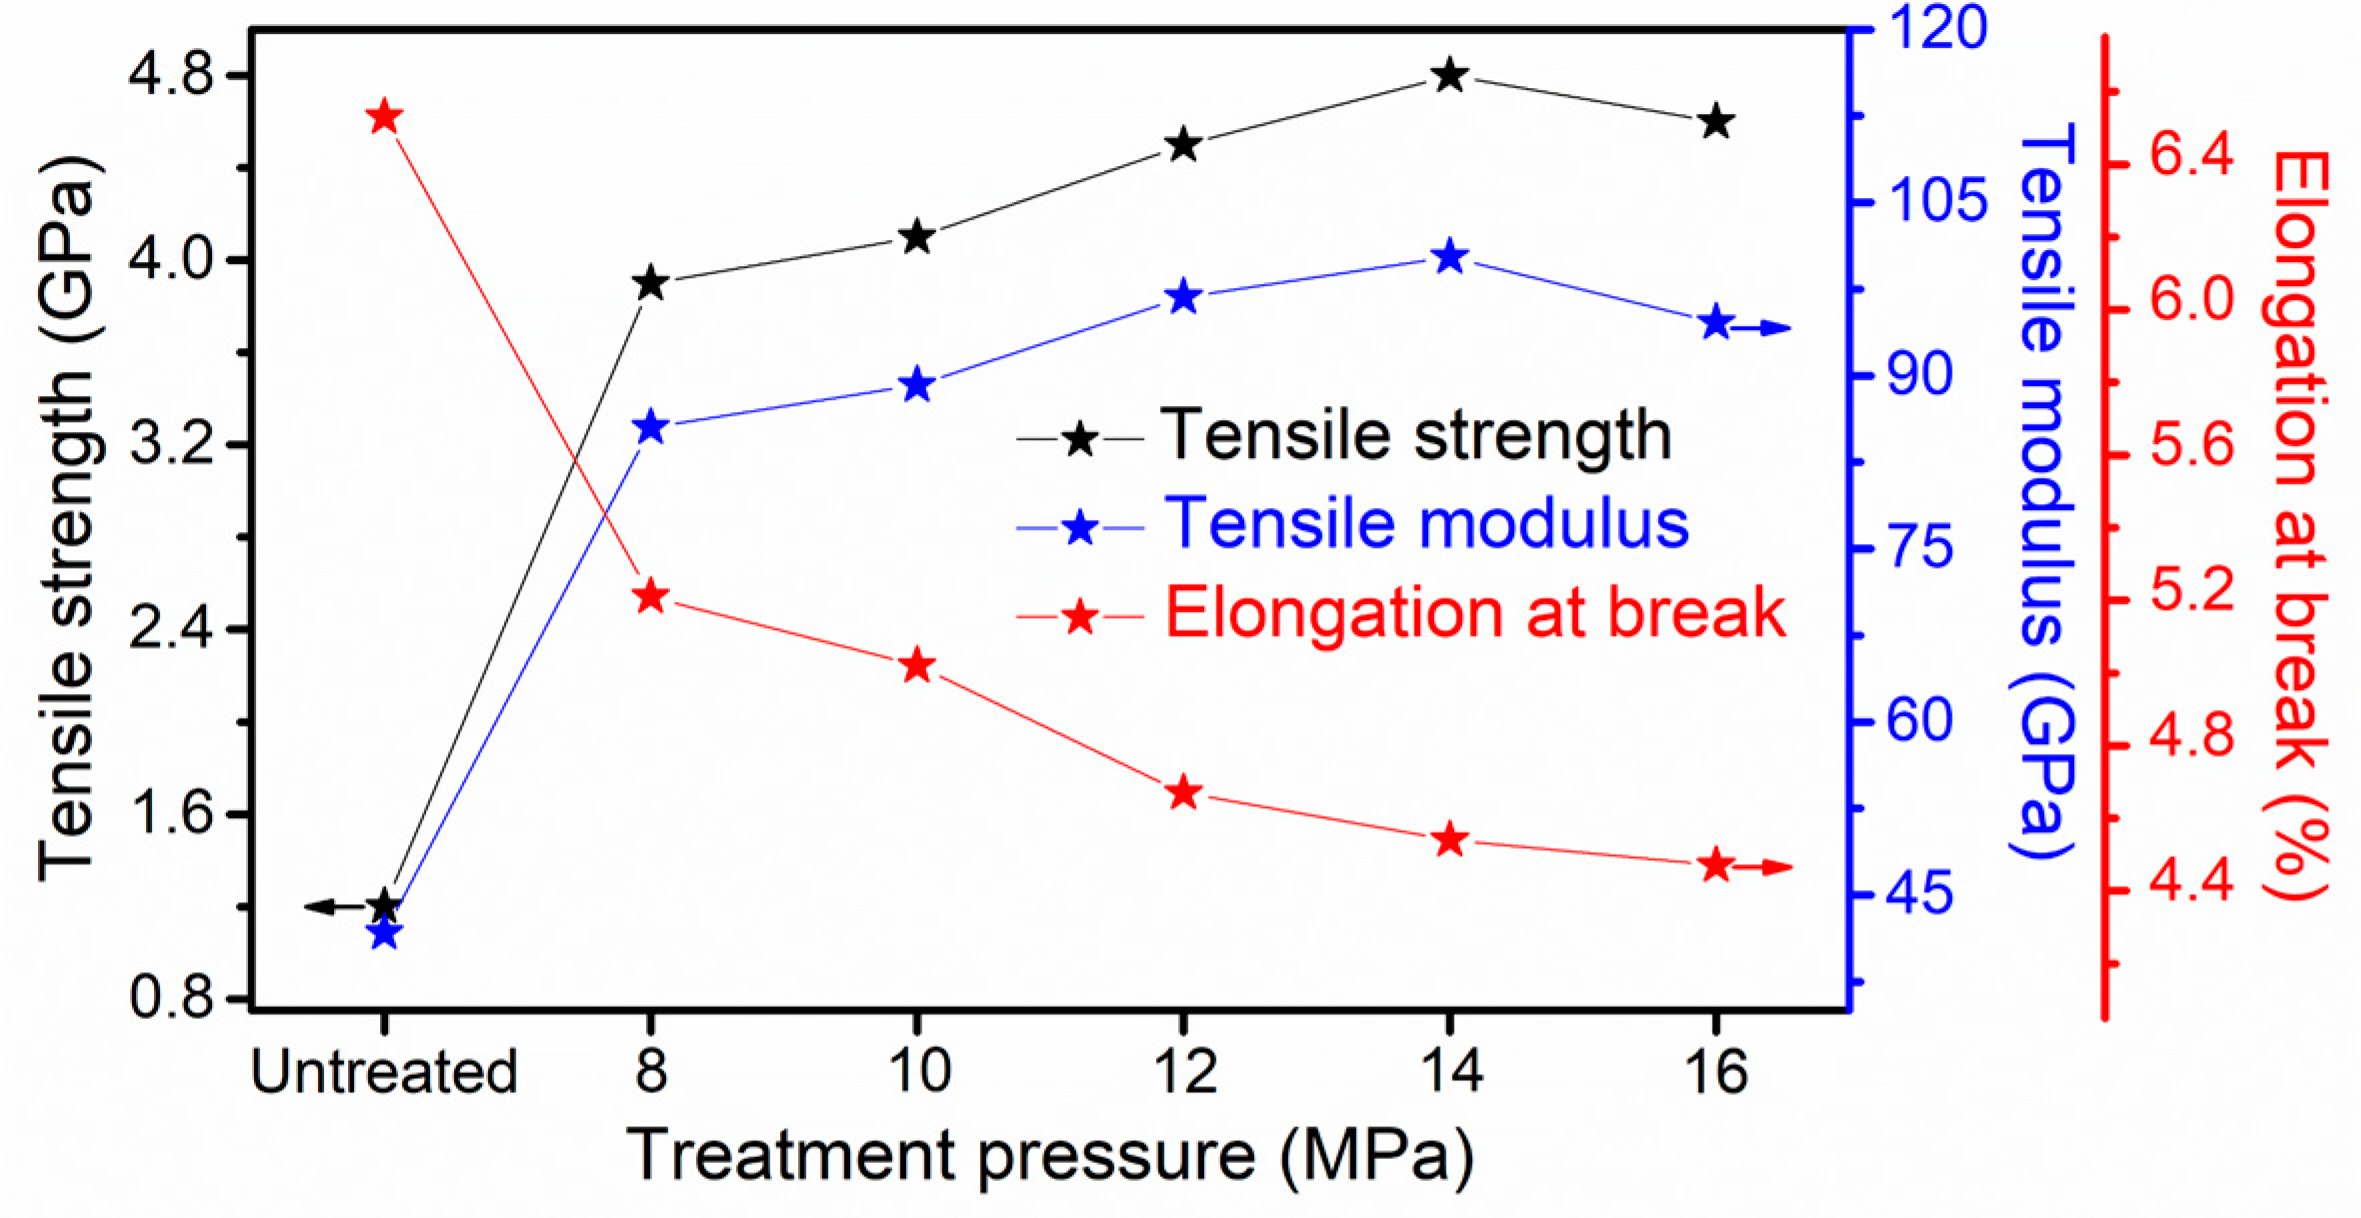
3.3. Mechanical Performance
4. Conclusions
Author Contributions
Funding
Acknowledgments
Conflicts of Interest
References
- García, J.M.; García, F.C.; Serna, F.; Peña, J.L.D.L. High-performance aromatic polyamides. Prog. Polym. Sci. 2010, 35, 623–686. [Google Scholar] [CrossRef]
- Young, R.J.; Lu, D.; Day, R.J.; Knoff, W.F.; Davis, H.A. Relationship between structure and mechanical properties for aramid fibres. J. Mater. Sci. 1992, 27, 5431–5440. [Google Scholar] [CrossRef]
- Zheng, Y.; Ying, S.; Li, J.; Liu, L.; Li, C.; Liu, J.; Tian, S. Tensile response of carbon-aramid hybrid 3d braided composites. Mater. Des. 2017, 116, 246–252. [Google Scholar] [CrossRef]
- Chen, X.; Wang, W.; Jiao, C. A recycled environmental friendly flame retardant by modifying para-aramid fiber with phosphorus acid for thermoplastic polyurethane elastomer. J. Hazard. Mater. 2017, 331, 257–264. [Google Scholar] [CrossRef] [PubMed]
- Uppal, R.; Ramaswamy, G.N.; Loughin, T. A novel method to assess degree of crystallinity of aramid filament yarns. J. Ind. Text. 2013, 43, 3–19. [Google Scholar] [CrossRef]
- Wu, Z.; Zhang, A.; Cheng, S.Z.D.; Bing, H.; Qian, B. Changes in crystal structure parameters and thermal mechanical properties of poly(p-phenylene terephthalamide) fibers under different annealing conditions. J. Polym. Sci. Part B Polym. Phys. 1990, 28, 2565–2583. [Google Scholar] [CrossRef]
- Lee, K.G.; Barton, R., Jr.; Schultz, J.M. Structure and property development in poly(p-phenylene terephthalamide) during heat treatment under tension. J. Polym. Sci. Part B Polym. Phys. 1995, 33, 1–14. [Google Scholar] [CrossRef]
- Rao, Y.; Waddon, A.J.; Farris, R.J. Structure-property relation in poly(p-phenylene terephthalamide) (ppta) fibers. Polymer 2001, 42, 5937–5946. [Google Scholar] [CrossRef]
- Tsobkallo, E.S.; Kvaratskheliya, V.A.; Shen, J.; Wyatt, J. The influence of temperature on the tensile properties and residual strain following stress-relaxation processes of armos and terlon aramid yarns. J. Text. Inst. Proc. Abstr. 2004, 95, 121–130. [Google Scholar] [CrossRef]
- Rao, Y.; Waddon, A.J.; Farris, R.J. The evolution of structure and properties in poly(p-phenylene terephthalamide) fibers. Polymer 2001, 42, 5925–5935. [Google Scholar] [CrossRef]
- Hindeleh, A.M.; Abdo, S.M. Effects of annealing on the crystallinity and microparacrystallite size of kevlar 49 fibres. Polymer 1989, 30, 218–224. [Google Scholar] [CrossRef]
- Northolt, M.G. X-ray diffraction study of poly(p-phenylene terephthalamide) fibres. Eur. Polym. J. 1974, 10, 799–804. [Google Scholar] [CrossRef]
- Wu, T.M.; Blackwell, J. Comparison of the axial correlation lengths and paracrystalline distortion for technora and kevlar aromatic polyamide fibers. Macromolecules 1996, 29, 5621–5627. [Google Scholar] [CrossRef]
- Riekel, C.; Cedola, A.; Heidelbach, F.; Wagner, K. Microdiffraction experiments on single polymeric fibers by synchrotron radiation. Macromolecules 1997, 30, 1033–1037. [Google Scholar] [CrossRef]
- Brennecke, J.F. Solvents: Molecular trees for green chemistry. Nature 1997, 389, 333–334. [Google Scholar] [CrossRef]
- Belov, N.A.; Alentiev, A.Y.; Ronova, I.A.; Sinitsyna, O.V.; Nikolaev, A.Y.; Zharov, A.A. Microstructure relaxation process of polyhexafluoropropylene after swelling in supercritical carbon dioxide. J. Appl. Polym. Sci. 2016, 133, 43105. [Google Scholar] [CrossRef]
- Wu, R.; Nie, X.; Du, J.; Liu, H.; Xu, S. Preparation of amphoteric nanocomposite hydrogel under supercritical carbon dioxide and its fast-swelling behaviours. Int. J. Nanotechnol. 2017, 14, 457–469. [Google Scholar] [CrossRef]
- Lu, Y.; Xiang, A.; Tang, J.; Jia, Y.; Zhang, X.; Chen, Y. Swelling of shale in supercritical carbon dioxide. J. Nat. Gas Sci. Eng. 2016, 30, 268–275. [Google Scholar] [CrossRef]
- Kong, H.; Teng, C.; Liu, X.; Zhou, J.; Zhong, H.; Yue, Z.; Han, K.; Yu, M. Simultaneously improving the tensile strength and modulus of aramid fiber by enhancing amorphous phase in supercritical carbon dioxide. RSC Adv. 2014, 4, 20599–20604. [Google Scholar] [CrossRef]
- Bertuol, D.A.; Machado, C.M.; Silva, M.L.; Calgaro, C.O.; Dotto, G.L.; Tanabe, E.H. Recovery of cobalt from spent lithium-ion batteries using supercritical carbon dioxide extraction. Waste Manag. 2016, 51, 245–251. [Google Scholar] [CrossRef] [PubMed]
- Benito-Román, O.; Rodríguez-Perrino, M.; Sanz, M.T.; Melgosa, R.; Beltrán, S. Supercritical carbon dioxide extraction of quinoa oil: Study of the influence of process parameters on the extraction yield and oil quality. J. Supercrit. Fluids 2018, 139, 62–71. [Google Scholar] [CrossRef]
- Hobbs, T.; Lesser, A.J. Preparation of high performance poly(ethylene terephthalate) fibers: Two-stage drawing using high pressure CO2. Polymer 2000, 41, 6223–6230. [Google Scholar] [CrossRef]
- Hobbs, T.; Lesser, A.J. Two-stage drawing of poly(ethylene terephthalate) fibers using CO2. ACS Symp. 2000, 766, 111–123. [Google Scholar]
- Hobbs, T.; Lesser, A.J. Drawing of nylon-6,6 in high-pressure carbon dioxide. Abstr. Pap. Am. Chem. Soc. 2000, 219, U473. [Google Scholar]
- Asai, S.; Shimada, Y.; Tominaga, Y.; Sumita, M. Characterization of higher-order structure of poly(ethylene-2,6-naphthalate) treated with supercritical carbon dioxide. Macromolecules 2005, 38, 6544–6550. [Google Scholar] [CrossRef]
- Gupta, V.B.; Kumar, S. The effect of heat setting on the structure and mechanical properties of poly(ethylene terephthalate) fiber. I. Structural changes. J. Appl. Polym. Sci. 2010, 26, 1865–1876. [Google Scholar] [CrossRef]
- Yu, J.; Rui, W.; Yang, C.; Chen, S.; Feng, T.; Wang, H.; Zhang, Y. Morphology and structure changes of aromatic copolysulfonamide fibers heat-drawn at various temperatures. Polym. Int. 2015, 63, 2084–2090. [Google Scholar] [CrossRef]
- Templeton, D.H. Small-angle scattering of X-rays. J. Chem. Educ. 1956, 33, A514. [Google Scholar] [CrossRef]
- Ruland, W. 133. The relationship between preferred orientation and elasticity of carbon fibers. Carbon 1969, 7, 729. [Google Scholar] [CrossRef]
- Ma, W.; Andersson, A.; He, J.; Maurer, F.H.J. Free volume changes, crystallization, and crystal transition behavior of syndiotactic polystyrene in supercritical CO2 revealed by positron annihilation lifetime spectroscopy. Macromolecules 2008, 41, 5307–5312. [Google Scholar] [CrossRef]
- Kikic, I.; Vecchione, F.; Alessi, P.; Cortesi, A.; Eva, F.; Elvassore, N. Polymer plasticization using supercritical carbon dioxide: Experiment and modeling. Ind. Eng. Chem. Res. 2003, 42, 3022–3029. [Google Scholar] [CrossRef]
- Tarabasz, K.; Krzysztoforski, J.; Szwast, M.; Henczka, M. Investigation of the effect of treatment with supercritical carbon dioxide on structure and properties of polypropylene microfiltration membranes. Mater. Lett. 2016, 163, 54–57. [Google Scholar] [CrossRef]
- Walker, T.A.; Raghavan, S.R.; Royer, J.R.; Smith, S.D.; Wignall, G.D.; Melnichenko, Y.; Khan, S.A.; Spontak, R.J. Enhanced miscibility of low-molecular-weight polystyrene/polyisoprene blends in supercritical CO2. J. Phys. Chem. B 1999, 103, 5472–5476. [Google Scholar] [CrossRef]
- Gurina, D.L.; Antipova, M.L.; Odintsova, E.G.; Petrenko, V.E. Selective solvation in cosolvent-modified supercritical carbon dioxide on the example of hydroxycinnamic acids. The role of cosolvent self-association. J. Supercrit. Fluids 2018, 139, 19–29. [Google Scholar] [CrossRef]
- Gurina, D.L.; Antipova, M.L.; Odintsova, E.G.; Petrenko, V.E. The study of peculiarities of parabens solvation in methanol- and acetone-modified supercritical carbon dioxide by computer simulation. J. Supercrit. Fluids 2017, 126, 47–54. [Google Scholar] [CrossRef]
- Lan, Q.; Jian, Y.; Zhang, J.; He, J. Enhanced crystallization of bisphenol a polycarbonate in thin and ultrathin films by supercritical carbon dioxide. Macromolecules 2011, 44, 5743–5749. [Google Scholar] [CrossRef]
- Zhang, Z.; Handa, Y.P. CO2 assisted melting of semicrystalline polymers. Macromolecules 1997, 30, 8505–8507. [Google Scholar] [CrossRef]
- Luo, L.; Wang, Y.; Dai, Y.; Yuan, Y.; Meng, C.; Cheng, Z.; Wang, X.; Liu, X. The introduction of asymmetric heterocyclic units into poly(p-phenylene terephthalamide) and its effect on microstructure, interactions and properties. J. Mater. Sci. 2018, 53, 13291–13303. [Google Scholar] [CrossRef]
- Luo, L.; Wang, Y.; Huang, J.; Hong, D.; Wang, X.; Liu, X. Pre-drawing induced evolution of phase, microstructure and property in para-aramid fibres containing benzimidazole moiety. RSC Adv. 2016, 6, 62695–62704. [Google Scholar] [CrossRef]
- Lotz, B.; Wittmann, J.C. The molecular origin of lamellar branching in the α (monoclinic) form of isotactic polypropylene. J. Polym. Sci. Part B Polym. Phys. 1986, 24, 1541–1558. [Google Scholar] [CrossRef]
- Lotz, B.; Wittmann, J.C.; Lovinger, A.J. Structure and morphology of poly(propylenes): A molecular analysis. Polymer 1996, 37, 4979–4992. [Google Scholar] [CrossRef]
- Lipp, J.; Shuster, M.; Feldman, G.; Cohen, Y. Oriented crystallization in polypropylene fibers induced by a sorbitol-based nucleator. Macromolecules 2008, 41, 136–140. [Google Scholar] [CrossRef]
- Grubb, D.T.; Prasad, K.; Adams, W. Small-angle X-ray diffraction of kevlar using synchrotron radiation. Polymer 1991, 32, 1167–1172. [Google Scholar] [CrossRef]
- Grubb, D.T.; Prasad, K. High-modulus polyethylene fiber structure as shown by X-ray diffraction. Macromolecules 1992, 25, 4575–4582. [Google Scholar] [CrossRef]
- Jiang, G.; Huang, W.; Li, L.; Wang, X.; Pang, F.; Zhang, Y.; Wang, H. Structure and properties of regenerated cellulose fibers from different technology processes. Carbohydr. Polym. 2012, 87, 2012–2018. [Google Scholar] [CrossRef]


© 2019 by the authors. Licensee MDPI, Basel, Switzerland. This article is an open access article distributed under the terms and conditions of the Creative Commons Attribution (CC BY) license (http://creativecommons.org/licenses/by/4.0/).
Share and Cite
Ding, X.; Kong, H.; Qiao, M.; Hu, Z.; Yu, M. Effect of Different Pressures on Microstructure and Mechanical Performance of F-III Fibers in Supercritical Carbon Dioxide Fluid. Materials 2019, 12, 690. https://doi.org/10.3390/ma12050690
Ding X, Kong H, Qiao M, Hu Z, Yu M. Effect of Different Pressures on Microstructure and Mechanical Performance of F-III Fibers in Supercritical Carbon Dioxide Fluid. Materials. 2019; 12(5):690. https://doi.org/10.3390/ma12050690
Chicago/Turabian StyleDing, Xiaoma, Haijuan Kong, Mengmeng Qiao, Zhifeng Hu, and Muhuo Yu. 2019. "Effect of Different Pressures on Microstructure and Mechanical Performance of F-III Fibers in Supercritical Carbon Dioxide Fluid" Materials 12, no. 5: 690. https://doi.org/10.3390/ma12050690
APA StyleDing, X., Kong, H., Qiao, M., Hu, Z., & Yu, M. (2019). Effect of Different Pressures on Microstructure and Mechanical Performance of F-III Fibers in Supercritical Carbon Dioxide Fluid. Materials, 12(5), 690. https://doi.org/10.3390/ma12050690