Dielectric and Impedance Studies of (Ba,Ca)TiO3 Ceramics Obtained from Mechanically Synthesized Powders


 ,
, 

Abstract
1. Introduction
2. Materials and Methods
3. Results and Discussion
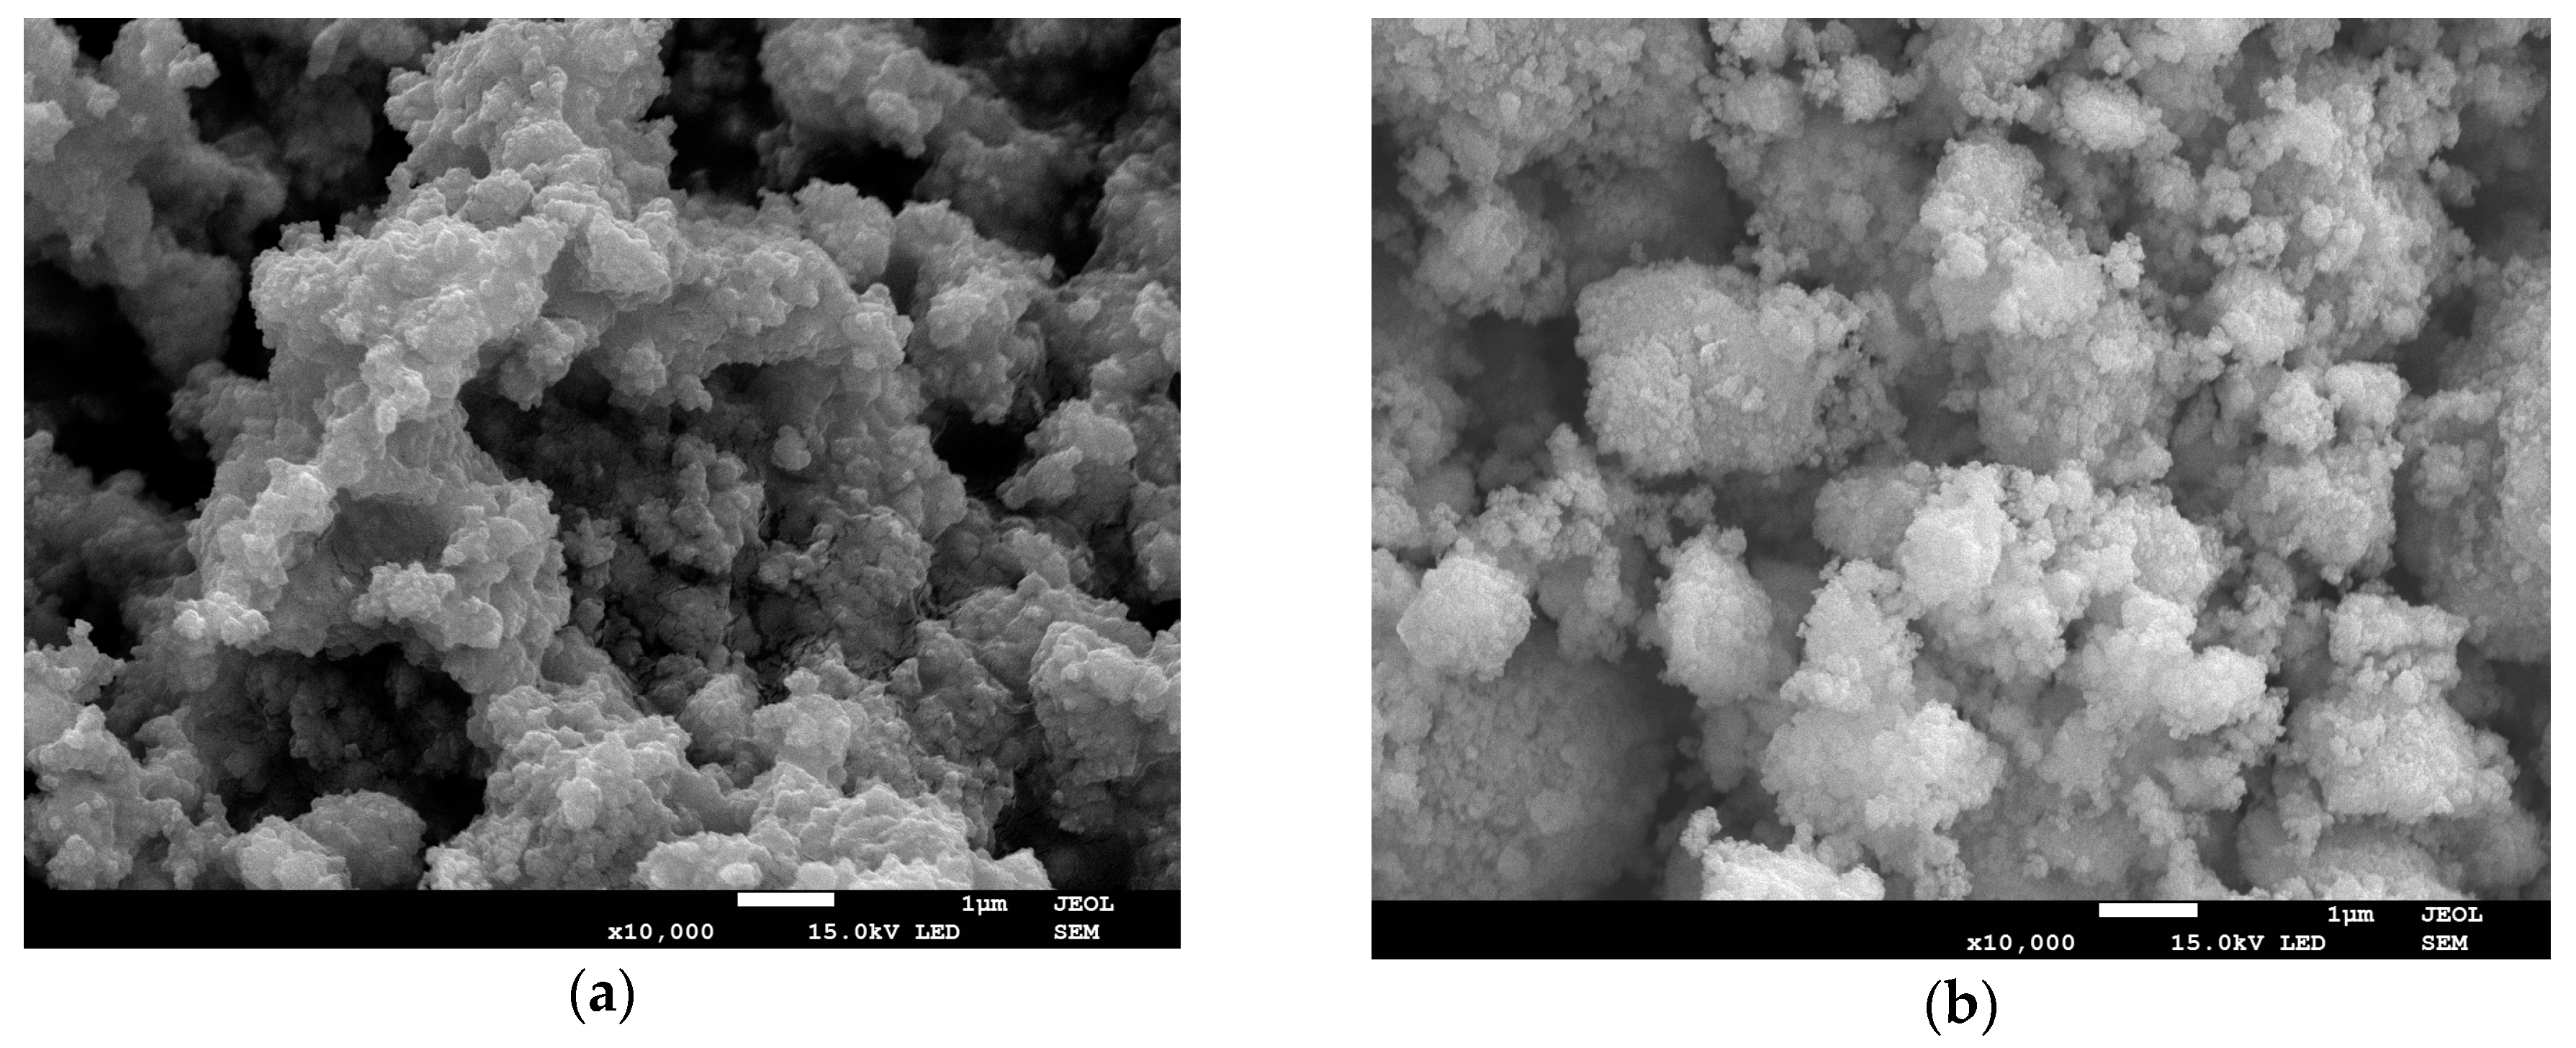
3.1. SEM and EDS
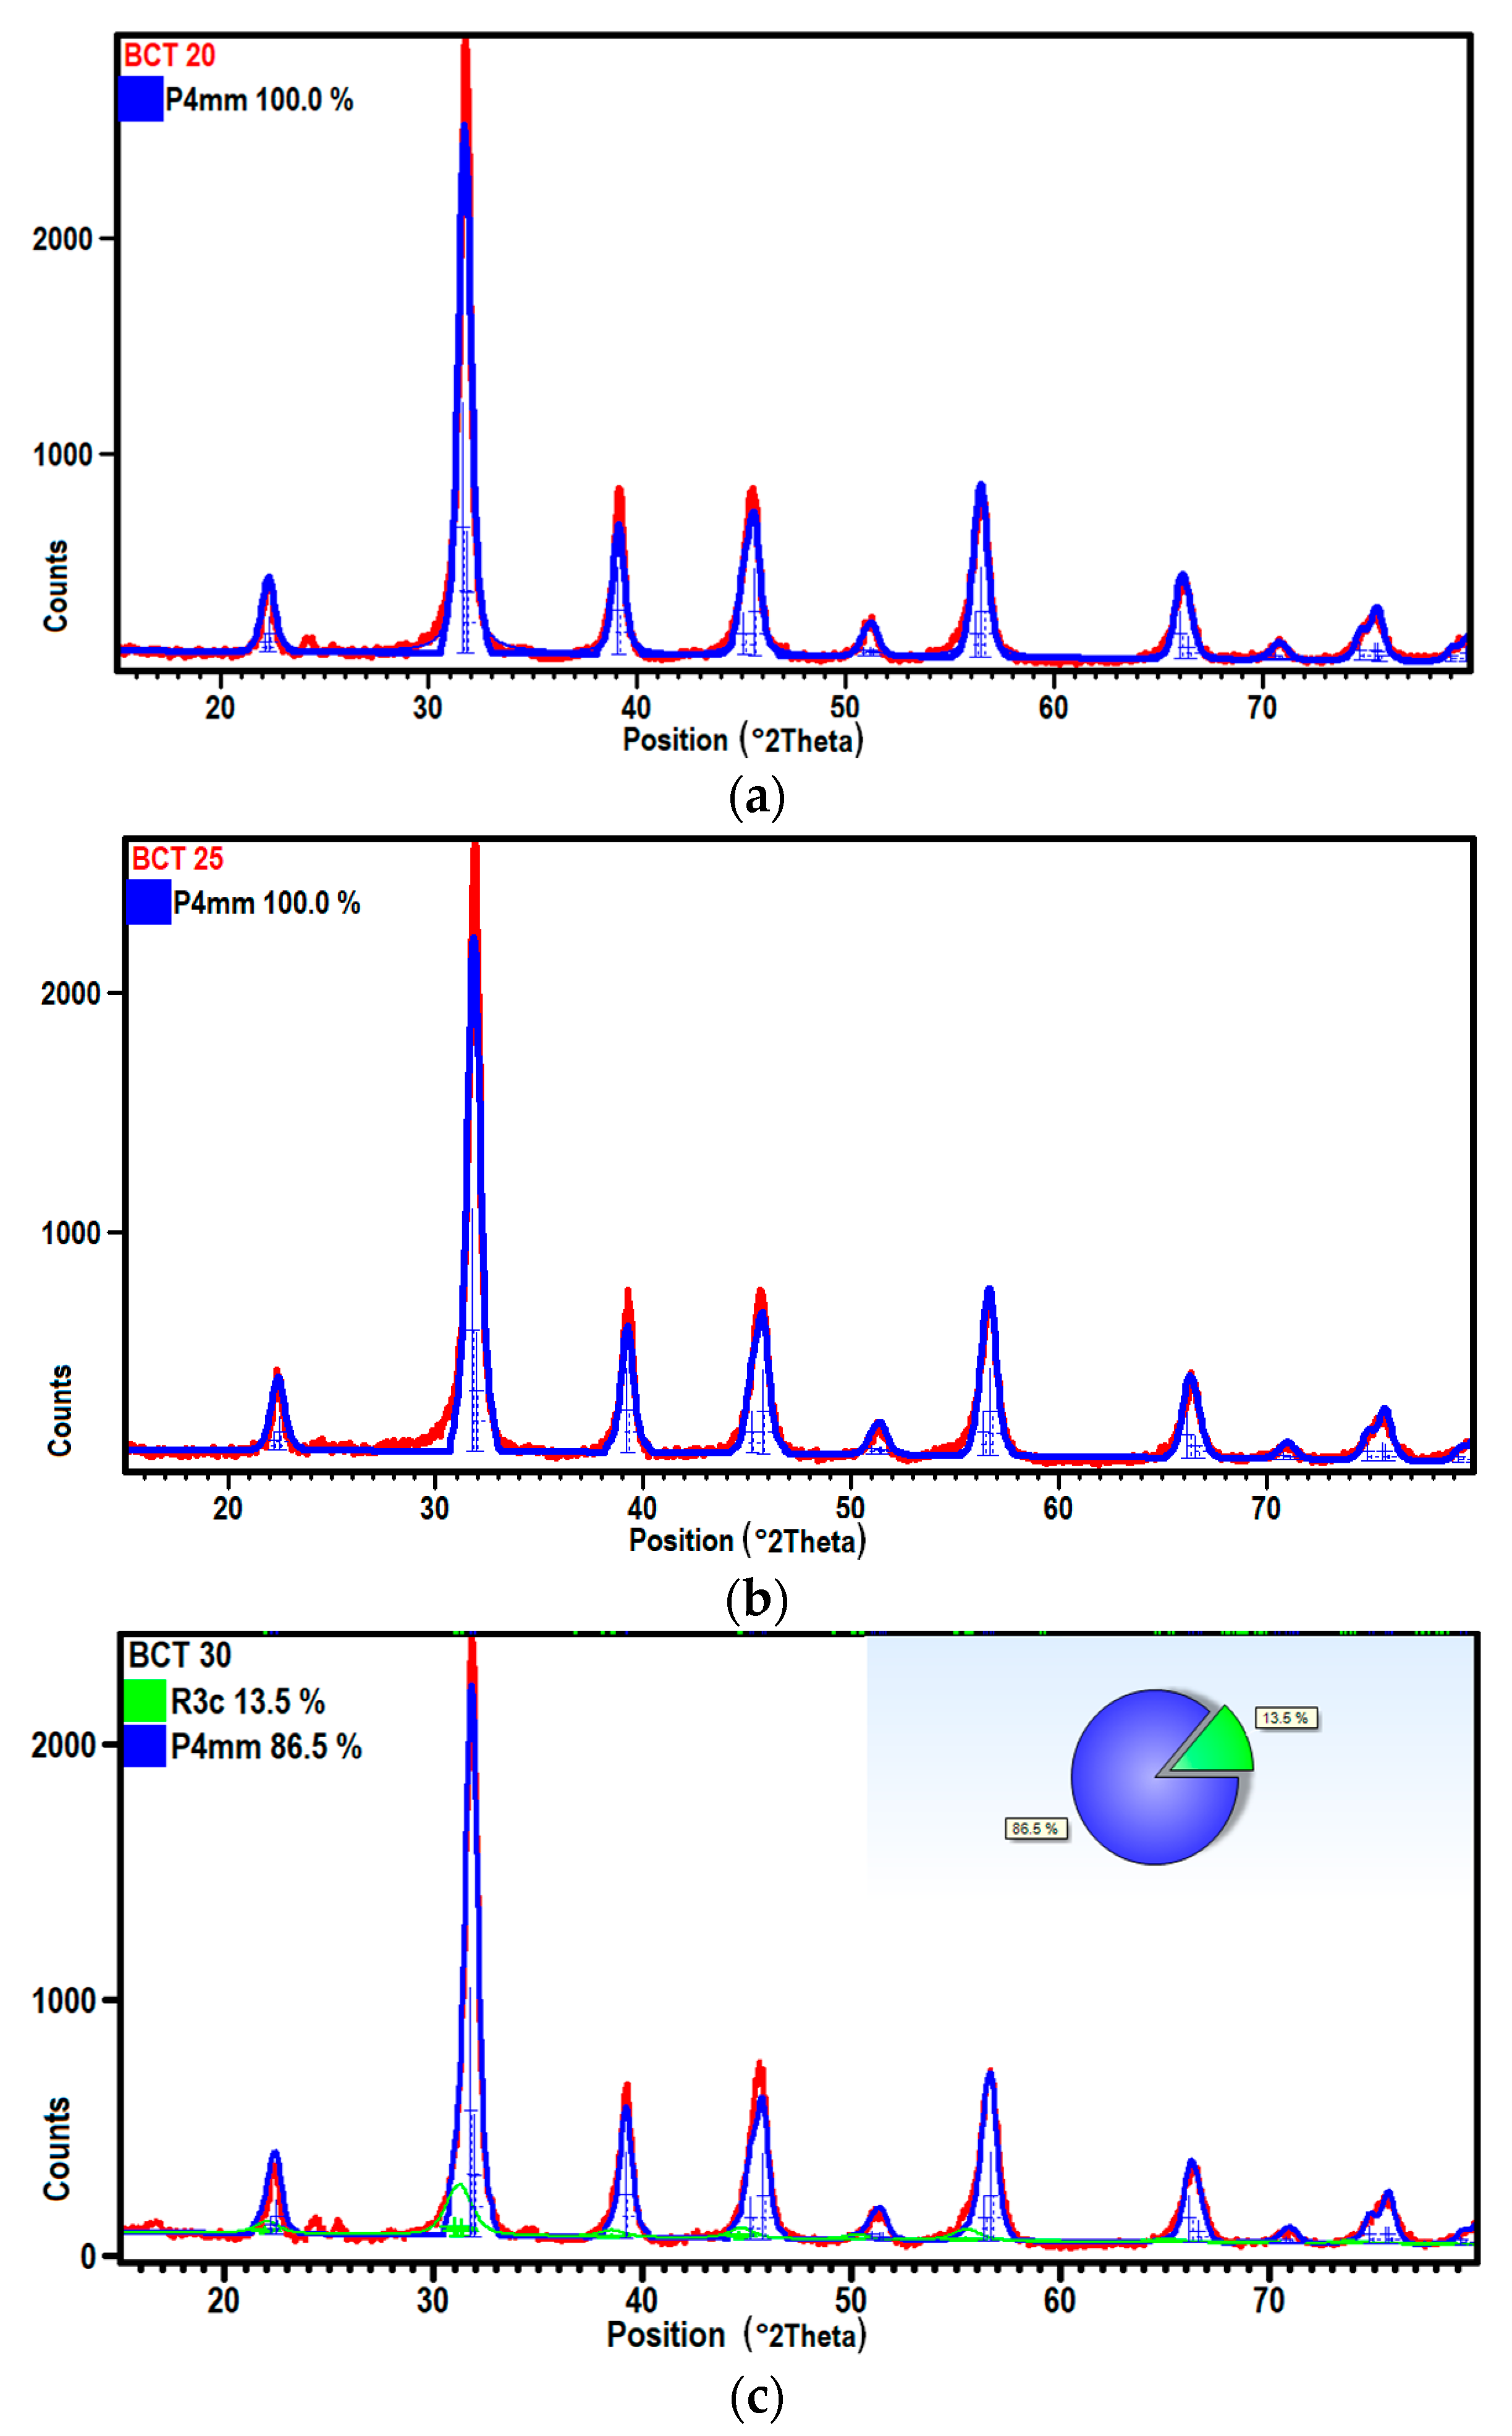
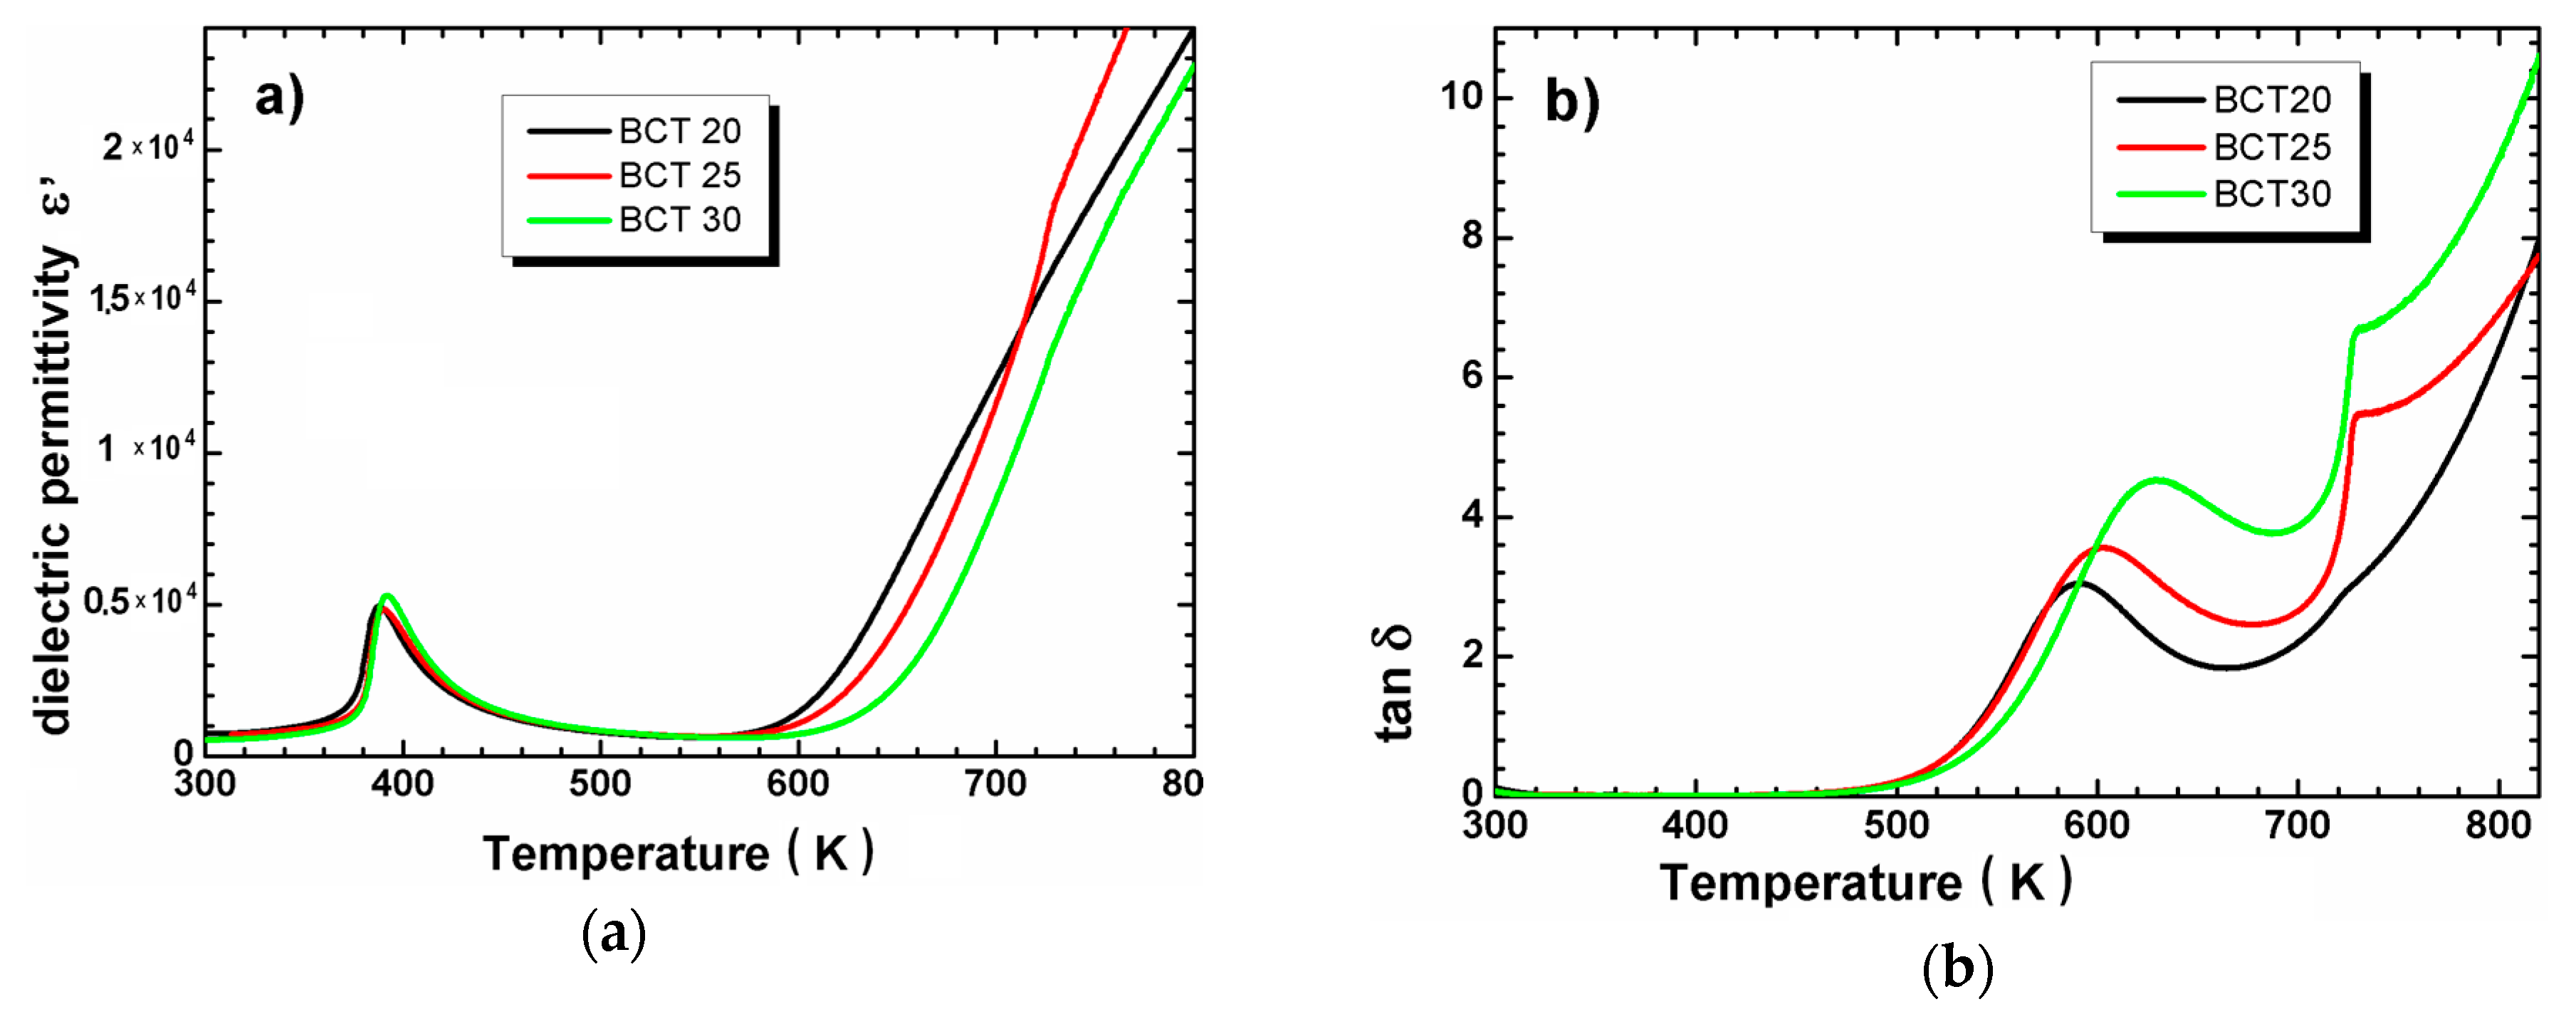
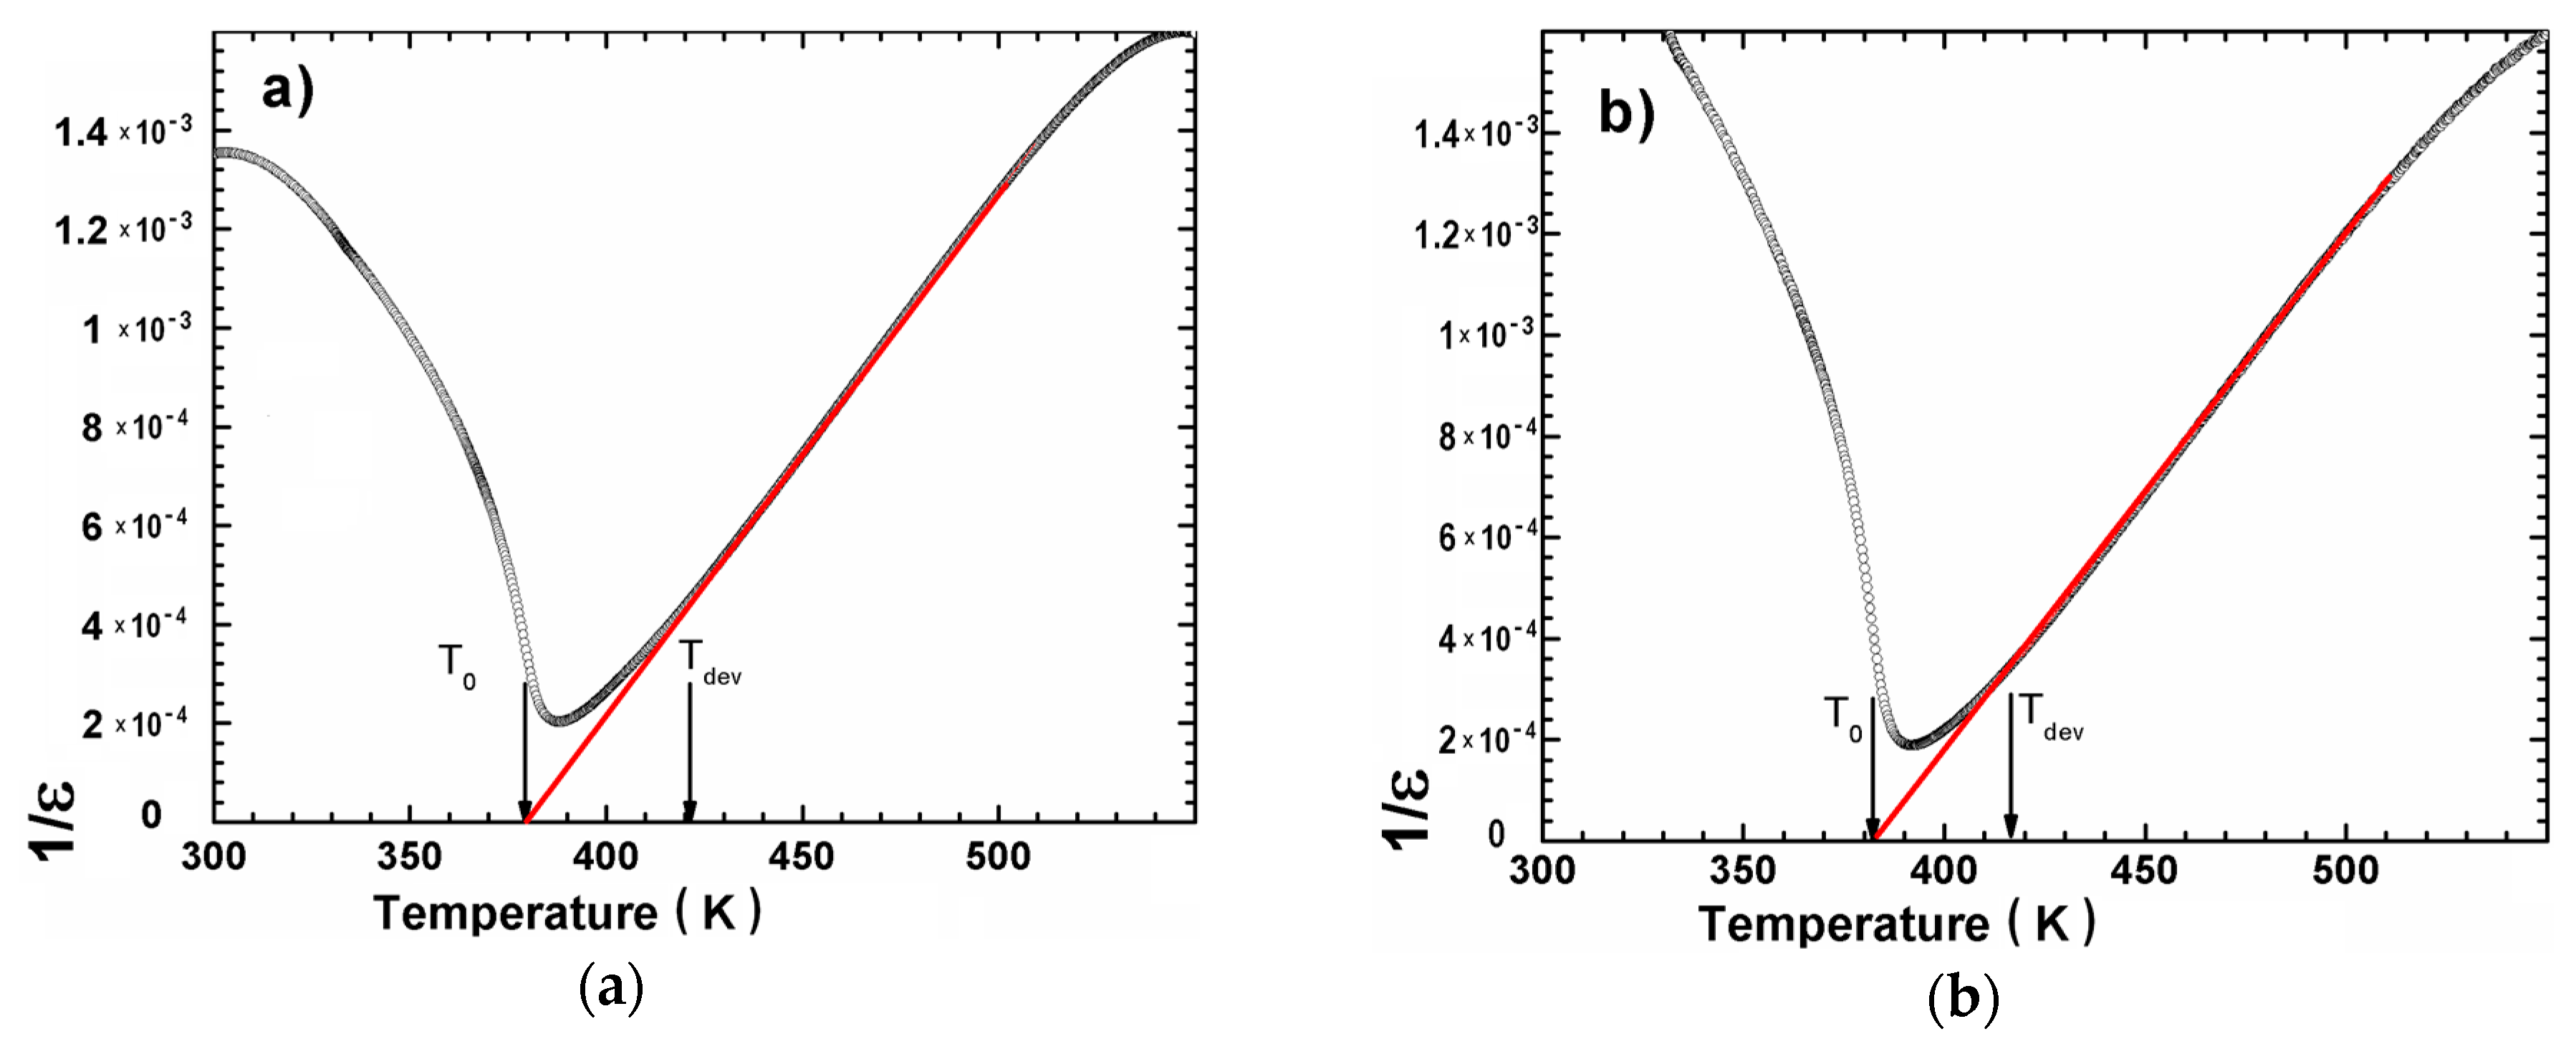
3.2. XRD Measurements and Dielectric Spectroscopy
4. Conclusions
Author Contributions
Funding
Conflicts of Interest
References
- Jayanthi, S.; Kutty, T.R.N. Extended phase homogeneity and electrical properties of barium calcium titanate prepared by the wet chemical methods. Mater. Sci. Eng. B 2004, 110, 202–212. [Google Scholar] [CrossRef]
- Puli, V.S.; Kumar, A.; Chrisey, D.B.; Tomozawa, M.; Scott, J.F.; Katiyar, R.S. Barium zirconate-titanate/barium calcium-titanate ceramics via sol–gel process: Novel high-energy-density capacitors. J. Phys. D Appl. Phys. 2011, 44, 395403–395413. [Google Scholar] [CrossRef]
- Kong, L.B.; Zhang, T.S.; Ma, J.; Boey, F. Progress in Synthesis of Ferroelectric Ceramic Materials via High-Energy Mechanochemical Technique. Prog. Mater. Sci. 2008, 53, 207–322. [Google Scholar] [CrossRef]
- Beyer, M.K.; Clausen-Schaumann, H. Mechanochemistry: The Mechanical Activation of Covalent Bonds. Chem. Rev. 2004, 105, 2921–2948. [Google Scholar] [CrossRef] [PubMed]
- Boldyrev, V.V. Mechanochemistry and mechanical activation of solids. Chem. Rev. 2006, 75, 177–187. [Google Scholar] [CrossRef]
- Liu, W.F.; Ren, X.B. Large Piezoelectric Effect in Pb-Free Ceramics. Phys. Rev. Lett. 2009, 103, 257602–257604. [Google Scholar] [CrossRef]
- Tanaka, D.; Yamazaki, J.; Furukawa, M.; Tsukada, T. High Power Characteristics of (Ca, Ba) TiO3 Piezoelectric Ceramics with High Mechanical Quality Factor. Jpn. J. Appl. Phys. 2010, 49, 09MD03–09MD08. [Google Scholar] [CrossRef]
- Pullar, R.C.; Zhang, Y.; Chen, L.; Yang, S.; Evans, J.R.G.; Salak, A.N.; Kiselev, D.A.; Kholkin, A.L.; Ferreira, V.M.; Alford, N. Dielectric measurements on a novel Ba1−xCaxTiO3 (BCT) bulk ceramic combinatorial library. J. Electroceramics 2009, 22, 245–251. [Google Scholar] [CrossRef]
- Stojanovic, B.D.; Jovalekic, C.; Vukotic, V.; Simoes, A.Z.; Varela, J.A. Ferroelectric Properties of Mechanically Synthesized Nanosized Barium Titanate. Ferroelectrics 2005, 319, 65–73. [Google Scholar] [CrossRef]
- Stojanovic, B.D.; Simoes, A.Z.; Paiva-Santos, C.O.; Jovalekic, C.; Mitic, V.V.; Varela, J.A. Mechanochemical synthesis of barium titanate. J. Eur. Ceram. Soc. 2005, 25, 1985–1989. [Google Scholar] [CrossRef]
- Szafraniak-Wiza, I.; Kozielski, L.; Sebastian, T. Preparation and properties of Ba1-xCaxTiO3 nanopowders obtained by mechanochemical synthesis. Phase Transit. 2016, 89, 803–807. [Google Scholar] [CrossRef]
- Cheng, X.; Shen, M. Different microstructure and dielectric properties of Ba1-xCaxTiO3 ceramics and pulsed-laser-ablated films. Mat. Res. Bull. 2007, 42, 1662–1668. [Google Scholar] [CrossRef]
- Li, L.Y.; Tang, X.G. Effect of electric field on the dielectric properties and ferroelectric phase transition of sol-gel derived (Ba0.99Ca0.10) TiO3 ceramics. Mater. Chem. Phys. 2009, 115, 507–511. [Google Scholar] [CrossRef]
- Victor, P.; Ranjith, R.; Krupanidhi, S.B. Normal ferroelectric to relaxor behavior in laser ablated Ca-doped barium titanate thin films. J. Appl. Phys. 2003, 94, 7702–7709. [Google Scholar] [CrossRef]
- Han, Y.H.; Appleby, J.B.; Smyth, D.M. Calcium as an Acceptor Impurity in BaTiO3. J. Am. Ceram. Soc. 1987, 70, 96–100. [Google Scholar] [CrossRef]
- Zhang, X.W.; Han, Y.H.; Lal, M.; Smyth, D.M. Defect Chemistry of BaTiO3 with Additions of CaTiO3. J. Am. Ceram. Soc. 1987, 70, 100–103. [Google Scholar] [CrossRef]
- Martirena, H.T.; Burfoot, J.C. Grain-size effects on properties of some ferroelectric ceramics. J. Phys. C 1974, 7, 3182–3192. [Google Scholar] [CrossRef]
- Chul Chang, M.Y.; Yu, S.C. Raman study for (Ba1−xCax) TiO3 and Ba(Ti1−yCay) O3 crystalline ceramics. J. Mater. Sci. Lett. 2000, 19, 1323–1325. [Google Scholar] [CrossRef]
- Tiwari, V.S.; Phandey, D.; Krishna, P.S.R.; Chakravarthy, R.; Dasananacharya, B.A. Neutron diffraction study of ferroelectric Ba0.88Ca0.12TiO3. Phys. B Condens. Matter 1991, 174, 112–116. [Google Scholar] [CrossRef]
- Rachna, S.; Gupta, S.M.; Bhattacharyya, S. Impedance analysis of Bi3.25La0.75Ti3O12 ferroelectric ceramic. Indian Acad. Sci. 2008, 71, 599–610. [Google Scholar] [CrossRef]
- Thirumal Reddy, N.; Madhavi, K.; Prasad, N.V.; Kumar, G.S.; Prasad, G. Impedance spectroscopic studies on Zr-modified Bi3.25La0.75Ti3O12ceramics. Int. J. Res. Eng. Technol. 2015, 4, 397–401. [Google Scholar] [CrossRef]
- Kim, J.S.; Choi, B.C.; Chung, J.W.; Jeong, J.H. Low-Frequency Dielectric Property and Impedance Spectroscopy of Bismuth-Lanthanum-Titanate Ceramics with NbDoping. J. Korean Phys. Soc. 2008, 52, 410–414. [Google Scholar] [CrossRef]
- Jaffe, B. Piezoelectric Ceramics. J. Am. Ceram. Soc. 1958, 41, 494–498. [Google Scholar] [CrossRef]
- Rani, J.; Yadav, K.L.; Prakash, S. Structural, dielectric and optical properties of sol–gel synthesized 0.55Ba(Zr0.2Ti0.8) O3–0.45(Ba0.7Ca0.3) TiO3ceramic. Appl. Phys. A 2014, 117, 1131–1137. [Google Scholar] [CrossRef]
- Hungria, T.; Alguero, M.; Ana Hungrıa, B.; Castro, A. Dense, Fine-Grained Ba1-xSrxTiO3 Ceramics Prepared by the Combination of Mechanosynthesized Nanopowders and Spark Plasma Sintering. Chem. Mater. 2005, 17, 6205–6212. [Google Scholar] [CrossRef]


| Sample | Tsd (°C) | Tmd (°C) | Shrinkage (%) | Relative Density (%) |
|---|---|---|---|---|
| BCT20 | 1135 | 1358 | 14.12 | 0.98 |
| BCT25 | 1127 | 1377 | 13.84 | 0.97 |
| BCT30 | 1113 | 1379 | 13.55 | 0.95 |
| Ceramics | Ba (%) | Ca (%) | Ti (%) | Ba + Ca/Ti |
|---|---|---|---|---|
| BCT20 | 39 | 10 | 51 | 0.96 |
| BCT25 | 38 | 13 | 49 | 1.04 |
| BCT30 | 37 | 15 | 48 | 1.08 |
| Parameter | Unit | BCT20 | BCT25 | BCT30 |
|---|---|---|---|---|
| Density calculated (XRD) | (g/cm3) | 5.7612 | 5.7899 | 8.001 |
| Tetragonality (c/a) | (−) | 1.0106 | 1.0111 | 1.0118 |
| Lattice parameter a | (Å) | 3.9827(9) | 3.9756(9) | 3.977(1) |
| Lattice parameter b | (Å) | 3.9827(9) | 3.9756(9) | 3.977(1) |
| Lattice parameter c | (Å) | 4.025(1) | 4.020(1) | 4.024(2) |
| Unit cell volume V | (106 pm3) | 63.8 | 63.5 | 63.6 |
| Space group | (−) | P4 mm | P4 mm | P4 mm |
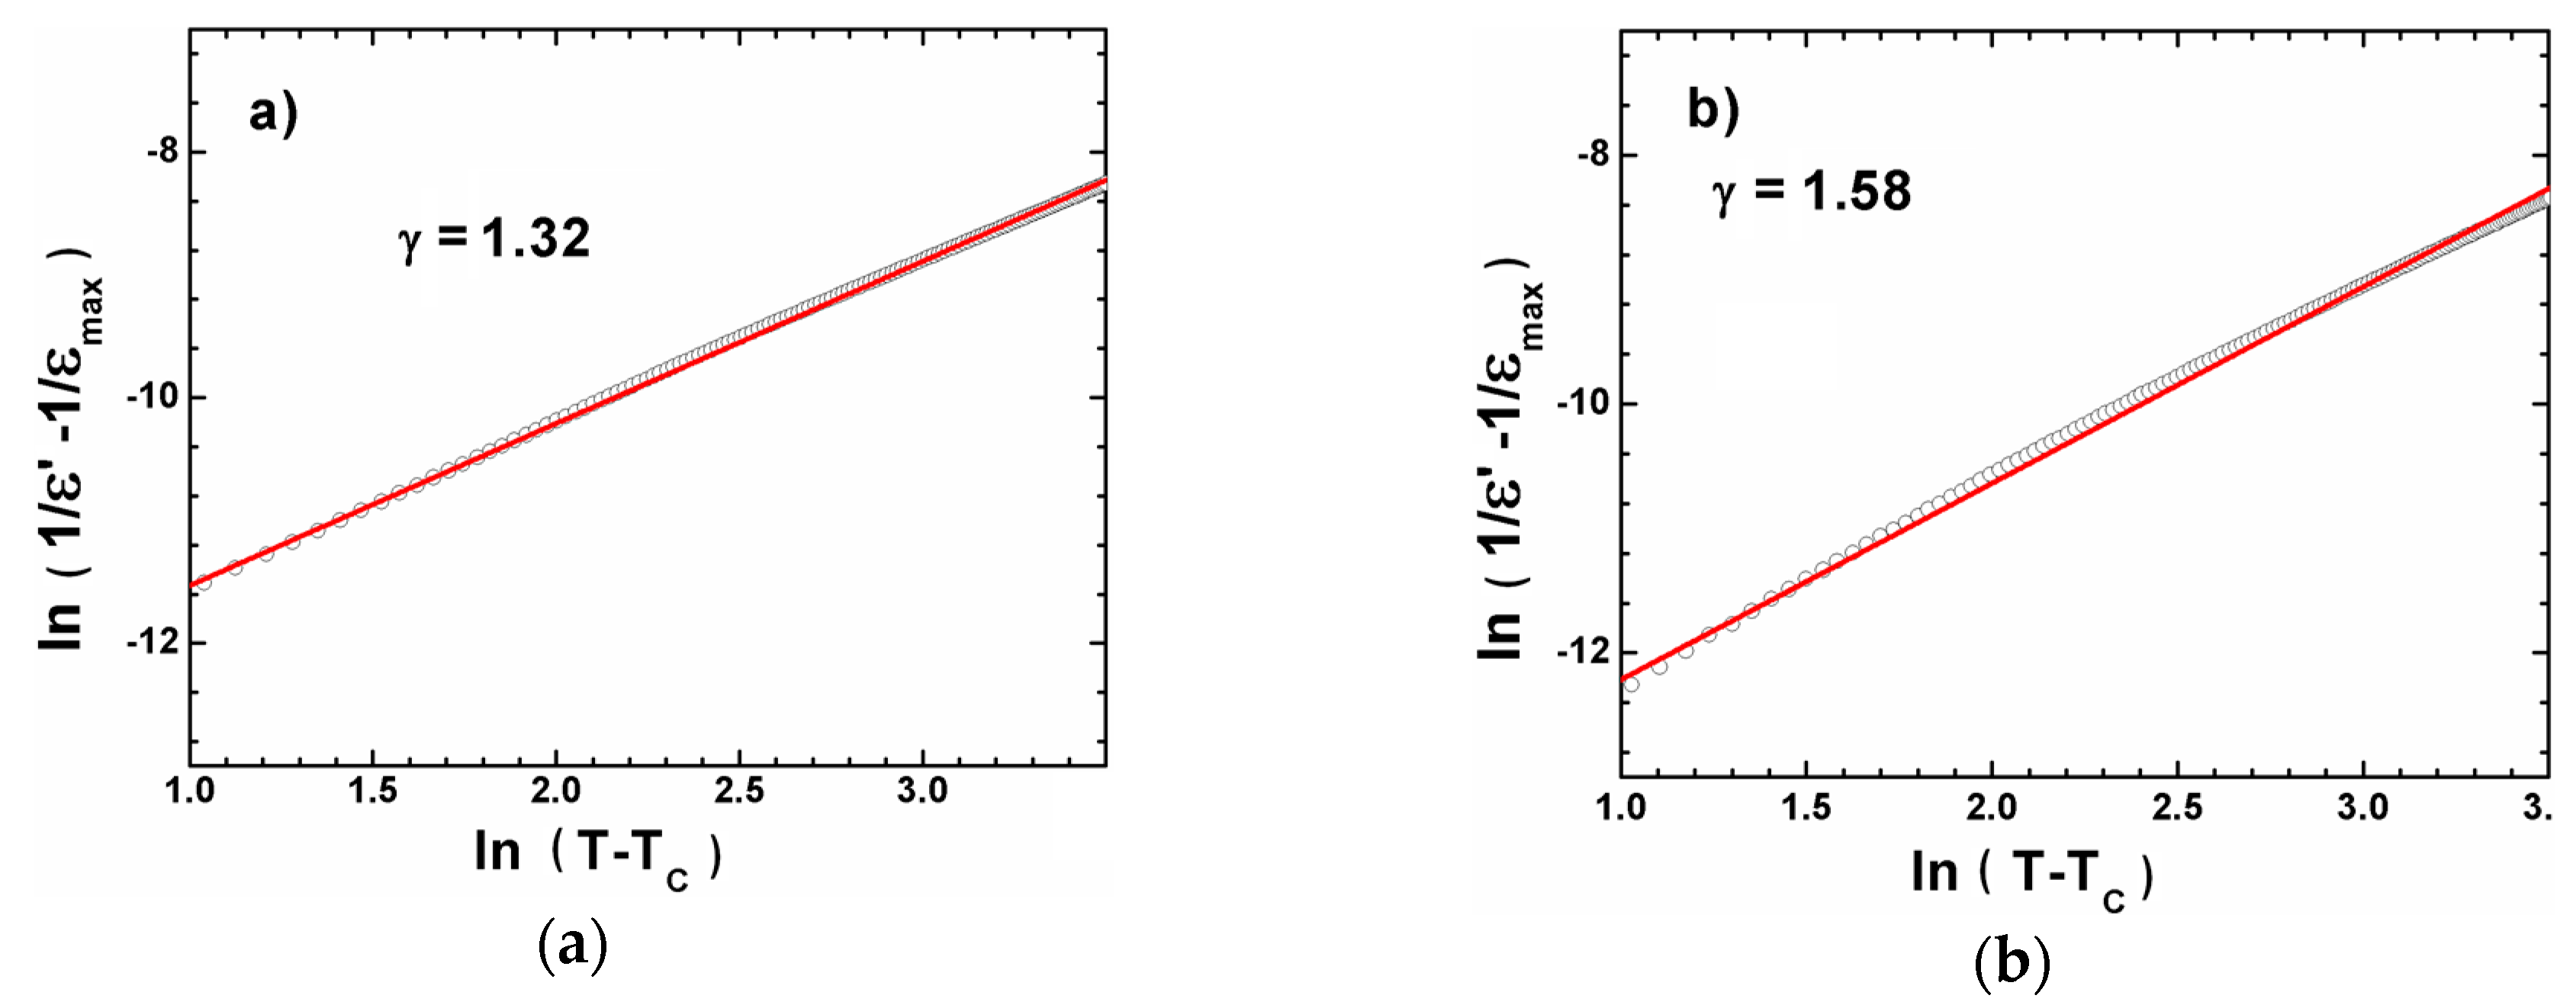
| Ceramics | TC (K) | ε′max | Tdev (K) | C × 105 (K) | ΔT (K) | T0 (K) | γ | TC (K) |
|---|---|---|---|---|---|---|---|---|
| BCT 20 | 388 | 4936 | 424 | 0.95 | 36 | 379 | 1.32 | 388 |
| BCT 25 | 390 | 4833 | 420 | 1.00 | 30 | 380 | 1.39 | 390 |
| BCT 30 | 392 | 5299 | 419 | 0.96 | 27 | 384 | 1.58 | 392 |
© 2019 by the authors. Licensee MDPI, Basel, Switzerland. This article is an open access article distributed under the terms and conditions of the Creative Commons Attribution (CC BY) license (http://creativecommons.org/licenses/by/4.0/).
Share and Cite
Feliksik, K.; Kozielski, L.; Szafraniak-Wiza, I.; Goryczka, T.; Adamczyk-Habrajska, M. Dielectric and Impedance Studies of (Ba,Ca)TiO3 Ceramics Obtained from Mechanically Synthesized Powders. Materials 2019, 12, 4036. https://doi.org/10.3390/ma12244036
Feliksik K, Kozielski L, Szafraniak-Wiza I, Goryczka T, Adamczyk-Habrajska M. Dielectric and Impedance Studies of (Ba,Ca)TiO3 Ceramics Obtained from Mechanically Synthesized Powders. Materials. 2019; 12(24):4036. https://doi.org/10.3390/ma12244036
Chicago/Turabian StyleFeliksik, Kamil, Lucjan Kozielski, Izabela Szafraniak-Wiza, Tomasz Goryczka, and Małgorzata Adamczyk-Habrajska. 2019. "Dielectric and Impedance Studies of (Ba,Ca)TiO3 Ceramics Obtained from Mechanically Synthesized Powders" Materials 12, no. 24: 4036. https://doi.org/10.3390/ma12244036
APA StyleFeliksik, K., Kozielski, L., Szafraniak-Wiza, I., Goryczka, T., & Adamczyk-Habrajska, M. (2019). Dielectric and Impedance Studies of (Ba,Ca)TiO3 Ceramics Obtained from Mechanically Synthesized Powders. Materials, 12(24), 4036. https://doi.org/10.3390/ma12244036