Corrosion Features of the Reinforcing Bar in Concrete with Intelligent OH− Regulation of Microcapsules

Abstract
1. Introduction
2. Materials and Methods
2.1. Microcapsule Fabrication
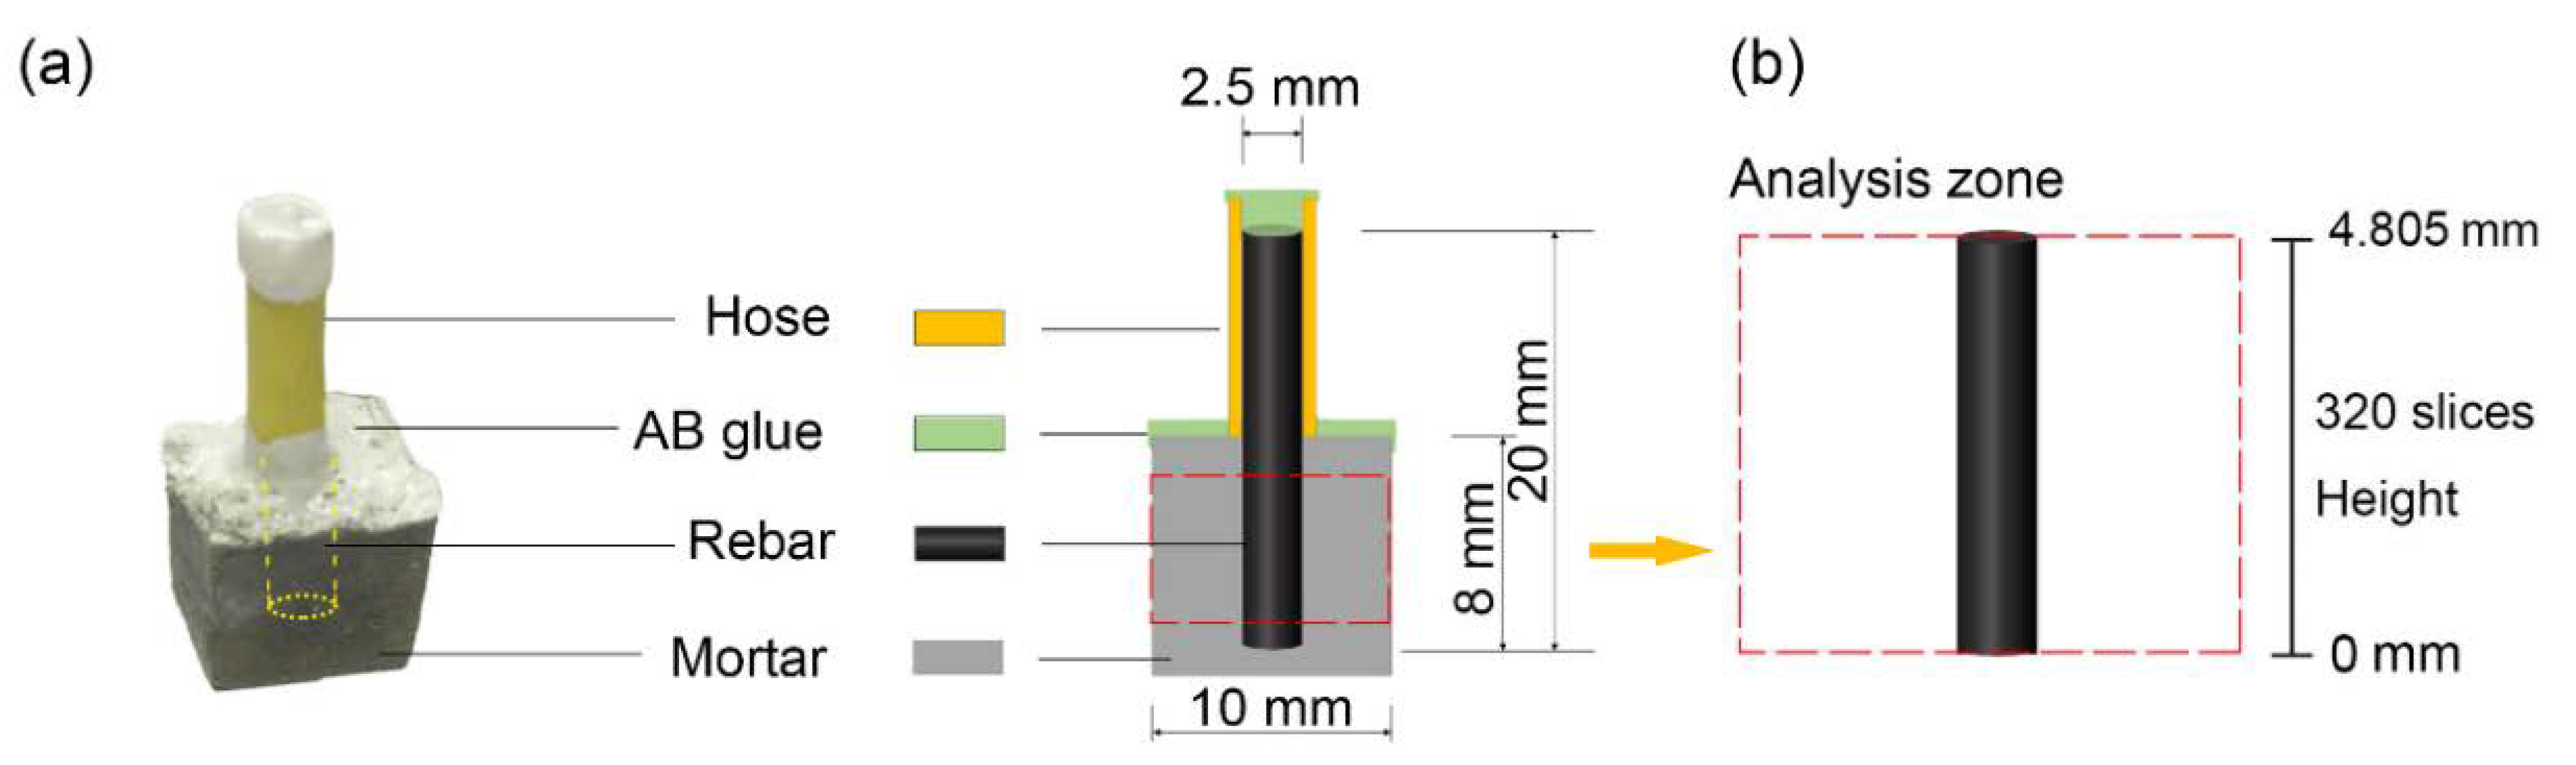
2.2. Specimen Preparation
2.3. Accelerated Corrosion
2.4. XCT Testing
2.5. Linear Polarization Testing
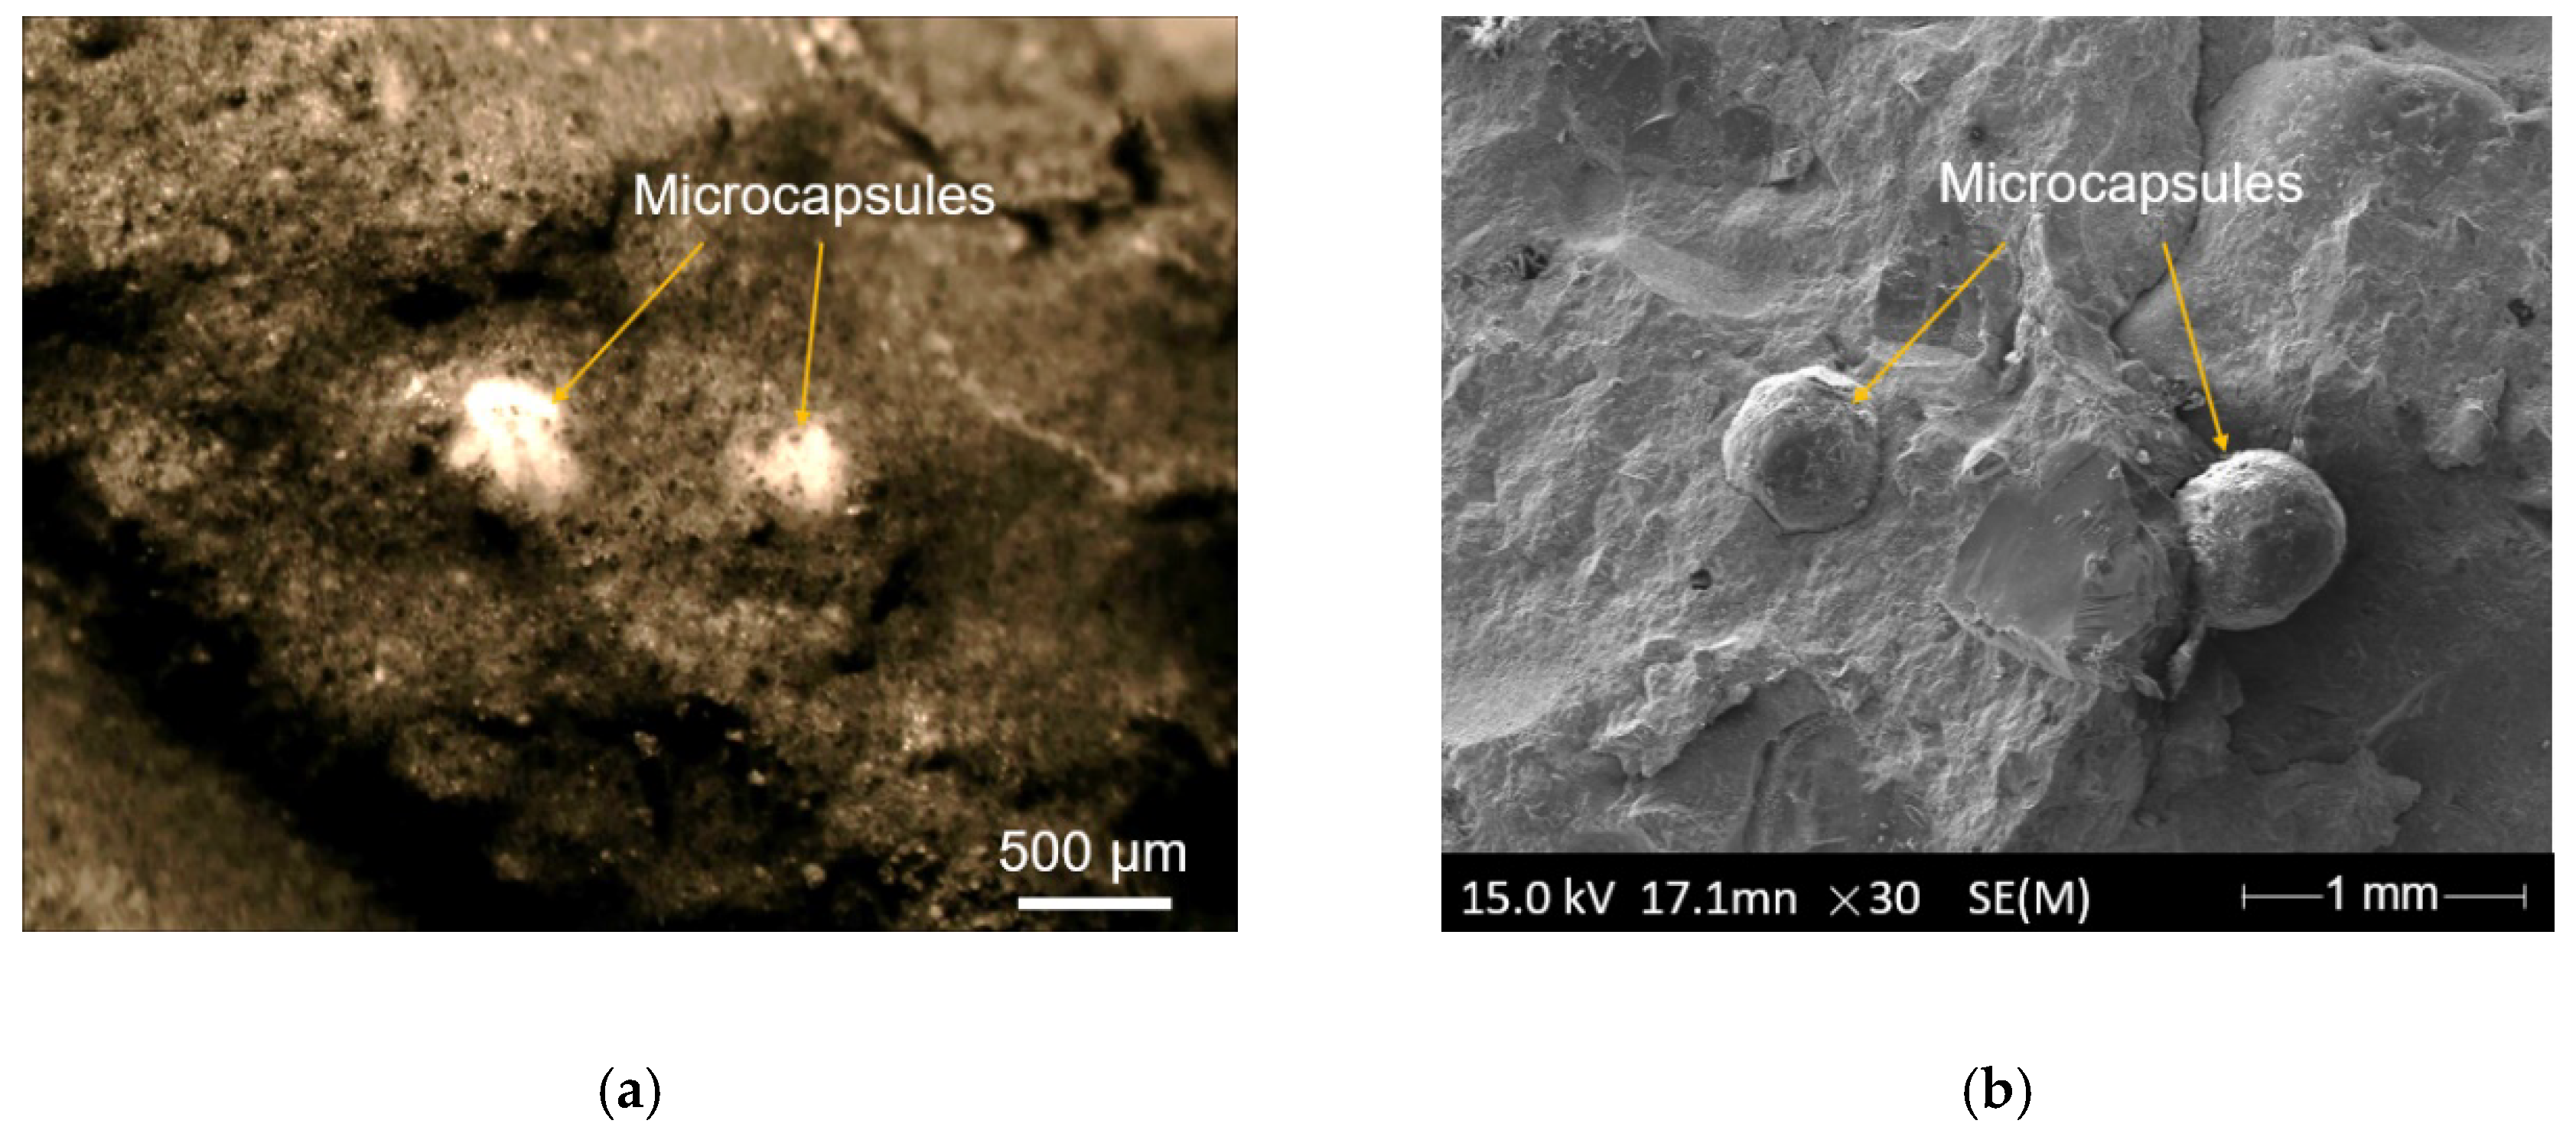
2.6. ESEM Testing of the Microcapsules and the Corroded Samples
3. Results
3.1. Basic Investigation of the Microcapsules
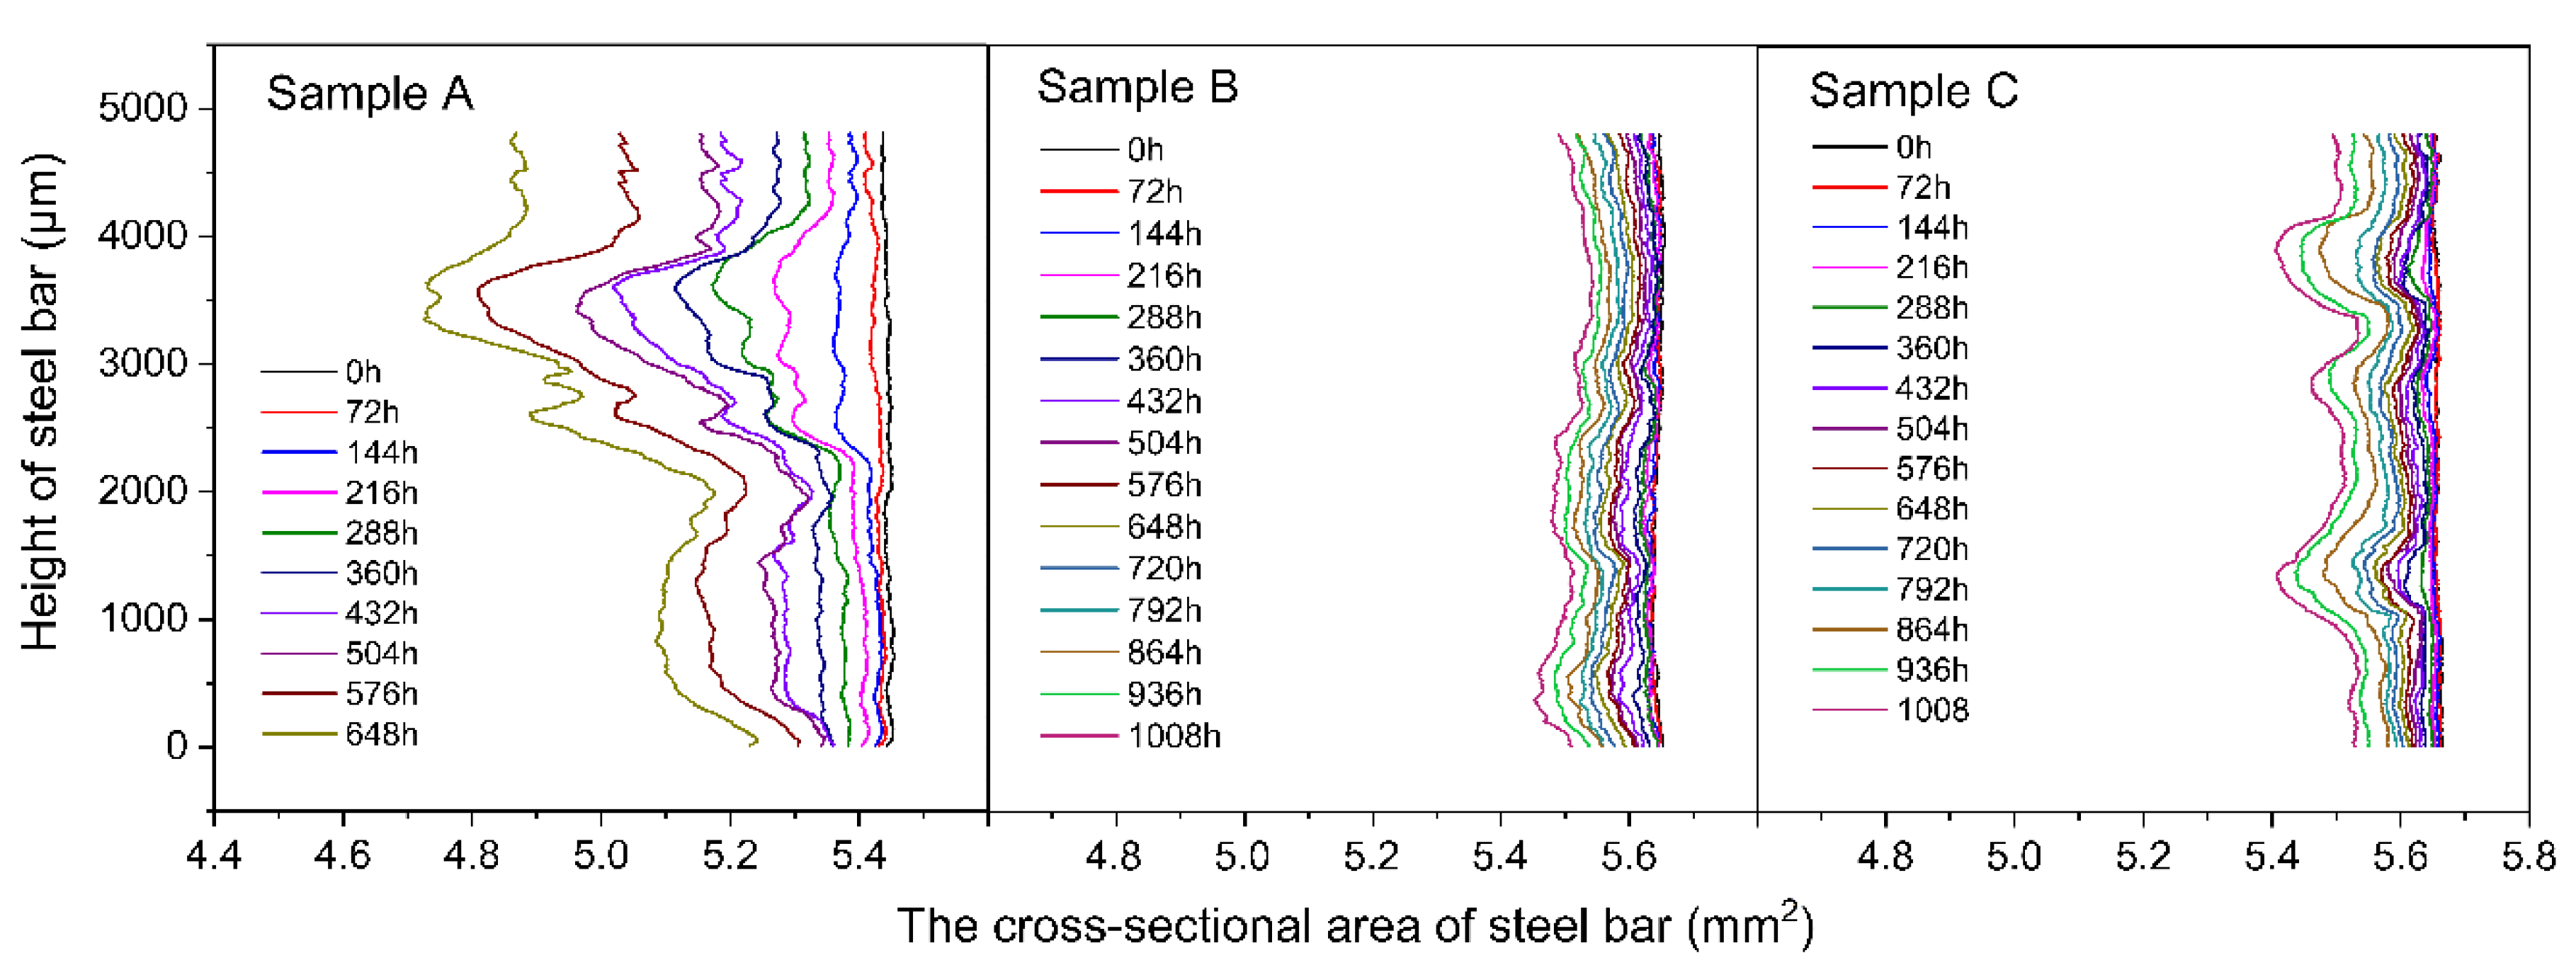
3.2. Evaluation of the Efficiency of the Intelligent OH−-Regulated Microcapsules
4. Discussion
5. Conclusions
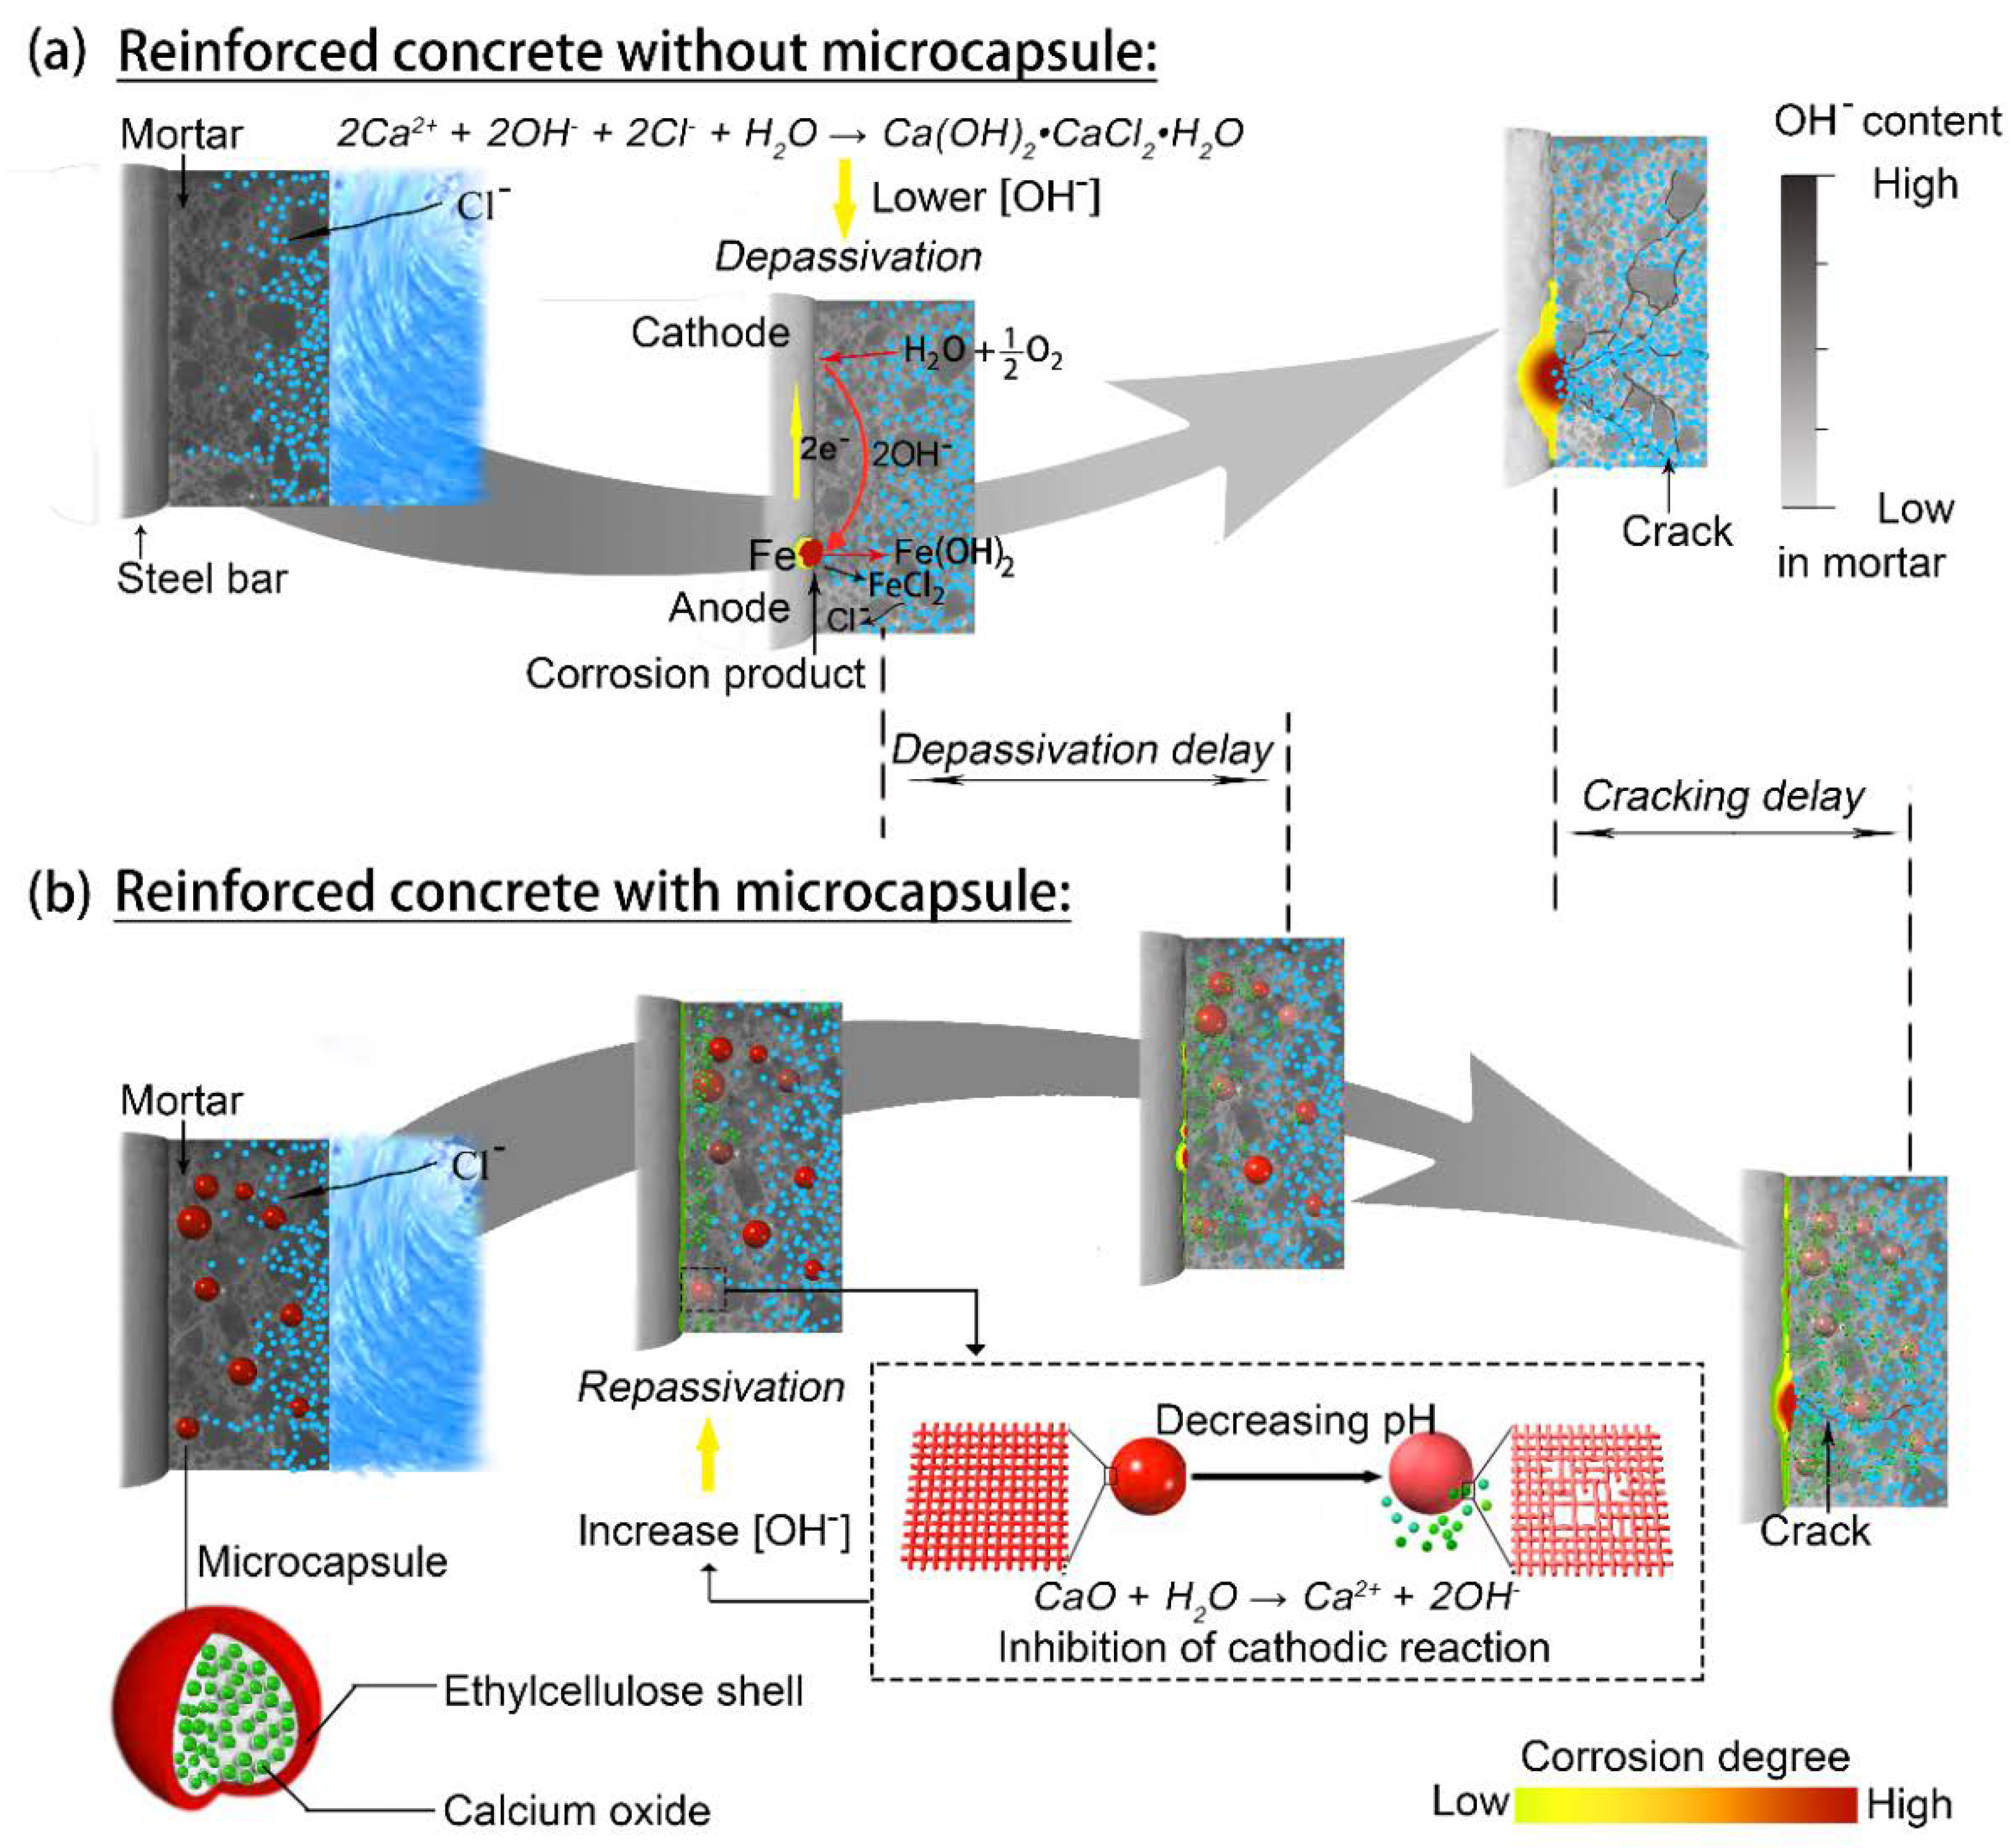
- Intelligent OH− regulation as a corrosion inhibitor or pH buffer in combination with pH-sensitive microcapsules was successfully designed to achieve and prevent chloride-induced corrosion in concrete reinforcing bars.
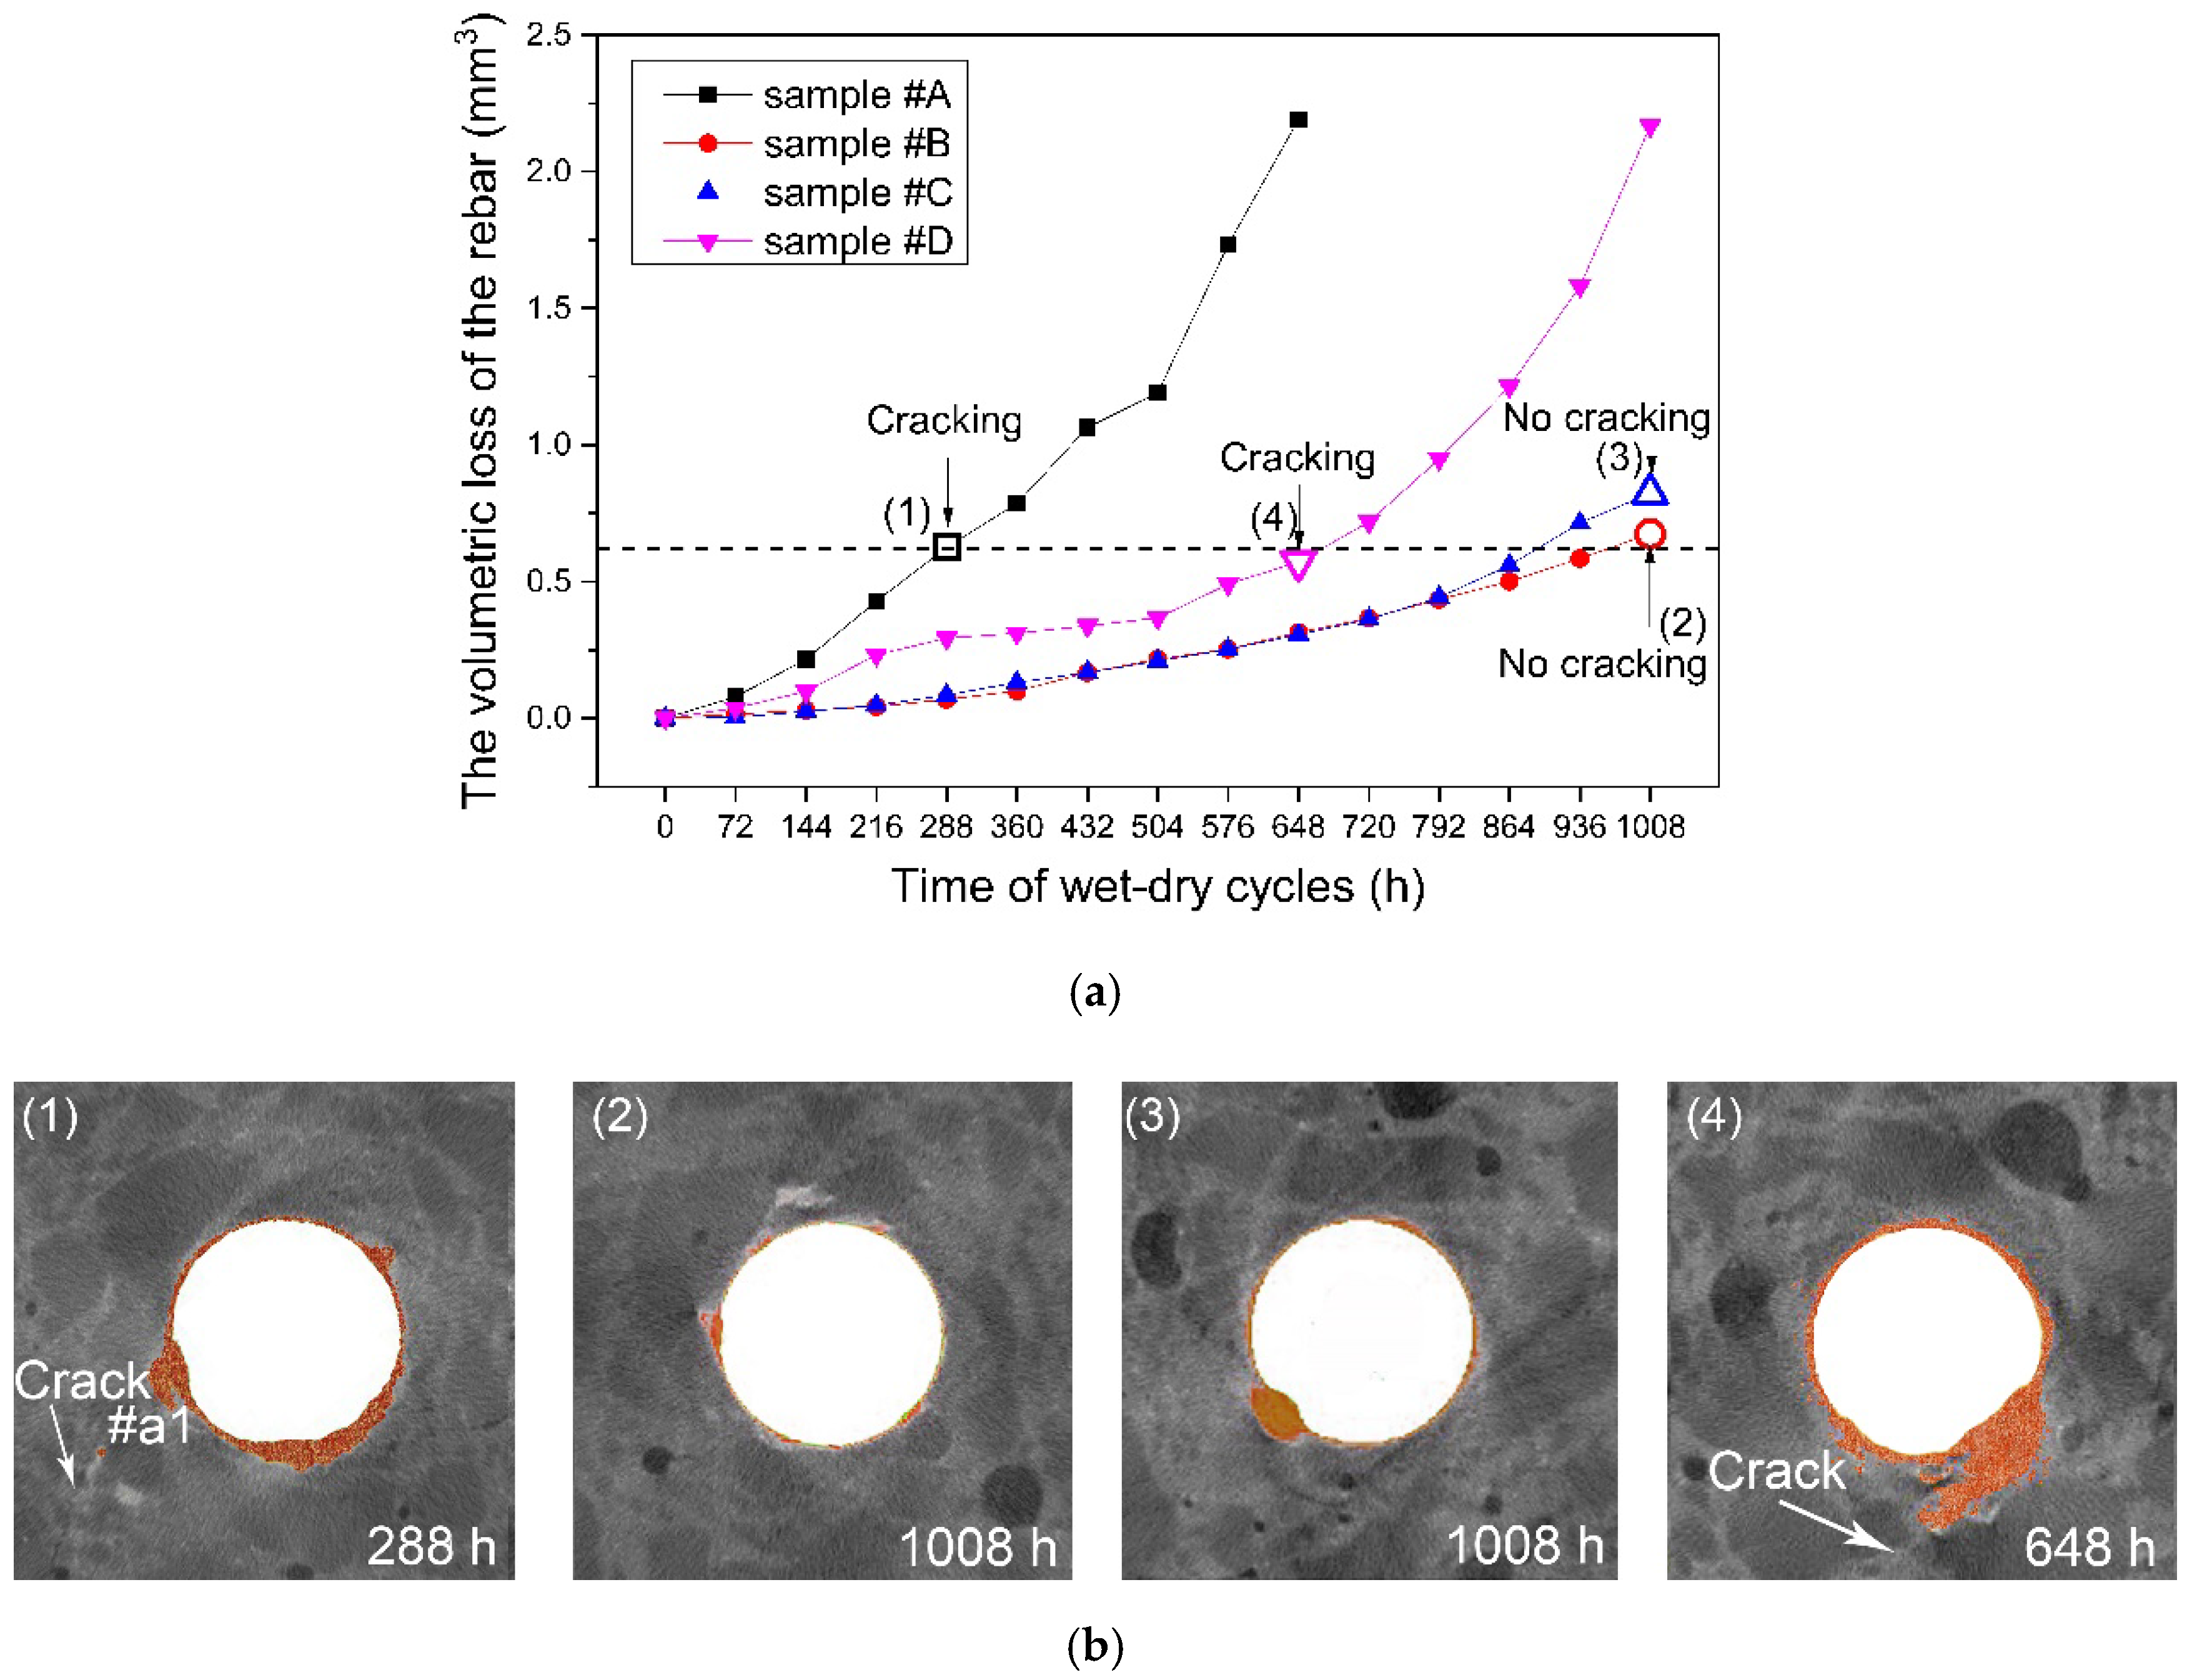
- The X-ray computed tomography (XCT) method was used to trace and contrast the corrosion profiles of the concrete reinforcement bars with and without the microcapsules. The efficiency of the microcapsules was verified by XCT testing, which allowed visualization of the corrosion process (corrosion product, pitting, and cracking) and provided quantitative information.
- The microcapsules showed highly effective corrosion protection due to intelligent OH− regulation in the concrete material, which delayed corrosion initiation and cracking of the cover concrete.
- An excessive addition of microcapsules may compromise the inhibitive efficiency of OH− regulation.
Author Contributions
Funding
Acknowledgments
Conflicts of Interest
References
- Montemor, M.F.; Simões, M.G.S.; Ferreira, A.M.P. Chloride-induced corrosion on reinforcing steel: From the fundamentals to the monitoring techniques. Cem. Concr. Compos. 2003, 25, 491–502. [Google Scholar] [CrossRef]
- Wu, J.; Li, H.M.; Wang, Z.; Liu, J.J. Transport model of chloride ions in concrete under loads and drying-wetting cycles. Constr. Build. Mater. 2016, 112, 733–738. [Google Scholar] [CrossRef]
- Page, C.L. Mechanism of corrosion protection in reinforced concrete marine structures. Nature 1975, 258, 514–515. [Google Scholar] [CrossRef]
- Revert, A.B.; Weerdt, K.D.; Hornbostel, K.; Geiker, M.R. Carbonation-induced corrosion: Investigation of the corrosion onset. Constr. Build. Mater. 2018, 162, 847–856. [Google Scholar] [CrossRef]
- Cabrera, J.G. Deterioration of concrete due to reinforcement steel corrosion. Cem. Concr. Compos. 1996, 18, 47–59. [Google Scholar] [CrossRef]
- Rodriguez, J.; Ortega, L.M.; Casal, J. Load carrying capacity of concrete structures with corroded reinforcement. Constr. Build. Mater. 1997, 11, 239–248. [Google Scholar] [CrossRef]
- Pradhan, B. Corrosion behavior of steel reinforcement in concrete exposed to composite chloride–sulfate environment. Constr. Build. Mater. 2014, 72, 398–410. [Google Scholar] [CrossRef]
- Söylev, T.A.; Richardson, M.G. Corrosion inhibitors for steel in concrete: State-of-the-art report. Constr. Build. Mater. 2008, 22, 609–622. [Google Scholar] [CrossRef]
- González, J.A.; Ramírez, E.; Bautista, A. Protection of steel embedded in chloride-containing concrete by means of inhibitors. Cem. Concr. Res. 1998, 28, 577–589. [Google Scholar] [CrossRef]
- Tritthart, J.; Banfill, P.F.G. Nitrite binding in cement. Cem. Concr. Res. 2001, 31, 1093–1100. [Google Scholar] [CrossRef]
- Ngala, V.T.; Page, C.L.; Page, M.M. Corrosion inhibitor systems for remedial treatment of reinforced concrete. Part 2: Sodium monofluorophosphate. Corros. Sci. 2003, 45, 1523–1537. [Google Scholar] [CrossRef]
- Liang, H.; Li, L.; Poor, N.D.; Sagüés, A.A. Nitrite diffusivity in calcium nitrite-admixed hardened concrete. Cem. Concr. Res. 2003, 33, 139–146. [Google Scholar] [CrossRef]
- Çopuroğlua, O.; Fraaij, A.L.A.; Bijen, J.M.J.M. Effect of sodium monofluorophosphate treatment on microstructure and frost salt scaling durability of slag cement paste. Cem. Concr. Res. 2006, 36, 1475–1482. [Google Scholar] [CrossRef]
- La Iglesia, A.; La Iglesia, V.M.; Fajardo, S.; Gómez, P.P.; Bastidas, J.M. Reaction between sodium monofluorophosphate and portlandite and impact on steel reinforcement corrosion inhibition. Constr. Build. Mater. 2012, 37, 46–50. [Google Scholar] [CrossRef]
- Dong, B.Q.; Ding, W.J.; Qin, S.F.; Han, N.X.; Fang, G.H.; Liu, Y.Q.; Xing, F.; Hong, S.X. Chemical self-healing system with novel microcapsules for corrosion inhibition of rebar in concrete. Cem. Concr. Compos. 2018, 85, 83–91. [Google Scholar] [CrossRef]
- Dong, B.Q.; Ding, W.J.; Qin, S.F.; Fang, G.H.; Liu, Y.Q.; Dong, P.; Han, S.W.; Xing, F.; Hong, S.X. 3D visualized tracing of rebar corrosion-inhibiting features in concrete with a novel chemical self-healing system. Constr. Build. Mater. 2018, 168, 11–20. [Google Scholar] [CrossRef]
- Goñi, S.; Andrade, C. Synthetic concrete pore solution chemistry and rebar corrosion rate in the presence of chlorides. Cem. Concr. Res. 1990, 20, 525–539. [Google Scholar] [CrossRef]
- Hussain, S.E.; Al-Musallam, A.; Al-Gahtani, A.S. Factors affecting threshold chloride for reinforcement corrosion in concrete. Cem. Concr. Res. 1995, 25, 1543–1555. [Google Scholar] [CrossRef]
- Pruckner, F.; Gjørv, O.E. Effect of CaCl2 and NaCl additions on concrete corrosivity. Cem. Concr. Res. 2004, 34, 1209–1217. [Google Scholar] [CrossRef]
- Gouda, V.K. Corrosion and corrosion inhibition of reinforcing steel. I. Immersed in alkaline solutions. Br. Corros. J. 1970, 5, 198–203. [Google Scholar] [CrossRef]
- Page, C.L.; Lambert, P.; Vassie, P.R.W. Investigations of reinforcement corrosion. 1. The pore electrolyte phase in chloride-contaminated concrete. Mater. Struct. 1991, 24, 243–252. [Google Scholar] [CrossRef]
- Lambert, P.; Page, C.L.; Vassie, P.R.W. Investigations of reinforcement corrosion. 2. Electrochemical monitoring of steel in chloride-contaminated concrete. Mater. Struct. 1991, 24, 351–358. [Google Scholar] [CrossRef]
- Alonso, C.; Andrade, C.; Castellote, M.; Castro, P. Chloride threshold values to depassivate reinforcing bars embedded in a standardized OPC mortar. Cem. Concr. Res. 2000, 30, 1047–1055. [Google Scholar] [CrossRef]
- Mammoliti, L.T.; Brown, L.C.; Hansson, C.M.; Hope, B.B. The influence of surface finish of reinforcing steel and pH of the test solution on the chloride threshold concentration for corrosion initiation in synthetic pore solutions. Cem. Concr. Res. 1996, 26, 545–550. [Google Scholar] [CrossRef]
- Li, L.; Sagüés, A.A. Chloride corrosion threshold of reinforcing steel in alkaline solutions—Open-circuit immersion tests. Corrosion 2001, 57, 19–28. [Google Scholar] [CrossRef]
- Glass, G.K.; Buenfeld, N.R. The presentation of the chloride threshold level for corrosion of steel in concrete. Corros. Sci. 1997, 39, 1001–1013. [Google Scholar] [CrossRef]
- Reardon, E.J. An ion interaction model for the determination of chemical equilibria in cement/water systems. Cem. Concr. Res. 1990, 20, 175–192. [Google Scholar] [CrossRef]
- Wang, Y.S.; Fang, G.H.; Ding, W.J.; Han, N.X.; Xing, F.; Dong, B.Q. Self-immunity microcapsules for corrosion protection of steel bar in reinforced concrete. Sci. Rep. 2015, 5, 18484. [Google Scholar] [CrossRef]
- Wang, Y.S.; Wang, Y.S.; Fang, G.H.; Liu, Y.Q.; Xing, F.; Dong, B.Q. Feasibility study on corrosion protection of steel bar in a self-immunity system based on increasing OH− content. Constr. Build. Mater. 2016, 125, 742–748. [Google Scholar] [CrossRef]
- Dong, B.Q.; Fang, G.H.; Liu, Y.Q.; Dong, P.; Zhang, J.C.; Xing, F.; Hong, S.X. Monitoring reinforcement corrosion and corrosion-induced cracking by X-ray microcomputed tomography method. Cem. Concr. Res. 2017, 100, 311–321. [Google Scholar] [CrossRef]
- Rekhi, G.S.; Jambhekar, S.S. Ethylcellulose-a polymer review. Drug Dev. Ind. Pharm. 1995, 21, 61–77. [Google Scholar] [CrossRef]
- Dong, B.Q.; Fang, G.H.; Wang, Y.S.; Liu, Y.Q.; Hong, S.X.; Zhang, J.C.; Lin, S.M.; Xing, F. Performance recovery concerning the permeability of concrete by means of a microcapsule based self-healing system. Cem. Concr. Compos. 2017, 78, 84–96. [Google Scholar] [CrossRef]
- Elaqra, H.; Godin, N.; Peix, G.; R’Mili, M.; Fantozzi, G. Damage evolution analysis in mortar, during compressive loading using acoustic emission and X-ray tomography: Effects of the sand/cement ratio. Cem. Concr. Res. 2007, 37, 703–713. [Google Scholar] [CrossRef]
- Promentilla, M.A.B.; Sugiyama, T.; Hitomi, T.; Takeda, N. Quantification of tortuosity in hardened cement pastes using synchrotron-based X-ray computed microtomography. Cem. Concr. Res. 2009, 39, 548–557. [Google Scholar] [CrossRef]
- Itty, P.A.; Serdar, M.; Meral, C.; Parkinson, D.; Macdowell, A.A.; Bjegović, D.; Monteiro, P.J.M. In situ 3D monitoring of corrosion on carbon steel and ferritic stainless steel embedded in cement paste. Corros. Sci. 2014, 83, 409–418. [Google Scholar] [CrossRef]
- Andrade, C.; González, J.A. Quantitative measurements of corrosion rate of reinforcing steels embedded in concrete using polarization resistance measurements. Mater. Corros. 1978, 29, 515–519. [Google Scholar] [CrossRef]
- Rule, J.D.; Sottos, N.R.; White, S.R. Effect of microcapsule size on the performance of self-healing polymers. Polymer 2007, 48, 3520–3529. [Google Scholar] [CrossRef]


| Content | Ingredients | Mass (g) | Product |
|---|---|---|---|
| Core | Calcium hydroxide | 57 | Analytical reagent |
| MCC | 39 | Chemically pure | |
| HPMC | 2 | Chemically pure | |
| Polysorbate 80 | 2 | Chemically pure | |
| Solvent | Deionized water | 150 |
| Content | Ingredients | Mass ratio | Product |
|---|---|---|---|
| Shell | Ethylcellulose | 10 | Chemically pure |
| Solvent | Methylbenzene | 80 | Analytical reagent |
| Ethanol | 20 | Analytical reagent |
| Sample | Microcapsule | Dosage (wt.%) | W/C/S |
|---|---|---|---|
| A | – | 0 | 2:5:5 |
| B | CaO | 0.5 | 2:5:5 |
| C | CaO | 3 | 2:5:5 |
| D | CaO | 5 | 2:5:5 |
| Fe | C | Mn | Si | P | S | Cr | |
|---|---|---|---|---|---|---|---|
| Content (wt%) | 97.64 | 0.195 | 1.56 | 0.57 | 0.023 | 0.004 | 0.008 |
| SiO2 | Al2O3 | Fe2O3 | CaO | MgO | C3S | C2S | C3A | C4AF |
|---|---|---|---|---|---|---|---|---|
| 18.96 | 6.05 | 3.42 | 63.22 | 1.21 | 65.35 | 5.06 | 10.23 | 10.40 |
| Parameter | Value |
|---|---|
| X-ray source excitation voltage | 70 kV |
| X-ray source excitation current | 114 µA |
| Magnification | 0.39× |
| Slice pixel number | 1024 × 1024 |
| Slice number | 1000 |
| Voxel size | 15.0173 × 15.0173 × 15.0173 µm3 |
| Time i (h) | Sample A | Sample B | Sample C | Sample D | ||||
|---|---|---|---|---|---|---|---|---|
| Vi/mm3 | ∆V/mm3 | Vi/mm3 | ∆V/mm3 | Vi/mm3 | ∆V/mm3 | Vi/mm3 | ∆V/mm3 | |
| 0 | 26.163 | 0.000 | 27.129 | 0.000 | 27.186 | 0.000 | 26.765 | 0.000 |
| 72 | 26.085 | 0.078 | 27.113 | 0.016 | 27.184 | 0.003 | 26.728 | 0.037 |
| 144 | 25.947 | 0.216 | 27.099 | 0.030 | 27.161 | 0.025 | 26.667 | 0.098 |
| 216 | 25.735 | 0.428 | 27.086 | 0.043 | 27.138 | 0.048 | 26.513 | 0.233 |
| 288 | 25.537 | 0.626 | 27.060 | 0.069 | 27.101 | 0.085 | 26.452 | 0.293 |
| 360 | 25.377 | 0.786 | 27.029 | 0.099 | 27.055 | 0.131 | 26.443 | 0.312 |
| 432 | 25.099 | 1.064 | 26.962 | 0.167 | 27.019 | 0.168 | 26.428 | 0.337 |
| 504 | 24.972 | 1.191 | 26.913 | 0.216 | 26.976 | 0.210 | 26.399 | 0.367 |
| 576 | 24.431 | 1.731 | 26.876 | 0.253 | 26.934 | 0.252 | 26.275 | 0.490 |
| 648 | 23.972 | 2.191 | 26.814 | 0.315 | 26.880 | 0.306 | 26.193 | 0.573 |
| 720 | 26.762 | 0.366 | 26.825 | 0.362 | 26.047 | 0.718 | ||
| 792 | 26.694 | 0.435 | 26.743 | 0.443 | 25.816 | 0.949 | ||
| 864 | 26.628 | 0.501 | 26.626 | 0.560 | 25.552 | 1.213 | ||
| 932 | 26.544 | 0.585 | 26.471 | 0.715 | 25.185 | 1.581 | ||
| 1008 | 26.454 | 0.675 | 26.364 | 0.823 | 24.598 | 2.167 | ||
© 2019 by the authors. Licensee MDPI, Basel, Switzerland. This article is an open access article distributed under the terms and conditions of the Creative Commons Attribution (CC BY) license (http://creativecommons.org/licenses/by/4.0/).
Share and Cite
Hong, S.; Qin, S.; Dong, B.; Xing, F. Corrosion Features of the Reinforcing Bar in Concrete with Intelligent OH− Regulation of Microcapsules. Materials 2019, 12, 3966. https://doi.org/10.3390/ma12233966
Hong S, Qin S, Dong B, Xing F. Corrosion Features of the Reinforcing Bar in Concrete with Intelligent OH− Regulation of Microcapsules. Materials. 2019; 12(23):3966. https://doi.org/10.3390/ma12233966
Chicago/Turabian StyleHong, Shuxian, Shaofeng Qin, Biqin Dong, and Feng Xing. 2019. "Corrosion Features of the Reinforcing Bar in Concrete with Intelligent OH− Regulation of Microcapsules" Materials 12, no. 23: 3966. https://doi.org/10.3390/ma12233966
APA StyleHong, S., Qin, S., Dong, B., & Xing, F. (2019). Corrosion Features of the Reinforcing Bar in Concrete with Intelligent OH− Regulation of Microcapsules. Materials, 12(23), 3966. https://doi.org/10.3390/ma12233966