The Effect of Hydrogen on Martensite Transformations and the State of Hydrogen Atoms in Binary TiNi-Based Alloy with Different Grain Sizes


 ,
, 
Abstract
1. Introduction
2. Materials and Methods
3. Results and Discussion
4. Conclusions
Author Contributions
Funding
Conflicts of Interest
References
- Otsuka, K.; Shimizu, K.; Suzuki, Y.; Sekiguchi, Y.; Tadaki, K.; Honma, T.; Miyazaki, S. Shape Memory Alloys; Funakubo, H., Ed.; Gordon and Breach Science: New York, NY, USA, 1987. [Google Scholar]
- Yokogama, K.; Hamada, K.; Moriyama, K.; Asaoka, K. Degradation and fracture of Ni–Ti superelastic wire in an oral cavity. Biomaterials 2001, 22, 2257–2262. [Google Scholar] [CrossRef]
- Adachi, Y.; Wade, N.; Hosoi, Y. Effect of Hydrogen on the Shape Memory Effect and Transformation Behavior of Ti-Ni Alloy. J. Japan. Inst. Metals. 1990, 54, 525–531. [Google Scholar] [CrossRef]
- He, J.Y.; Gao, K.W.; Su, Y.J.; Qiao, L.J.; Chu, W.Y. The role of hydride, martensite and atomic hydrogen in hydrogen-induced delayed fracture of TiNi alloy. Mater. Sci. Eng. A. 2004, 364, 333–338. [Google Scholar] [CrossRef]
- Runciman, A.; Chen, K.C.; Pelton, A.R.; Trépanier, C. Effects of Hydrogen on the Phases and Transition Temperatures of NiTi. In Proceedings of the International Conference on Shape Memory and Superelastic Technologies. Asilomar Conference Center, Pacific Grove, CA, USA, 7–11 May 2006; Berg, B., Mitchell, M.R., Proft, J., Eds.; ASM International: Materials Park, OH, USA, 2006; pp. 185–196, ISBN 0871708620/9780871708625. [Google Scholar]
- Kubĕnová, M.; Záleŝák, J.; Cĕrmák, J.; Dlouhŷ, A. Impact of hydrogen-assisted heat treatments on microstructure and transformation path in a Ni-rich NiTi shape memory alloy. J. Alloy. Compd. 2013, 577S, S287–S290. [Google Scholar] [CrossRef]
- Baturin, A.; Lotkov, A.; Grishkov, V.; Rodionov, I.; Kudiiarov, V. Effect of hydrogen redistribution during aging on the structure and phase state of nanocrystalline and coarse-grained TiNi alloys. J. Alloy. Compd. 2018, 751, 359–363. [Google Scholar] [CrossRef]
- Baturin, A.; Lotkov, A.; Grishkov, V.; Rodionov, I.; Bordulev, Y.; Kabylkakov, Y. Hydrogen diffusion and the effect of hydrogen on structural transformations in binary TiNi based alloys. Int. J. Hydrogen Energy. in press. [CrossRef]
- Oudriss, A.; Creus, J.; Bouhattate, J.; Conforto, E.; Berziou, C.; Savall, C.; Feaugas, X. Grain size and grain-boundary effects on diffusion and trapping of hydrogen in pure nickel. Acta Mater. 2012, 60, 6814–6828. [Google Scholar] [CrossRef]
- Nagaoka, A.; Yokoyama, K.; Sakai, J. Evaluation of hydrogen absorption behaviour during acid etching for surface modification of commercial pure Ti, Ti–6Al–4V and Ni–Ti superelastic alloys. Corr. Sci. 2010, 52, 1130–1138. [Google Scholar] [CrossRef]
- Yokoyama, K.; Eguchi, T.; Asaoka, K.; Nagumo, M. Effect of constituent phase of Ni–Ti shape memory alloy on susceptibility to hydrogen embrittlement. Mater. Sci. Eng. A. 2004, 374, 177–183. [Google Scholar] [CrossRef]
- Yokoyama, K.; Kaneko, K.; Ogawa, T.; Moriyama, K.; Asaoka, K.; Sakai, J. Hydrogen embrittlement of work-hardened Ni-Ti alloy in fluoride solutions. Biomaterials 2005, 26, 101–108. [Google Scholar] [CrossRef]
- Yokoyama, K.; Ogawa, T.; Asaoka, K.; Sakai, J.; Nagumo, M. Degradation of tensile strength of Ni–Ti superelastic alloy due to hydrogen absorption in methanol solution containing hydrochloric acid. Mater. Sci. Eng. A. 2003, 360, 153–159. [Google Scholar] [CrossRef]
- Tomita, M.; Yokoyama, K.; Asaoka, K.; Sakai, J. Hydrogen thermal desorption behavior of Ni-Ti superelastic alloy subjected to tensile deformation after hydrogen charging. Mater. Sci. Eng. A. 2008, 476, 308–315. [Google Scholar] [CrossRef]
- Shimada, T.; Yokoyama, K.; Sakai, J. Improved fracture properties of Ni-Ti superelastic alloy under sustained tensile load in physiological saline solution containing hydrogen peroxide by hydrogen charging. J. Alloys Compd. 2018, 752, 1–7. [Google Scholar] [CrossRef]
- Asaoka, K.; Yokoyama, K.; Nagumo, M. Hydrogen embrittlement of nickel-titanium alloy in biological environment. Metal. Mater. Trans. A. 2002, 33, 495–501. [Google Scholar] [CrossRef]
- Ribeiro, R.M.; Lemus, L.F.; Dos Santos, D.S. Hydrogen absorption study of Ti-based alloys performed by melt-spinning. Mater. Res. 2013, 16, 679–682. [Google Scholar] [CrossRef]
- Saito, T.; Yokoyama, T.; Takasaki, A. Hydrogenation of TiNi shape memory alloy produced by mechanical alloying. J. Alloys Compd. 2011, 509, S779–S781. [Google Scholar] [CrossRef]
- Kaneko, K.; Yokoyama, K.; Moriyama, K.; Asaoka, K.; Sakai, J. Degradation in performance of orthodontic wires caused by hydrogen absorption during short-term immersion in 2.0% acidulated phosphate fluoride solution. Angle Orthod. 2004, 74, 487–495. [Google Scholar]
- Yokoyama, K.; Tomita, M.; Sakai, J. Hydrogen embrittlement behavior induced by dynamic martensite transformation of Ni-Ti superelastic alloy. Acta Mater. 2009, 57, 1875–1885. [Google Scholar] [CrossRef]
- Yokoyama, K.; Nagaoka, A.; Sakai, J. Effects of the hydrogen absorption conditions on the hydrogen embrittlement behavior of Ni–Ti superelastic alloy. ISIJ International. 2012, 52, 255–262. [Google Scholar] [CrossRef][Green Version]
- Yokoyama, K.; Ogawa, T.; Takashima, K.; Asaoka, K.; Sakai, J. Hydrogen embrittlement of Ni-Ti superelastic alloy aged at room temperature after hydrogen charging. Mater. Sci. Eng. A. 2007, 466, 106–113. [Google Scholar] [CrossRef]
- Kissinger, H.E. Reaction Kinetics in Differential Thermal Analysis. Anal. Chemistry. 1957, 29, 1702–1706. [Google Scholar] [CrossRef]
- Lotkov, A.I.; Baturin, A.A. Physical nature of martensite transformations in B2-type Ti compounds and TiNi-based alloys. Phys. Mesomech. 2011, 14, 261–274. [Google Scholar] [CrossRef]
- Hagi, H.; Mizuno, M.; Ibe, T. Hydrogen pickup and formation of hydride in 50.9at%Ni-Ti alloy by cathodic polarization. J. Surf. Finish. Soc. Jap. 1997, 48, 337–342. [Google Scholar] [CrossRef]
- Holec, D.; Friák, M.; Dlouhŷ, A.; Neugebauer, J. Ab initio study of point defects in NiTi-based alloys. Phys. Rev. B. 2014, 89, 014110. [Google Scholar] [CrossRef]
- Duerig, T.; Shelley, O.; Madamba, D.; Vien, L. A Practitioner’s Perspective of Hydrogen in Ni-Ti Alloys. Shap. Mem. Superelasticity. 2019, 5, 235–248. [Google Scholar] [CrossRef]
- Li, Z.; Xi, F.; Liang, X.; Chen, H.; Li, Z.; Jin, X.; Fukuda, T. Effect of Hydrogen Doping on Stress-Induced Martensitic Transformation in a Ti-Ni Shape Memory Alloy. Met. Mater. Trans. A. 2019, 50, 3033–3037. [Google Scholar] [CrossRef]
- Mehrer, H. Diffusion in Solids: Fundamentals, Methods, Materials, Diffusion-controlled Processes; Springer: Berlin/Heidelberg, Germany, 2007; ISBN 978-3-540-71486-6. [Google Scholar]
- Brauer, E.; Gruner, R.; Rauch, F. Kinetics and Mechanism of Hydrogen Diffusion in Hydrides of Titanium, Zirconium and TiNi0.5. Berich. Bunsen. Phys. Chem. 1983, 87, 341–345. [Google Scholar] [CrossRef]
- Zhu, J.H.; Liu, C.T.; Chen, C.H. Effect of iron additions on environmental embrittlement of NiTi-base alloys. Intermetallics 2004, 12, 859–868. [Google Scholar] [CrossRef]
- Bergers, K.; Camisão de Souza, E.; Thomas, I.; Mabho, N.; Flock, J. Determination of hydrogen in steel by thermal desorption mass spectrometry. Steel Res. Int. 2010, 81, 499–507. [Google Scholar] [CrossRef]
- Gubicza, J. Defect Structure and Properties of Nanomaterials, 2nd ed.; Woodhead Publishing: Cambridge, UK, 2017; ISBN 9780081019177. [Google Scholar]
- Soubeyroux, J.L.; Fruchart, D.; Lorthioir, G.; Ochin, P.; Colin, D. Structural study of hydrides NiTiHX (X=1.0 and 1.4). J. Alloys Compd. 1993, 196, 127–132. [Google Scholar] [CrossRef]
- Haruna, T.; Fujita, Y.; Morihashi, D.; Hirohata, Y. Role of the Electrochemical Potential and Solution pH to Environment-Assisted Cracking of Super-Elastic TiNi Alloy. Mater. Trans. JIM. 2016, 57, 2026–2032. [Google Scholar] [CrossRef]
- Sarkar, S.; Ren, X.; Otsuka, K. Evidence for Strain Glass in the Ferroelastic-Martensitic System Ti50−xNi50+x. Phys. Rev. Lett. 2005, 95, 205702. [Google Scholar] [CrossRef] [PubMed]
- Zhang, Z.; Wang, Y.; Wang, D.; Zhou, Y.; Otsuka, K.; Ren, X. Phase diagram of Ti50−xNi50+x: Crossover from martensite to strain glass. Phys. Rev. B. 2010, 81, 224102. [Google Scholar] [CrossRef]
- Zhang, J.; Wang, Y.; Ding, X.; Zhang, Z.; Zhou, Y.; Ren, X.; Wang, D.; Ji, Y.; Song, V.; Otsuka, K.; et al. Spontaneous strain glass to martensite transition in a Ti50Ni44.5Fe5.5 strain glass. Phys. Rev. B. 2011, 84, 214201. [Google Scholar] [CrossRef]
- Ren, S.; Zhou, C.; Xue, D.; Wang, D.; Zhang, J.; Ding, X.; Otsuka, K.; Ren, X. Sandwichlike strain glass phase diagram of Ti49Ni51−xPdx. Phys. Rev. B. 2016, 94, 214112. [Google Scholar] [CrossRef]
- Snir, Y.; Carl, M.; Ley, N.A.; Young, L.M. Effects of Hydrogen Charging on the Phase Transformation of Martensitic NiTi Shape Memory Alloy Wires. Shap. Mem. Superelasticity. 2017, 3, 443–456. [Google Scholar] [CrossRef]


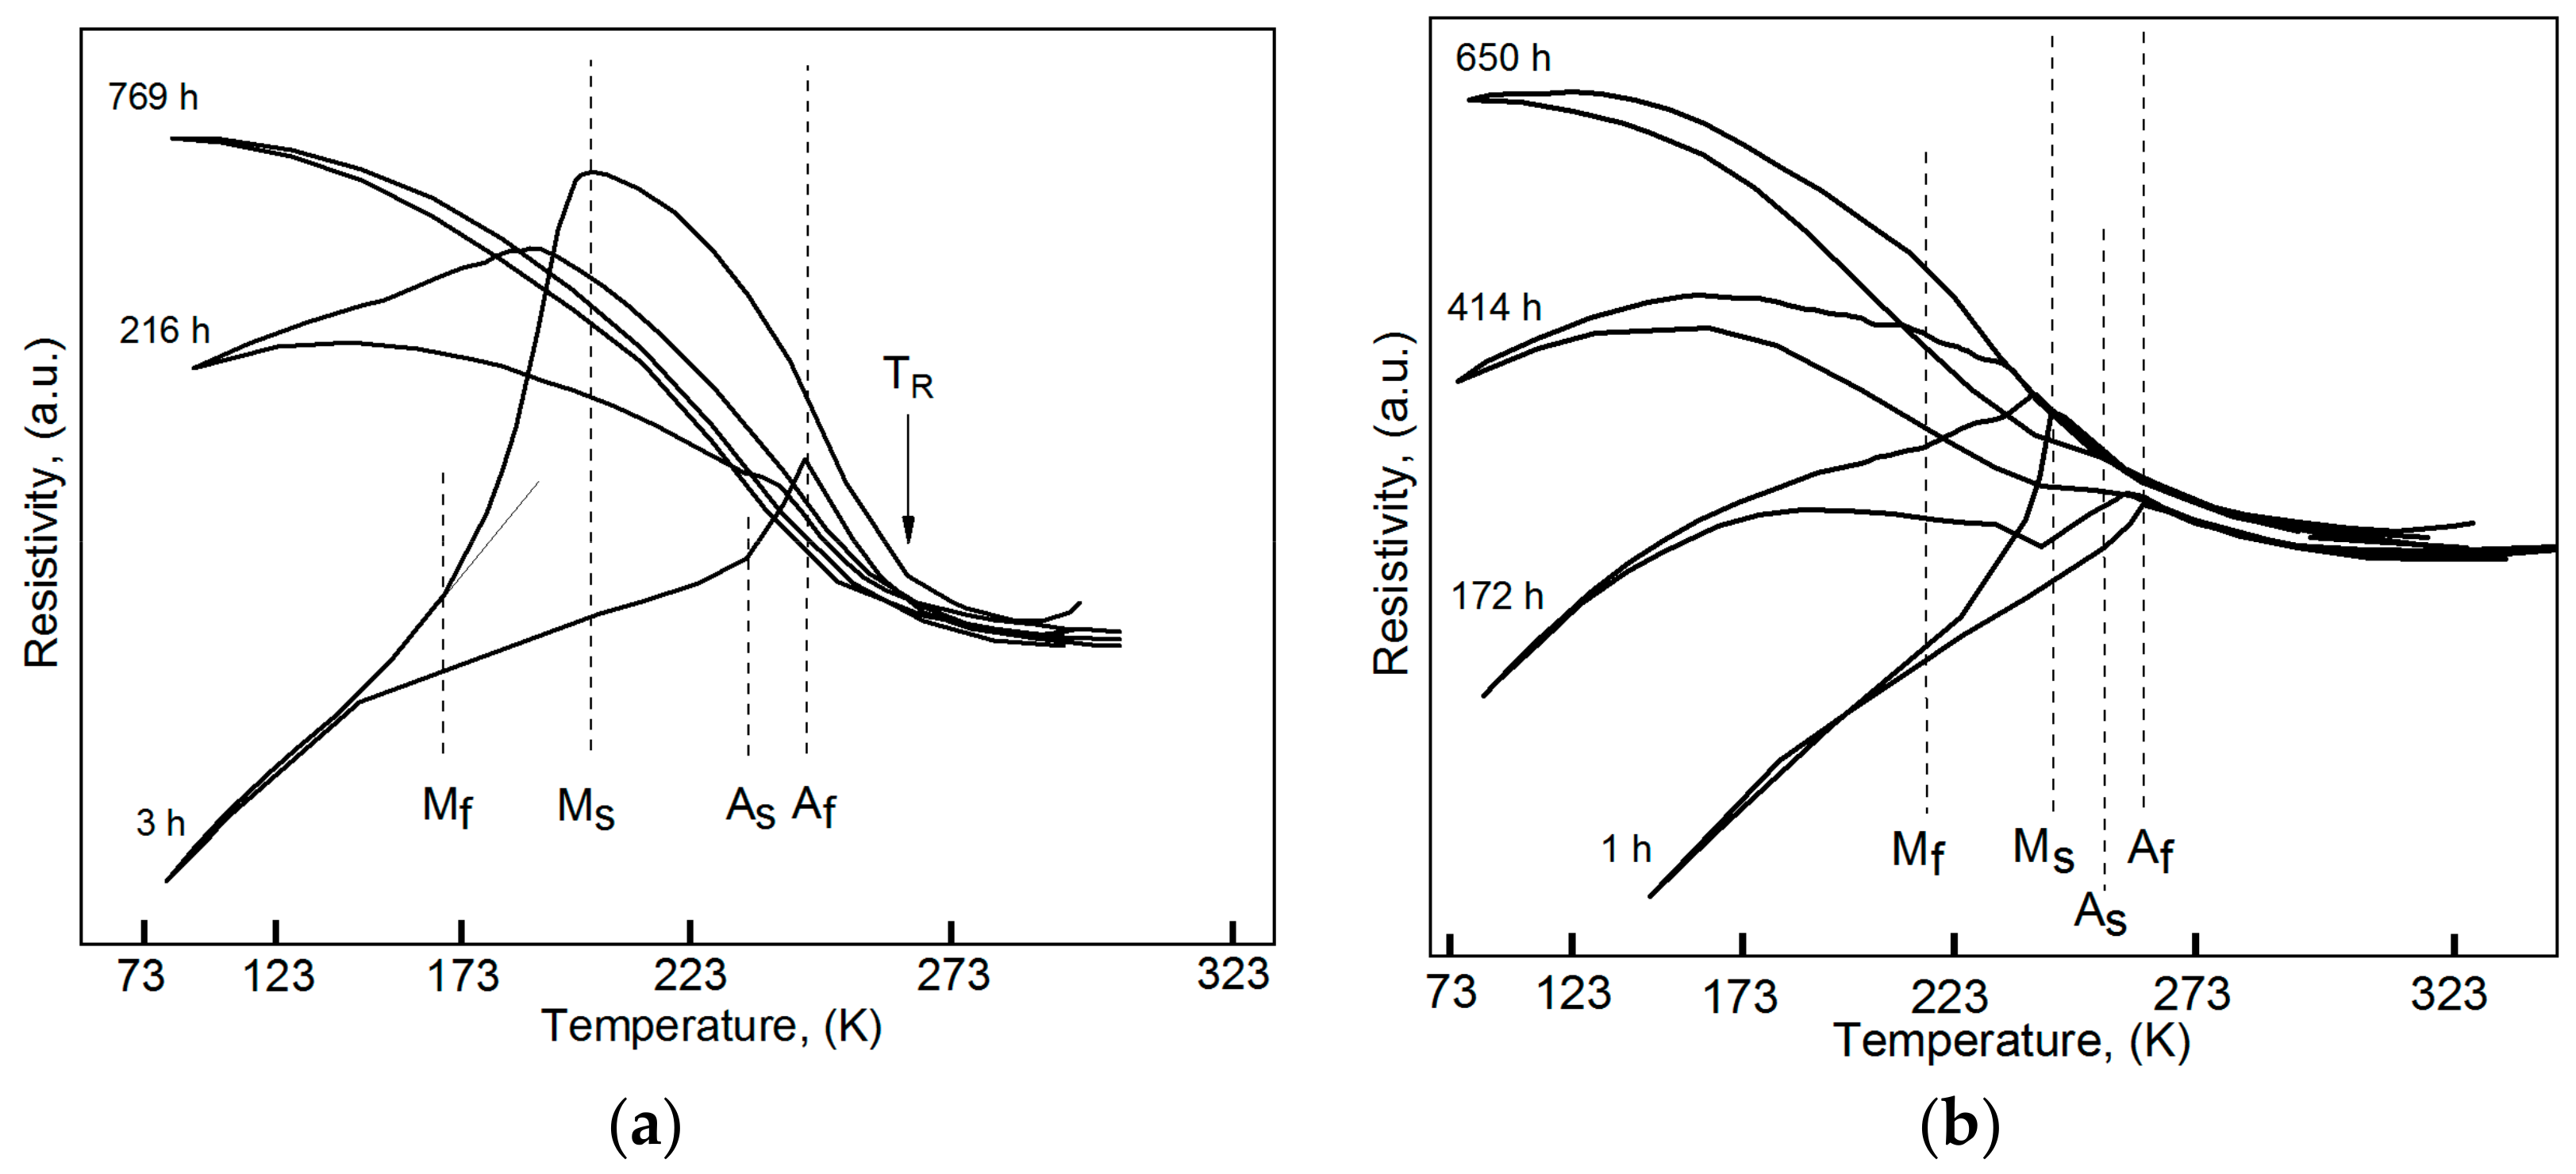
| Specimen Type and State | TR, K | Ms, K | Mf, K | As, K | Af, K |
|---|---|---|---|---|---|
| Coarse-grained, initial [7] | - | 241 | 221 | 252 | 263 |
| Coarse-grained, aged for 1 h | - | 239 | 220 | 253 | 261 |
| Nanocrystalline, initial [7] | 264 | 212 | 182 | 236 | 252 |
| Nanocrystalline, aged for 3 h | 264 | 210 | 165 | 234 | 254 |
| Specimen Type | DH, m2/s | Other Data for Comparison, DH, m2/s |
|---|---|---|
| Coarse-grained | 6 × 10⁻¹⁴ | 2 × 10⁻¹⁴ [31] |
| 9 × 10⁻¹⁵ [16] | ||
| 5 × 10⁻¹⁴ [30] | ||
| Nanocrystalline | 2 × 10⁻¹³ | - |
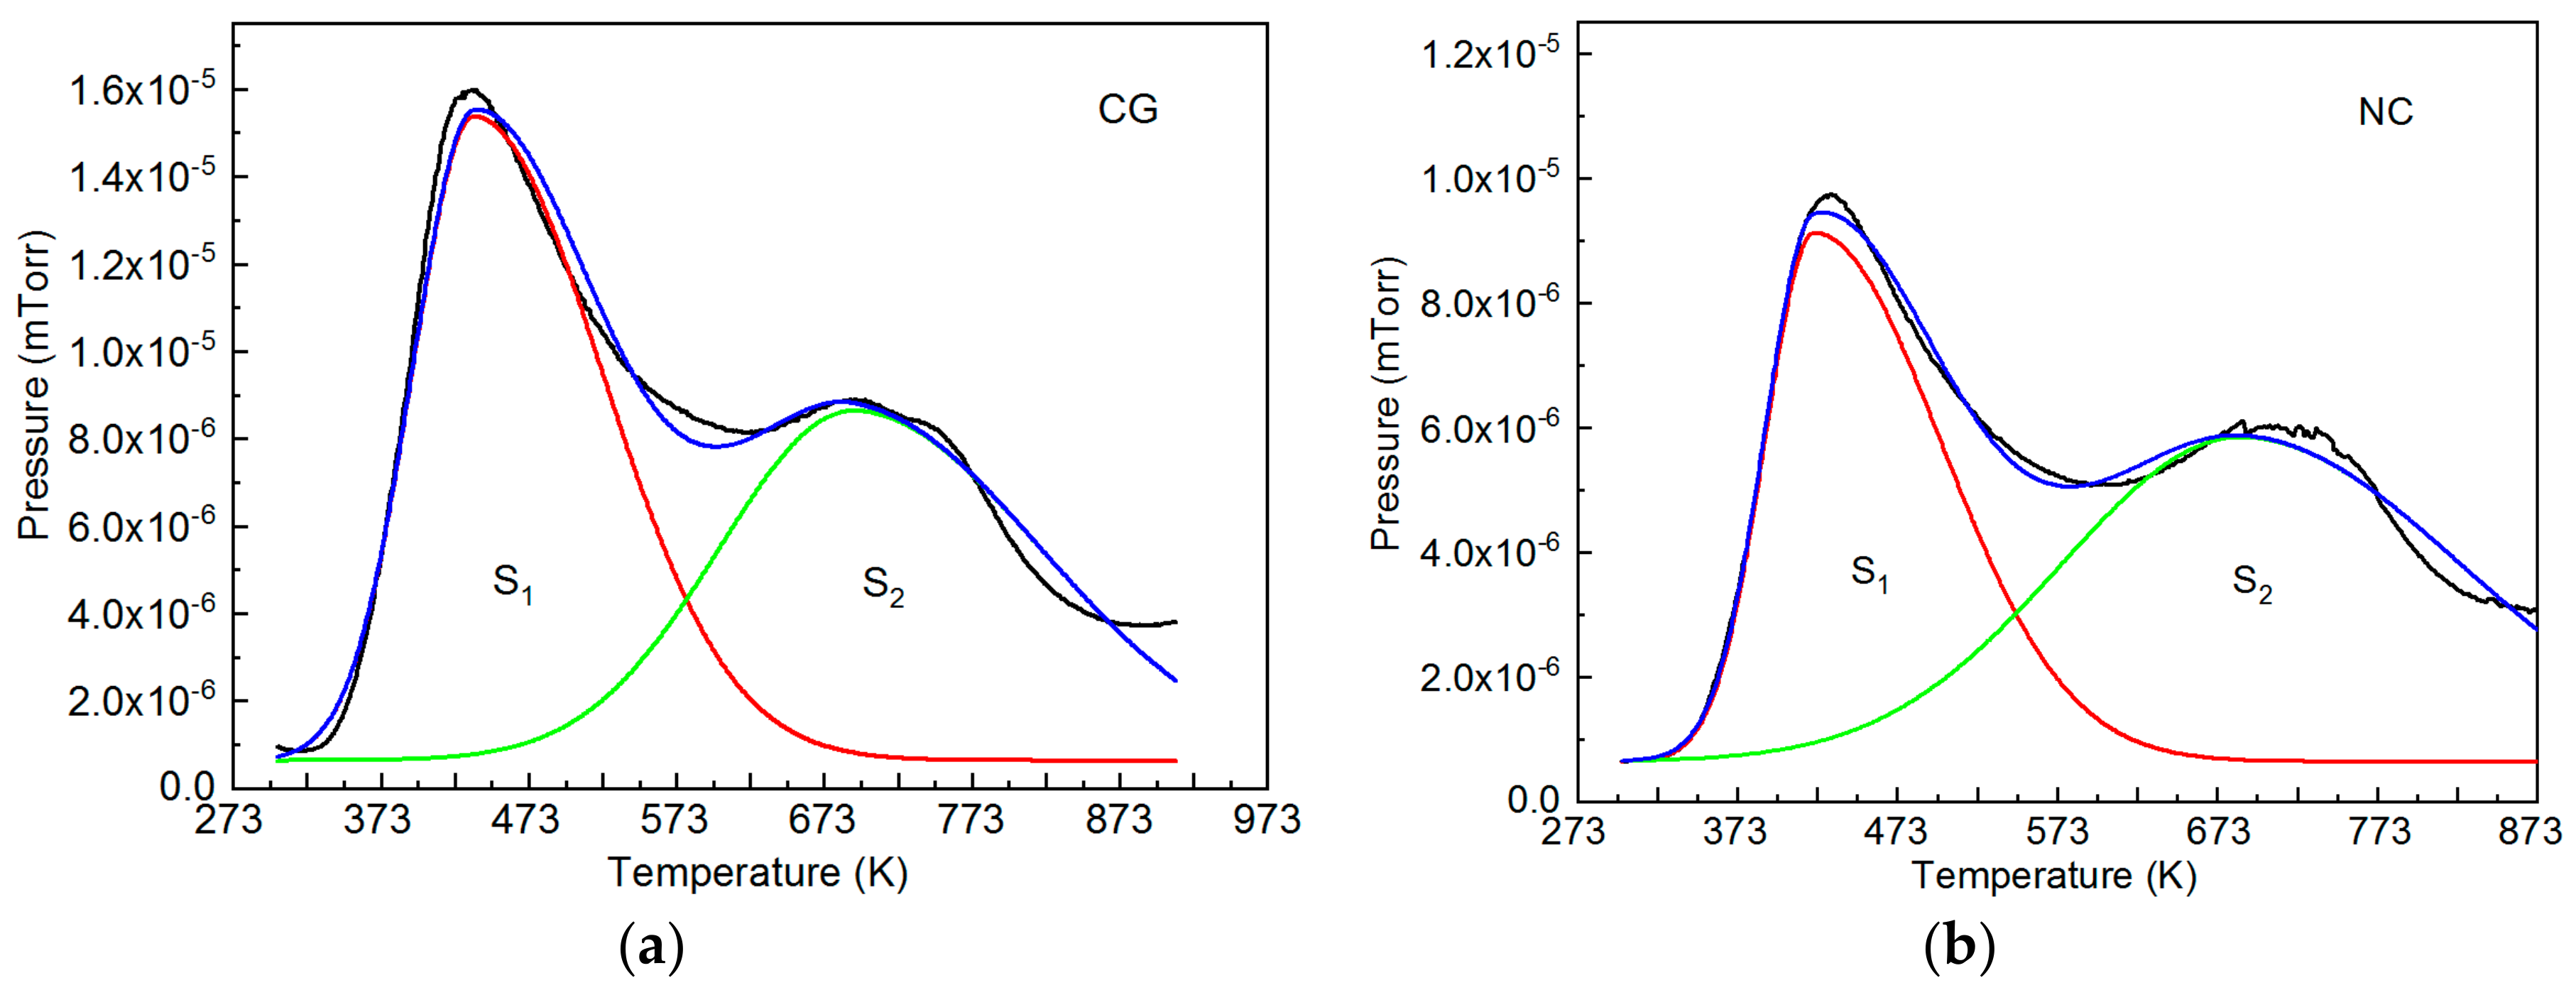
| Specimen Type | S1, Rel. Units | S2, Rel. Units |
|---|---|---|
| Coarse-grained | 0.53 | 0.47 |
| Nanocrystalline | 0.45 | 0.55 |
© 2019 by the authors. Licensee MDPI, Basel, Switzerland. This article is an open access article distributed under the terms and conditions of the Creative Commons Attribution (CC BY) license (http://creativecommons.org/licenses/by/4.0/).
Share and Cite
Baturin, A.; Lotkov, A.; Grishkov, V.; Rodionov, I.; Kabdylkakov, Y.; Kudiiarov, V. The Effect of Hydrogen on Martensite Transformations and the State of Hydrogen Atoms in Binary TiNi-Based Alloy with Different Grain Sizes. Materials 2019, 12, 3956. https://doi.org/10.3390/ma12233956
Baturin A, Lotkov A, Grishkov V, Rodionov I, Kabdylkakov Y, Kudiiarov V. The Effect of Hydrogen on Martensite Transformations and the State of Hydrogen Atoms in Binary TiNi-Based Alloy with Different Grain Sizes. Materials. 2019; 12(23):3956. https://doi.org/10.3390/ma12233956
Chicago/Turabian StyleBaturin, Anatoly, Aleksandr Lotkov, Victor Grishkov, Ivan Rodionov, Yerzhan Kabdylkakov, and Victor Kudiiarov. 2019. "The Effect of Hydrogen on Martensite Transformations and the State of Hydrogen Atoms in Binary TiNi-Based Alloy with Different Grain Sizes" Materials 12, no. 23: 3956. https://doi.org/10.3390/ma12233956
APA StyleBaturin, A., Lotkov, A., Grishkov, V., Rodionov, I., Kabdylkakov, Y., & Kudiiarov, V. (2019). The Effect of Hydrogen on Martensite Transformations and the State of Hydrogen Atoms in Binary TiNi-Based Alloy with Different Grain Sizes. Materials, 12(23), 3956. https://doi.org/10.3390/ma12233956