Obtaining Alumina from Kaolin Clay via Aluminum Chloride


 ,
,  and
and
Abstract
:1. Introduction
2. Materials and Methods
2.1. Materials
2.2. Characterization
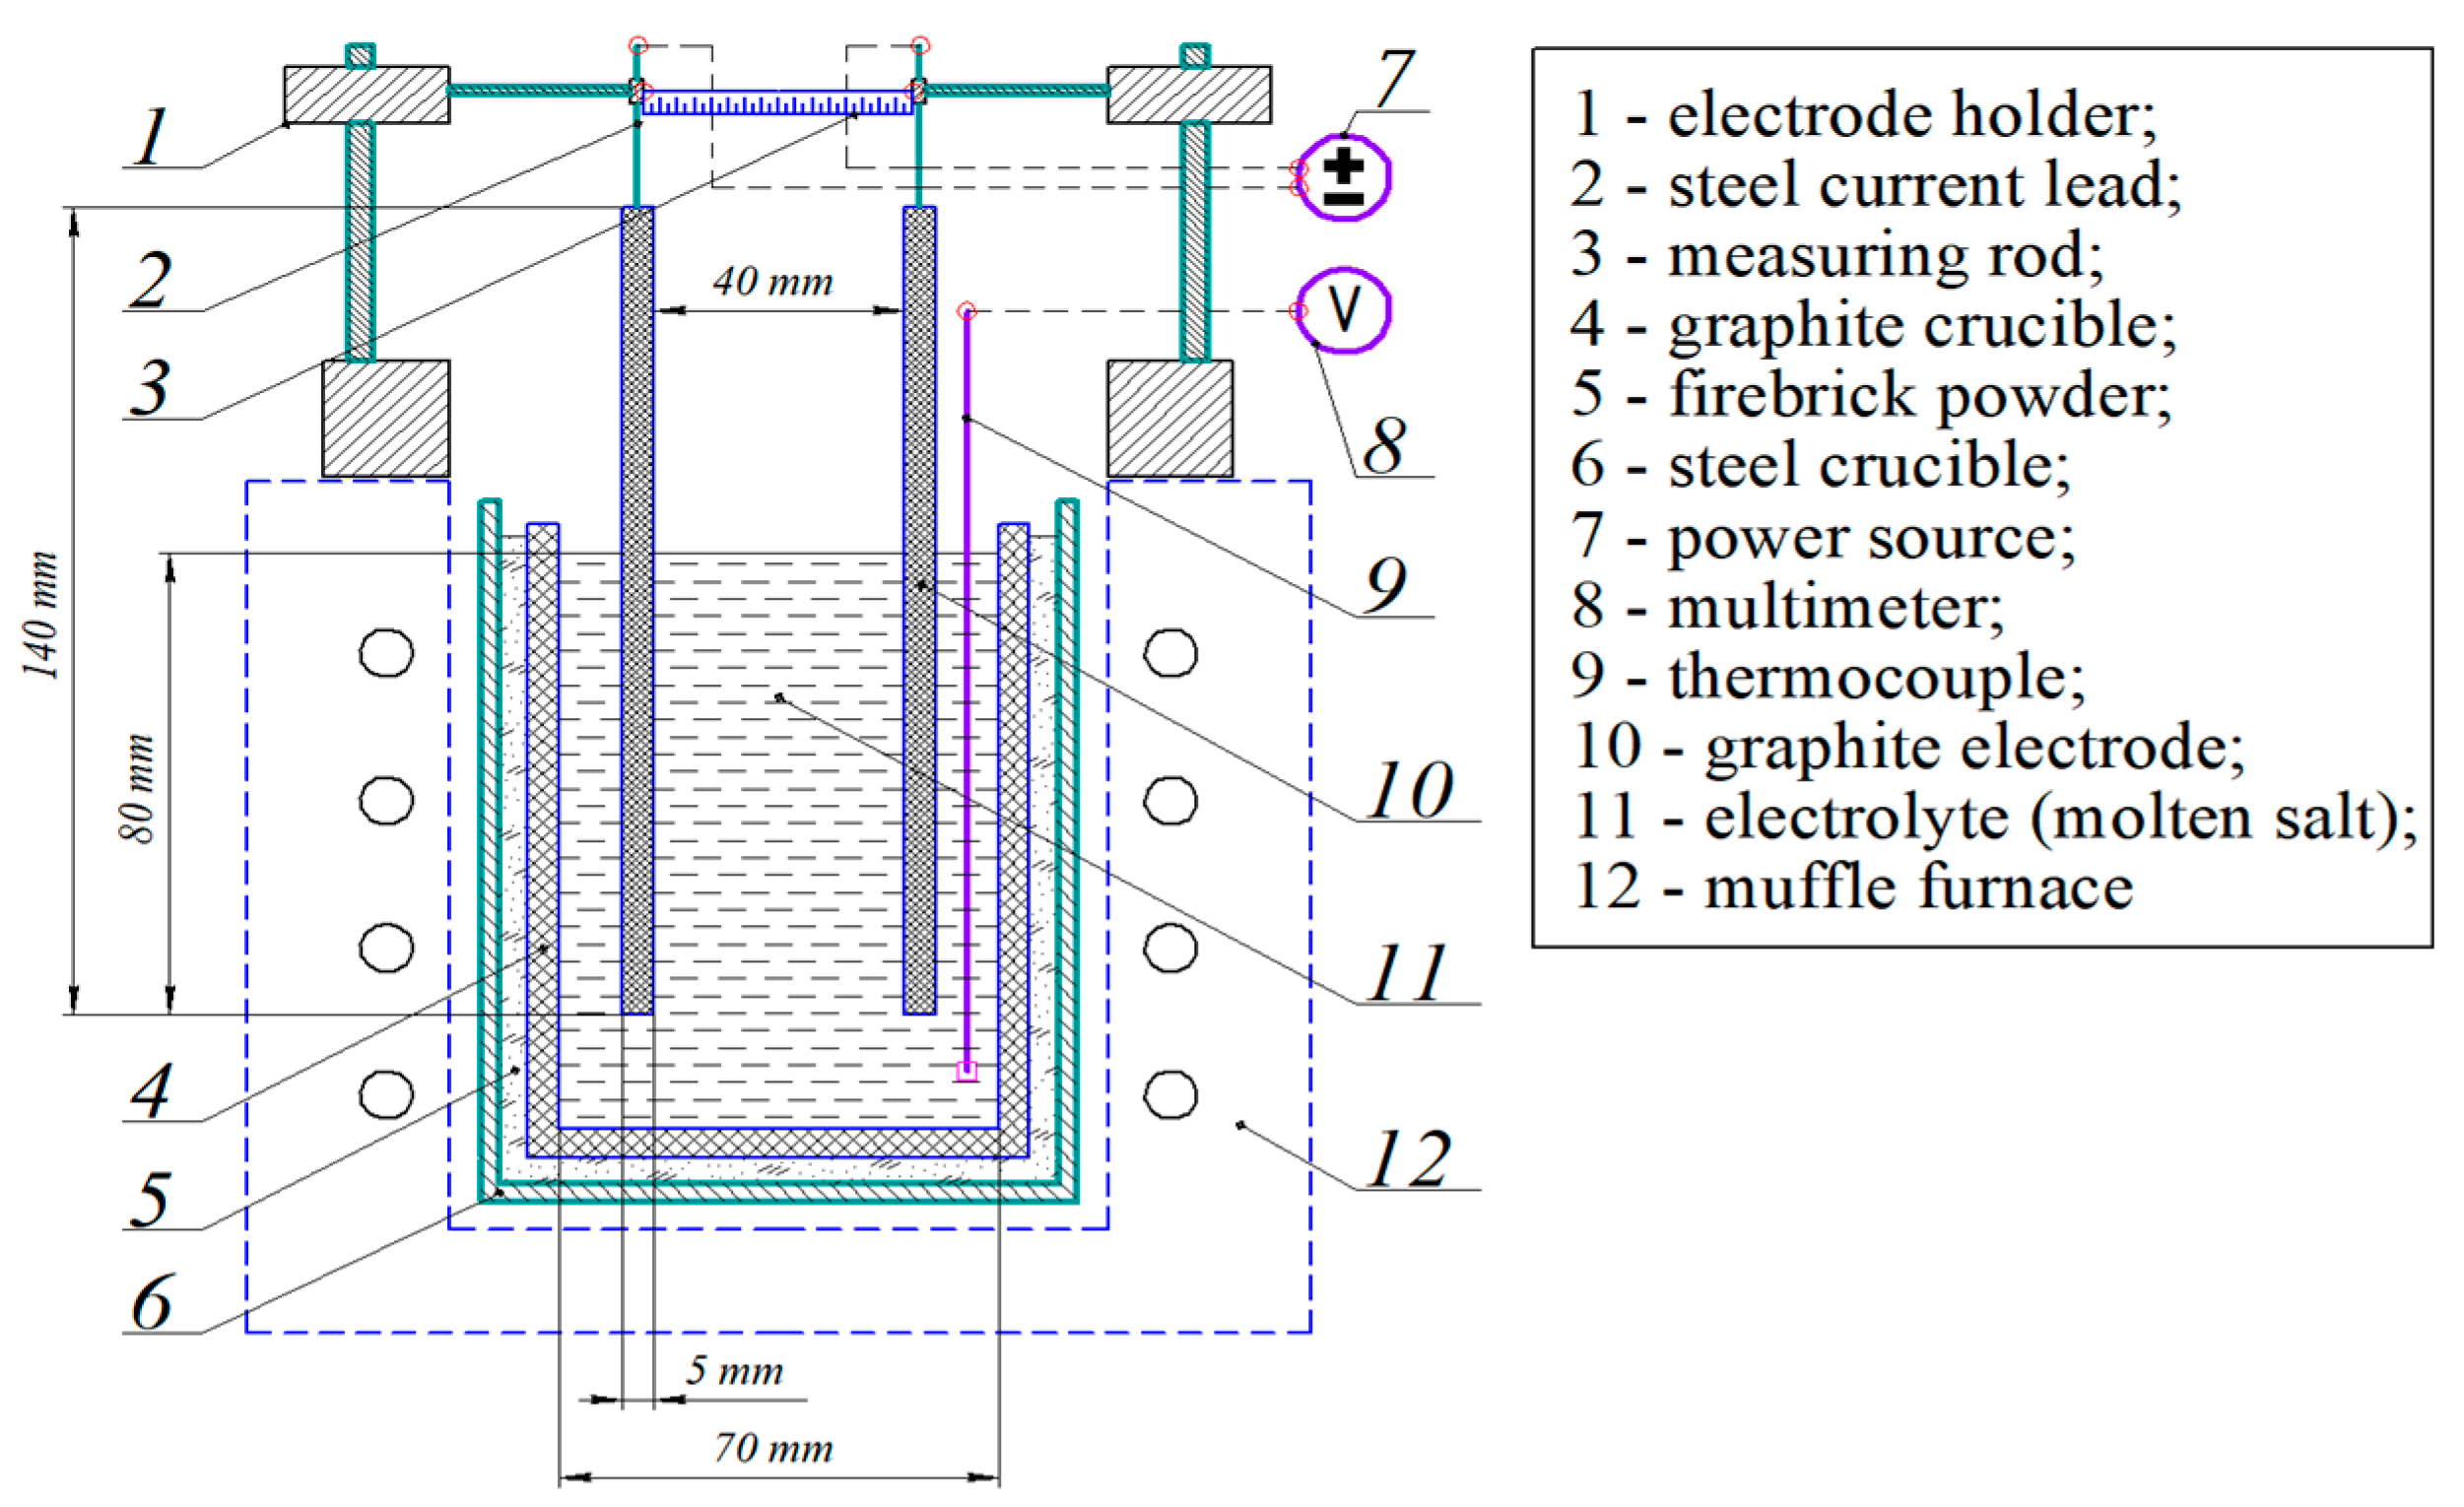
2.3. Experimental Research
3. Results and Discussion
- With smooth heating of the material to the operating temperature for 2 h, followed by 2 h of exposure at operating temperature;
- Thermal shock-placing of the material into a hot furnace with a 4 hr exposure at operating temperature.
4. Conclusions
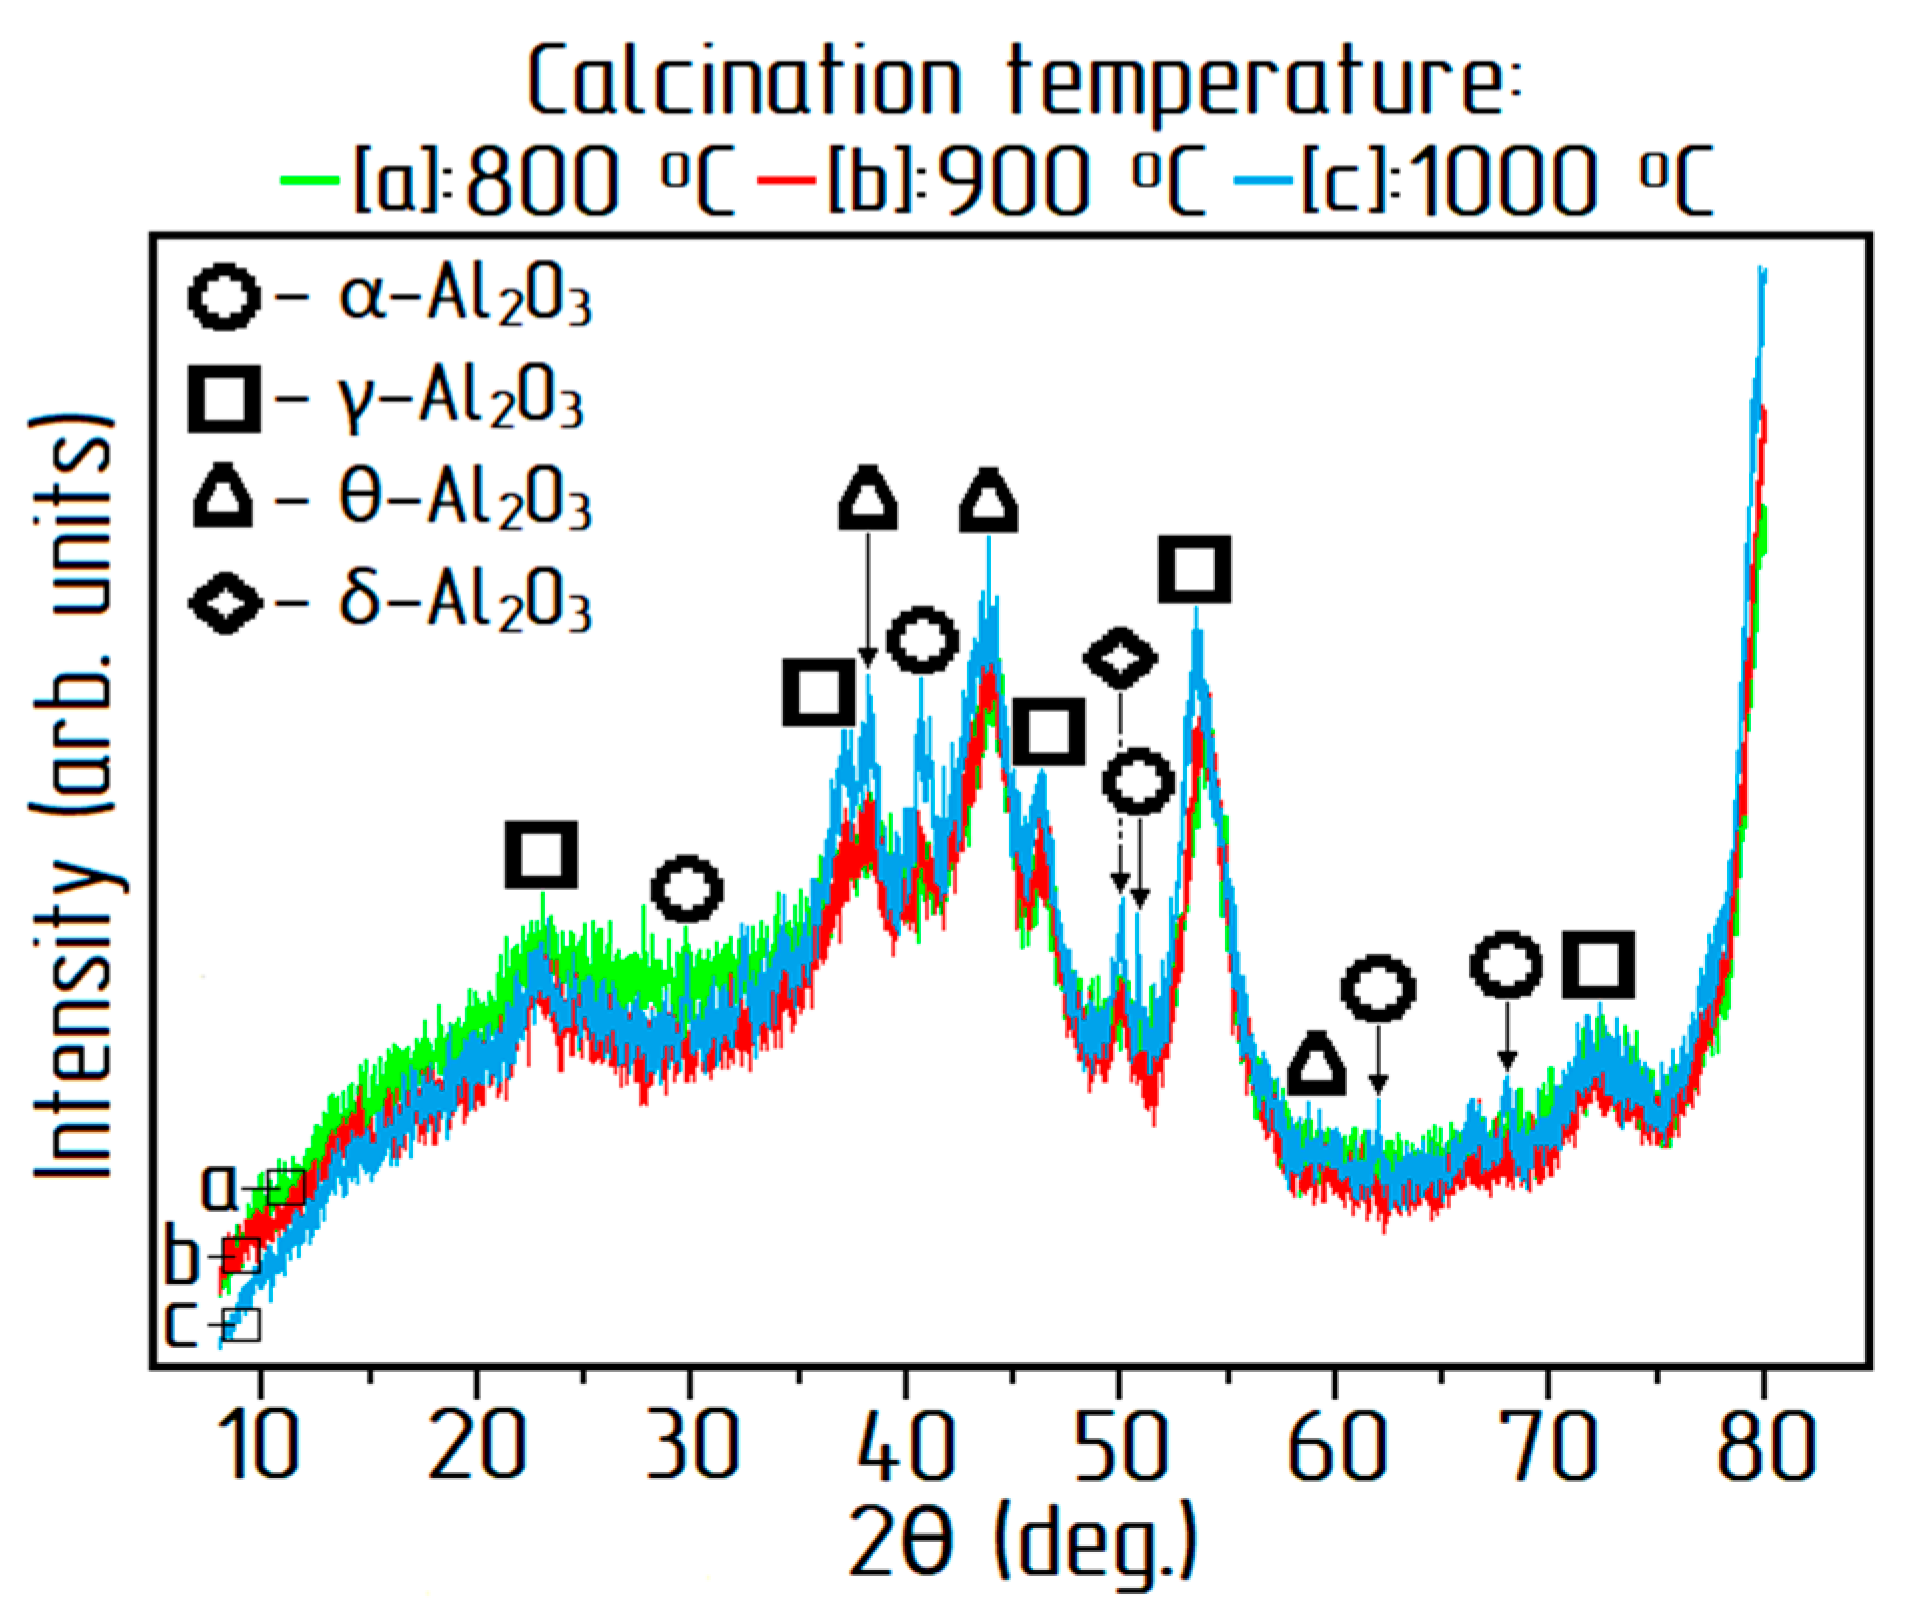
- In this study, the residual chlorine content at calcination temperatures between 450 °C and 1250 °C with a duration between 30 min and 90 min was studied. The minimum chlorine content in alumina of 0.05 wt % was obtained at a temperature of 1250 °C and a calcination duration of 90 min, but the samples were characterized by an increase in the α-phase content, which adversely affected the subsequent electrolysis of aluminum. The calcination of ACH below 900 °C contributed to an increased chlorine content in the final product. The optimal mode of aluminum chloride hexahydrate calcination was determined as 90 min at 900 °C;
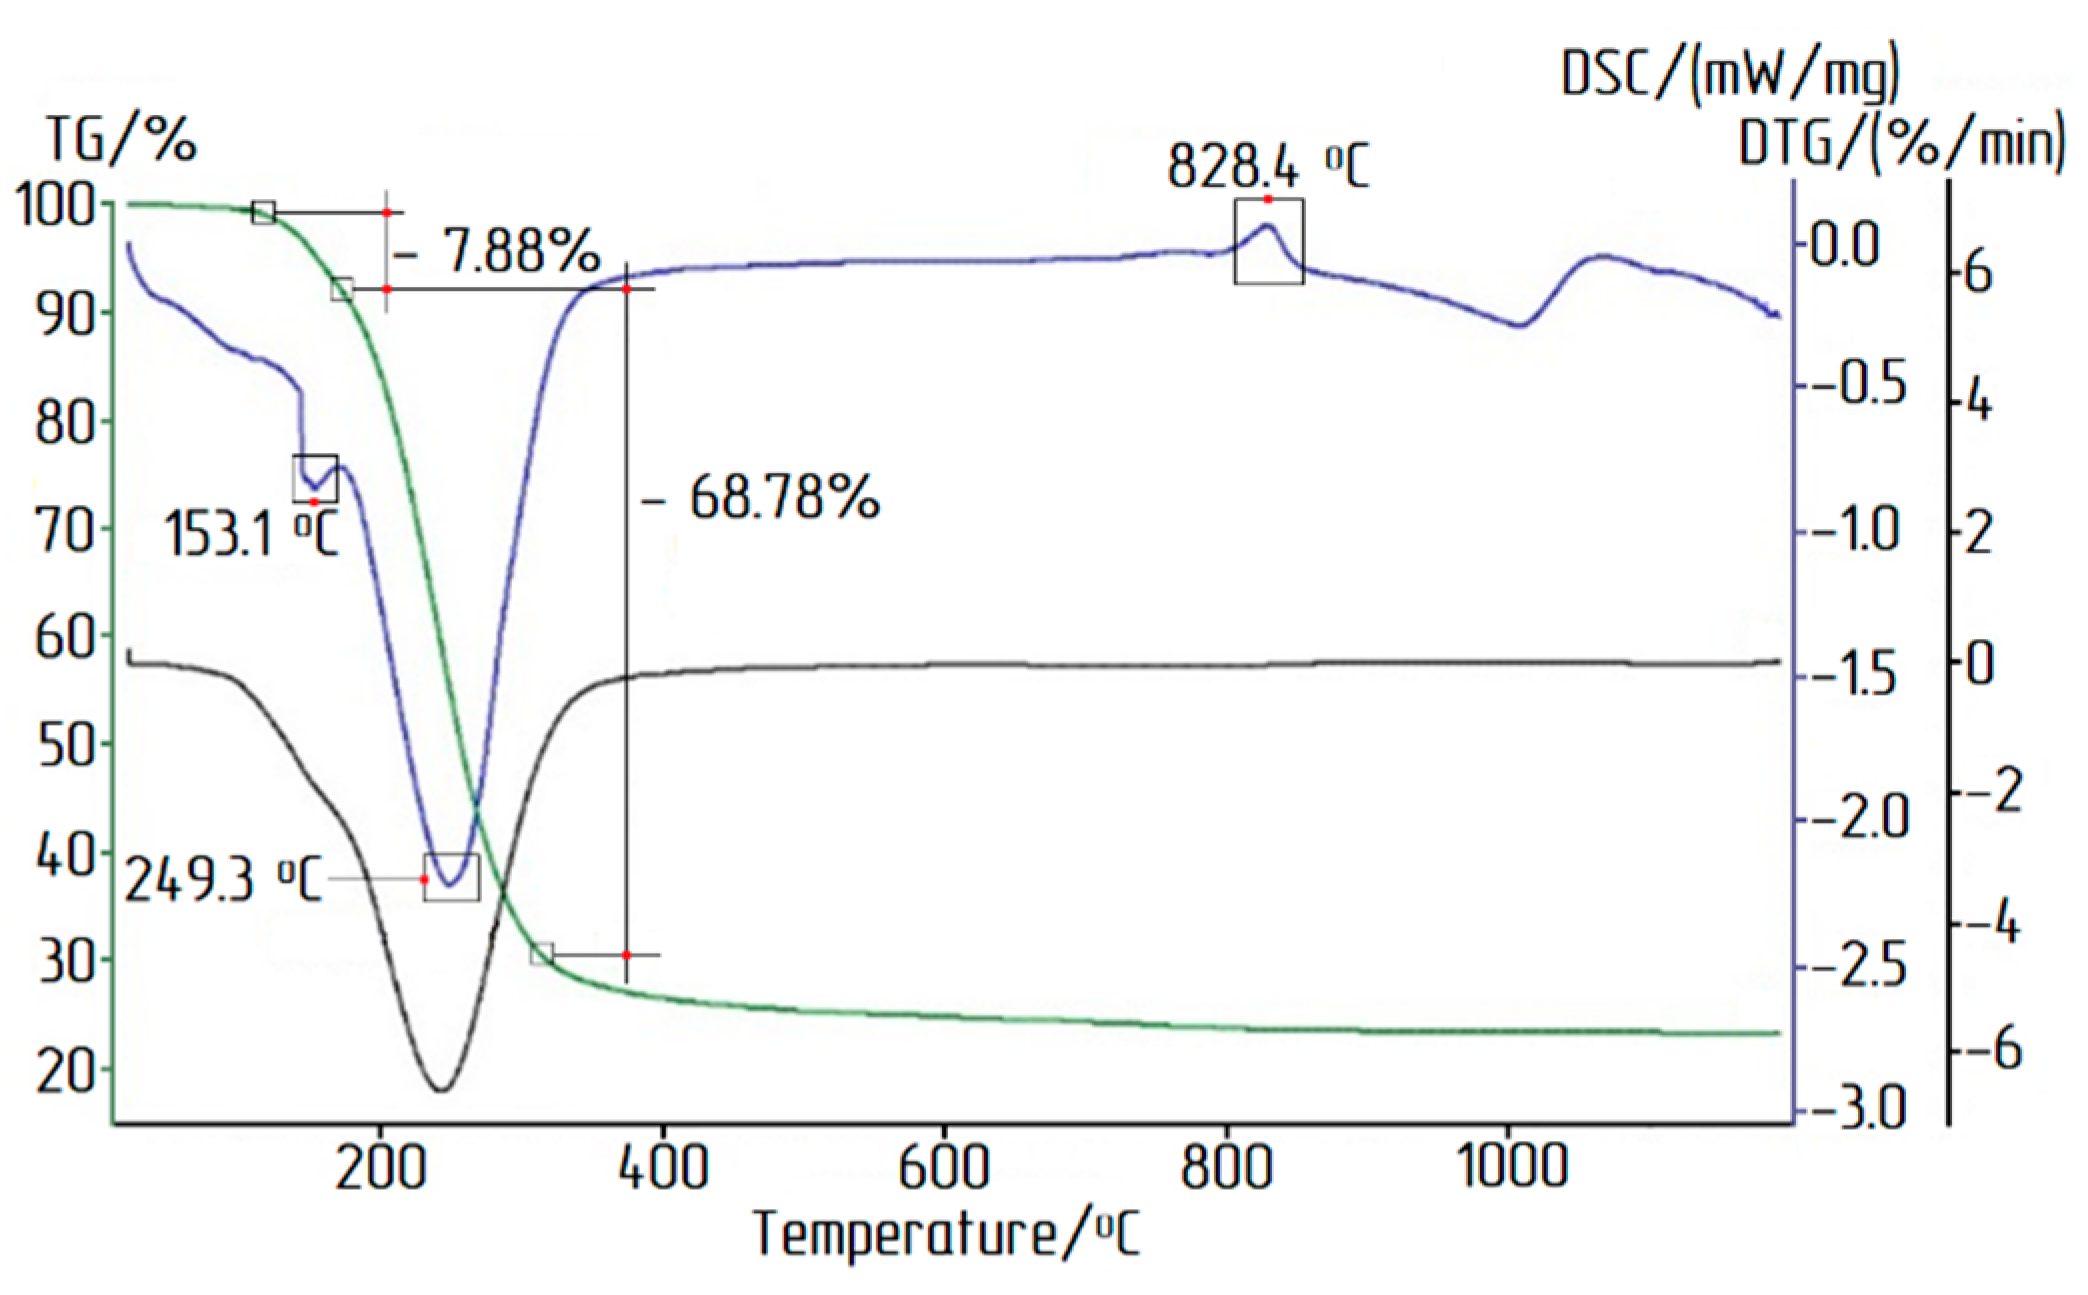
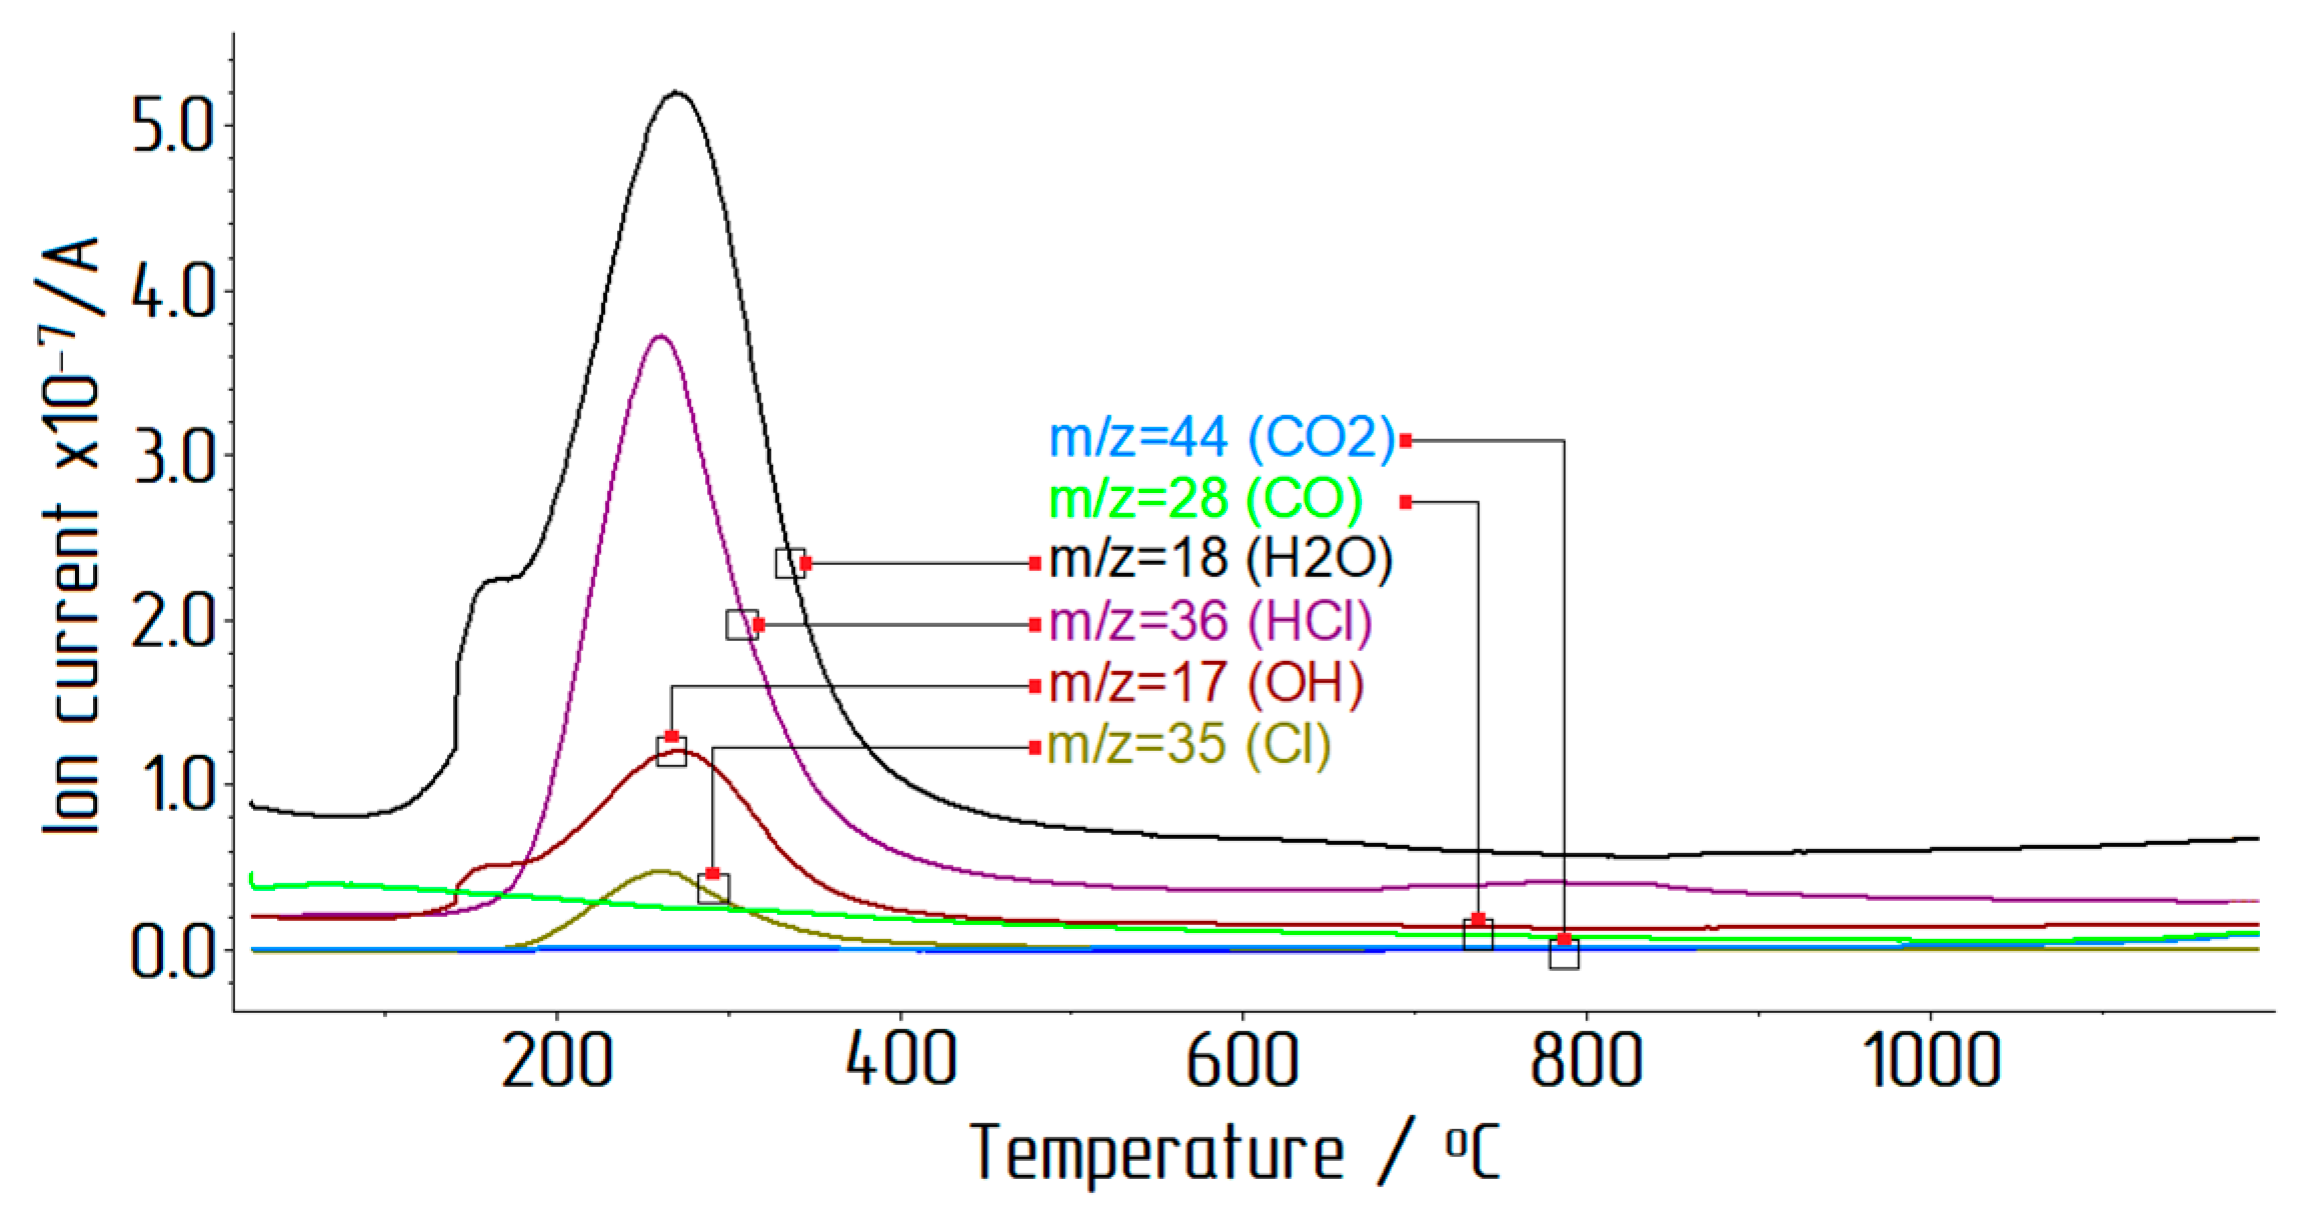
- During thermal decomposition of ACH crystals, the main part of water and chlorine precipitated during the heating up to 400 °C;
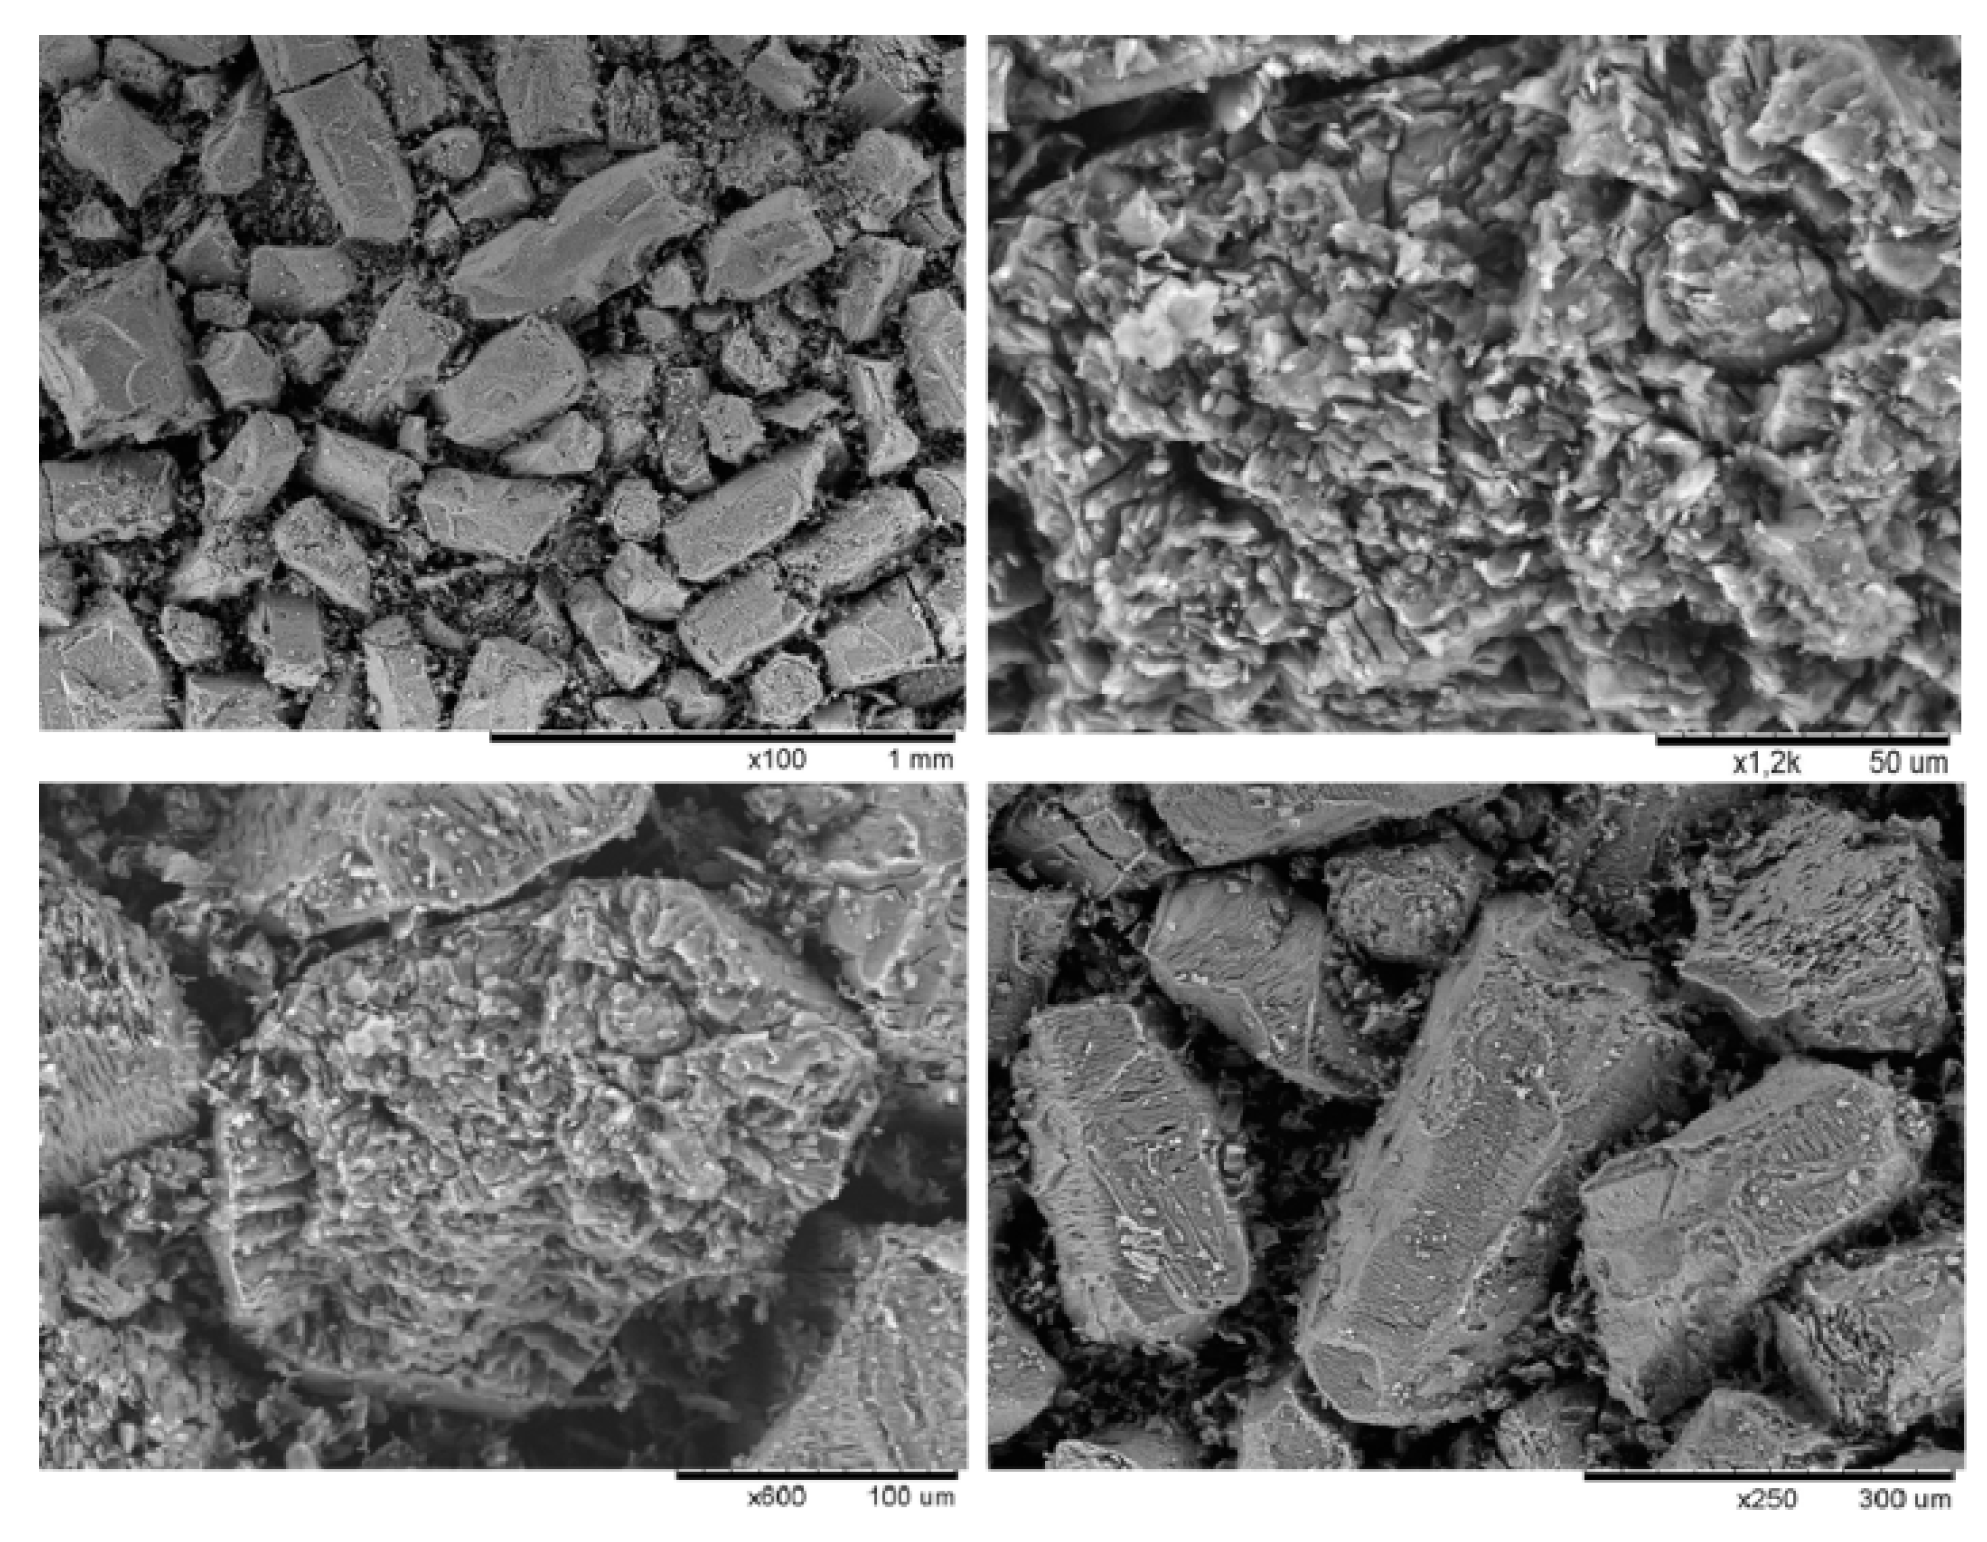
- The mode of calcination did not significantly affect the size of the obtained alumina. At the same time, the particle size during the calcination of ACH in both modes of calcination decreased by three times, from 450 microns for ACH to 150 microns for alumina;
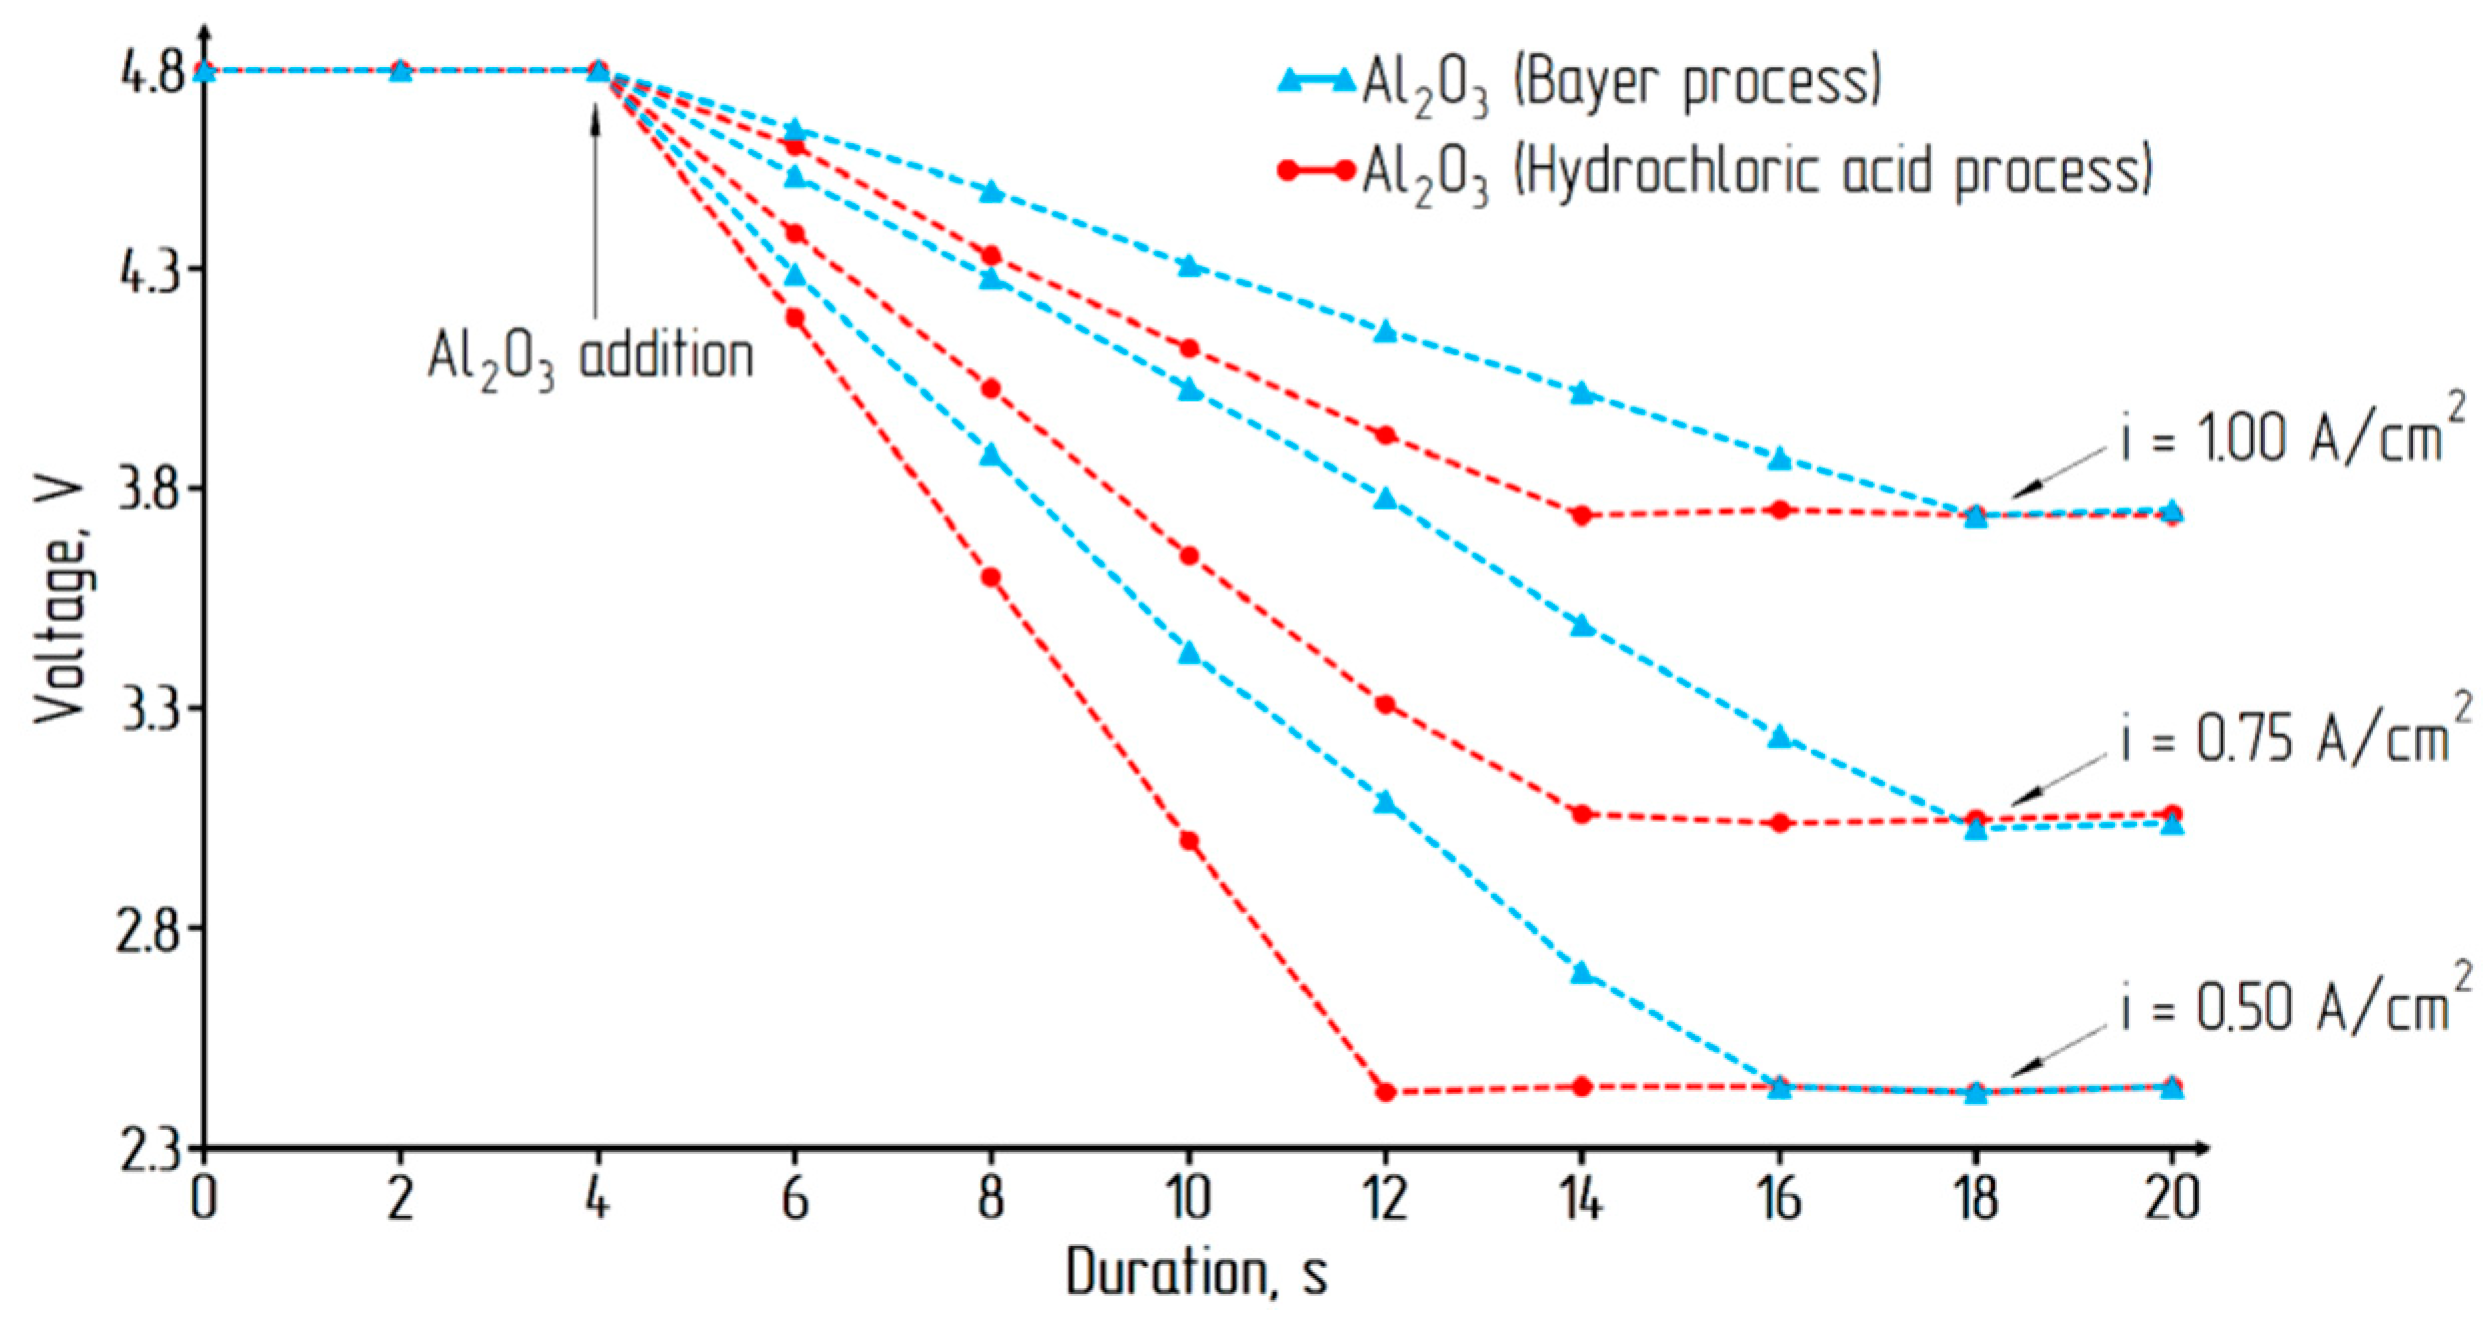
- The rate of Al2O3 in Na3AlF6 dissolution was studied. It was revealed that the dissolution of the alumina test sample in cryolite was faster than alumina obtained by the classical method (Bayer process).
Author Contributions
Funding
Conflicts of Interest
References
- Jiang, Y.; Xie, H.; Huang, L.; He, S. A novel technology study of separation silicon from a high silicon bauxite by direct flotation. Adv. Mater. Res. 2012, 524, 924–929. [Google Scholar] [CrossRef]
- Cheng, F.; Cui, L.; Miller, J.D.; Wang, X. Aluminum Leaching from Calcined Coal Waste Using Hydrochloric Acid Solution. Miner. Process. Extr. Metall. Rev. 2012, 33, 391–403. [Google Scholar] [CrossRef]
- Suss, A.G.; Damaskin, A.A.; Senyuta, A.S.; Panov, A.V.; Smirnov, A.A. The influence of the mineral composition of low-grade aluminum ores on aluminium extraction by acid leaching. Light Metals 2014, 9781118889084, 105–109. [Google Scholar]
- Kyriakogona, K.; Giannopoulou, I.; Panias, D. Extraction of Aluminium from Kaolin: A Comparative Study of Hydrometallurgical Processes. In Proceedings of the 3rd World Congress on Mechanical, Chemical, and Material Engineering (MCM’17), Rome, Italy, 8–10 June 2017. [Google Scholar]
- Valeev, D.V.; Mansurova, E.R.; Bychinskii, V.A.; Chudnenko, K.V. Extraction of Alumina from high-silica bauxite by hydrochloric acid leaching using preliminary roasting method. IOP Conf. Ser. Mater. Sci. Eng. 2015, 110, 012049. [Google Scholar] [CrossRef]
- Al-Zahrani, A.A.; Abdul-Majid, M.H. Extraction of Alumina from Local Clays by Hydrochloric Acid Process. JKAU Eng. Sci. 2009, 20, 29–41. [Google Scholar] [CrossRef]
- Zhao, A.; Zhang, T.; Lv, G.; Tian, W. Kinetics of the Leaching Process of an Australian Gibbsitic Bauxite by Hydrochloric Acid. Adv. Mater. Sci. Eng. 2016, 2016, 5813542. [Google Scholar] [CrossRef]
- ElDeeb, A.B.; Brichkin, V.N.; Kurtenkov, R.N.; Bormotov, I.S. Extraction of alumina from kaolin by a combination of pyro- and hydrometallurgical processes. Appl. Clay Sci. 2019, 172, 146–154. [Google Scholar] [CrossRef]
- Regina, O.A.; Okechukwu, D.O. Kinetic Model for Ukpor Clay Dissolution in Hydrochloric Acid Solution. J. Emerg. Trends Eng. Appl. Sci. 2012, 3, 448–454. [Google Scholar]
- Balmaev, B.G.; Kirov, S.S.; Pak, V.I.; Ivanov, M.A. Kinetics of high-temperature hydrochloric leaching of kaolin clays of east-siberian deposits in laboratory conditions and pilot plant tests. Tsvetnye Met. 2018, 3, 38–45. [Google Scholar] [CrossRef]
- Lima, P.A.; Angélica, R.; Neves, R. Dissolution kinetics of Amazonian metakaolin in hydrochloric acid. Clay Miner. 2017, 1, 75–82. [Google Scholar] [CrossRef]
- Wu, Y.; Li, L.; Li, M. Effect of Pressure on Alumina Extraction from Low-Grade Bauxite by Acid-Leaching Method. Light Met. 2014, 9781118889084, 121–123. [Google Scholar]
- Xiao, J.; Li, F.; Zhong, Q.; Bao, H.; Wang, B.; Huang, J.; Zhang, Y. Separation of aluminum and silica from coal gangue by elevated temperature acid leaching for the preparation of alumina and SiC. Hydrometallurgy 2015, 155, 118–124. [Google Scholar] [CrossRef]
- Zhang, L.; Wang, H.; Li, Y. Research on the extract Al2O3 from coal gangue. Adv. Mater. Res. 2012, 524, 1947–1950. [Google Scholar] [CrossRef]
- Demopoulos, G.P.; Li, Z.; Becze, L.; Moldoveanu, G.; Cheng, T.C.; Harris, B. New Technologies for HCl Regeneration in Chloride Hydrometallurgy. World Metall.-ERZMETALL 2008, 61, 89–98. [Google Scholar]
- Brown, C.J.; Olsen, D.R. Regeneration of hydrochloric acid pickle liquors by crystallization. In Proceedings of the Third International Symposium on Iron Control in Hydrometallurgy, Montreal, QC, Canada, 1–6 October 2006; pp. 831–843. [Google Scholar]
- Guo, Y.; Lv, H.; Yang, X.; Cheng, F. AlCl3·6H2O recovery from the acid leaching liquor of coal gangue by using concentrated hydrochloric inpouring. Sep. Purif. Technol. 2015, 151, 177–183. [Google Scholar] [CrossRef]
- Cheng, H.; Zhang, J.; Lv, H.; Guo, Y.; Cheng, W.; Zhao, J.; Cheng, F. Separating NaCl and AlCl3·6H2O crystals from acidic solution assisted by the non-equilibrium phase diagram of AlCl3-NaCl-H2O(-HCl) salt-water system at 353.15 K. Crystals 2017, 7, 244. [Google Scholar] [CrossRef]
- Linnikov, O.D.; Rodina, I.V.; Grigorov, I.G.; Polyakov, E.V. Kinetics and Mechanism of Spontaneous Crystallization of Potassium Nitrate from Its Supersaturated Aqueous Solutions. Cryst. Struct. Theory Appl. 2013, 2, 16–27. [Google Scholar]
- Guo, Y.; Yang, X.; Cui, H.; Cheng, F.; Yang, F. Crystallization behavior of AlCl3·6H2O in hydrochloric system. Huagong Xuebao/CIESC J. 2014, 65, 3960–3967. [Google Scholar]
- Wang, J.; Petit, C.; Zhang, X.; Cui, S. Phase equilibrium study of the AlCl3+ CaCl2+H2O system for the production of aluminum chloride hexahydrate from Ca-Rich Flue Ash. J. Chem. Eng. Data 2016, 61, 359–369. [Google Scholar] [CrossRef]
- Zhang, N.; Yang, Y.; Wang, Z.; Shi, Z.; Gao, B.; Hu, X.; Tao, W.; Liu, F.; Yu, J. Study on the thermal decomposition of aluminium chloride hexahydrate. Can. Metall. Q. 2018, 57, 235–244. [Google Scholar] [CrossRef]
- Hartman, M.; Trnka, O.; Šolcova, O. Thermal Decomposition of Aluminum Chloride Hexahydrate. Ind. Eng. Chem. Res. 2005, 44, 6591–6598. [Google Scholar] [CrossRef]
- Yurkov, A. Refractories for Aluminum: Electrolysis and the Cast House, 2nd ed.; Springer International Publishing: Cham, Switzerland, 2017; p. 276. [Google Scholar]
- Lysenko, A.P.; Kirov, S.S.; Selnitsyn, R.S.; Nalivayko, A.Y. Influence of calcined anode blocks design on gas outlet efficiency and technical indices of aluminium electrolysis process. Tsvetnye Met. 2013, 9, 114–117. [Google Scholar]
- Lysenko, A.P.; Tarasov, V.P.; Nalivayko, A.Y.; Selnitsyn, R.S. Obtaining of rare-earth metals by electrolysis method. Tsvetnye Met. 2013, 11, 71–74. [Google Scholar]
- Lacassagne, V.; Bessada, C.; Florian, P. Structure of high-temperature NaF-AlF3-Al2O3 melts: A multinuclear NMR study. J. Phys. Chem. B 2002, 106, 1862–1868. [Google Scholar] [CrossRef]
- Nalivaiko, A.Y.; Lysenko, A.P.; Pak, V.I.; Ivanov, M.A. Feasibility Assessment for Leucosapphire Production from Aluminum Oxide Prepared Electrochemically. Refract. Ind. Ceram. 2018, 55, 80–84. [Google Scholar] [CrossRef]
- Vlaskin, M.S.; Grigorenko, A.V.; Zhuk, A.Z.; Lisitsyn, A.V.; Sheindlin, A.E.; Shkol’nikov, E.I. Synthesis of high-purity α-Al2O3 from boehmite obtained by hydrothermal oxidation of aluminum. High Temp. 2016, 54, 322–329. [Google Scholar] [CrossRef]
- Moskvitin, V.I.; Nikolaev, I.V.; Fomin, B.A. Metallurgy of Light Metals; Intermet Engineering: Moscow, Russia, 2005. [Google Scholar]
- Kovrov, V.A.; Khramov, A.P.; Zaikov, Y.P.; Shurov, N.I. Effect of the Cationic Composition of Cryolite—Alumina Melts on the Anodic Overvoltage. Russ. J. Electrochem. 2007, 43, 909–919. [Google Scholar] [CrossRef]
- Huang, Y.; Lai, Y.; Tian, Z.; Li, J.; Liu, Y.; Li, Q. Electrical conductivity of (Na3AlF6-40%K 3AlF6)-AlF3-Al2O3 melts. J. Cent. South Univ. Technol. 2008, 15, 819–823. [Google Scholar] [CrossRef]
- Yang, J.; Li, W.; Yan, H.; Liu, D. Conductivity of KF-NaF-AlF3 System Low-temperature Electrolyte. In Minerals, Metals and Materials Series; Springer: Cham, Switzerland, 2016; pp. 689–693. [Google Scholar]


| Component | SiO2 | Al2O3 | Fe2O3 | TiO2 | CaO | Na2O | K2O | MgO | Loss on Ignition |
|---|---|---|---|---|---|---|---|---|---|
| Content, wt % | 50.71 | 28.77 | 6.14 | 0.42 | 0.43 | 0.18 | 0.23 | 0.72 | 12.40 |
| Component | AlCl3 | FeCl3 | NaCl | KCl | CaCl2 | MgCl2 | HCl |
|---|---|---|---|---|---|---|---|
| Content, wt % | 21.96 | 3.62 | 0.25 | 0.15 | 0.29 | 0.48 | 0.84 |
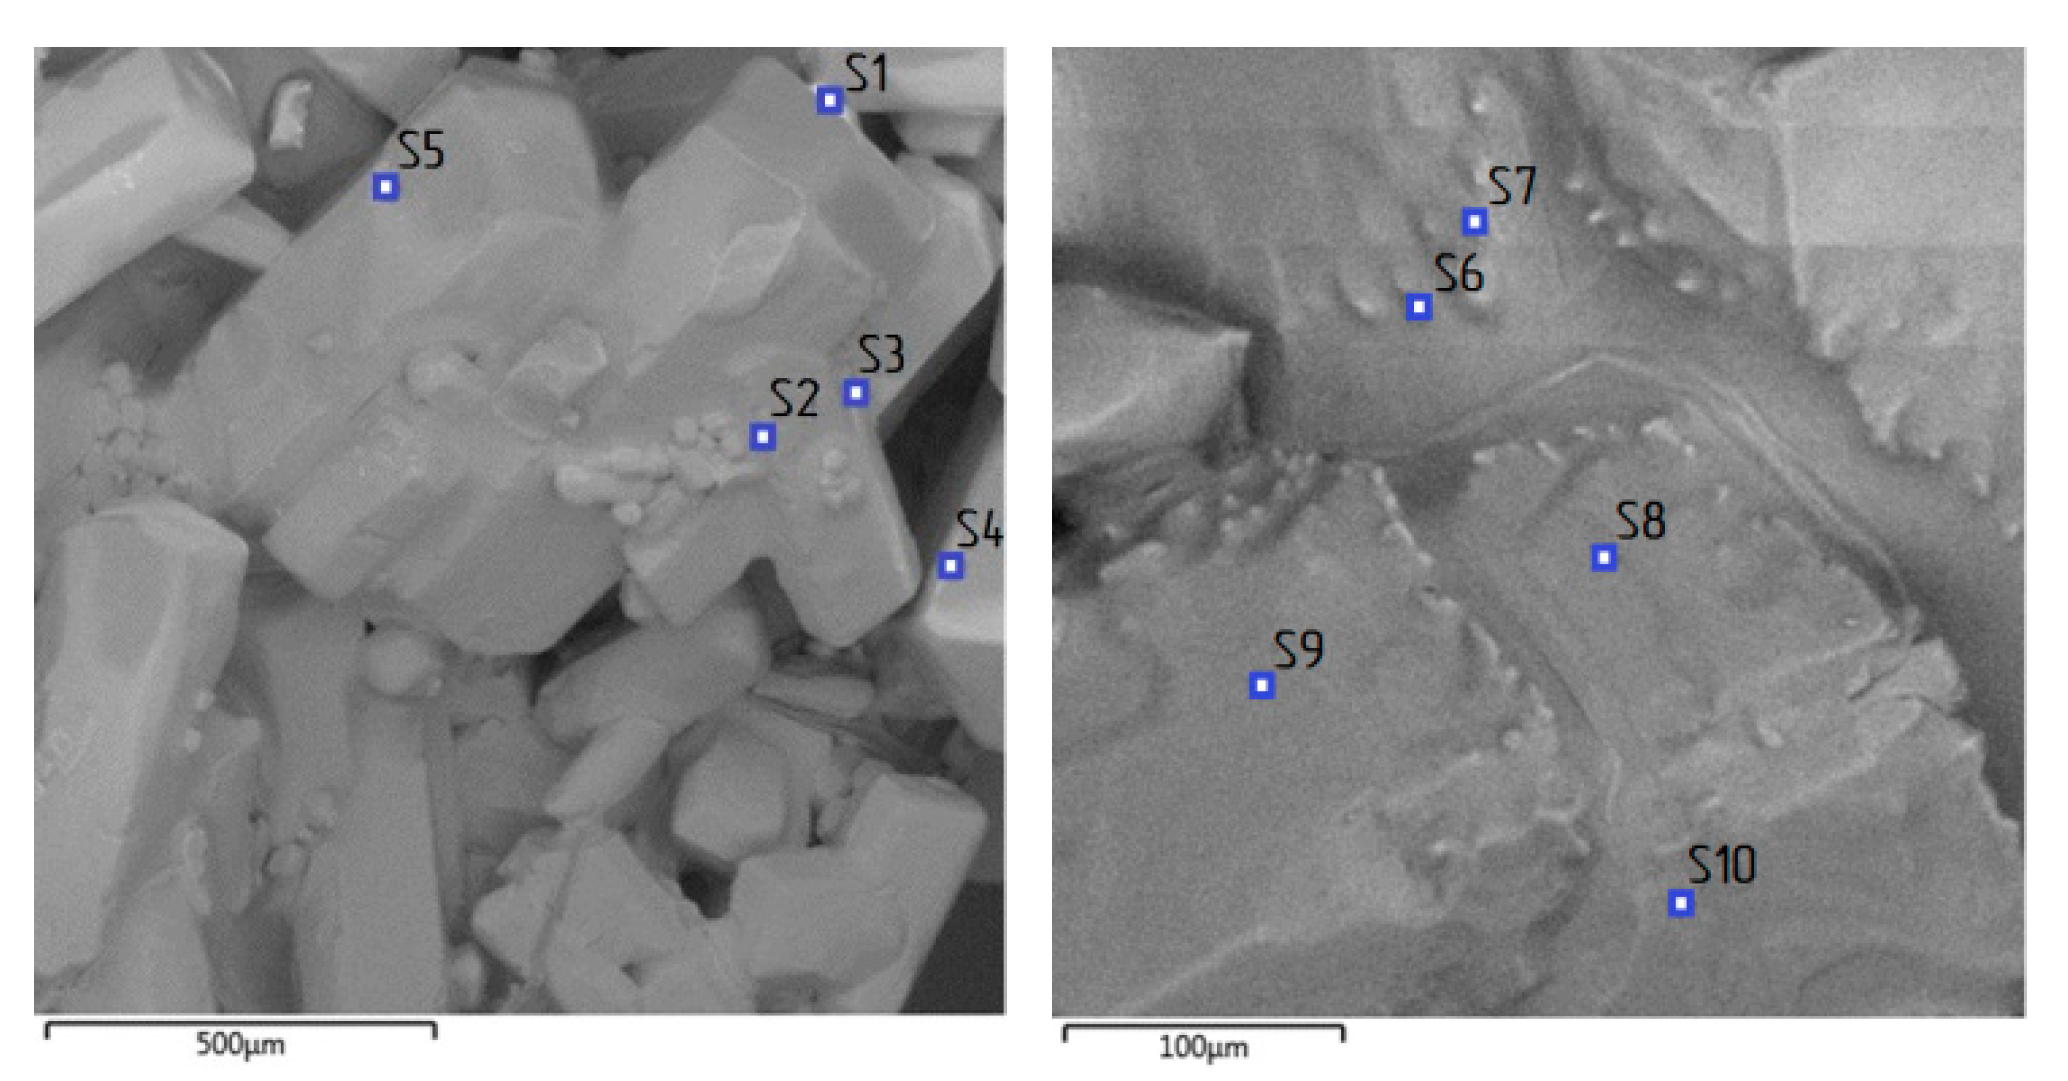
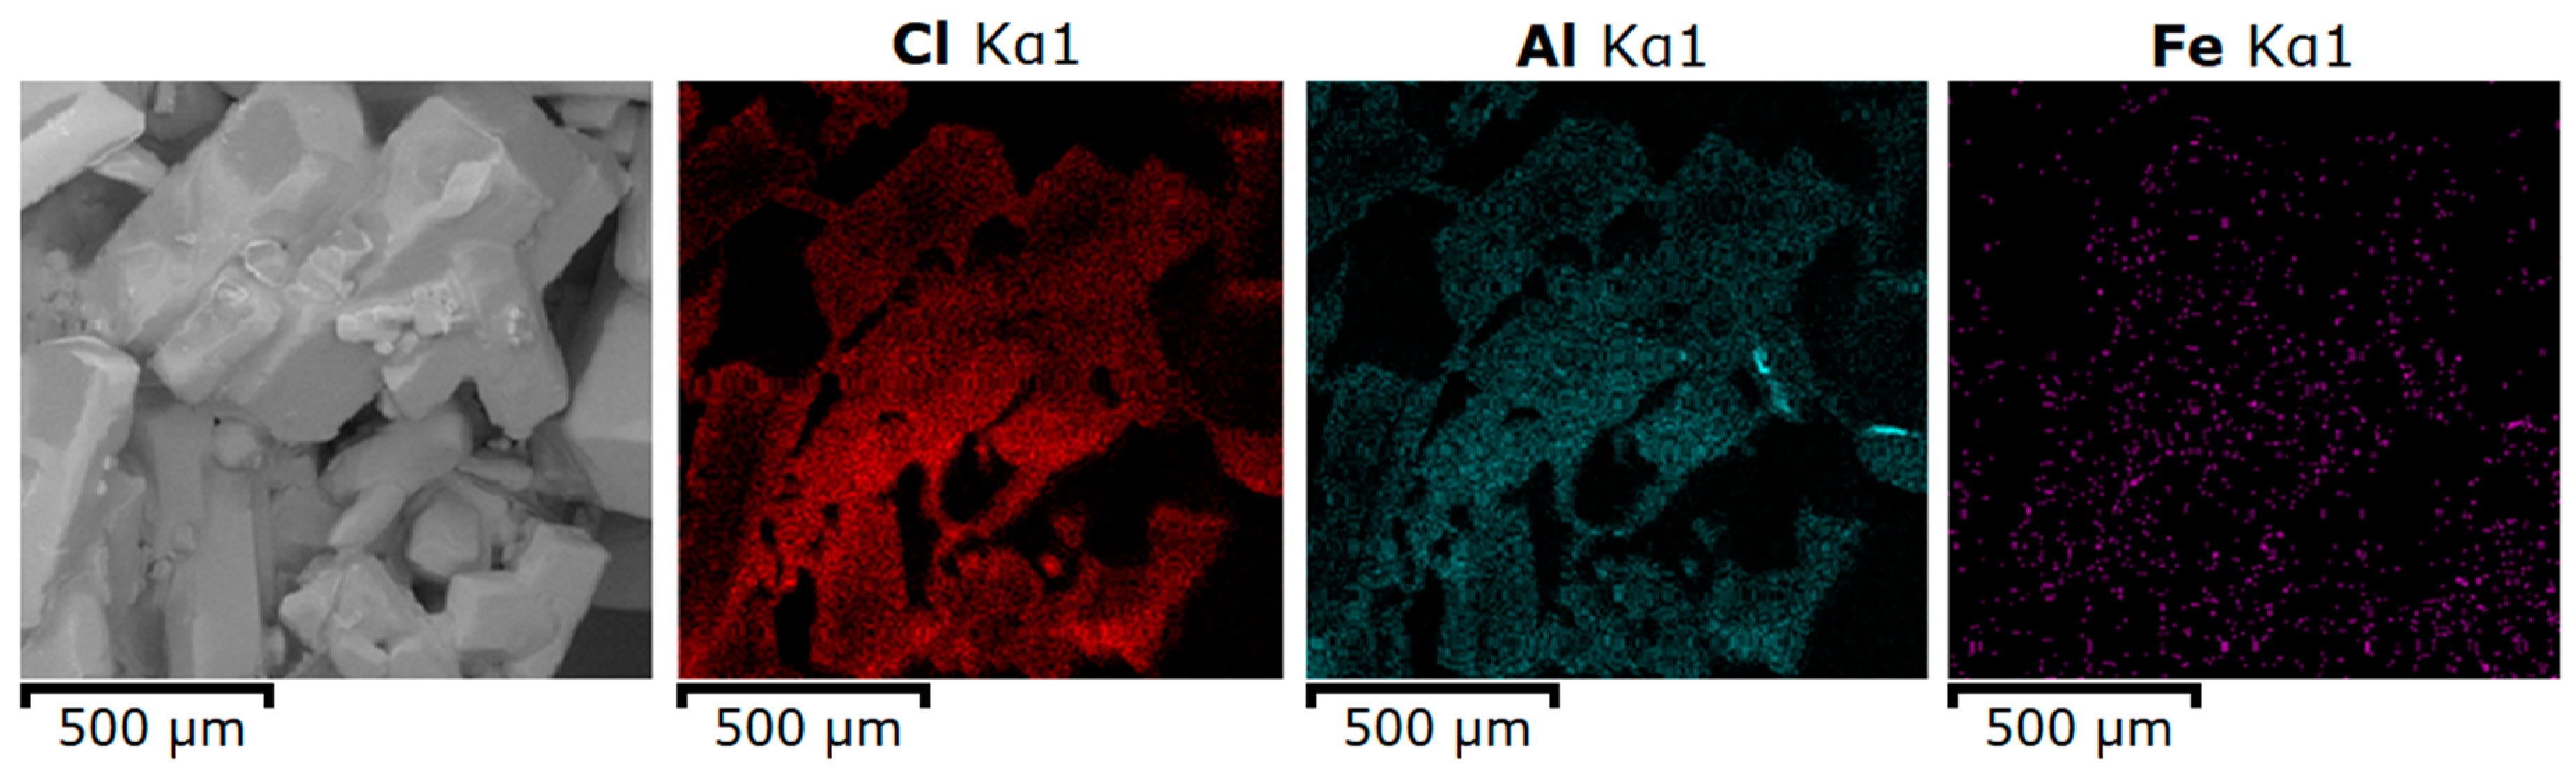
| Spectrum Label | O | Al | Cl | Fe | Total |
|---|---|---|---|---|---|
| S1 | 50.66 | 31.89 | 17.03 | 0.42 | 100.00 |
| S2 | 72.43 | 12.58 | 14.97 | 0.02 | 100.00 |
| S3 | 69.69 | 11.22 | 19.03 | 0.06 | 100.00 |
| S4 | 66.74 | 13.83 | 19.33 | 0.1 | 100.00 |
| S5 | 55.06 | 16.69 | 28.20 | 0.05 | 100.00 |
| S6 | 29.83 | 4.26 | 65.91 | 0.00 | 100.00 |
| S7 | 57.84 | 12.70 | 29.37 | 0.09 | 100.00 |
| S8 | 49.08 | 18.46 | 32.41 | 0.04 | 100.00 |
| S9 | 53.38 | 17.00 | 29.58 | 0.04 | 100.00 |
| S10 | 60.28 | 10.91 | 28.81 | 0.00 | 100.00 |
| Experiment Code | Temperature, ºС | Duration, min | Chlorine Content, wt % |
|---|---|---|---|
| 1 | 450 | 30 | 7.20 |
| 2 | 450 | 60 | 6.00 |
| 3 | 450 | 90 | 4.26 |
| 4 | 900 | 30 | 1.70 |
| 5 | 900 | 60 | 0.91 |
| 6 | 900 | 90 | 0.22 |
| 7 | 1250 | 30 | 0.12 |
| 8 | 1250 | 60 | 0.08 |
| 9 | 1250 | 90 | 0.05 |
| Temperature, °С | Al2O3 | MgO | Na2O | K2O | CaO | SiO2 | Fe2O3 | Cl |
|---|---|---|---|---|---|---|---|---|
| 800 | 99.362 | 0.043 | 0.003 | 0.010 | 0.028 | 0.005 | 0.015 | 0.534 |
| 900 | 99.678 | 0.047 | 0.003 | 0.007 | 0.029 | 0.007 | 0.020 | 0.209 |
| 1000 | 99.799 | 0.048 | 0.002 | 0.006 | 0.031 | 0.008 | 0.025 | 0.081 |
| Component | Average Content, wt % | Industrial Requirements, wt % |
|---|---|---|
| SiO2 | 0.006 | ≤0.020 |
| Fe2O3 | 0.020 | ≤0.030 |
| Na2O | 0.003 | ≤0.400 (Na2O + K2O) |
| K2O | 0.007 | |
| ТiO2 | <0.001 | ≤0.010 |
| CaO | 0.029 | Not specified |
| MgO | 0.045 | Not specified |
| Cl− | 0.21 | Not specified |
| Parameter | Current Density, A/cm2 | ||
|---|---|---|---|
| 0.50 | 0.75 | 1.00 | |
| Decomposition voltage, V | 1.15 | 1.15 | 1.15 |
| Polarization voltage, V | 0.04 | 0.04 | 0.04 |
| The voltage drop in the electrolyte, V | 1.25 | 1.87 | 2.55 |
| Total | 2.44 | 3.06 | 3.74 |
| Resistivity of the electrolyte, Om·cm | 0.625 | 0.623 | 0.637 |
| The parameters of electrolysis: interelectrode distance = 4 cm; temperature = 1200 °С; electrolyte composition = 5 wt % Al2O3; 95 wt % Na3AlF6 (2.7 cryolite ratio) | |||
© 2019 by the authors. Licensee MDPI, Basel, Switzerland. This article is an open access article distributed under the terms and conditions of the Creative Commons Attribution (CC BY) license (http://creativecommons.org/licenses/by/4.0/).
Share and Cite
Pak, V.I.; Kirov, S.S.; Nalivaiko, A.Y.; Ozherelkov, D.Y.; Gromov, A.A. Obtaining Alumina from Kaolin Clay via Aluminum Chloride. Materials 2019, 12, 3938. https://doi.org/10.3390/ma12233938
Pak VI, Kirov SS, Nalivaiko AY, Ozherelkov DY, Gromov AA. Obtaining Alumina from Kaolin Clay via Aluminum Chloride. Materials. 2019; 12(23):3938. https://doi.org/10.3390/ma12233938
Chicago/Turabian StylePak, Vyacheslav I., Sergey S. Kirov, Anton Yu. Nalivaiko, Dmitriy Yu. Ozherelkov, and Alexander A. Gromov. 2019. "Obtaining Alumina from Kaolin Clay via Aluminum Chloride" Materials 12, no. 23: 3938. https://doi.org/10.3390/ma12233938
APA StylePak, V. I., Kirov, S. S., Nalivaiko, A. Y., Ozherelkov, D. Y., & Gromov, A. A. (2019). Obtaining Alumina from Kaolin Clay via Aluminum Chloride. Materials, 12(23), 3938. https://doi.org/10.3390/ma12233938