Article

Effects of Corrosion on Mechanical Properties of Welded Carbon Steel Pipe in District Heating Water

1
School of Advanced Materials Science and Engineering, Sungkyunkwan University, 2066, Seobu-ro, Jangan-gu, Suwon 16419, Korea
2
Technical Efficiency Research Team, Korea District Heating Corporation, 92 Gigok-ro, Yongin, Gyeonggi 06340, Korea
*
Author to whom correspondence should be addressed.
Materials 2019, 12(22), 3682; https://doi.org/10.3390/ma12223682
Submission received: 24 September 2019 / Revised: 1 November 2019 / Accepted: 5 November 2019 / Published: 8 November 2019
(This article belongs to the Special Issue Structure and Mechanical Properties of Alloys)

Abstract

:
This study examined the effect of corrosion on mechanical properties of welded carbon steel pipe in district heating water. To evaluate the corrosion properties, potentiodynamic tests were conducted and a galvanostatic test was used to accelerate corrosion. Tensile tests and microstructure observations were performed to figure out the degradation of the corroded region, and stress intensity factors were calculated. As a result of the potentiodynamic tests, welded carbon steel pipe showed uniform corrosion and the total charge was calculated. Using the galvanostatic test, the current density at the equivalent aging time was applied to the specimens. The tensile tests showed that according to corrosion damages, mechanical properties were degraded due to corrosion. Through the microstructure observations and calculations of stress intensity factors, the corrosion of the welded carbon steel pipe induced the degradation of mechanical properties. The mode of fracture was changed from ductile to brittle fracture with increasing aging time.

1. Introduction

A district heating system is a utility energy service based on the supply of heat to remote customers from accessible heat sources [1]. A district heating system has several merits, such as being safe, convenient, and reducing costs without the need for additional equipment for heating in each individual building or household [2]. One of the most frequently used materials in district heating pipelines is a carbon steel pipe due to its availability and low cost [3,4,5,6,7,8].
Carbon steel pipe has advantages of availability and increased strength, but also has disadvantages of crack, fatigue, and corrosion problems in weld zone. Welding is a common method which is used for construction of long-distance district heating pipelines [9]. In the welding process of carbon steel pipe, the heat-affected zone (HAZ) is formed with several microstructures which are different from the base metal [10,11,12]. HAZ has different microstructures such as coarse grain ferrite, fine grain ferrite, and intercritical structures which are composed of freshly transformed martensite and ferrite. These different microstructures result in large variations in the strength values across the weld joints and cause electrochemical potential difference of individual parts in weldment. This induces corrosion among base metal-weld zone couples exposed to corrosive environments [13,14].
Due to the difference of corrosion rates among the base metal-weld zone, the deepest corroded point where stress concentration can occur is formed. Localized corrosion is regarded as the most hazardous type of damage since it requires less mass loss to cause pipe failures compared with uniform corrosion [15]. If stress concentration occurs at a point, the stress intensity factor (SIF) can be increased with the decrease of toughness and a brittle fracture can occur. Therefore, the failure of welded carbon steel pipes can be caused by this phenomenon. To investigate causes of the fractfure, the effect of corrosion on the mechanical properties has to be studied. There are many studies on the corrosion of steel reinforcement which leads to the degradation of the mechanical properties of the steel [16,17,18,19]. These conclude that the degradation of the mechanical properties was caused by the effective engineering stress that was increased by mass loss through corrosion. However, the materials in these studies were homogeneous, unlike welded carbon steel, and were confined to reinforcement bars. There is also a lack of research on the failure of welded carbon steel caused by corrosion.
In this study, welded carbon steel pipe (SPW 400) was used to evaluate the change of its mechanical properties according to corrosion accelerations performed at various quantities of electric charges. To investigate corrosion properties of the carbon steel pipe weldment, a potentiodynamic polarization test was carried out and the quantity of electric charge was calculated. For corrosion acceleration, the galvanostatic method based on results of the potentiodynamic tests was used. The mechanical properties according to the corrosion damages were evaluated by tensile tests. After that, microstructures of crack front were observed by optical microscope (OM) to investigate the change of crack initiation sites according to morphology. The fracture surfaces were observed by scanning electron microscope (SEM) to indicate the type of fractures. The stress analysis simulations and calculations of stress intensity factors were conducted to investigate the cause of failure.

2. Materials and Methods

2.1. Specimen and Solution Preparation

Carbon steel pipe for district heating system was used as the specimen and the chemical composition of the specimen is listed in Table 1. Pipes were welded by gas tungsten arc welding (GTAW) following specifications in Table 2. After welding, tensile test specimens were sectioned from welded pipes as shown in Figure 1.
For the electrochemical test, the surface of the specimen was polished with 600-grit silicon carbide (SiC) paper and rinsed in an ultrasonic bath with ethanol, and finally dried with N2 gas. Deaerated synthetic district heating water at 60 °C and a pH of 10.0 was prepared for the corrosion medium. The chemical composition of the synthetic district heating water is listed in Table 3.

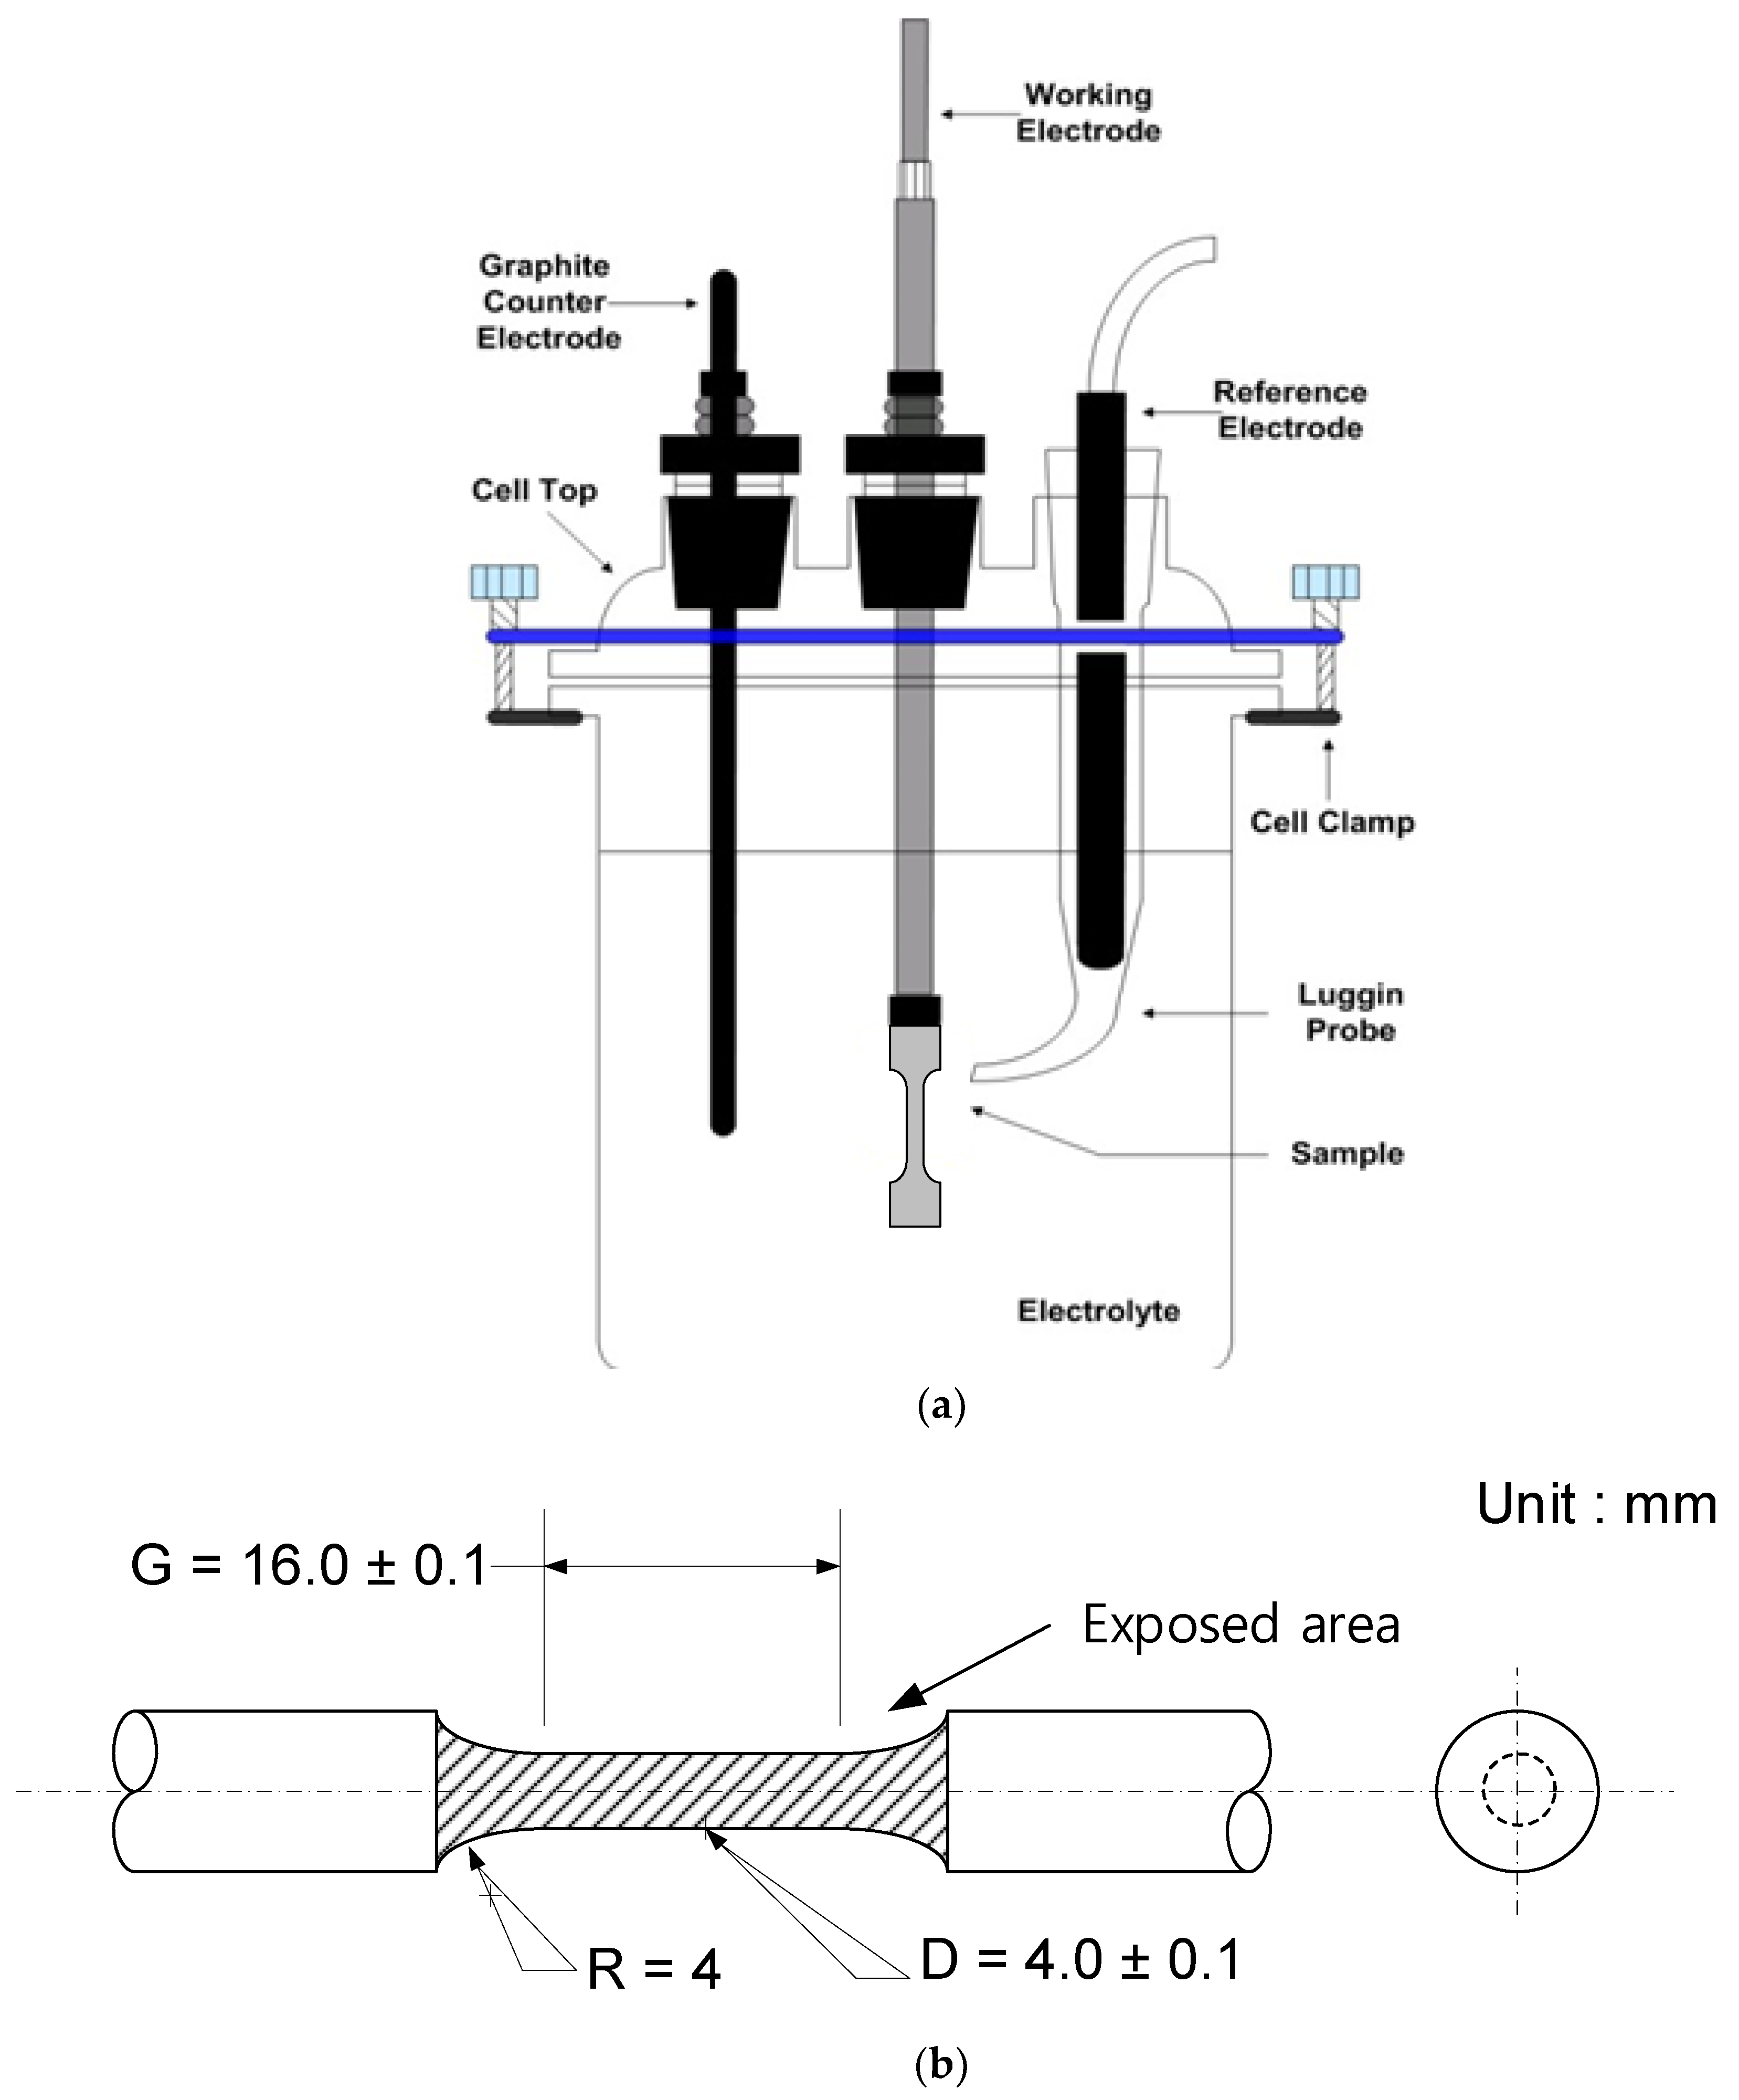
2.2. Potentiodynamic Polarization Test

A potentiodynamic polarization test was carried out for evaluating corrosion properties by using a conventional three-electrode cell as shown in Figure 2a. The test specimen as the working electrode, a saturated calomel electrode (SCE) as the reference electrode, and graphite as the counter electrodes were used. The exposed area of the specimen was 3.9 cm2 from weld zone to base metal as shown in Figure 2b. The experiments were conducted in accordance with ASTM G5 [20] using a Model VSP-300 potentiostat (Biologic, Seyssinet-Pariset, France). An open circuit potential was established within 6 h before the electrochemical test. After that, a polarization test was performed at a scanning rate of 0.166 mV/s from −0.250 VOCP to +1.6 VSCE.

2.3. Galvanostatic Method
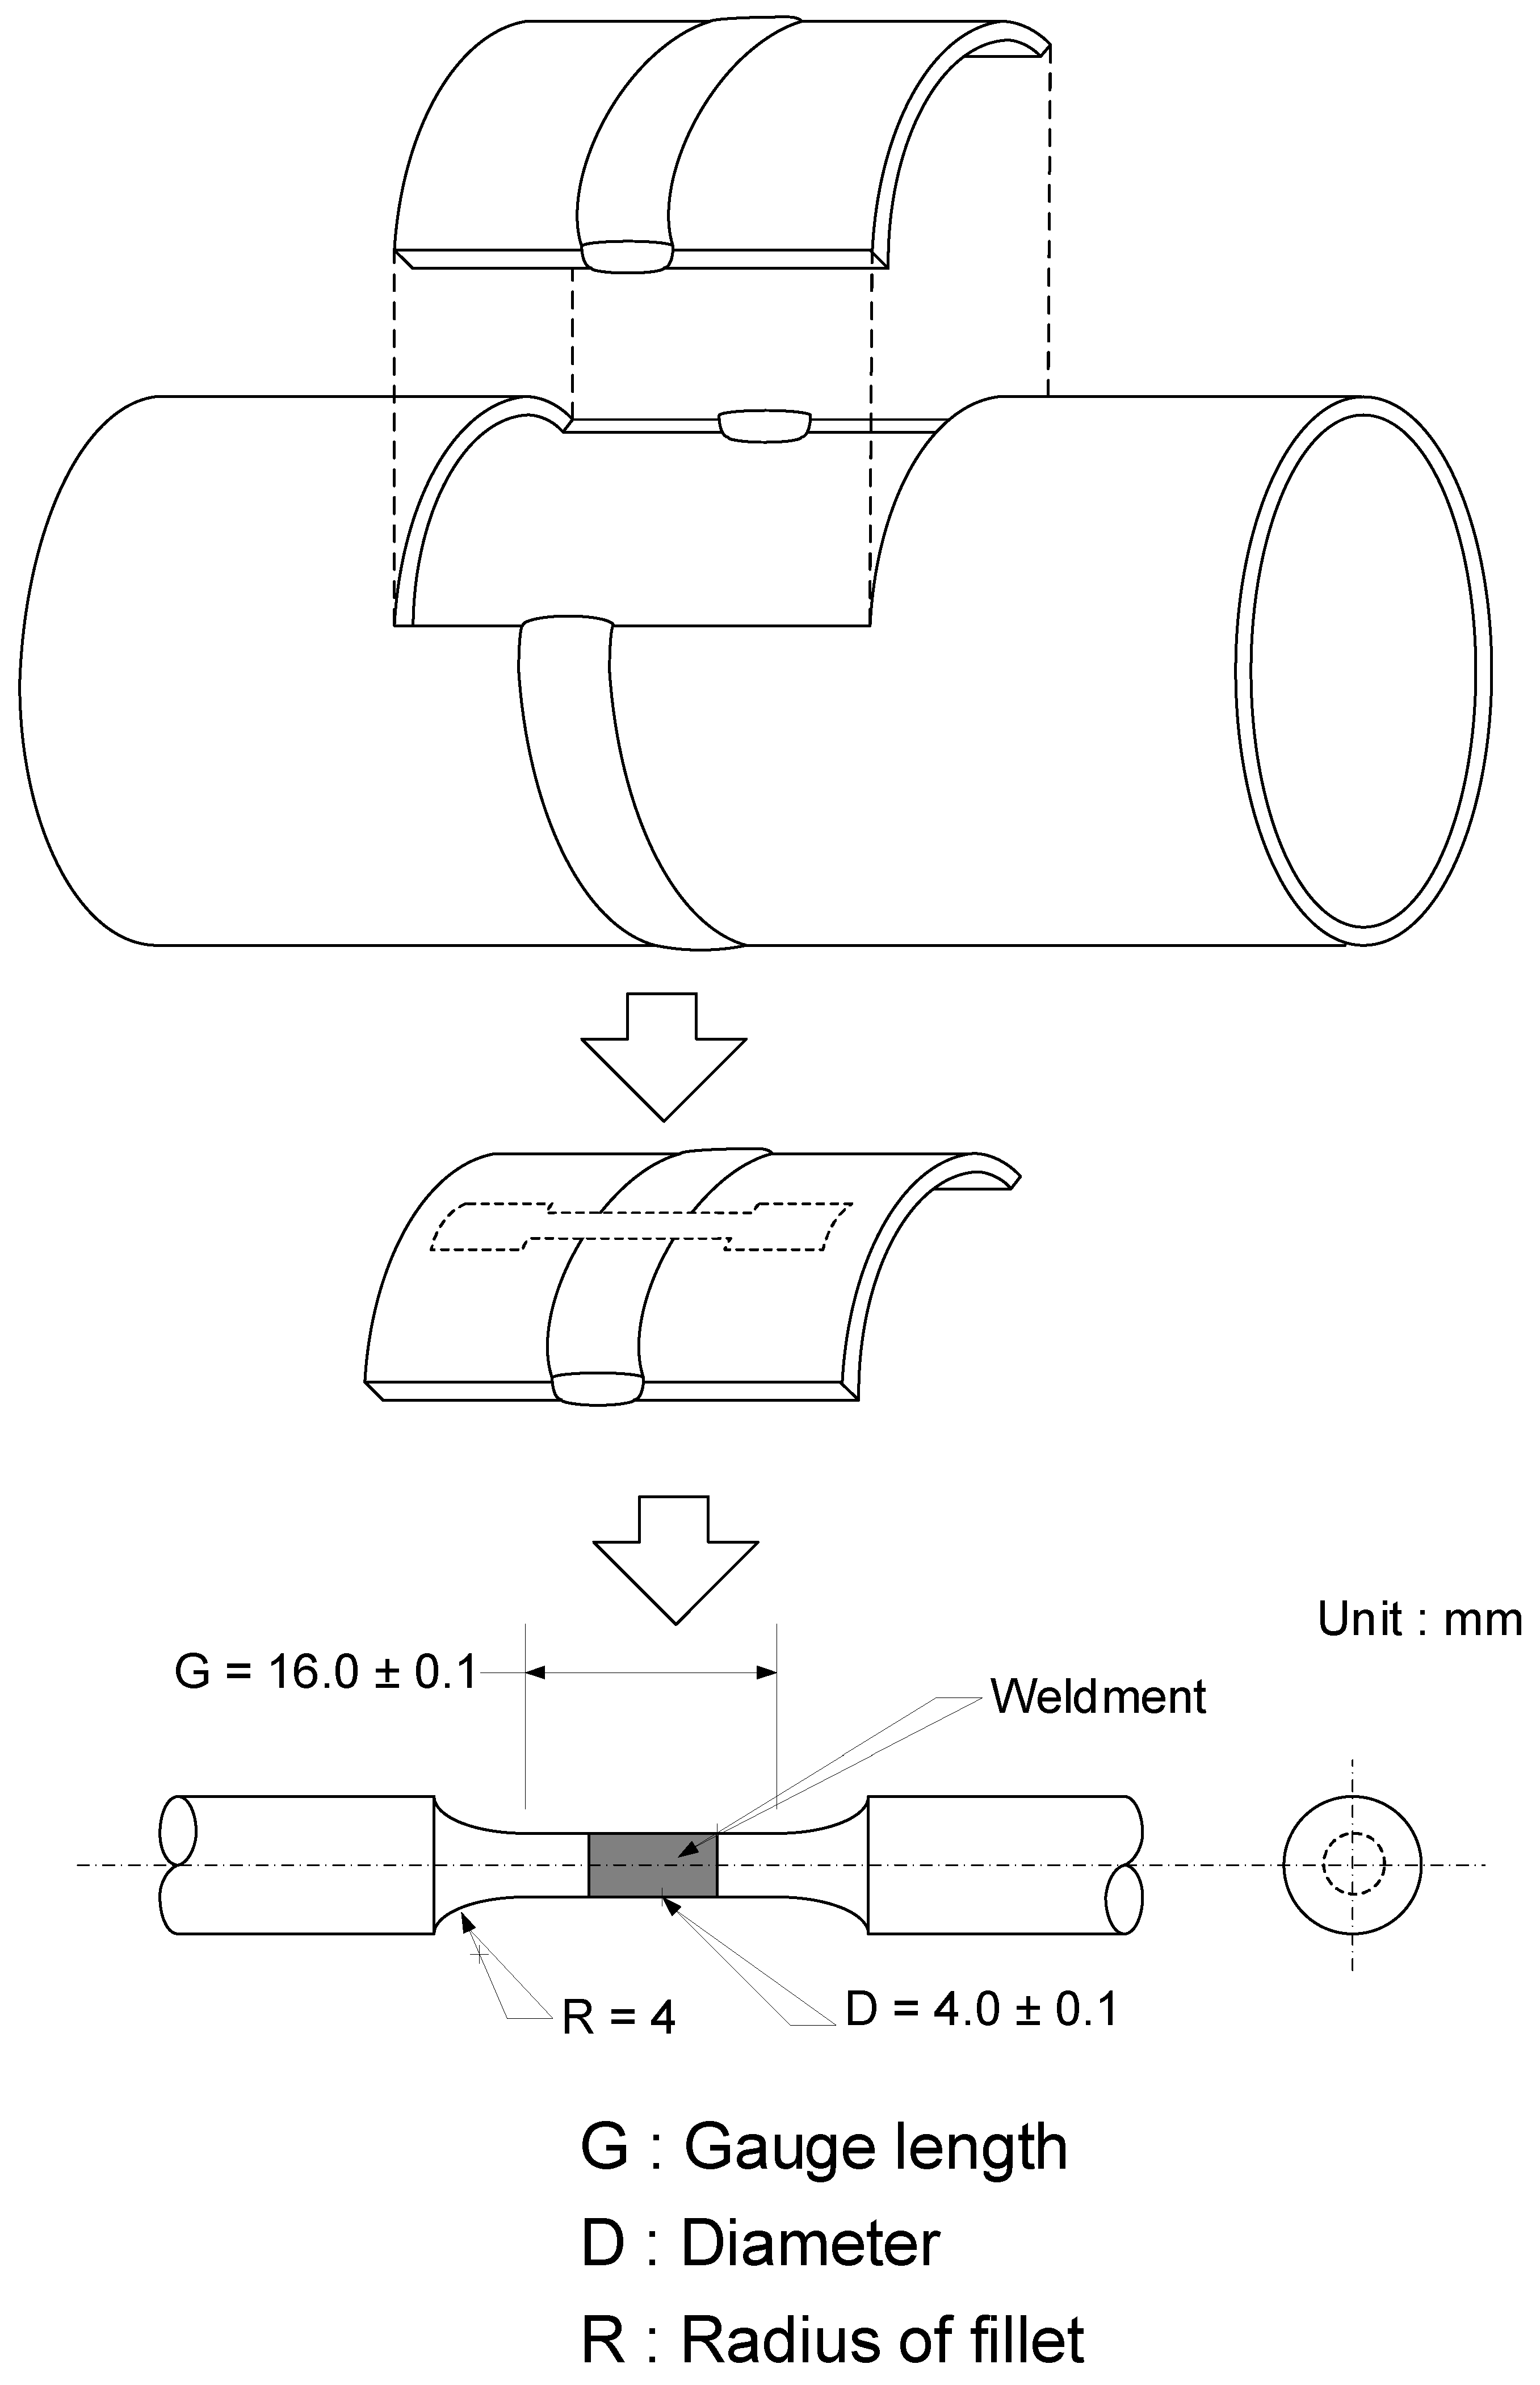
The galvanostatic technique was used to accelerate corrosion by impressing anodic direct current [21]. The condition of the galvanostatic method from the potentiodynamic polarization test is listed in Table 4, where Ecorr is the corrosion potential of the specimen, icorr is the corrosion current density, and βa and βc are slopes of anodic and cathodic polarization curves in straight line section, respectively. By multiplying corrosion current density (icorr) by time (s) that materials were exposed to the corrosive environment, the charge amount (Q) induced to the specimens can be calculated. Corrosion damage according to the charge amount can be accelerated for the aging time of 0.4, 1, 2, and 4 years. Each aging time is matched to 811.7, 2435.2, 4058.7, and 8117.4 C charge amounts, respectively. The induced time of the galvanostatic method is calculated from the following equations.
Q   ( C ) = i c o r r ( A / c m 2 ) × exposed   area   ( c m 2 ) × e x p o s e d   t i m e   ( s )
Induced   time   ( s ) = Q   ( C ) / [ i app   ( A / cm 2 ) × exposed   area   ( cm 2 ) ] ,
where icorr is the corrosion current density of the specimen and iapp is the applied current density during the galvanostatic test.

2.4. Tensile Test

To identify the effect of corrosion on the mechanical properties of a welded carbon steel pipe, a tensile test (KNR System, Yongin, Republic of Korea) was conducted for all five specimens including intact and corroded specimens. The weldment specimens for tensile testing were made from carbon steel pipe according to the ASTM E8 [22] as shown in Figure 1. The tensile tests were conducted at a strain rate of 10−3 s−1. The results were analyzed for the yield strength (YS), tensile strength (TS), and ductility (% total elongation).

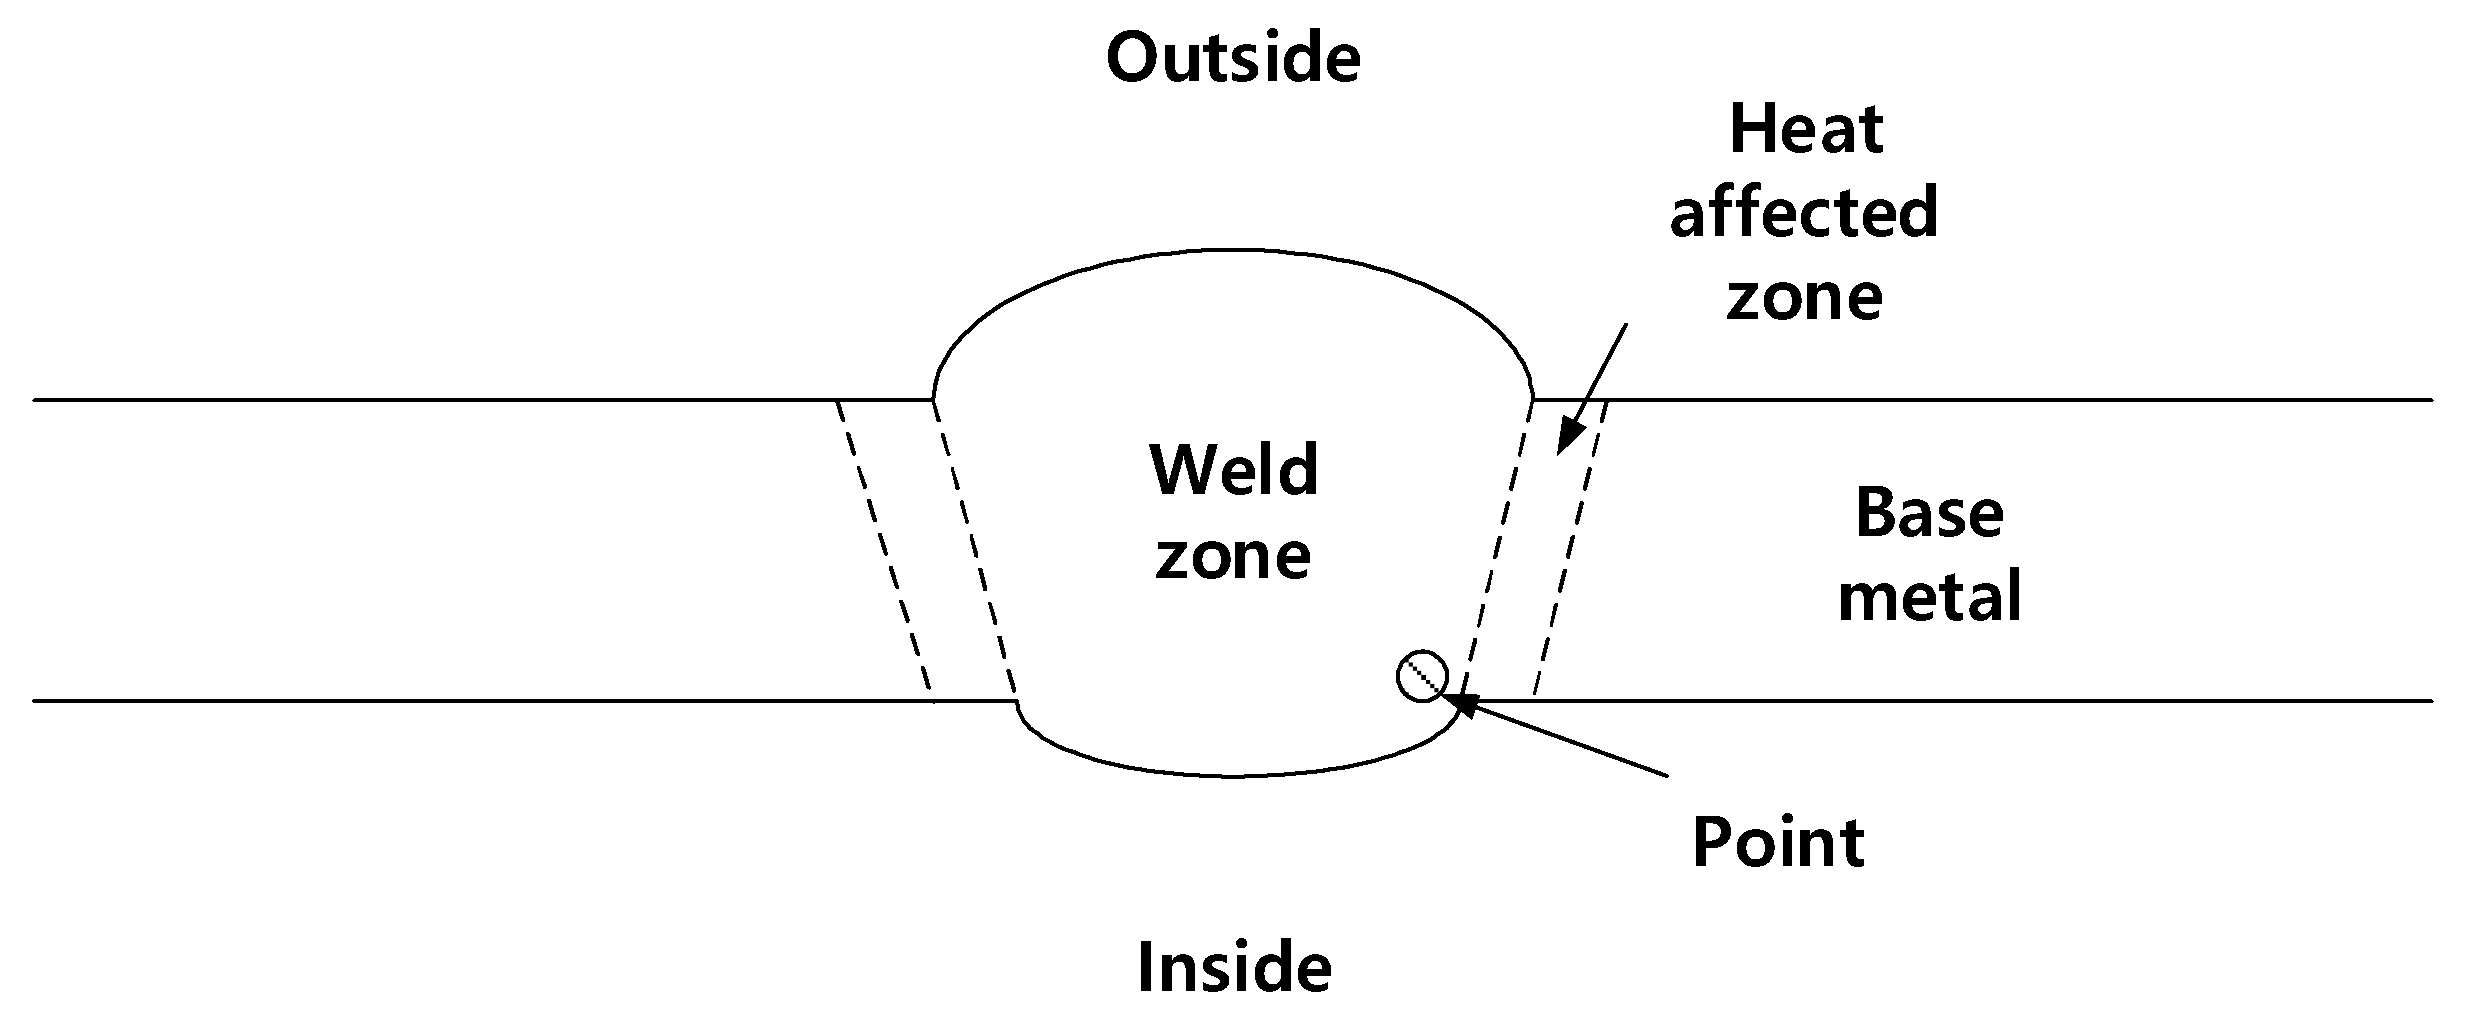
2.5. Microstructure Observation
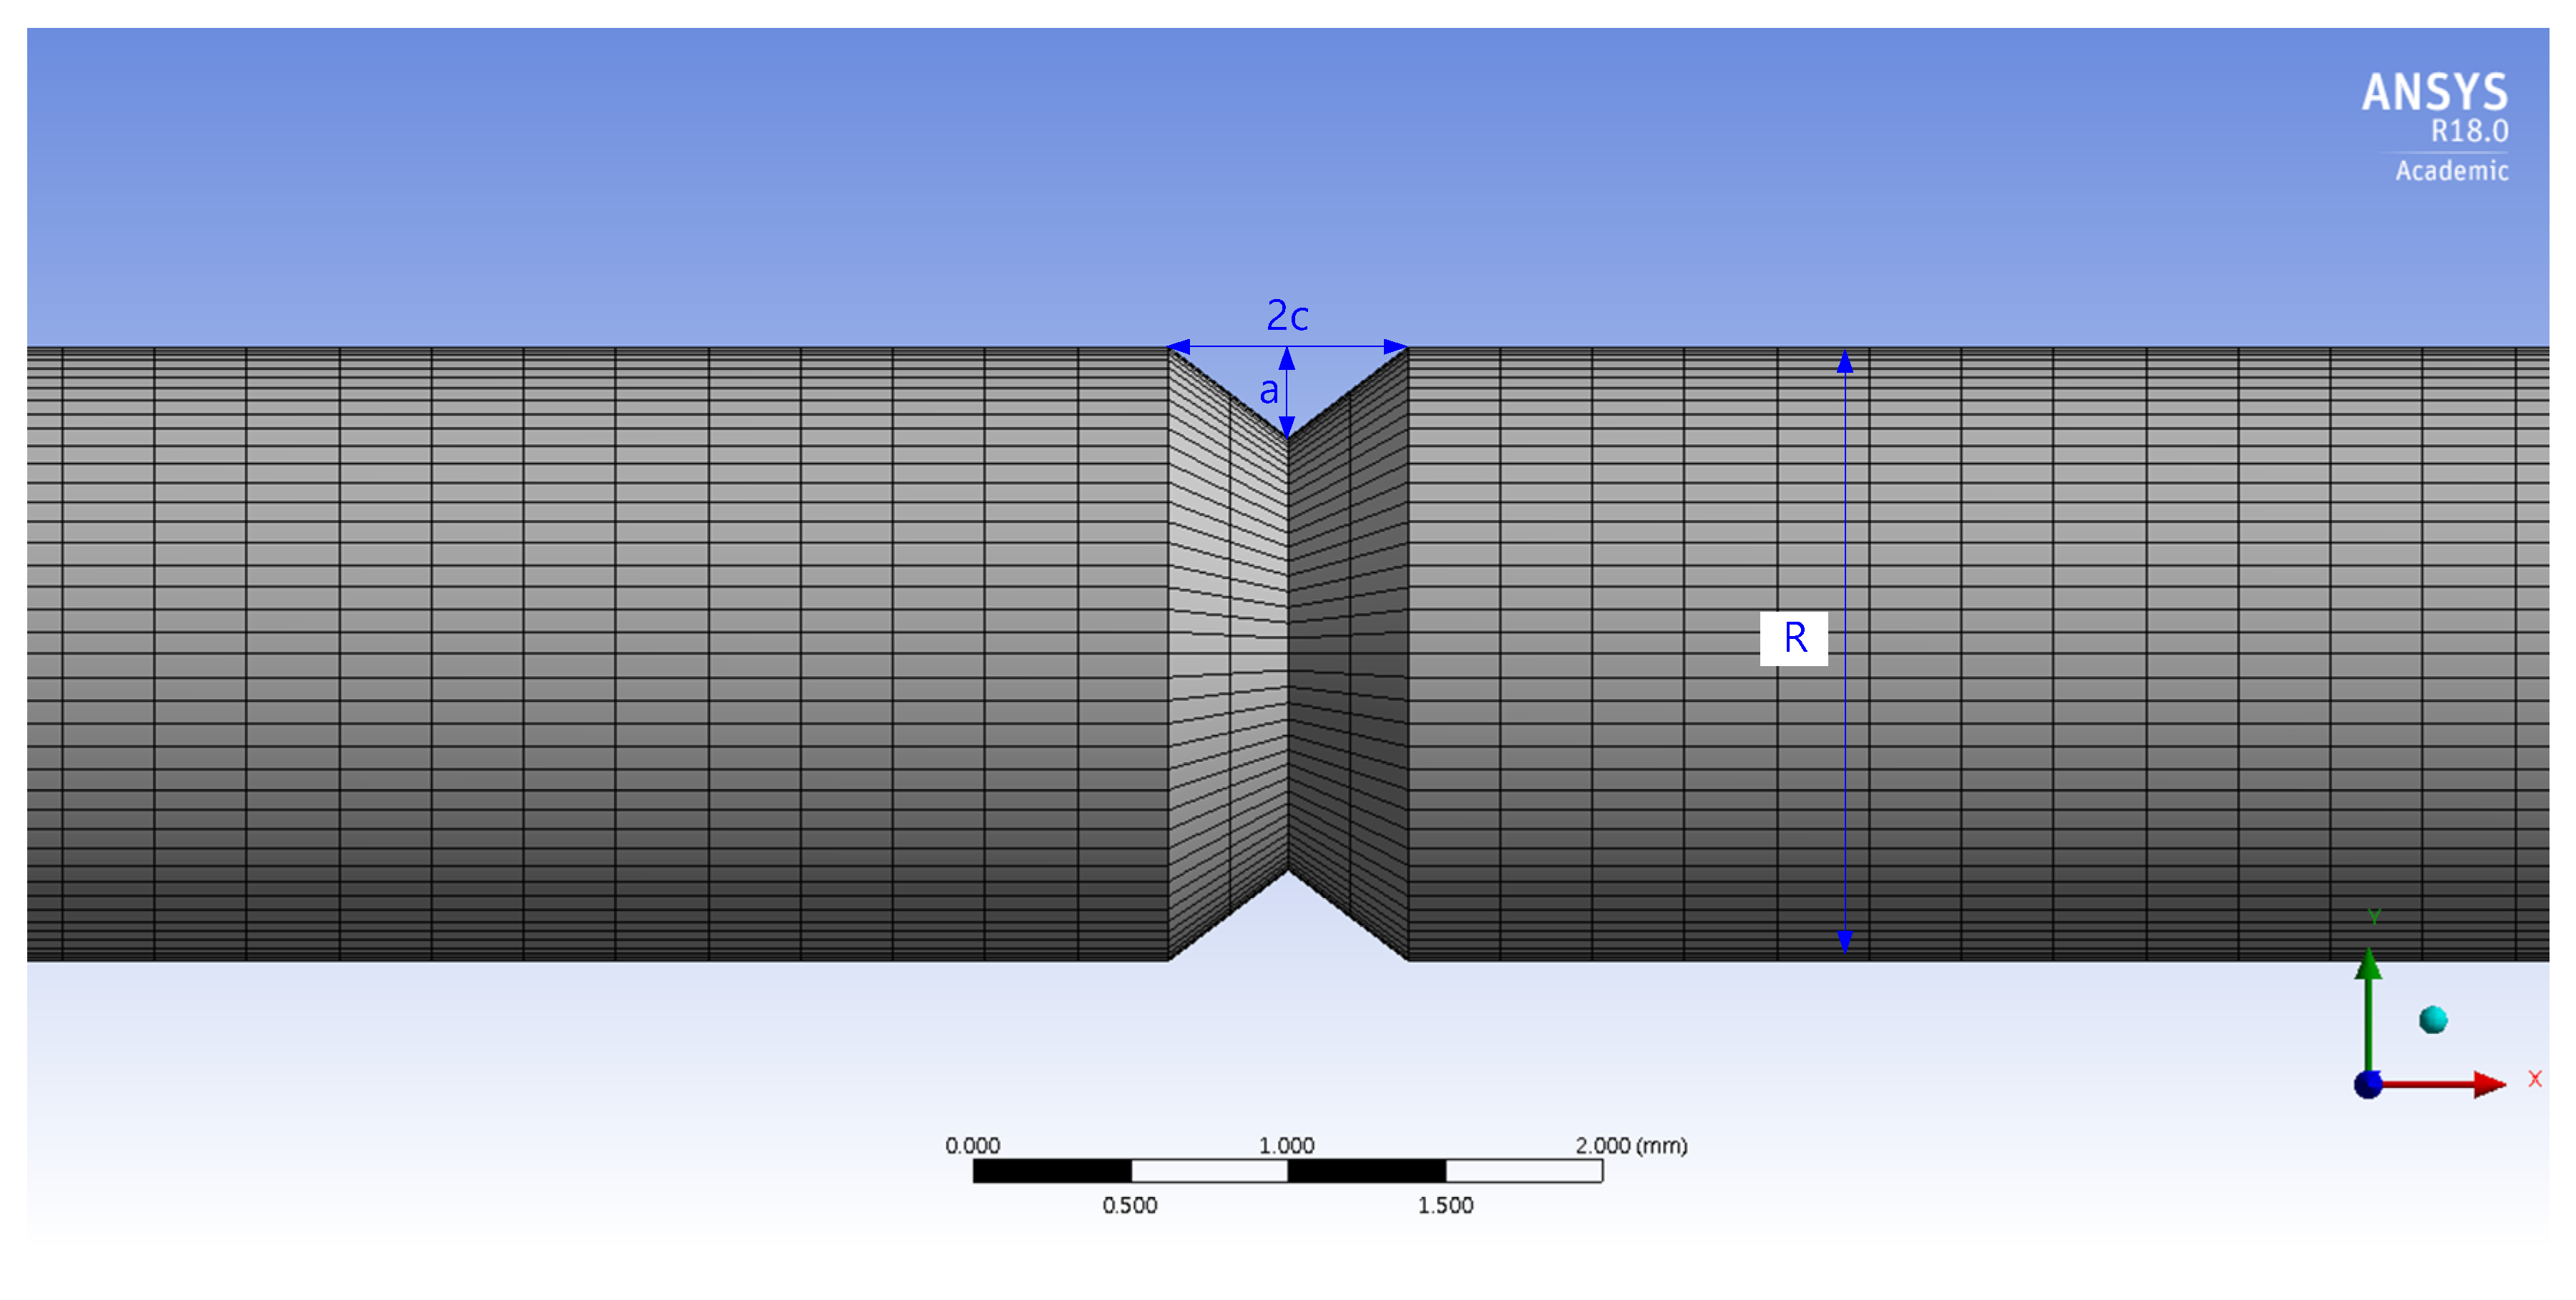
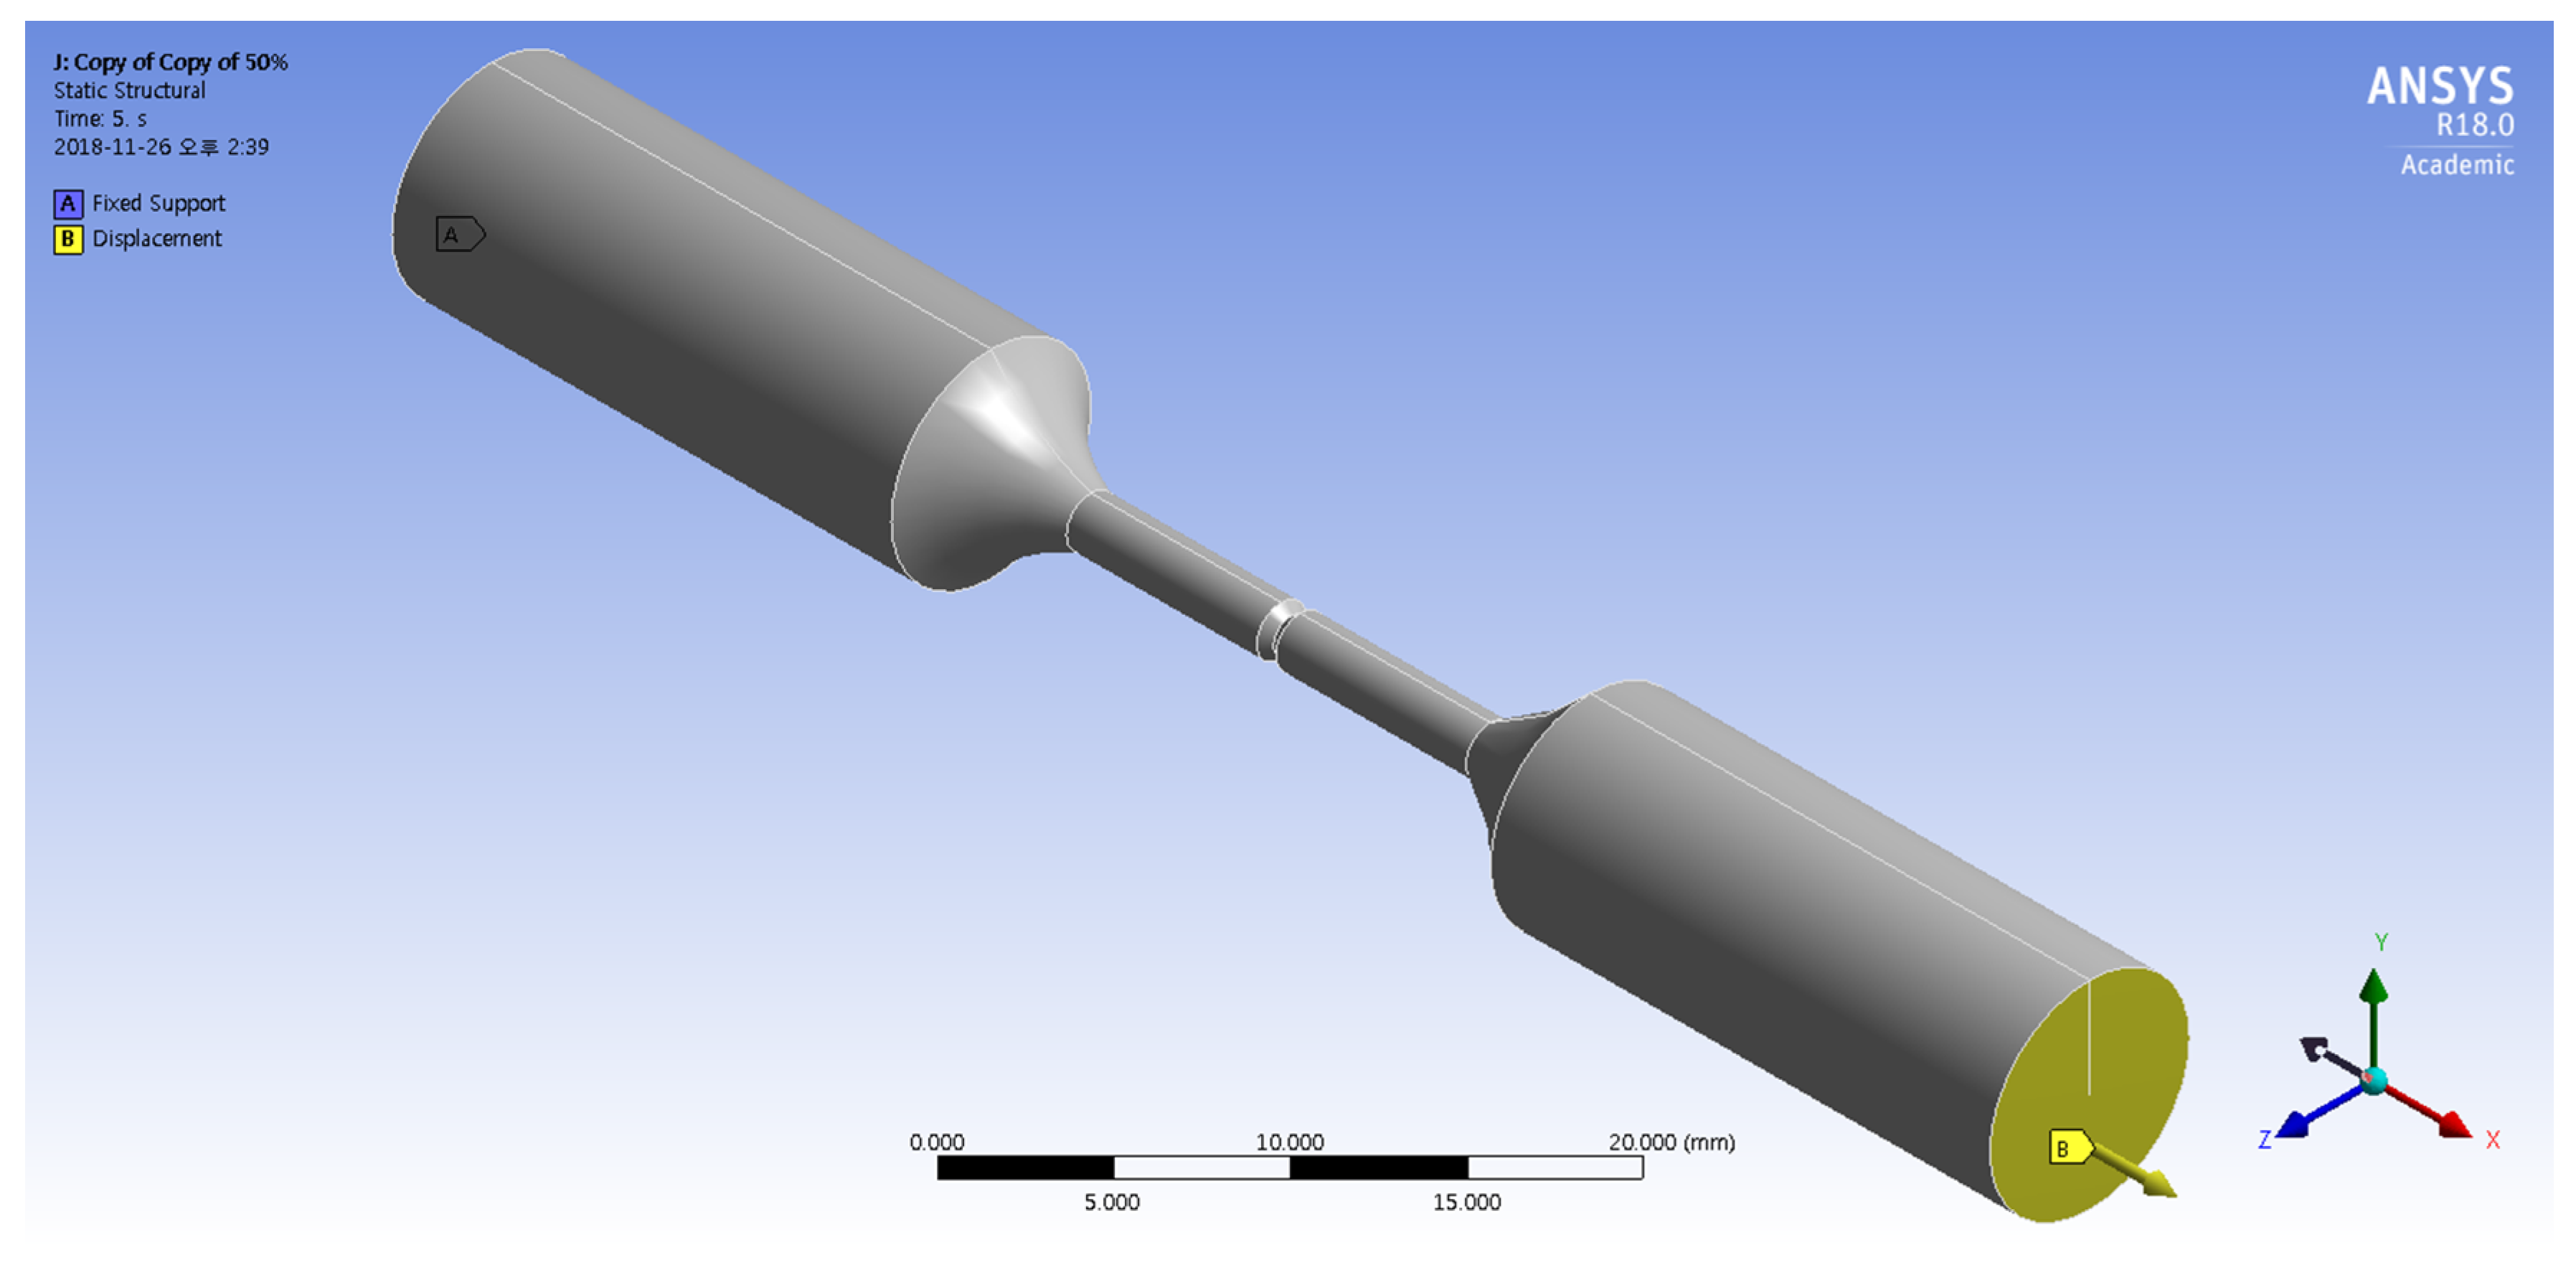
To investigate the effect of corrosion on the welded carbon steel pipe, microstructure observation was conducted. The specimens were polished with SiC paper to 2000 grit, and then polished using diamond suspensions down to 1 μm. After that, the specimens were etched with a 2% nital etchant for 10 s. Photomicrographs of weldment areas were taken using a Leica DM2700 M optical microscope (OM, Wetzlar, Germany).

2.6. FEM Simulation

To investigate the maximum stress distribution of tensile specimens that were corroded according to the charge amounts, a numerical simulation was conducted using the finite element method (FEM, ANSYS 18.0, ANSYS, Canonsburg, PA, USA). The deepest corroded points were modeled by the 3D scan data of corroded specimens in Figure 3. In these 3D scan images, crack depth (a) and crack width (2c) were measured at the deepest corroded point. In Table 5, a, 2c, and diameter (R) measured from each specimen are listed. The corroded tensile specimen was modeled by the observed pit shape in Table 5. The mesh size of the specimens was fixed at 0.3 mm using the multizone method as shown in Figure 4.
Figure 5 shows the boundary conditions for the FEM simulation of the corroded tensile specimen. The fixed support was applied on the surface at the end of the tensile specimen. The displacement in the x-direction with 0.016 mm/s was applied on the surface at the opposite side of the tensile specimen.

2.7. Instrumented Indentation Test

To measure the fracture toughness value in mode 1 (K1C) of weldment where cracks occurred, the instrumented indentation technique was used. The indenter used for this test was a spherical indenter with a 0.5 mm diameter. FRONTICS’s instrumented indentation technique (FRONTICS, Seoul, Republic of Korea) was performed on the welded joint as shown in Figure 6. The maximum indentation depth was 150 μm and the rate of indentation loading/unloading was 30 μm/min. The point in Figure 6 represents the position where the indenter contacted the specimen surface.

3. Results

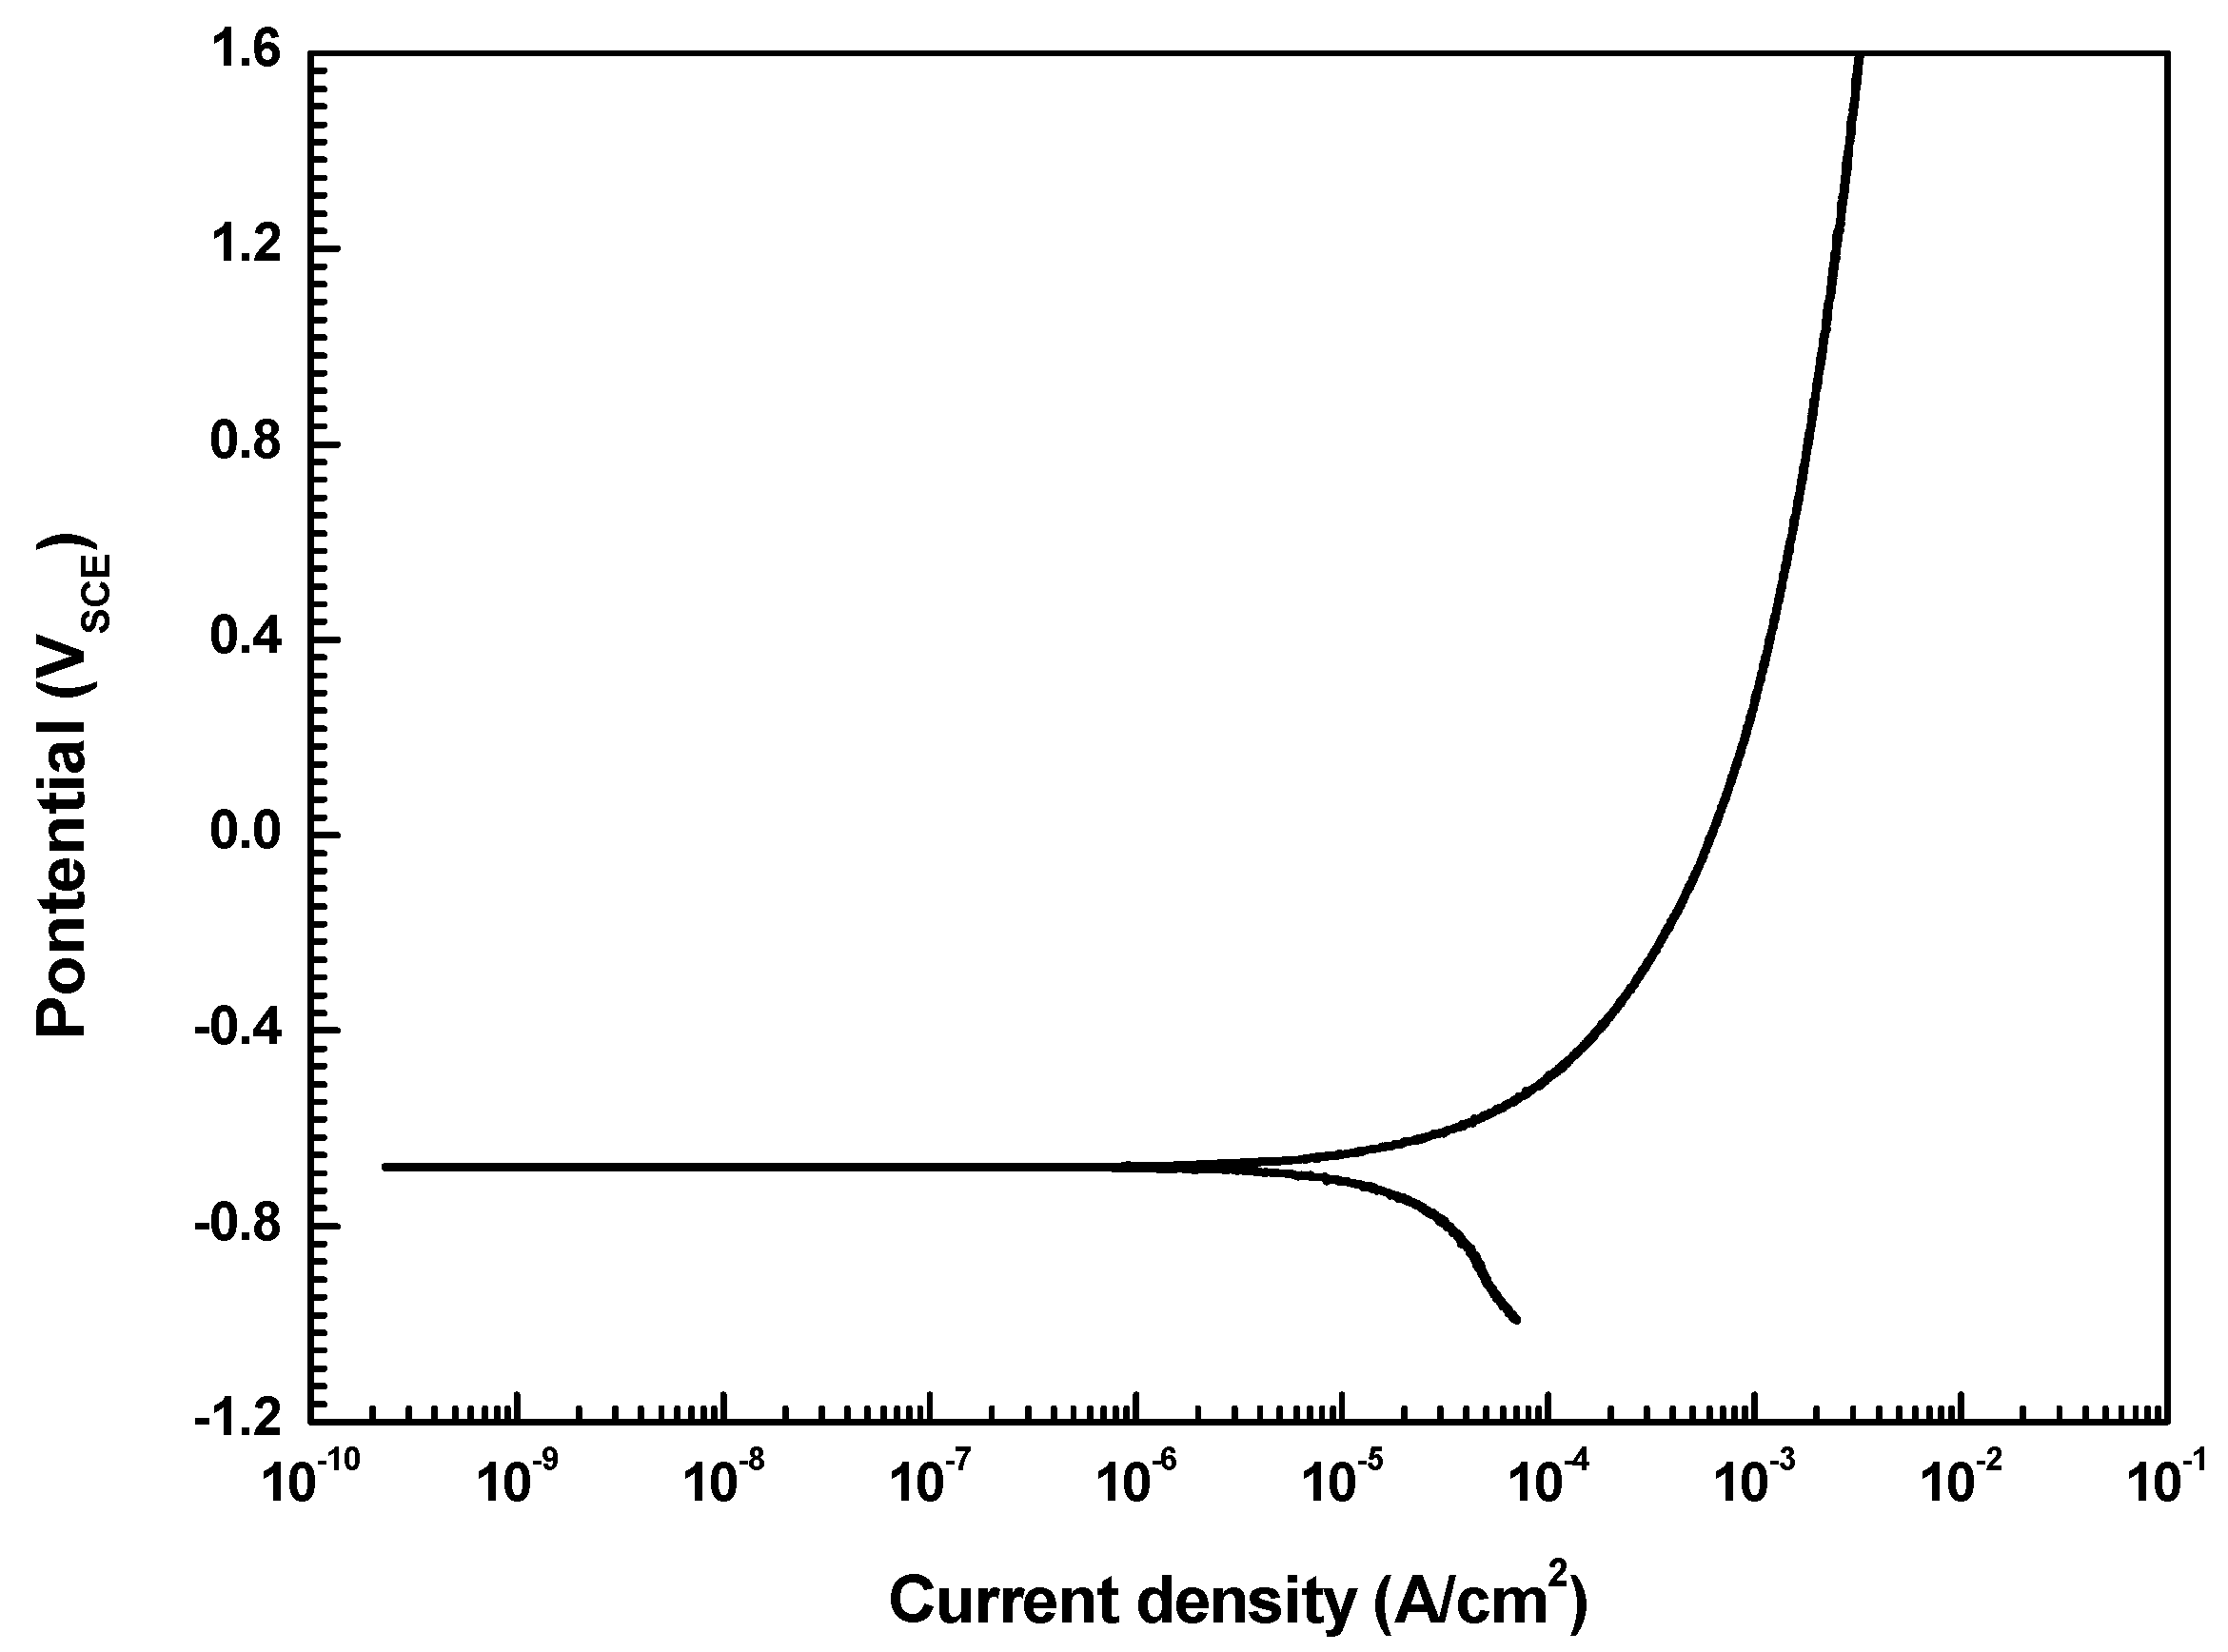
3.1. Potentiodynamic Polarization Test

To investigate the corrosion behavior of welded carbon steel pipe, a potentiodynamic polarization test was conducted. The corrosion current density (icorr) was determined by the Tafel extrapolation method, and the corrosion rate can be inferred from the icorr based on Faraday’s law [23]:
Corrosion   rate   ( mm yr ) = ( 0.00327 × i corr × E . W . ) D ,
where 0.00327 is the metric and time conversion factor, icorr is the corrosion current density (μA/cm2), E.W. is the equivalent weight (g), and D is the density (g/cm3). Figure 7 shows the results of the potentiodynamic polarization test. The corrosion current density measured by the Tafel extrapolation method is 16 μA/cm2. Table 6 lists the conditions of the accelerated test based on the results of the polarization test. As a result of the test, uniform corrosion occurred in the specimen.

3.2. Corrosion Acceleration by Galvanostatic Test Method
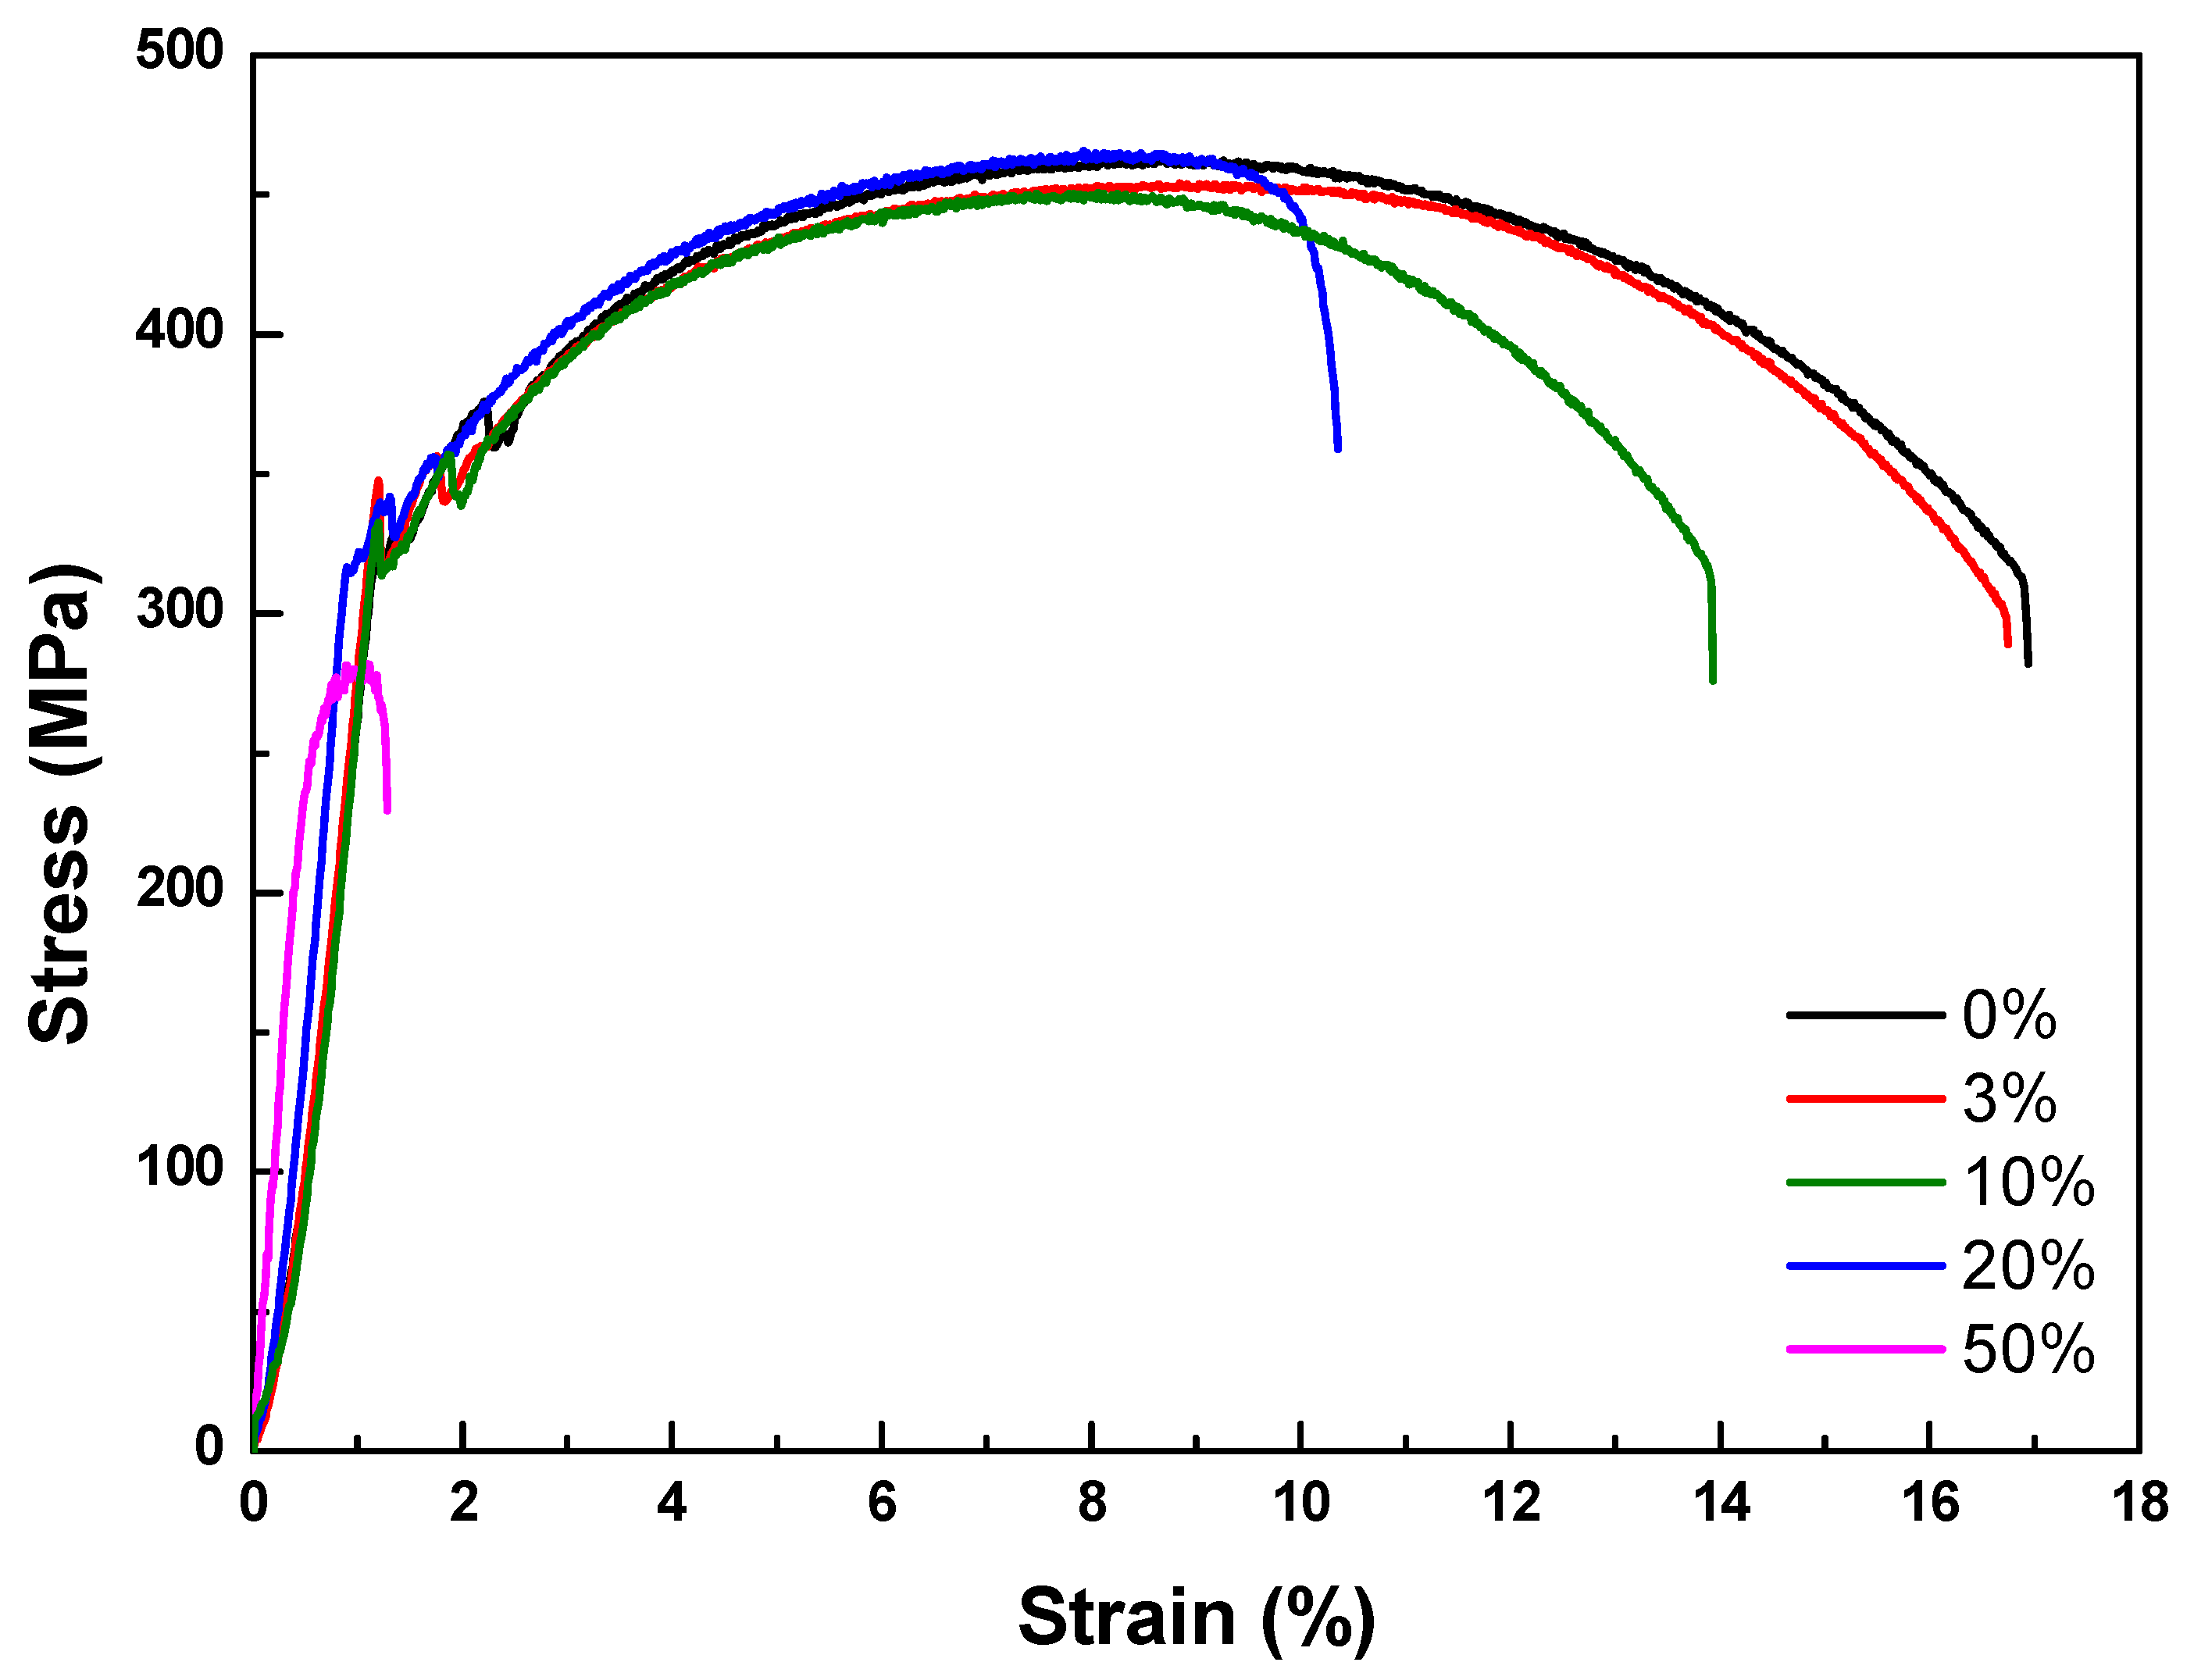
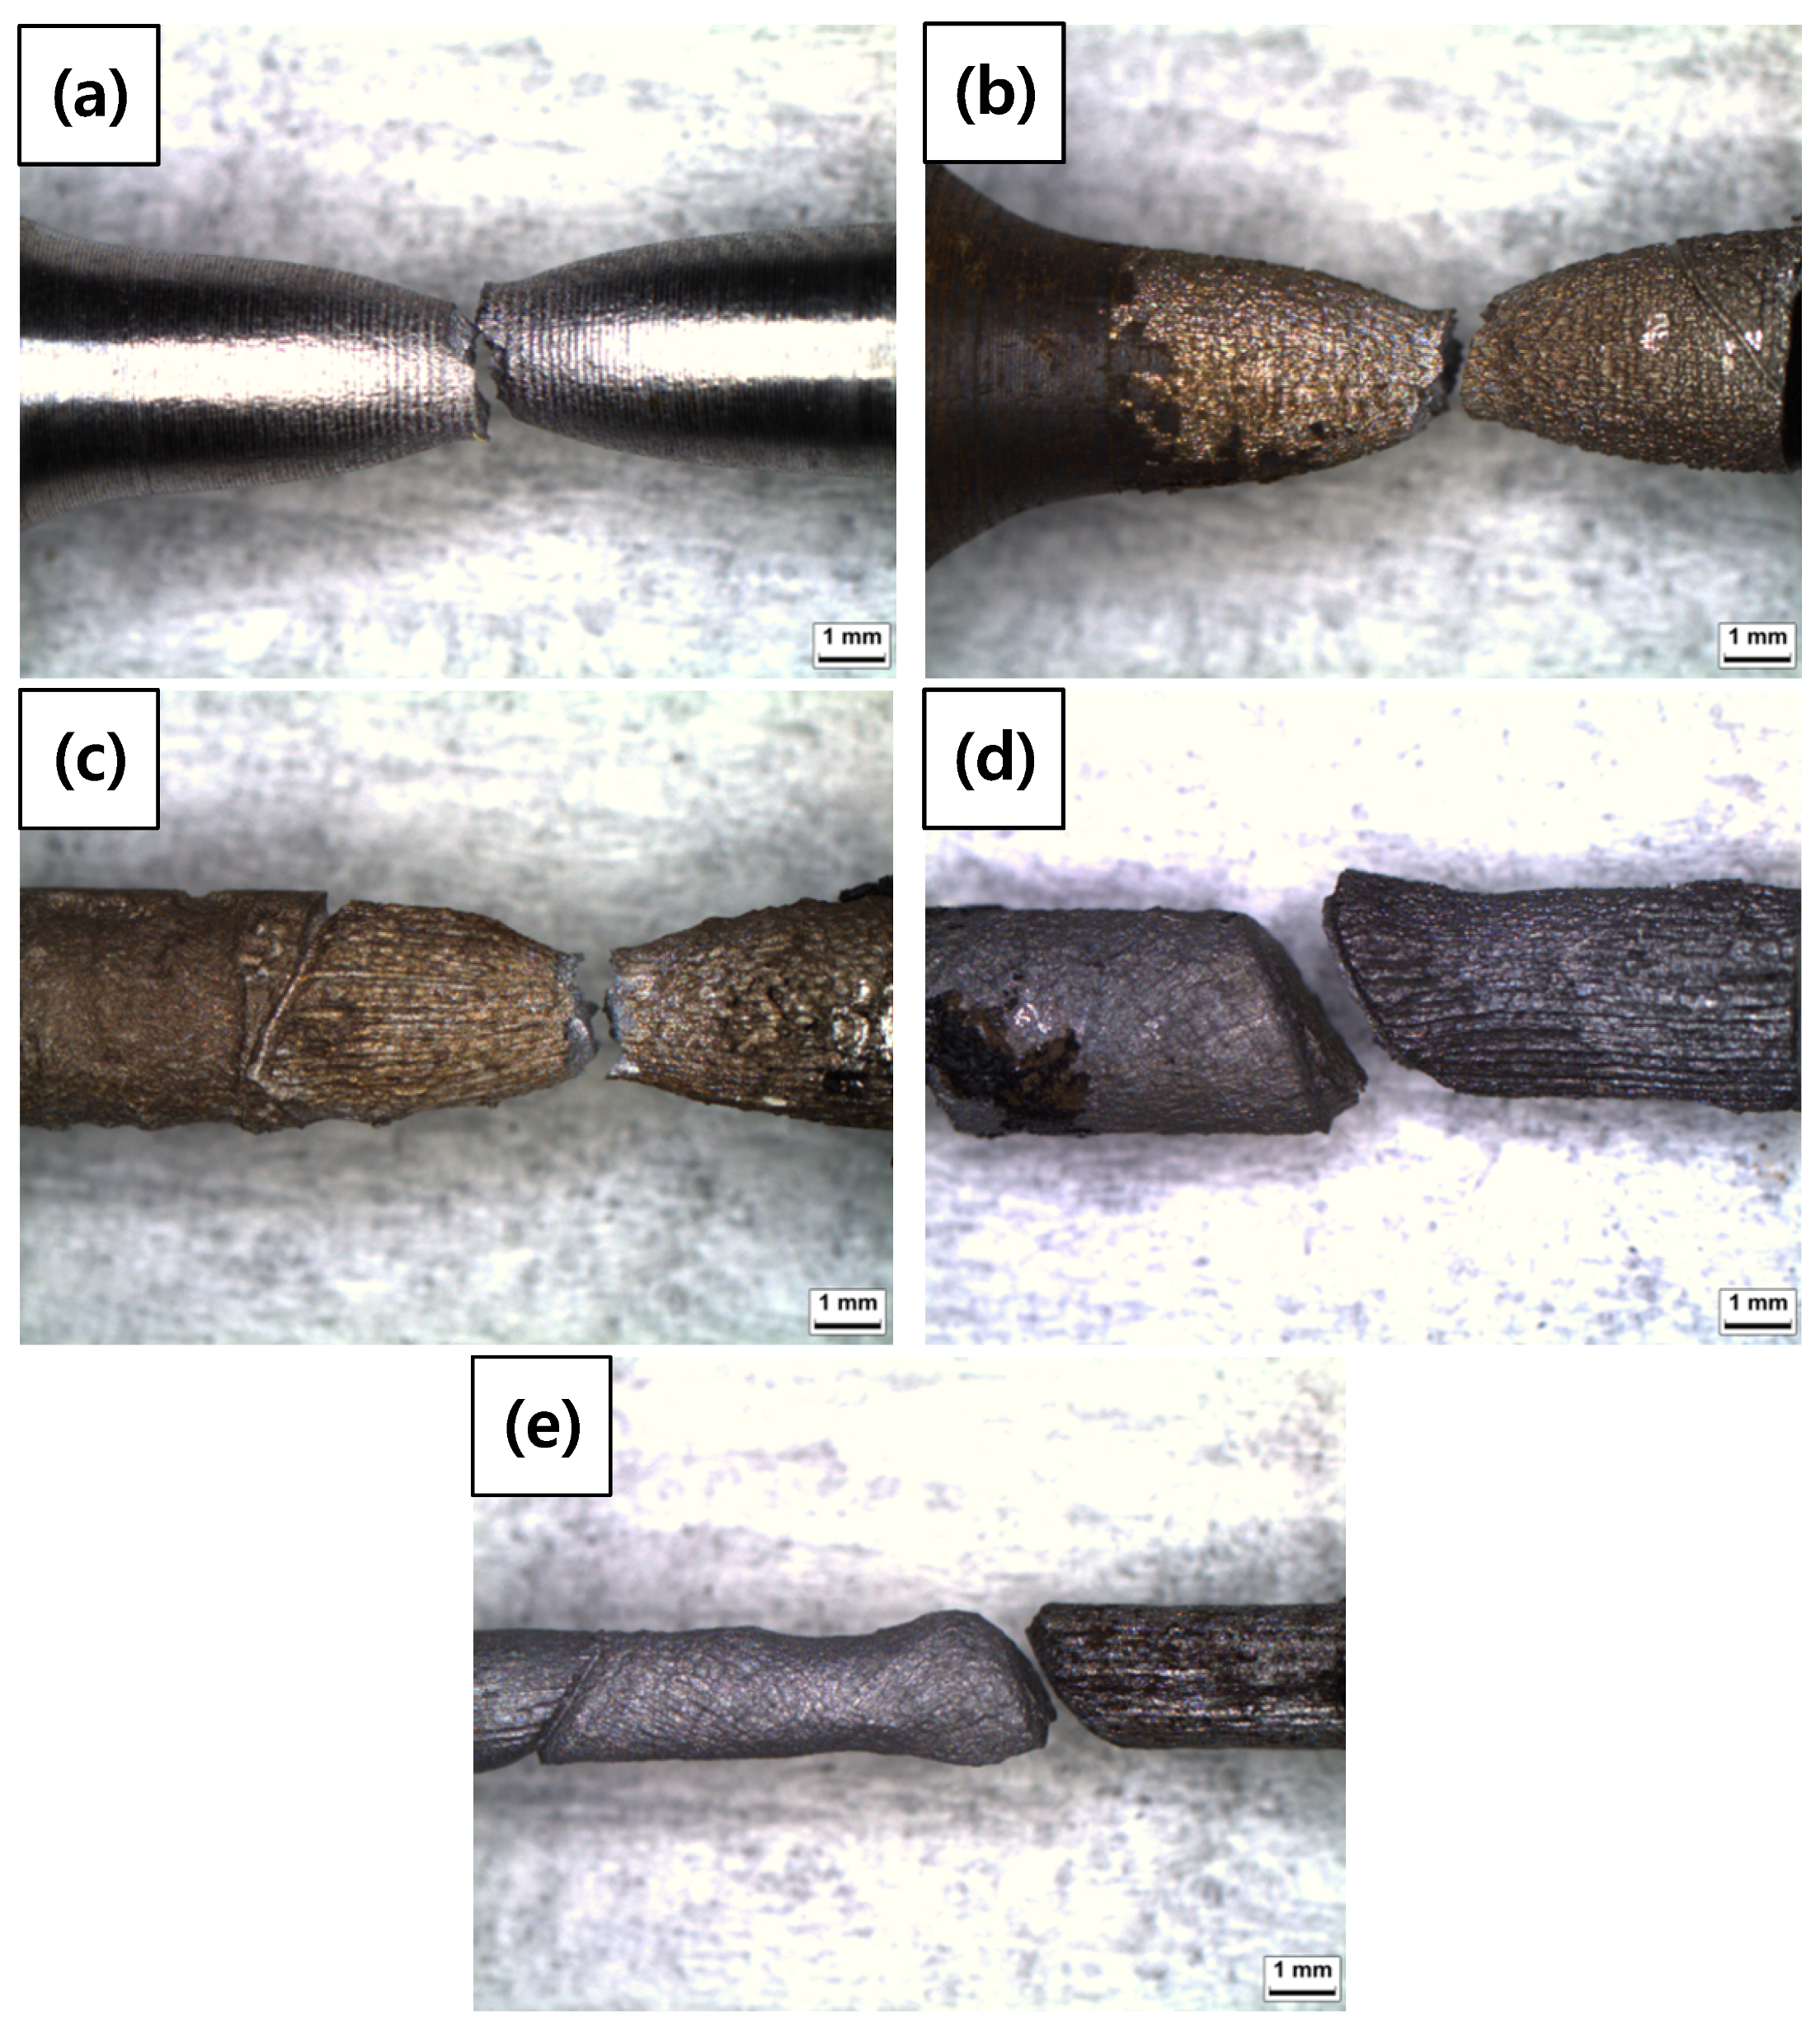
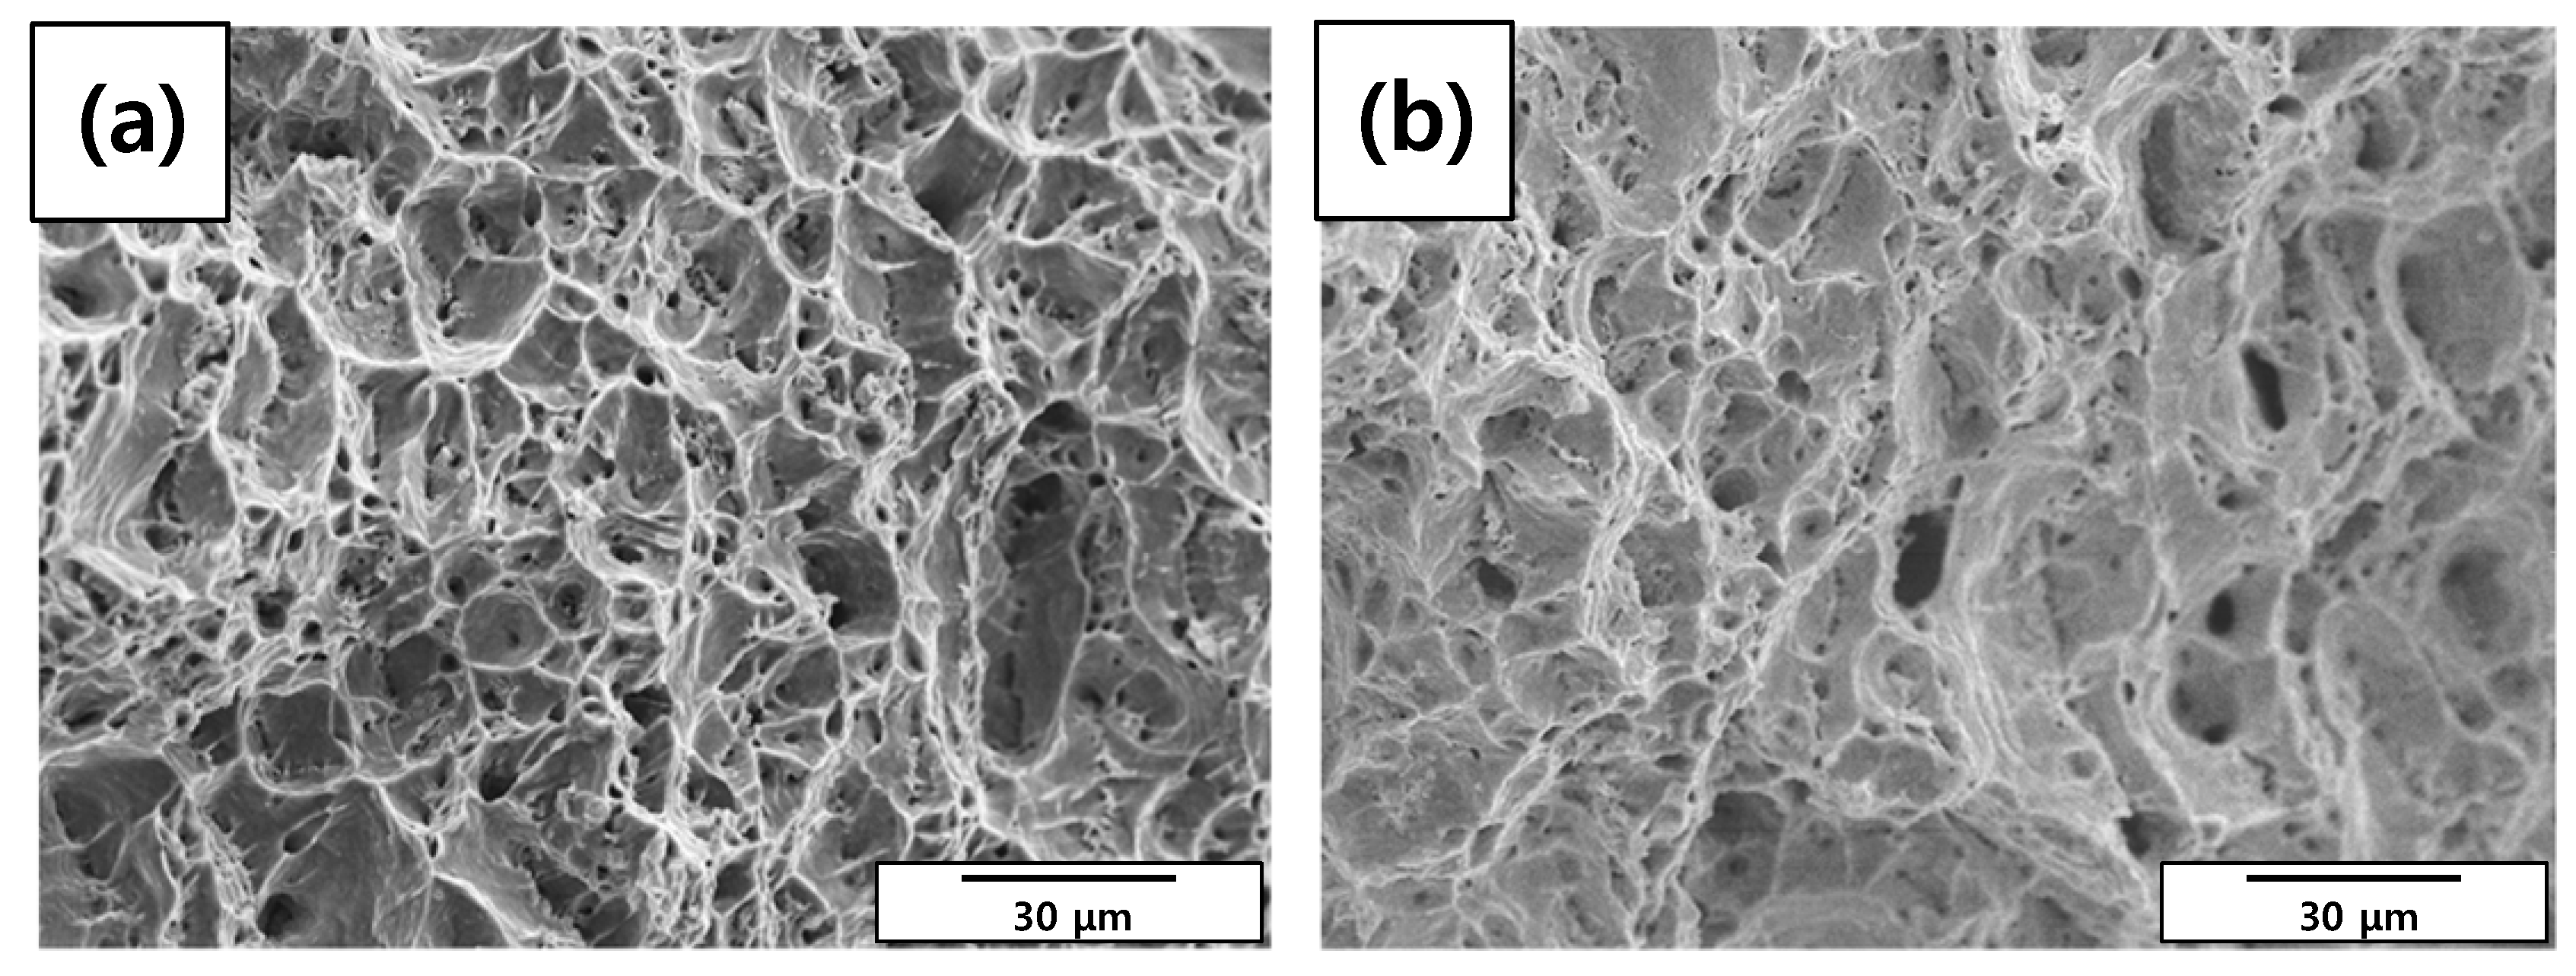
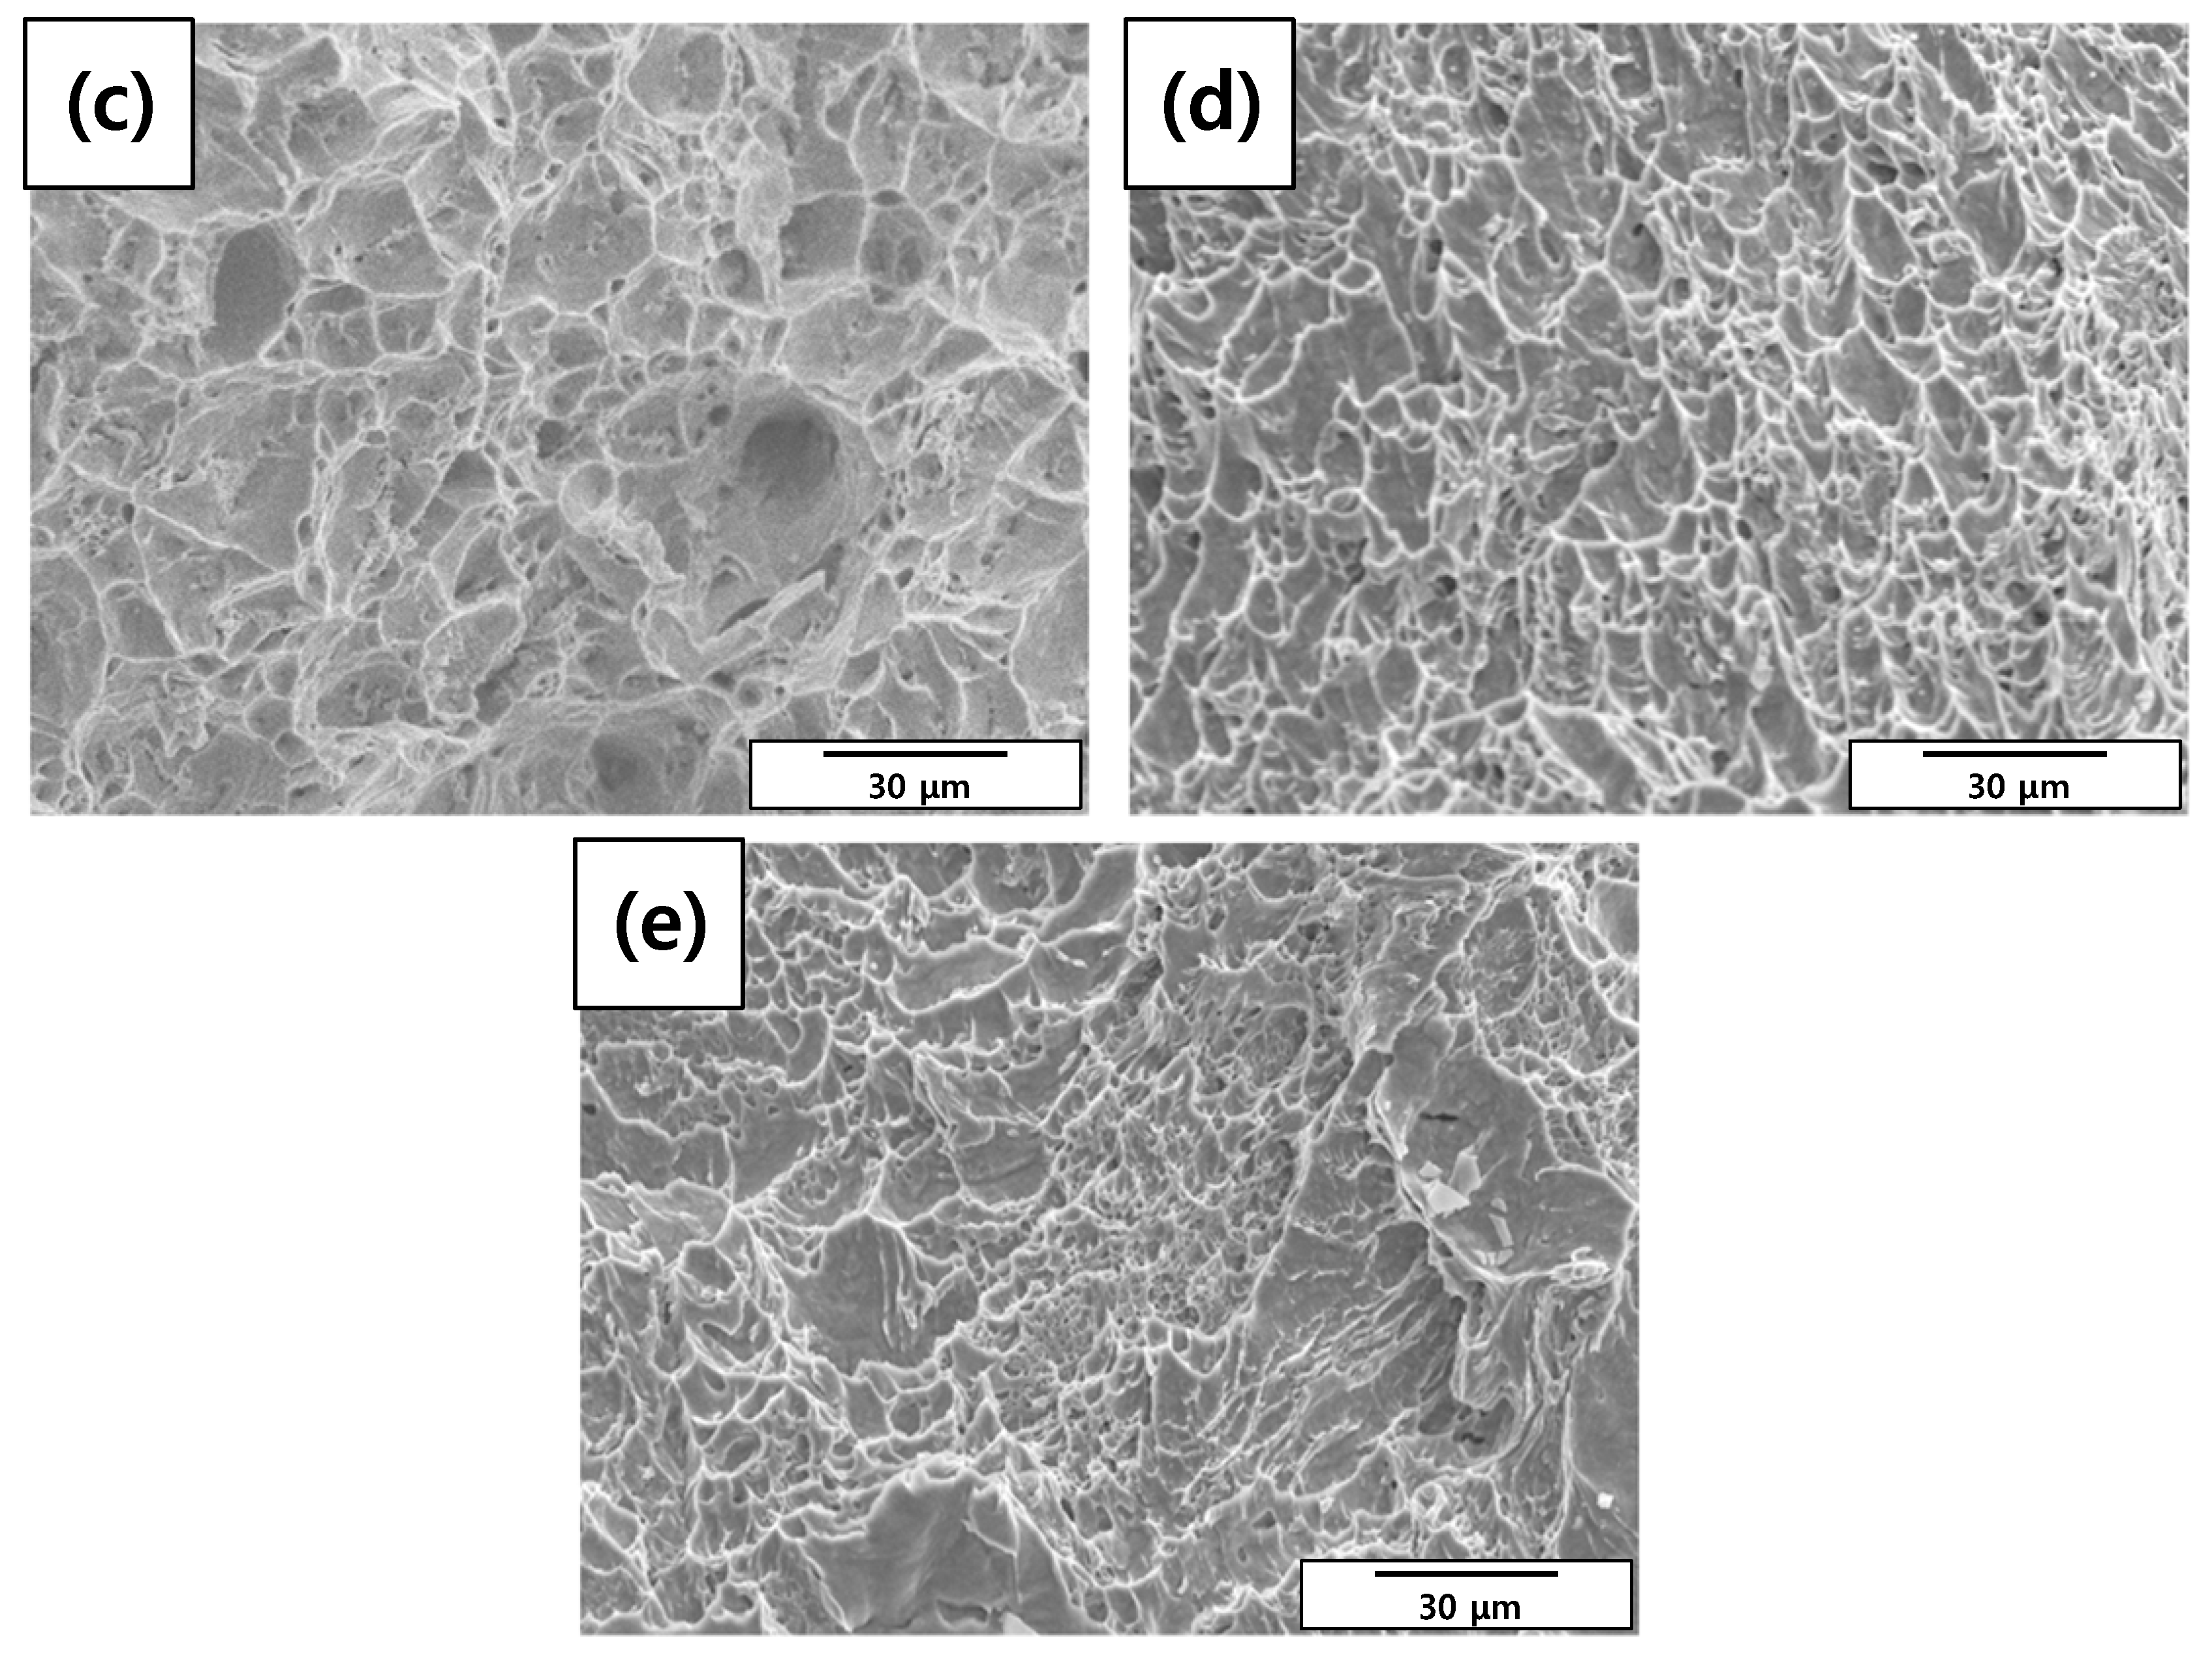
Figure 8 and Table 7 show the images of the welded carbon steel specimen and the diameter reductions of the specimens after the galvanostatic test, respectively. Corrosion damage according to the acceleration time is classified into the diameter reduction ratio. As the acceleration time increased, the diameter reduction ratio increased. A crack-like scratch was observed between the weldment and base metal.

3.3. Tensile Test

A tensile test was conducted to measure the mechanical properties of each specimen. As shown in Table 8 and Figure 9, elongation decreased as the diameter reduction ratio increased. Yield stress and tensile stress decreased remarkably under the 50% reduction condition. These results were consistent with the magnified images of fracture morphology and surface after the tensile tests. As shown in Figure 10, the fracture morphologies of the 20% and 50% reduction specimens were different compared to the others. They showed brittle fracture characteristics. Compared to the cup and cone type, their fracture shapes were flat with diagonal direction. As shown in Figure 11, a shallow dimple in the fracture surface indicated that a brittle fracture occurred rather than a ductile fracture [24]. In other specimens, ductile fracture surfaces with dimples were observed. The corrosion damages according to the charge amounts lead to the degradation of mechanical properties in the welded specimen.

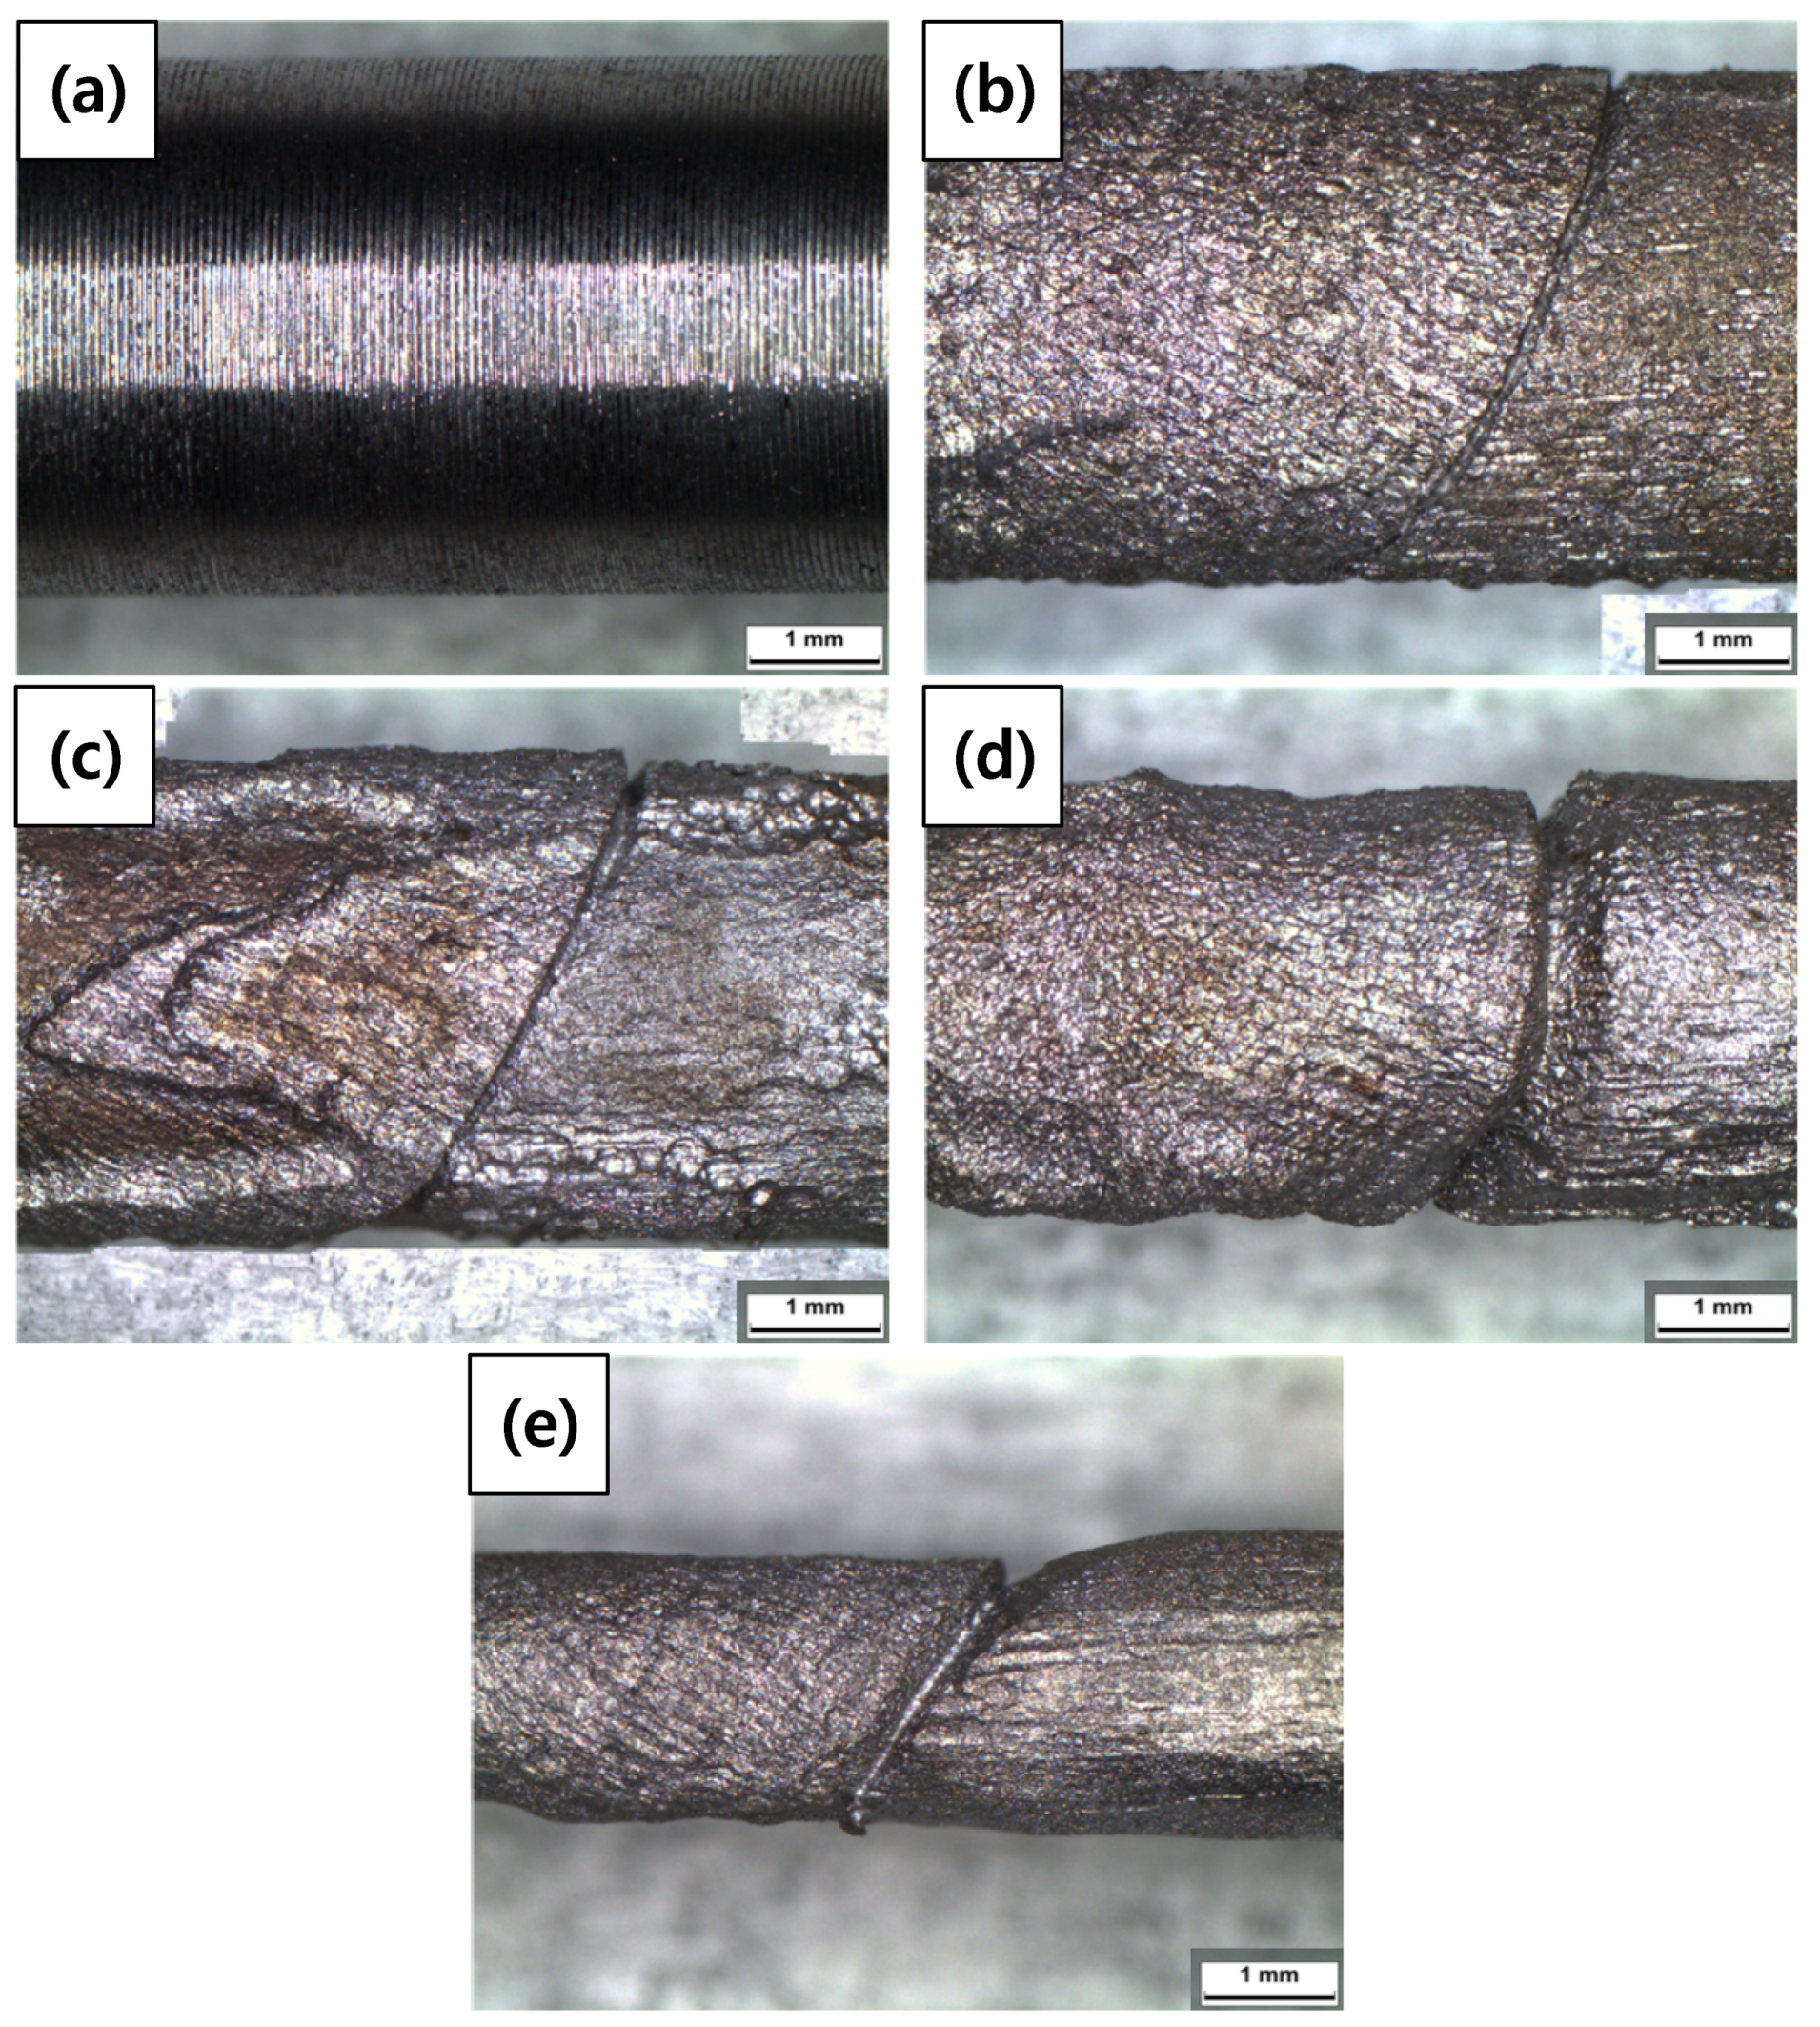
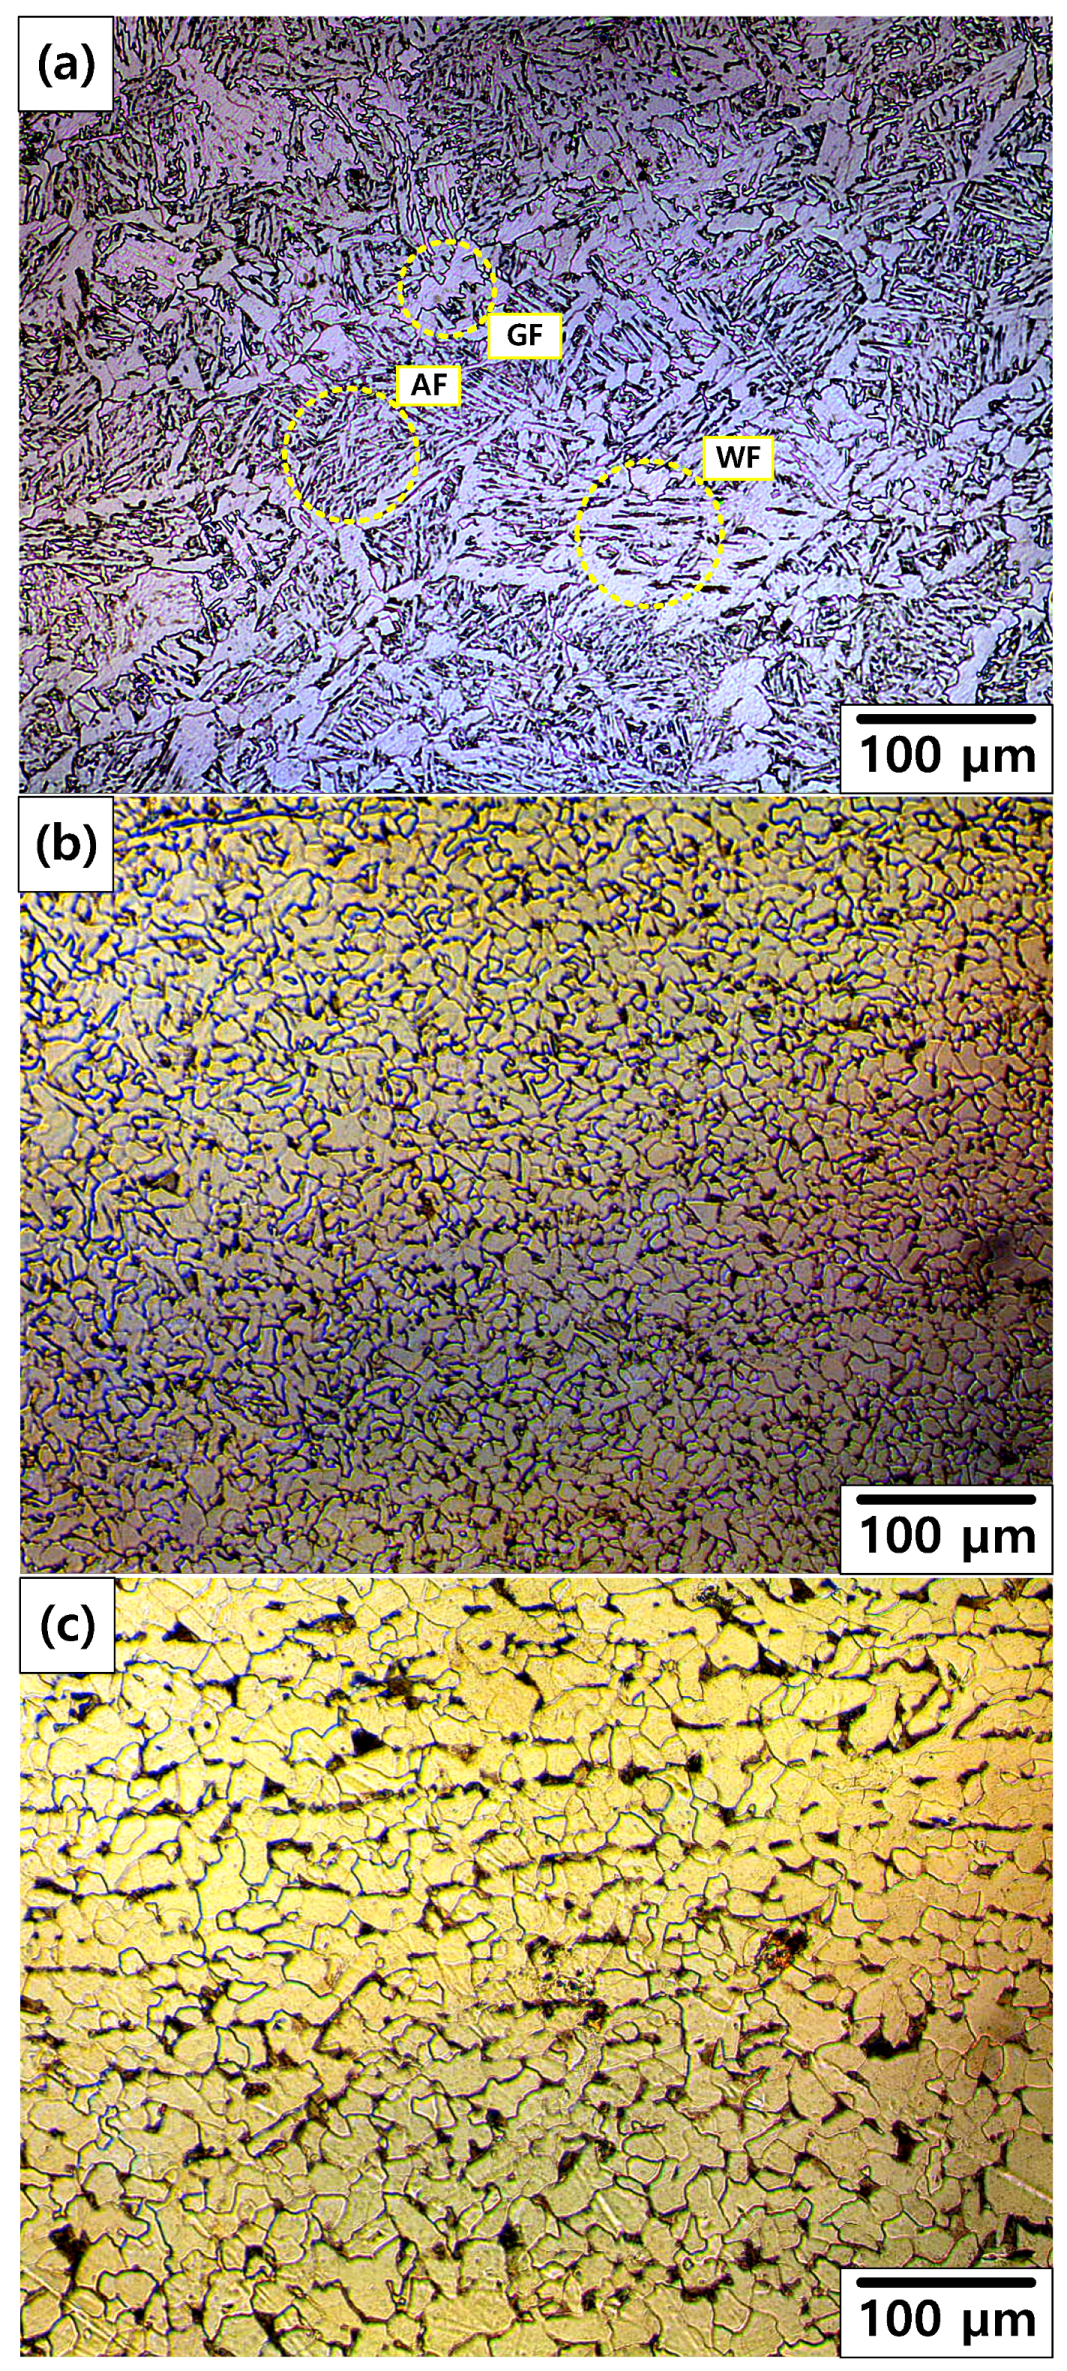
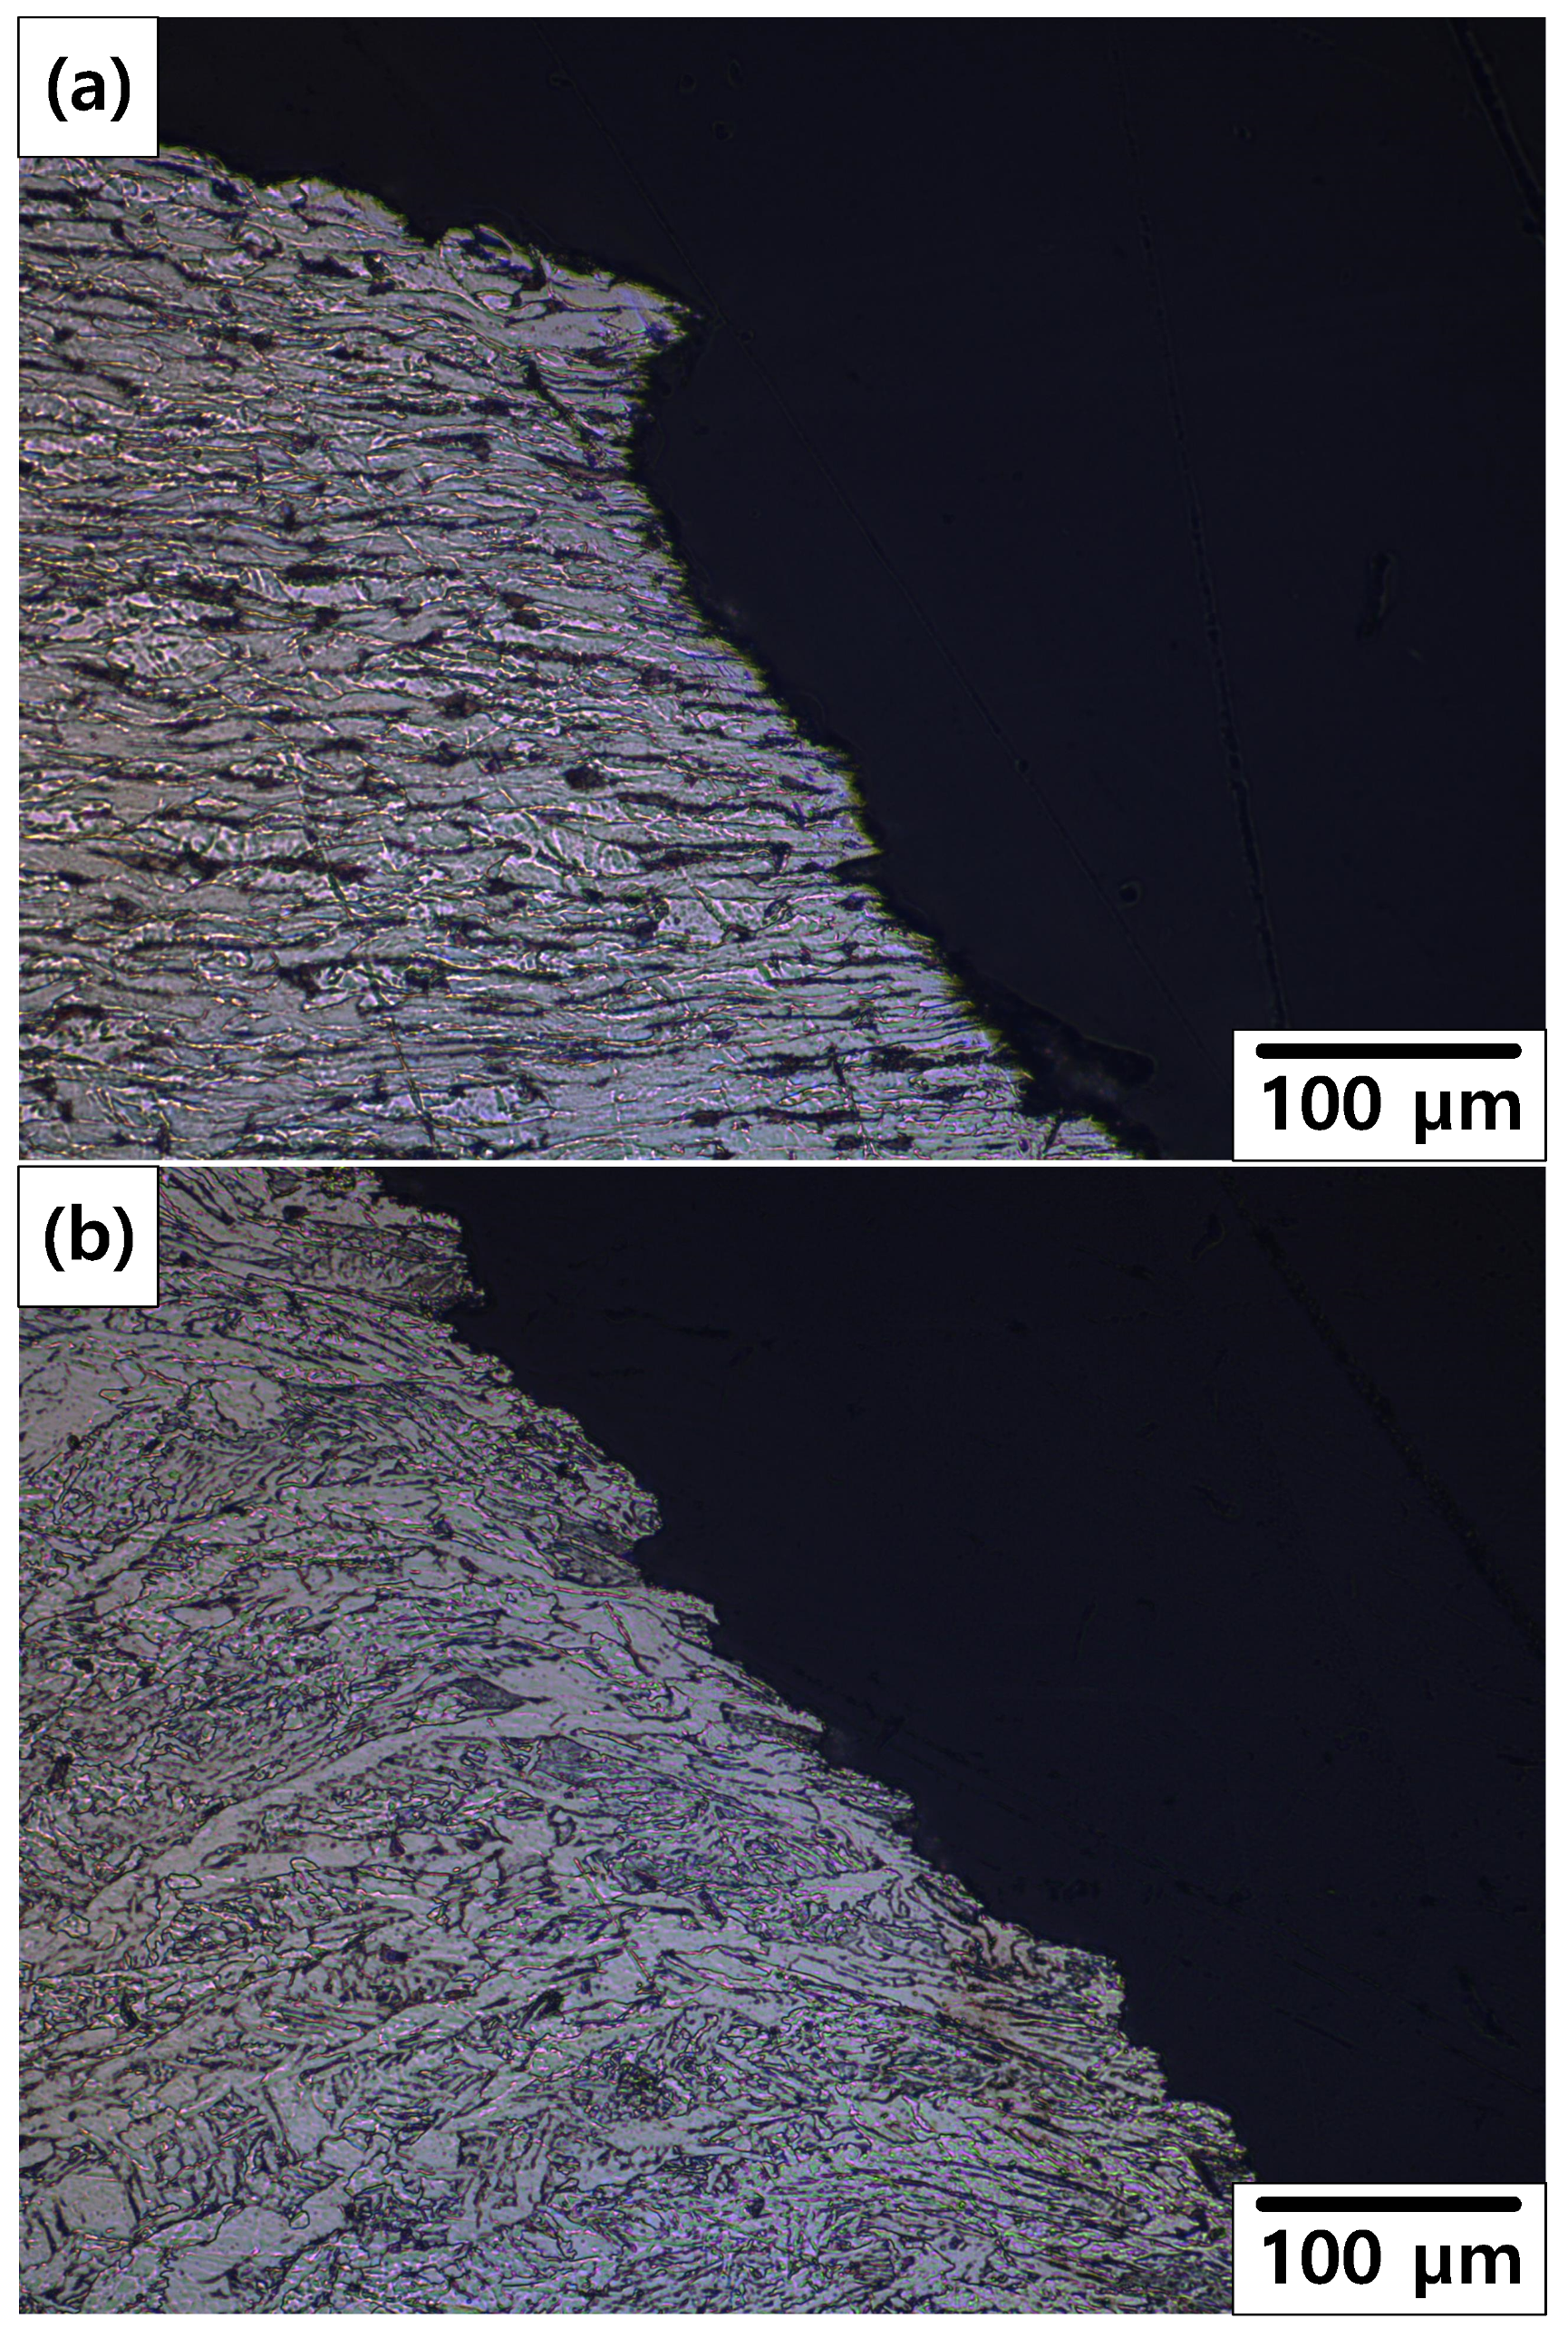
3.4. Microstructural Analysis

Figure 12 shows the OM images of the cross section of the welded carbon steel specimen from the weld zone to base metal. A typical microstructure of the weld zone of carbon steel pipe deposited by a GTAW process is shown in Figure 12a [25]. The structure in the as-received specimen is composed of acicular ferrite (AF), Widmanstatten ferrite (WF), and grain-boundary ferrite (GF) nucleated along the austenite grain boundary. The microstructure of HAZ and base metal (BM) showed an equiaxed ferrite (EF) microstructure with small pearlite (P) colonies, as shown in Figure 12b,c. However, grain size of HAZ was smaller than that of BM. As grain size decreased, corrosion rate increased in the case of the EF microstructure [26]. Furthermore, to prevent the large cathode/small anode effect, the weld zone was designed to have a higher potential than those of HAZ and BM. As a result of the galvanic corrosion, the corrosion rate of the weld zone was lower than those of HAZ and BM. Therefore, the corrosion rate of HAZ had the highest value in this work. These results are consistent with the following corrosion acceleration results.
Figure 13 shows the OM images of the cross section of the fracture fronts. As shown in Figure 13a, the stretched EF microstructure was observed on the 10% reduction specimen. As shown in Figure 13b, typical microstructure of the weld zone was observed on the 50% reduction specimen. It is suspected that the position of the fracture changed from BM or HAZ to weld metal as reduction increased. This indicates that a crack can occur more easily near the weldment after more severe corrosion.

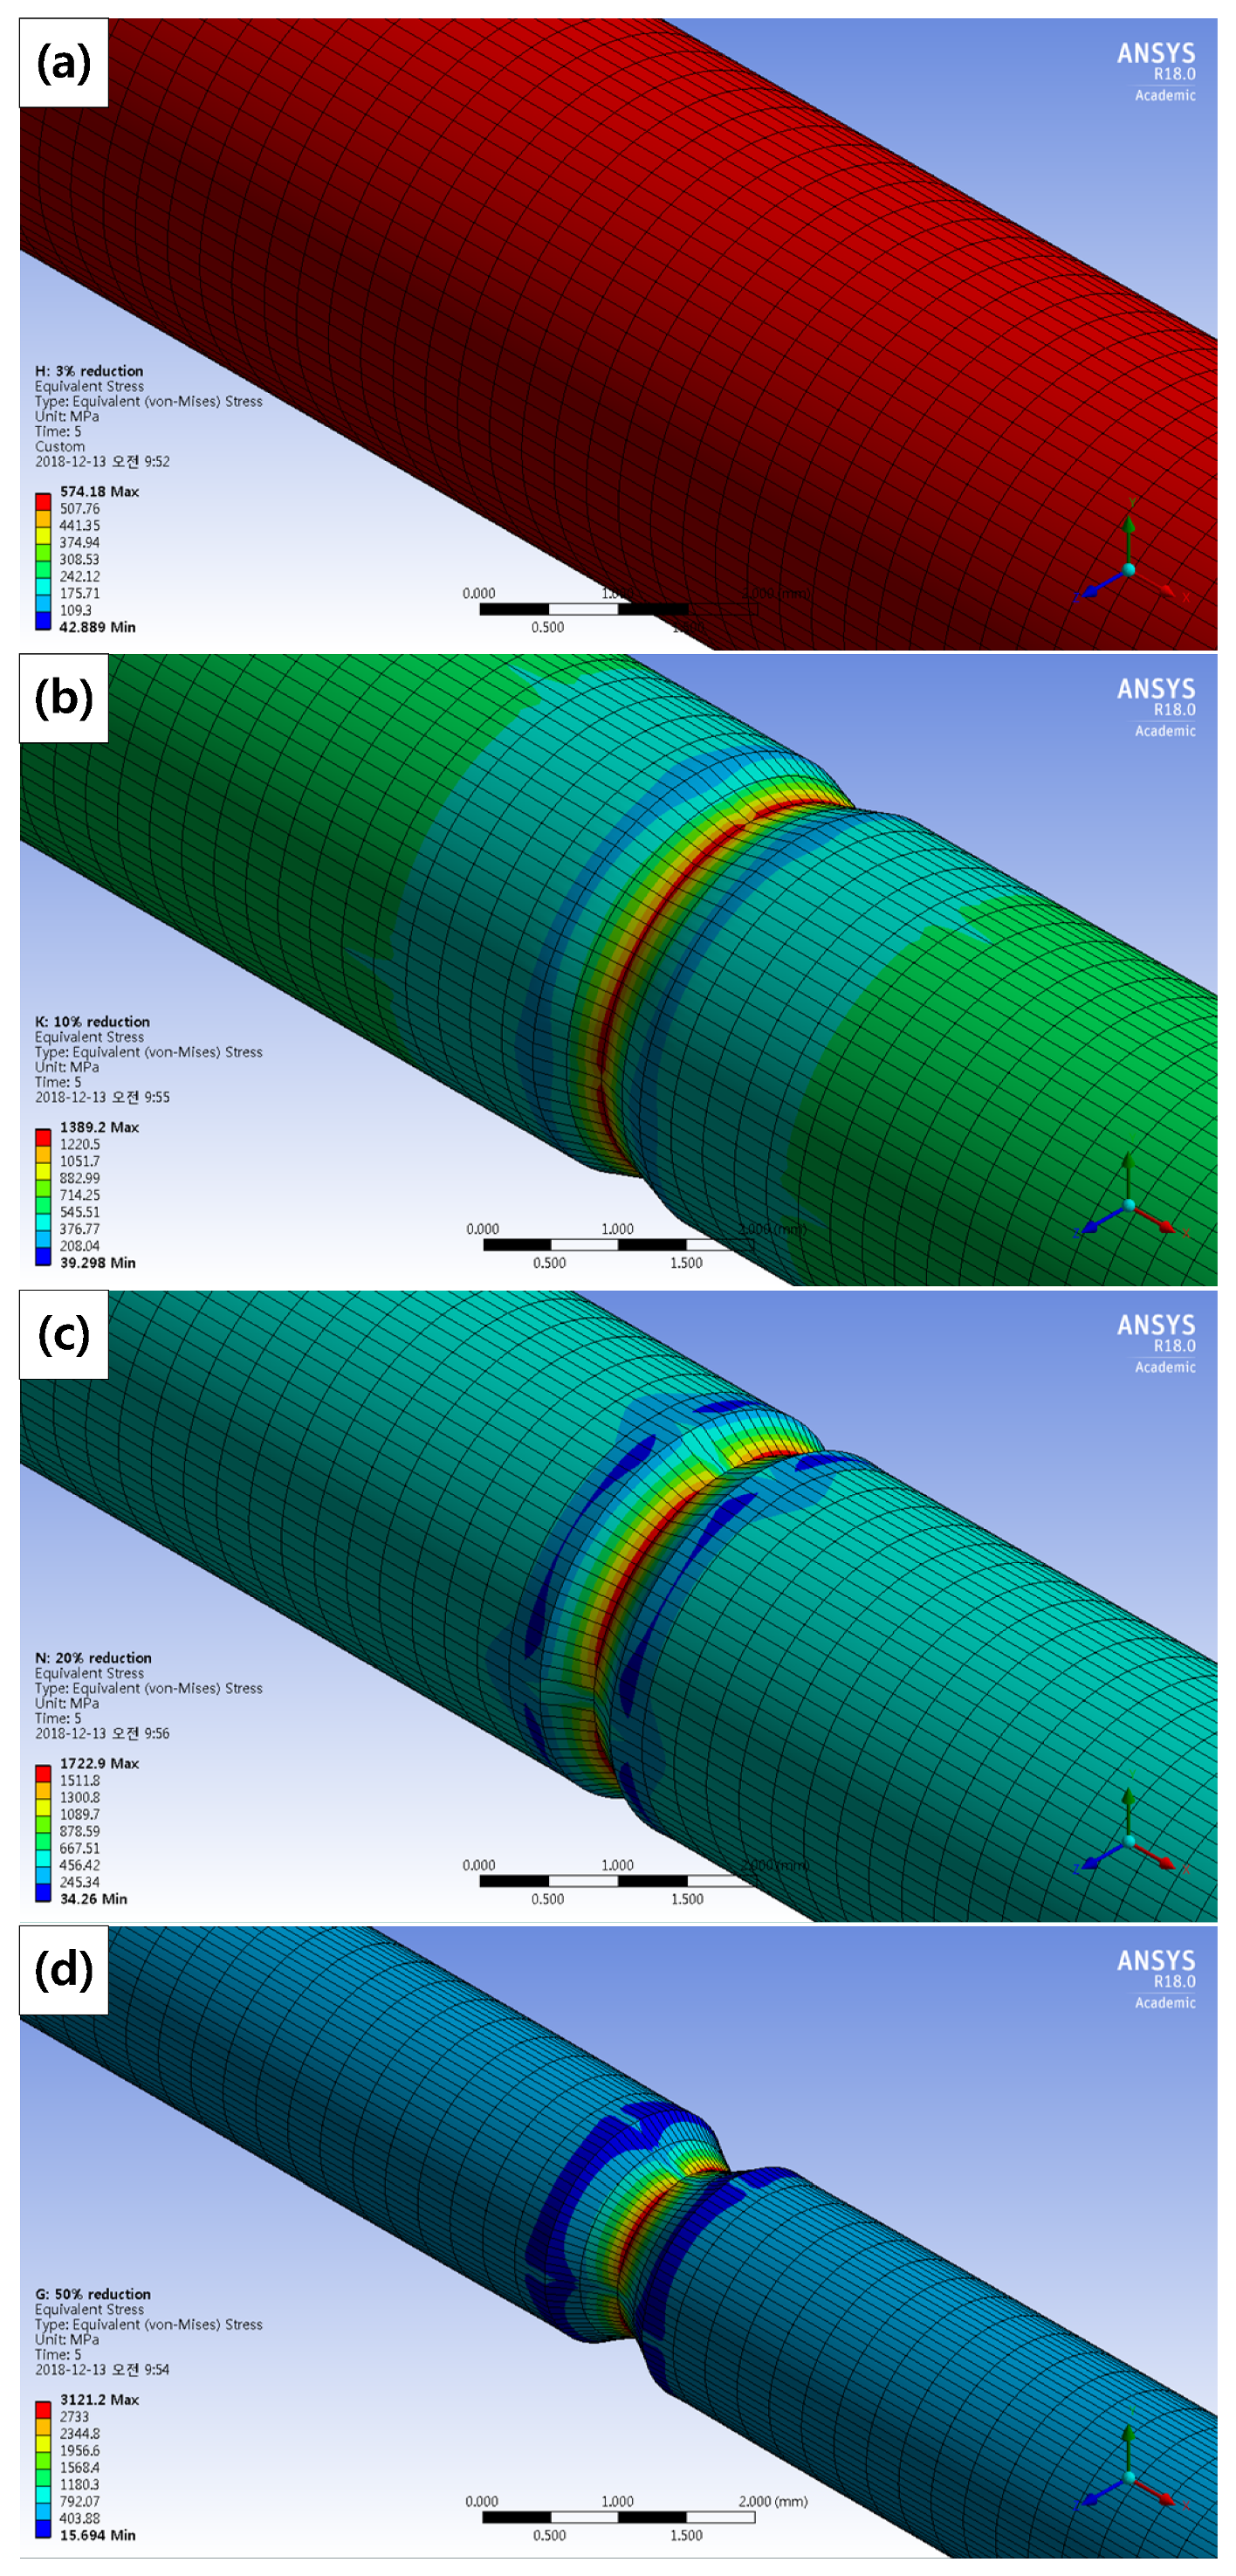
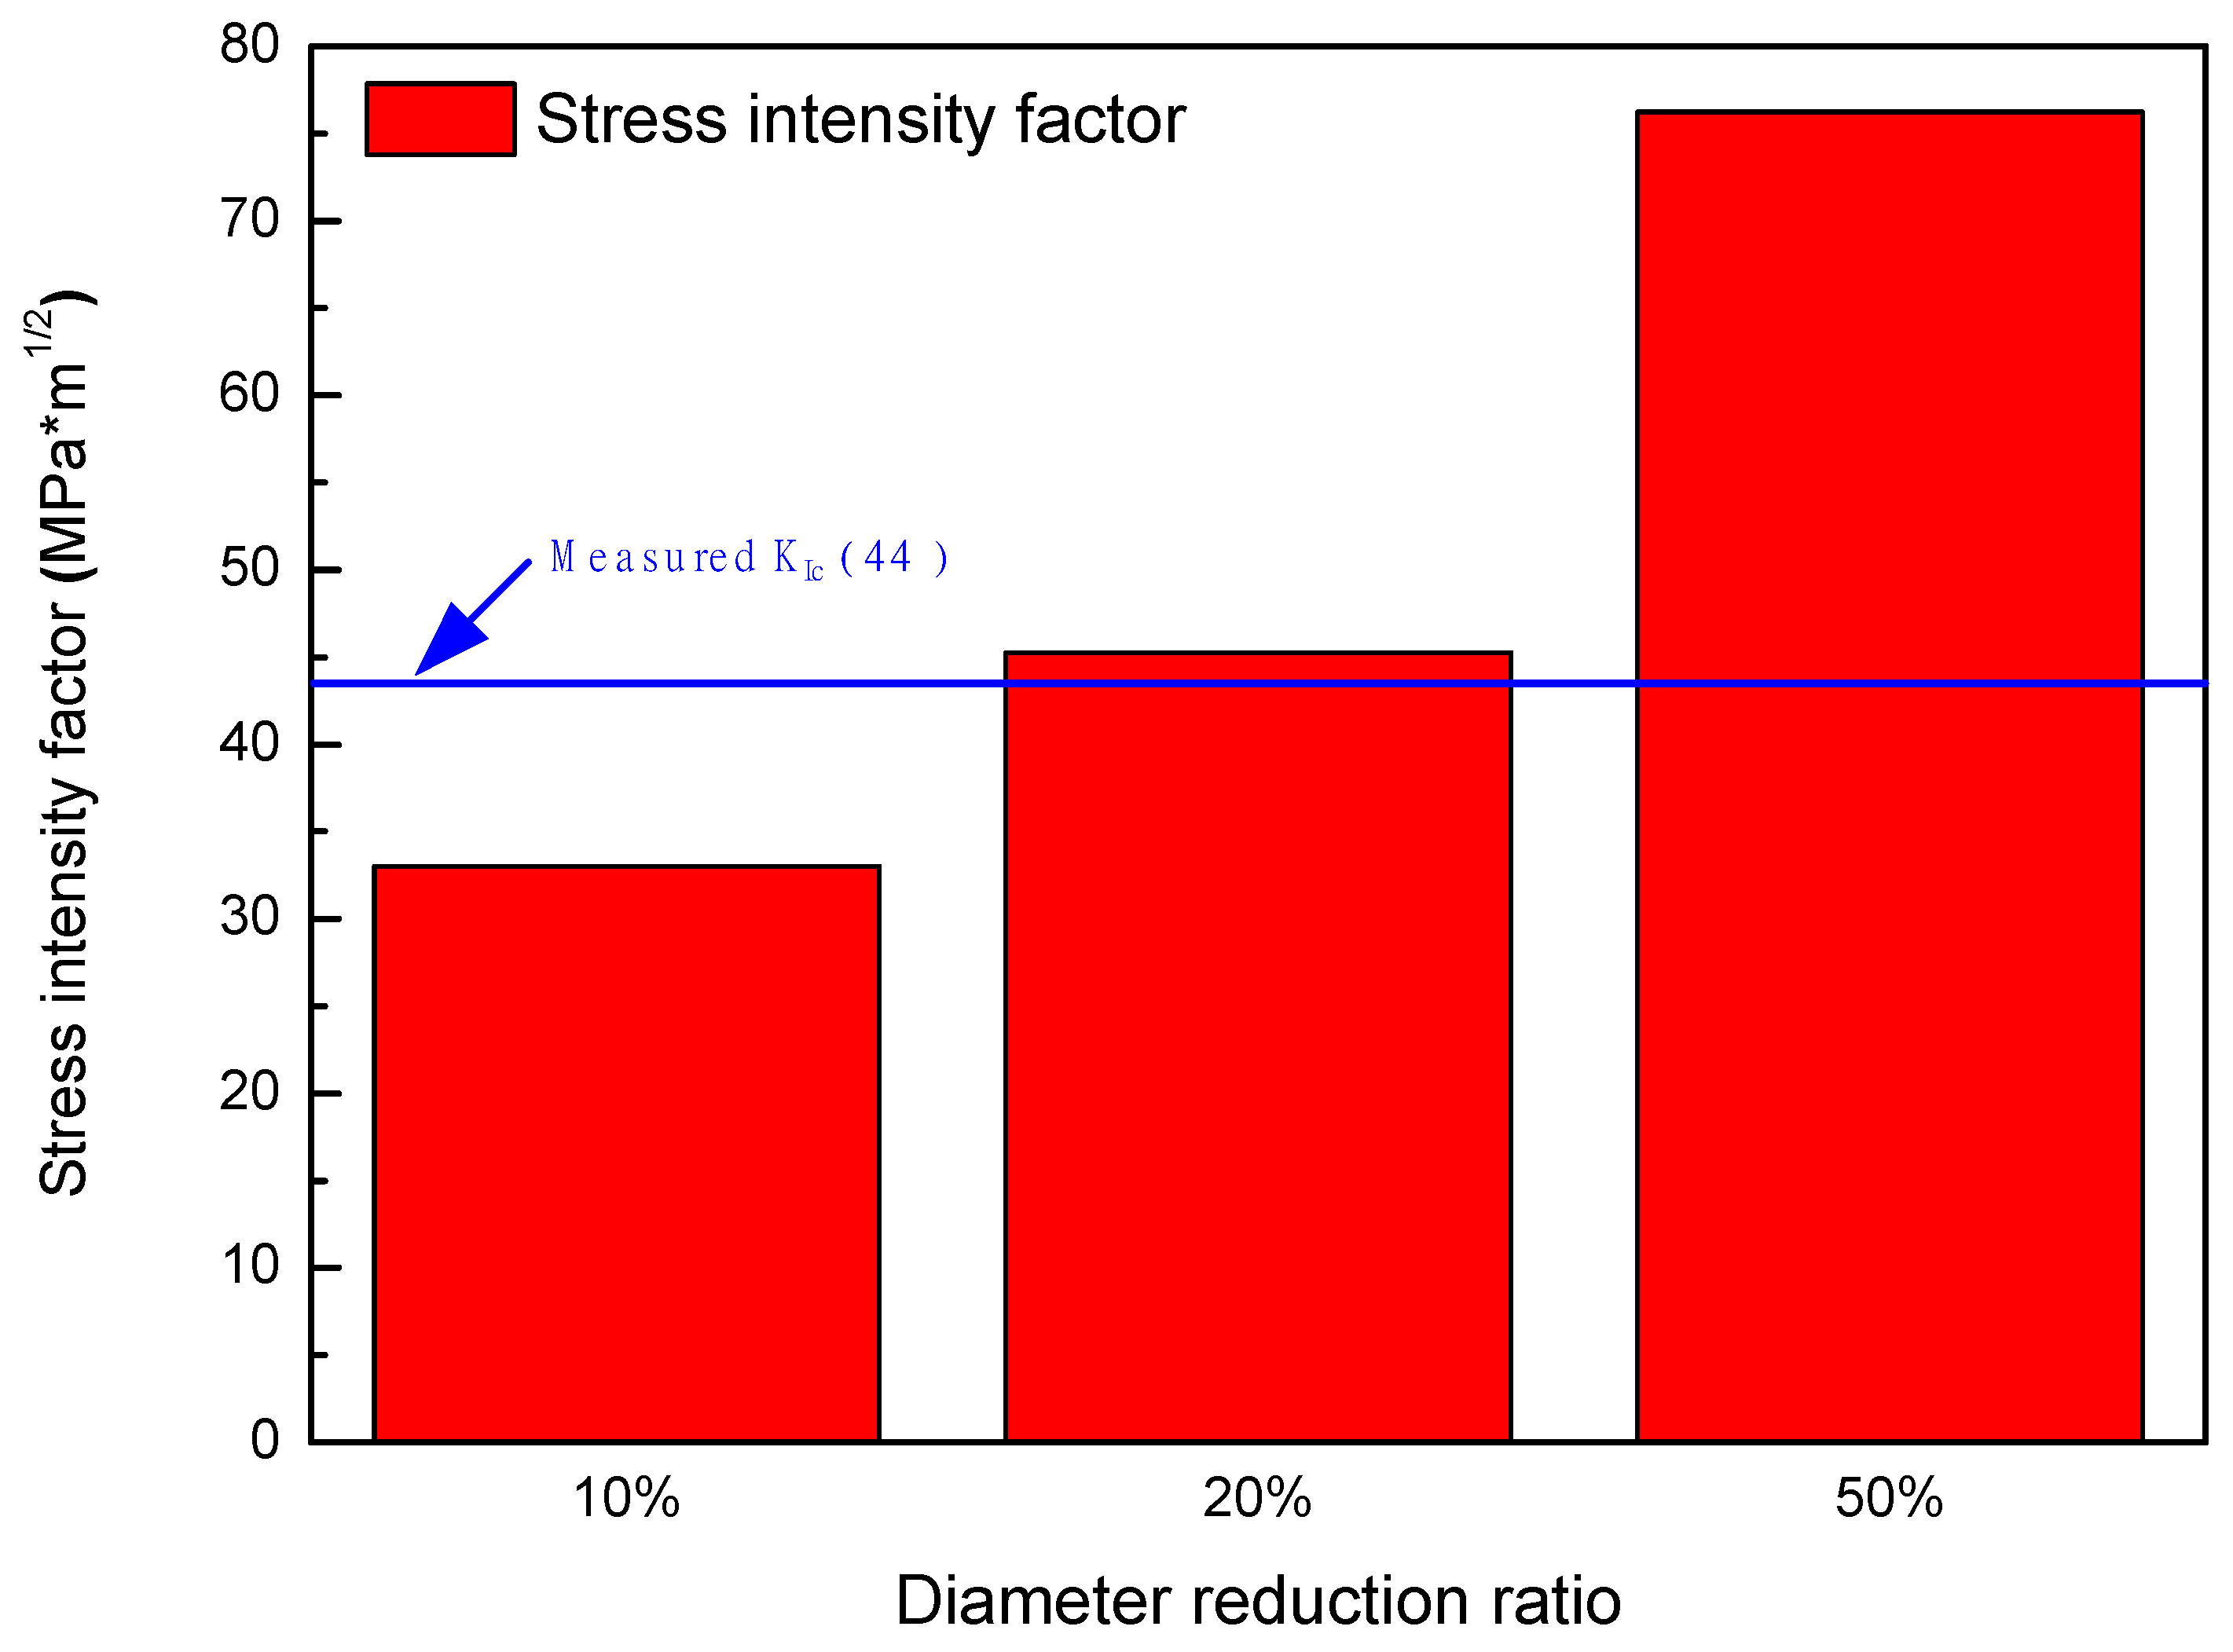
3.5. Stress Analysis and Stress Intensity Factor

Figure 14 shows the maximum stress distribution of the corroded tensile specimens under the condition (strain rate = 10−3 s−1) by the FEM simulation. The maximum stress according to the diameter reduction ratio from Figure 3 is listed in Table 9. As diameter reduction ratios increased, the maximum stress increased. Maximum stress appeared at the deepest corroded points in the 10%, 20%, and 50% reduction specimens. It is thought that a ductile fracture occurred because the maximum stress exceeded the yield stress (463.40 MPa) in 3% and 10% reduction specimens. Although stress concentration occurred in the 10% reduction specimen, its cross-section of fracture showed a ductile fracture. Brittle fracture occurred in 20% and 50% reduction specimens. Maximum stress distribution is not sufficient to investigate the cause of fracture-type change.
To investigate the cause of the fracture type change, the stress intensity factor (SIF, K) was calculated. The stress intensity factor is generally applied to determine the risk of brittle fracture in a crack on the surface. SIF is based on the theory of fracture mechanics and has been employed to quantify the asymptotic stress distribution close to a locally corroded region [27]. For the specific geometry of a structure, SIF is affected not only by the applied stresses, but also by the overall geometry of the structure and crack. Mode I stress intensity factor (KI) for a crack or pitting on a pipe surface can be expressed as follows [28,29]:
K I   =   Y σ 0 π a   ,
where σ0 is the applied stress, Y is a function that depends on both crack and specimen sizes and geometries, and a is the depth of the crack (corroded surface). In this work, the maximum stress was used as the value of Yσ0 for calculation.
SIF values calculated by using the results of FE simulation for the specimens according to diameter reduction ratios are listed in Table 9 and shown in Figure 15. Under the 10% reduction condition, KI (33.03 MPa m1/2) was lower than the measured KIc (44 MPa m1/2), which means that brittle fracture at the deepest corroded point could not occur. However, KI values in the 20% reduction (45.28 MPa m1/2) and 50% reduction (76.23 MPa m1/2) were higher than the KIc value. This indicated that geometric changes due to corrosion increased the SIF and induced brittle fracture of the welded joint.

4. Conclusions

In this study, the effect of corrosion on mechanical properties of welded carbon steel pipe was investigated using electrochemical and mechanical analyses. Using the galvanostatic method, the deepest corroded point between weld zone and base metal region was observed on the specimens. This suggests that corrosion was concentrated due to the dissimilarity of the microstructure. The results of the tensile test show that 3% and 10% diameter reduction specimens had no considerable degradation. The ductile fracture appeared regardless of the deepest corroded point. However, 20% reduction specimens showed a great decrease of elongation and 50% diameter reduction specimens showed remarkable decrease of elongation and strength values. In addition, 20% and 50% diameter reduction specimens showed brittle fracture at the deepest corroded point. As the diameter reduction increased, the maximum principal stress evaluated by FEM method increased. Unlike that of the 10% reduction specimen, stress intensity factors of 20% and 50% diameter reduction specimens were higher than the fracture toughness of weldment, the latter of which was measured by an instrumented indentation technique. Furthermore, in OM observation, it was determined that the position of the fracture changed from BM or HAZ to weld metal with the increase of diameter reduction. This indicates that a crack can occur more easily near the weldment after more severe corrosion. Therefore, corrosion leads to degradation of the mechanical properties of welded carbon steel pipe by the formation of stress concentration geometry. It increases the stress intensity factor of the specimen and the risk of brittle fracture in a district heating water environment.

Author Contributions

S.-J.K. performed the data analyses and the conception of the study; W.-C.K. helped perform the analysis with tensile test results; J.-H.A. and Y.-S.K. drafted the manuscript; J.-G.K. contributed to the writing–review and editing.

Funding

This research was supported by the Korea District Heating Corporation (No. 0000000014524).

Conflicts of Interest

The authors declare no conflict of interest.

References

  1. Protić, M.; Shamshirband, S.; Petković, D.; Abbasi, A.; Kiah, M.L.; Unar, J.A.; Živković, L.; Raos, M. Forecasting of consumers heat load in district heating systems using the support vector machine with a discrete wavelet transform algorithm. Energy 2015, 87, 343–351. [Google Scholar] [CrossRef]
  2. Kwon, O.K.; Cha, D.A.; Park, C.S. Performance evaluation of a two-stage compression heat pump system for district heating using waste energy. Energy 2013, 57, 375–381. [Google Scholar] [CrossRef]
  3. Roberge, P.R. Corrosion Inspection and Monitoring; John Wiley & Sons: Hoboken, NJ, USA, 2007; Volume 2, pp. 154–196. [Google Scholar]
  4. Garverick, L. Corrosion in Petrochemical Industry, 2nd ed.; ASM International: Novelty, OH, USA, 1994; pp. 3–48. [Google Scholar]
  5. Gutzeit, J.; Merrick, R.D.; Scharfstein, L.K. ASM Metals Handbook; ASM International: Novelty, OH, USA, 2006; Volume 13, pp. 1262–1287. [Google Scholar]
  6. Nasirpouri, F.; Mostafaei, A.; Fathyunes, L.; Jafari, R. Assessment of localized corrosion in carbon steel tube-grade AISI 1045 used in output oil-gas separator vessel of desalination unit in oil refinery industry. Eng. Fail. Anal. 2014, 40, 75–88. [Google Scholar] [CrossRef]
  7. Daneshvar-Fatah, F.; Mostafaei, A.; Hosseinzadeh-Taghani, R.; Nasirpouri, F. Caustic corrosion in a boiler waterside tube: Root cause and mechanism. Eng. Fail. Anal. 2013, 28, 69–77. [Google Scholar] [CrossRef]
  8. Mostafaei, A.; Peighambari, S.M.; Nasirpouri, F. Failure analysis of monel packing in atmospheric distillation tower under the service in the presence of corrosive gases. Eng. Fail. Anal. 2013, 28, 241–251. [Google Scholar] [CrossRef]
  9. Shirinzadeh-Dastgiri, M.; Mohammadi, J.; Behnamian, Y.; Eghlimi, A.; Mostafaei, A. Metallurgical investigations and corrosion behavior of failed weld joint in AISI 1518 low carbon steel pipeline. Eng. Fail. Anal. 2015, 53, 78–96. [Google Scholar] [CrossRef]
  10. Srivastava, B.K.; Tewari, S.P.; Prakash, J. A reivew on effect of preheating and/or post weld heat treatment (PWHT) on mechanical behaviour of ferrous metals. Int. J. Eng. Sci. Tech. 2010, 2, 625–631. [Google Scholar]
  11. Xue, Q.; Benson, D.; Meyers, M.A.; Nesterenko, V.F.; Olevsky, E.A. Constitutive response of welded HSLA 100 steel. Mat. Sci. Eng. 2003, A354, 166–179. [Google Scholar] [CrossRef]
  12. Raamirez, J.E.; Mishael, S.; Shockley, R. Properties and sulfide stress cracking resistance of coarse-grained heat-affected zones in V-micro alloyed X60 Steel Pipe. Weld. J. 2005, 84, 113–123. [Google Scholar]
  13. Samuel, E.I.; Choudhary, B.K.; Rao, B.S. Influence of post-weld heat treatment on tensile properties of modified 9Cr-1Mo ferritic steel base metal. Mater. Sci. Tech. 2007, 23, 992–999. [Google Scholar] [CrossRef]
  14. Tavakoli Shoushtari, M.R.; Moayed, M.H.; Davoodi, A. Post-weld heat treatment influence on galvanic corrosion of GTAW of 17-4PH stainless steel in 3.5%NaCl. Corr. Eng. Sci. Tech. 2011, 46, 415–424. [Google Scholar] [CrossRef]
  15. Wang, W.; Zhou, A.; Fu, G.; Li, C.Q.; Robert, D.; Mahmoodian, M. Evaluation of stress intensity factor for cast iron pipes with sharp corrosion pits. Eng. Fail. Anal. 2017, 81, 254–269. [Google Scholar] [CrossRef]
  16. Apostolopoulos, C.A.; Papadakis, V.G. Consequences of steel corrosion on the ductility properties of reinforcement bar. Constr. Build. Mater. 2008, 22, 2316–2324. [Google Scholar] [CrossRef]
  17. Almusallam, A.A. Effect of degree of corrosion on the properties of reinforcing steel bars. Constr. Build. Mater. 2001, 15, 361–368. [Google Scholar] [CrossRef]
  18. Du, Y.G.; Clark, L.A.; Chan, A.H.C. Effect of corrosion on ductility of reinforcing bars. Mag. Concrete. Res. 2005, 57, 407–419. [Google Scholar] [CrossRef] [Green Version]
  19. Du, Y.G.; Clark, L.A.; Chan, A.H.C. Residual capacity of corroded reinforcing bars. Mag. Concrete. Res. 2005, 57, 135–147. [Google Scholar] [CrossRef]
  20. ASTM, G5.-5, Test Method for Making Potentiostatic and Potentiodynamic Anodic Polarization Measurements; ASTM International: West Conshohocken, PA, USA, 2004.
  21. Ahn, W.; Reddy, D.V. Galvanostatic testing for the durability of marine concrete under fatigue loading. Cement. Concrete. Res. 2001, 31, 343–349. [Google Scholar] [CrossRef]
  22. ASTM, E8–99-Standard test methods for tension testing of metallic materials; ASTM International: West Conshohocken, PA, USA, 2001.
  23. Jones, D.A. Principles and Prevention of Corrosion, 2nd ed.; Prentice-Hall: Hoboken, NJ, USA, 1996; pp. 75–77. [Google Scholar]
  24. Macdonald, J.R.; Kenan, W.R. Impedance Spectroscopy: Emphasizing Solid Materials and Systems; John Wiley & Sons: New York, NY, USA, 1987; p. 13. [Google Scholar]
  25. Linnert, G.E. Welding Metallurgy: Carbon and Alloy Steels, 4th ed.; American Welding Society: Miami, FL, USA, 1994; pp. 74–88. [Google Scholar]
  26. Ralston, K.D.; Birbilis, N. Effect of grain size on corrosion: A review. Corrosion 2010, 66, 075005. [Google Scholar] [CrossRef]
  27. Lazzarin, P.; Tovo, R. A unified approach to the evaluation of linear elastic stress fields in the neighborhood of cracks and notches. Int. J. Fract. 1996, 78, 3–19. [Google Scholar] [CrossRef]
  28. Hertzberg, R.W. Deformation and Fracture Mechanics of Engineering Materials, 5th ed.; Wiley: New York, NY, USA, 1996; pp. 571–600. [Google Scholar]
  29. Williams, M.L. Stress singularities resulting from various boundary conditions. J. Appl. Mech. 1952, 19, 526–528. [Google Scholar]
Figure 1. Schematic illustration of sectioning procedures to prepare tensile test specimen from welded pipes.
Materials 12 03682 g001
Figure 2. Schematic illustrations of (a) the three-electrode cell and (b) the exposed area of the specimen.
Materials 12 03682 g002
Figure 3. 3D scan images of specimens after using the galvanostatic method: (a) 3% reduction, (b) 10% reduction, (c) 20% reduction, and (d) 50% reduction ratios.
Materials 12 03682 g003
Figure 4. Meshed 3D model applied to computer simulation.
Materials 12 03682 g004
Figure 5. Boundary conditions for finite element method (FEM) simulation of a corroded tensile specimen.
Materials 12 03682 g005
Figure 6. Schematic illustration of welded pipes for instrumented indentation technique.
Materials 12 03682 g006
Figure 7. Potentiodynamic polarization curve of welded carbon steel in a deaerated synthetic district heating water at 60 °C and a pH of 10.0.
Materials 12 03682 g007
Figure 8. Optical microscope (OM) images of the welded carbon steel specimens after a galvanostatic test according to charge amounts: (a) 0%, (b) 3%, (c) 10%, (d) 20%, and (e) 50% reduction ratios.
Materials 12 03682 g008
Figure 9. Stress–strain curves of accelerated corrosion specimens.
Materials 12 03682 g009
Figure 10. OM images of fracture morphologies of the corroded tensile specimens after tensile tests: (a) 0%, (b) 3%, (c) 10%, (d) 20%, and (e) 50% reduction ratios.
Materials 12 03682 g010
Figure 11. Scanning electron microscope (SEM) images of fracture surface morphologies of the corroded tensile specimens after tensile tests: (a) 0%, (b) 3%, (c) 10%, (d) 20%, and (e) 50% reduction ratios.
Materials 12 03682 g011aMaterials 12 03682 g011b
Figure 12. OM of welded carbon steel specimens from the weld zone to base metal: (a) Weld zone, (b) heat affected zone, and (c) base metal.
Materials 12 03682 g012
Figure 13. OM images of the cross section of the fracture fronts: (a) 10% reduction specimen and (b) 50% reduction specimen.
Materials 12 03682 g013
Figure 14. Maximum stress distribution of the corroded tensile specimens according to the diameter reduction by computer simulation: (a) 3%, (b) 10%, (c) 20%, and (d) 50% diameter reduction specimens.
Materials 12 03682 g014
Figure 15. Stress intensity factors calculated for cases of the corroded tensile specimens according to diameter reduction ratios.
Materials 12 03682 g015
Table 1. Chemical composition of carbon steel pipe used in the district heating system.
ElementsCMnPSFe
Composition
(wt.%)
0.251.000.0400.040Bal.
Table 2. Welding procedure specifications.
Welding ProcessGas Tungsten Arc Welding (GTAW)
Joint designSingle-V joint with a 65 ± 5 degree included angle
and a 1.6 ± 0.8 mm root face
Number of passes1–2 or higher
ElectrodeER70S-G (2.4 or 3.2 mm diameter, Thoriated, TGC-50)
Voltage11–15 V or 22–28 V
Current80–130 A or 100–170 A
PolarityDirect current straight polarity (DCSP)
Travel speed5–10 cm/min or 6–16 cm/min
Welding atmosphereArgon, 7–17 L/min
Table 3. Chemical composition of the synthetic district heating water (mg/L).
ElementsNaClMg(OH)2CaCO3NH4OH
Composition15.010.482.6510.28
Table 4. Results of a potentiodynamic polarization test for the weldment specimen in a deaerated synthetic district heating water at 60 °C and a pH of 10.0.
SpecimensEcorr
(mVSCE)
icorr
(μA/cm2)
βa
(V/Decade)
βc
(V/decade)
Corrosion Rate
(mm/Year)
As-received−678.516.40.0210.0380.2
Table 5. Crack depth (a), crack width (2c), diameter (R), and measured diameter reduction ratio of each specimen.
Specimens
(% Diameter Reduction)
a (mm)2c (mm)R (mm)
0%3.95
3%3.87
10%0.180.963.53
20%0.220.583.18
50%0.190.761.96
Table 6. Conditions of the galvanostatic test (S = 3.9 cm2).
Charge AmountsicorrEquivalent Aging Time (Year)iappTest Time (h)
016 uA/cm201 mA/cm20
811.70.457.8
2435.21173.5
4058.72289.1
8117.44578.2
Table 7. Measured diameter reduction of the corroded tensile specimens.
Charge AmountsDiameter Reduction Ratio (%)Diameter (mm)Diameter Reduction (mm)
03.95
811.733.870.08
2435.2103.530.42
4058.7203.180.77
8117.4501.961.99
Table 8. Mechanical properties of the corroded tensile specimens.
SpecimensMechanical Properties
Yield Stress (MPa)Tensile Stress (MPa)Elongation (%)
0% reduction374.54463.4016.94
3% reduction347.74454.1316.75
10% reduction332.62450.6213.93
20% reduction336.27465.6210.36
50% reduction208.09282.121.28
Table 9. Maximum stress from FEM simulations, crack depth (a), and stress intensity factors of the corroded tensile specimens.
SpecimensMaximum Stress (MPa)a (mm)Stress Intensity Factor
( MPa m )
0% reduction
3% reduction578.06
10% reduction1389.20.1833.03
20% reduction1722.90.2245.28
50% reduction3121.20.1976.23

