Features of the Microstructure and Chemical Compositions of Vanadium-Containing Slags Including Determination of Vanadium Oxidation Degrees


Abstract
1. Introduction
2. Materials and Methods
3. Results and Discussion
4. Conclusions
Author Contributions
Funding
Conflicts of Interest
References
- Moskalyk, R.R.; Alfantazi, A.M. Processing of vanadium: A review. Miner. Eng. 2003, 169, 793–805. [Google Scholar] [CrossRef]
- Lyakishev, N.P.; Slotvinsky-Sidak, N.P.; Pliner, Y.L.; Lappo, S.I. Vanadium in Ferrous Metallurgy; Metallurgiya: Moscow, Russia, 1983; p. 192. (In Russian) [Google Scholar]
- Barolin, H. Oxidation of Vanadium Slag; Metallurgical Industry Press: Beijing, China, 1982. [Google Scholar]
- Zhang, J.; Zhang, W.; Xue, Z. An Environment-Friendly Process Featuring Calcified Roasting and Precipitation Purification to Prepare Vanadium Pentoxide from the Converter Vanadium Slag. Metals 2019, 9, 21. [Google Scholar] [CrossRef]
- Liu, Z.H.; Li, Y.; Chen, M.L.; Nueraihemaiti, A.; Du, J.; Fan, X.; Tao, C.Y. Enhanced leaching of vanadium slag in acidic solution by eletro-oxidation. Hydrometallurgy 2016, 159, 1–5. [Google Scholar] [CrossRef]
- Mirazimi, S.M.J.; Rashchi, F.; Saba, M. A new approach for direct leaching of vanadium from LD converter slag. Chem. Eng. Res. Des. 2015, 94, 131–140. [Google Scholar] [CrossRef]
- Zhang, G.Q.; Luo, D.M.; Deng, C.H.; Lv, L.; Liang, B.; Li, C. Simultaneous extraction of vanadium and titanium from vanadium slag using ammonium sulfate roasting-leaching process. J. Alloys Compd. 2018, 742, 504–511. [Google Scholar] [CrossRef]
- Zhang, J.H.; Zhang, W.; Xue, Z.L. Oxidation kinetics of vanadium slag roasting in the presence of calcium oxide. Min. Proc. Ext. Met. Rev. 2017, 38, 265–273. [Google Scholar] [CrossRef]
- Xiang, J.Y.; Huang, Q.Y.; Lv, X.W.; Bai, C.G. Extraction of vanadium from converter slag by two-step sulfuric acid leaching process. J. Clean. Prod. 2018, 170, 1089–1101. [Google Scholar] [CrossRef]
- Zhang, Y.; Bao, S.; Liu, T.; Chen, T.; Huang, J. The technology of extracting vanadium from stone coal in China: History, current status and future prospects. Hydrometallurgy 2011, 109, 116–124. [Google Scholar] [CrossRef]
- Zhang, G.; Zhang, T.; Lü, G.; Zhang, Y.; Liu, Y.; Liu, Z. Extraction of vanadium from vanadium slag by high pressure oxidative acid leaching. Int. J. Miner. Met. Mater. 2015, 22, 21. [Google Scholar] [CrossRef]
- Wen, J.; Jiang, T.; Wang, J.; Gao, H.; Lu, L. An efficient utilization of high chromium vanadium slag: Extraction of vanadium based on manganese carbonate roasting and detoxification processing of chromium-containing tailings. J. Hazard. Mater. 2019, 378, 120733. [Google Scholar] [CrossRef]
- Gao, M.; Xue, X.; Li, L.; Yang, H.; Bai, R.; Wang, H. A novel method to extract vanadium from vanadium-bearing steel slag using sodium carbonate solution. Physicochem. Probl. Miner. Process. 2018, 54, 911–921. [Google Scholar]
- Gao, M.; Xue, X.; Li, L.; Yang, H.; Chen, D. Leaching behavior and kinetics of vanadium extraction from vanadium-bearing steel slag. Met. Res. Technol. 2019, 116, 407. [Google Scholar] [CrossRef]
- Smirnov, L.A.; Rovnushkin, V.A.; Smirnov, A.L. Formation and phase-mineralogical composition of converter slags. Russ. Metall. 2015, 3, 191–198. [Google Scholar] [CrossRef]
- Oguntimehin, I.I.; Ipinmoroti, K.O. Solvent Extraction of Vanadium from Nigerian Bitumen Using Tri-Butylphosphate. J. Appl. Sci. 2007, 7, 4028–4031. [Google Scholar]
- Chekmarev, A.M.; Buchikhin, E.P.; Parygin, I.A.; Smirnov, K. Patterns of extractive leaching of uranium and vanadium from an ore. Found. Chem. Eng. 2011, 45, 776. [Google Scholar] [CrossRef]
- Baikonurova, A.O. Vanadium Extraction Opportunities in Alumina Production and Vanadium Complex Study in Organic Phase. Eurasian Chem. Tech. J. 2003, 5, 161–164. [Google Scholar] [CrossRef]
- Nazari, E.; Rashchi, F.; Saba, M.; Mirazimi, M. Simultaneous recovery of vanadium and nickel from power plant fly-ash: Optimization of parameters using response surface methodology. Waste Manag. 2014, 34, 2687–2696. [Google Scholar] [CrossRef]
- Painuly, A.S. Separation and recovery of vanadium from spent vanadium pentaoxide catalyst by Cyanex 272. Environ. Syst. Res. 2015, 4, 7. [Google Scholar] [CrossRef]
- Kologrieva, U.A.; Seryogin, A.N.; Pochtaryov, A.N. Development of sulfuric acid technology for processing sludge from the hydrometallurgical production of vanadium pentoxide. Probl. Ferr. Metall. Mater. Sci. 2015, 4, 63–67. (In Russian) [Google Scholar]
- Xiang, J.; Huang, Q.; Lv, W.; Pei, G.; Lv, X.; Bai, C. Recovery of tailings from the vanadium extraction process by carbothermic reduction method: Thermodynamic, experimental and hazardous potential assessment. J. Hazard. Mater. 2018, 357, 128–137. [Google Scholar] [CrossRef]
- ISO 4967:2013(E). Steel—Determination of Content of Nonmetallic Inclusions—Micrographic Method Using Standard Diagrams, 3rd ed.; International Organization for Standardization: Geneva, Switzerland, 2013; 36p. [Google Scholar]
- Petruck, W. Applied Mineralogy in the Mining Industry; Elsevier: Amsterdam, The Netherlands, 2000; 288p. [Google Scholar]
- Gottlieb, P. The revolutionary impact of automated mineralogy on mining and mineral processing. In Proceedings of the XXIV International Mineral Processing Congress, Beijing, China, 24–28 September 2008. [Google Scholar]
- ImageJ. An Open Platform for Scientific Image Analysis. Available online: https://imagej.net/Welcome (accessed on 6 August 2019).
- Shaffer, M. Discriminating hematite and magnetite and quantifying their associations using the jktech mineral liberation analyzer. In Proceedings of the Conference Proceedings of 48 Annual Conference of Metallurgists, Sudbury, ON, Canada, 23–26 August 2009; p. 73. [Google Scholar]
- UNIFIT for Windows Software. Unifit Scientific Software GmbH. Available online: http://www.unifit-software.de (accessed on 6 August 2019).
- Yang, S.; Xing, Y.; Wu, L.; Li, Y.; Liu, P.; Zhao, H.; Yu, Y.Y.; Gong, X.Q.; Yang, T.H.G. Single crystals with a curved surface. Nat. Commun. 2015, 5, 6355. [Google Scholar]
- Ratner, B.; Castner, D. Chapter 3. Electron spectroscopy for chemical analysis. In Surface Analysis—The Principal Techniques, 2nd ed.; Vickerman, J.C., Gilmore, I.S., Eds.; John Wiley & Sons, Ltd.: Hoboken, NJ, USA, 2009; pp. 47–112. [Google Scholar]
- Watts, J.F.; Wolstenholme, J. An Introduction to Surface Analysis by XPS and AES; John Wiley & Sons: Hoboken, NJ, USA, 2008; p. 212. [Google Scholar]
- Kovalev, A.I.; Wainstein, D.L. Surface analysis techniques for investigation of modified surfaces, nanocomposites, chemical, and structure transformations. In Self-Organization during Friction. Advance Surface Engineered Materials; Fox-Rabinovich, G.S., Totten, G.E., Eds.; Taylor & Francis Group: Boca Raton, NY, USA, 2006; pp. 81–120. [Google Scholar]


| Sample # | Al | Ca | Cr | Fe | Mg | Mn | P | S | Si | Ti | V | O |
|---|---|---|---|---|---|---|---|---|---|---|---|---|
| 1 | 0.68 | 1.56 | 2.58 | 25.3 | 0.93 | 11.6 | 0.012 | 0.011 | 6.57 | 7.48 | 12.1 | balance |
| 2 | 0.88 | 2.84 | 2.87 | 23.2 | 0.98 | 11.6 | 0.021 | 0.013 | 6.11 | 5.96 | 13.6 | balance |
| 3 | 1.27 | 1.55 | 2.79 | 24.0 | 1.83 | 10.6 | 0.016 | 0.006 | 5.23 | 7.74 | 13.2 | balance |
| 4 | 1.86 | 1.20 | 2.37 | 29.1 | 2.48 | 8.6 | 0.040 | 0.005 | 4.69 | 6.75 | 11.6 | balance |
| 5 | 2.27 | 1.97 | 2.45 | 22.4 | 1.78 | 9.3 | 0.027 | 0.013 | 8.05 | 5.04 | 12.0 | balance |
| Sample # | Phase Fraction, % | |||
|---|---|---|---|---|
| FeO·Fe2O3 | MnO·VXOY | TiO2 | Fe | |
| 1 | balance | 11.6 ± 1.1 | 9.2 ± 1.2 | 4.2 ± 0.7 |
| 2 | balance | 17.8 ± 1.6 | 8.2 ± 1.2 | 4.5 ± 0.8 |
| 3 | balance | 23.1 ± 1.8 | 1.7 ± 0.8 | 10.9 ± 1.4 |
| 4 | balance | 8.0 ± 1.0 | 21.6 ± 1.8 | 3.8 ± 0.7 |
| 5 | balance | 6.5 ± 0.9 | 24.1 ± 1.8 | 3.5 ± 0.6 |
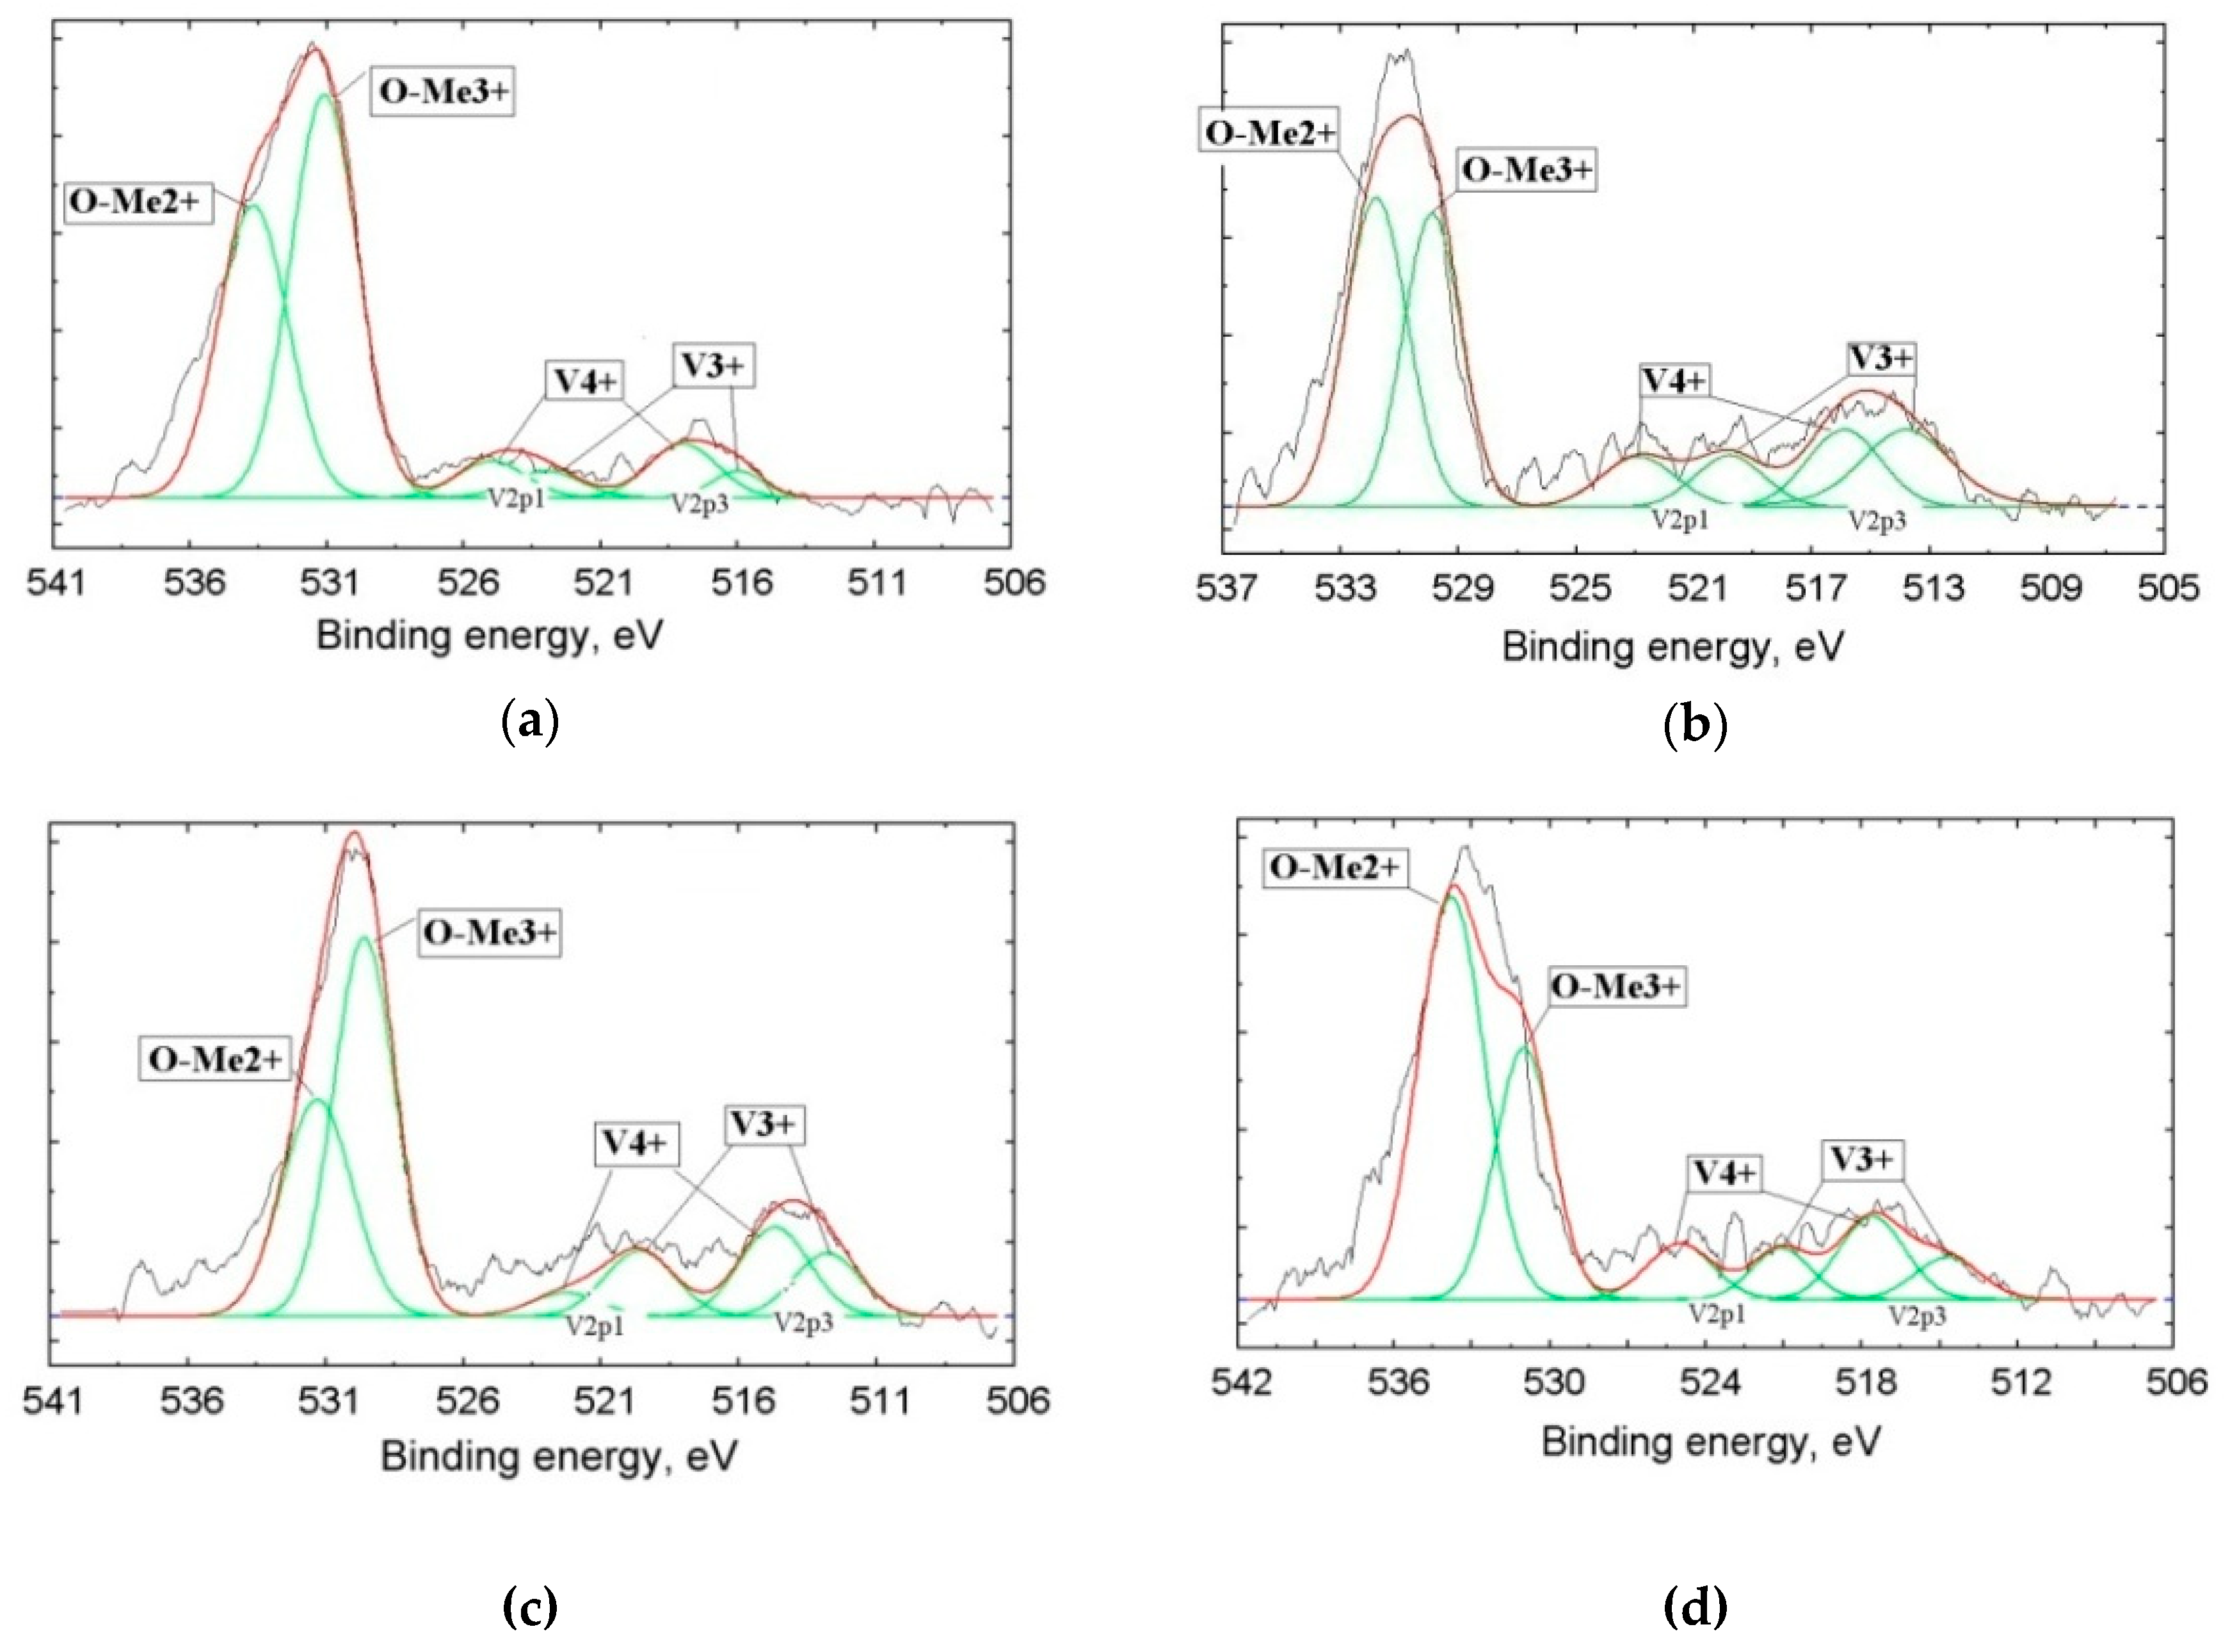
| Sample # | Binding Energy, eV | Oxidation Degree | Volume Fraction, % |
|---|---|---|---|
| 2 | 515.3; 522.4 | V3+ | 65.8 |
| 517.6; 524.5 | V4+ | 34.2 | |
| 531.1 | Me2+ | 43.1 | |
| 533.7 | Me3+ | 56.9 | |
| 3 | 513.6; 519.8 | V3+ | 56.4 |
| 516.4; 522.8 | V4+ | 43.6 | |
| 530.3 | Me2+ | 42.0 | |
| 531.6 | Me3+ | 58.0 | |
| 4 | 512.8; 519.6 | V3+ | 49.6 |
| 514.7; 522.3 | V4+ | 50.4 | |
| 529.6 | Me2+ | 39.6 | |
| 531.3 | Me3+ | 60.4 | |
| 5 | 513.5; 520.0 | V3+ | 34.8 |
| 516.5; 523.1 | V4+ | 65.2 | |
| 530.4 | Me2+ | 34.1 | |
| 532.0 | Me3+ | 65.9 |
© 2019 by the authors. Licensee MDPI, Basel, Switzerland. This article is an open access article distributed under the terms and conditions of the Creative Commons Attribution (CC BY) license (http://creativecommons.org/licenses/by/4.0/).
Share and Cite
Kovalev, A.; Wainstein, D.; Vakhrushev, V.; Volkov, A.; Kologrieva, U. Features of the Microstructure and Chemical Compositions of Vanadium-Containing Slags Including Determination of Vanadium Oxidation Degrees. Materials 2019, 12, 3578. https://doi.org/10.3390/ma12213578
Kovalev A, Wainstein D, Vakhrushev V, Volkov A, Kologrieva U. Features of the Microstructure and Chemical Compositions of Vanadium-Containing Slags Including Determination of Vanadium Oxidation Degrees. Materials. 2019; 12(21):3578. https://doi.org/10.3390/ma12213578
Chicago/Turabian StyleKovalev, Anatoly, Dmitry Wainstein, Vladimir Vakhrushev, Anton Volkov, and Ulyana Kologrieva. 2019. "Features of the Microstructure and Chemical Compositions of Vanadium-Containing Slags Including Determination of Vanadium Oxidation Degrees" Materials 12, no. 21: 3578. https://doi.org/10.3390/ma12213578
APA StyleKovalev, A., Wainstein, D., Vakhrushev, V., Volkov, A., & Kologrieva, U. (2019). Features of the Microstructure and Chemical Compositions of Vanadium-Containing Slags Including Determination of Vanadium Oxidation Degrees. Materials, 12(21), 3578. https://doi.org/10.3390/ma12213578