Abstract
The diffusion of five flavor organic molecules, including D-limonene, myrcene, ethyl hexanoate, 2-nonanone, and linalool in low density polyethylene (LDPE) film were investigated by combined experimental and molecular dynamics (MD) simulation studies. The diffusion coefficients derived from the prediction model, experimental determination, and MD simulation were compared, and the related microscopic diffusion mechanism was investigated. The effects of the presence of the flavor organic molecules on the diffusion of O2 and H2O in polyethylene (PE) were also studied by MD simulation. Results show that: The diffusion of five flavor molecules in LDPE is well followed to Fick’s second law by the immersion experiment; MD simulation indicates the dual mode diffusion mechanism of the flavor molecules is in LDPE; the diffusion coefficients from MD simulation are close to those from the experimental determination, but are slightly larger than those values; the presence of the flavor organic molecules hinders the diffusion of O2 and H2O, which can be well explained from the fraction of free volume (FFV) and interaction energy calculation results derived from MD simulation.
1. Introduction
Polyethylene (PE) is a kind of thermoplastic, which has excellent chemical stability, heat sealing, toughness and high elasticity, as well as cold resistance and water vapor barrier [1,2]. Low density polyethylene (LDPE) is commonly used in food packaging because of its excellent thermal sealing and chemical stability [3]. Food flavor is an important quality characteristic of food [4]. It is reflected by volatile compounds in food, which determines the quality of food [5,6,7]. Food flavor molecules will be adsorbed by packaging materials after long-term storage, and the change of its quantity will lead to the change of food flavor, thus, affecting food sales and consumer complaints [8].
The adsorption of food flavor molecules in packaging materials mainly depends on the characteristics of flavor molecules, packaging materials, storage environment and other factors, which subsequently changes the flavor of food or the properties of polymer materials [9]. During the last decades, many researchers have studied the adsorption of flavor molecules into different packaging materials, such as PE [3,10,11,12,13], polypropylene (PP) [14], polyethylene teraphthalate (PET) [5,15], polylactate (PLA) [13], etc. In packaging materials, the flavor adsorption amount of the rubber polymer (e.g., PE) is several thousand times higher than that of the glass polymer, such as PET [16]. The adsorbable flavor organic molecules of LDPE film have been extensively studied, including the alkenes, the esters, the aldehydes, the ketones, and the alcohols [3,10,11,12,13,17,18]. The flavor of liquid food is easier to be lost than that of solid food [19]. The concentration range of flavor organic molecules in liquid food is ppm or less, which is within the threshold range of human taste [20].
The molecular dynamics simulation method is a good tool to illustrate the microscopic phenomenon of the molecule mass transfer in the packaging materials [21]. More detailed information and basic principles of the interaction between molecules and polymers can be obtained [22,23,24,25]. Börjesson et al. performed Monte Carlo (MC) and MD simulation to calculate solubility coefficients and diffusion coefficients of oxygen and water in PE to obtain a microscopic diffusion mechanism [26]. Yue et al. used MD method to study the diffusion of benzene, toluene and ethyl benzene in amorphous PE membrane, and found the simulation results had the same trend as the experimental results [27]. Wang et al. determined the diffusion coefficients of molecules with different molecular weights in amorphous PET by MD simulation [28]. Tao et al. used Grand canonical Monte Carlo (GCMC) and MD simulation to study the adsorption and diffusion of O2 in PP and showed that the loading of O2 increased and its diffusion coefficient in PP decreased with the increase in the polymerization degree of PP [29]. However, the adsorption of food flavor molecules in LDPE film was mainly studied by experiment [3,4,5,7], and there were few studies on the adsorption and diffusion of flavor substances in LDPE by MD simulation. It is also meaningful to analyze the diffusion behavior of flavor organic molecules in PE and their effects on the diffusion of O2 and H2O in LDPE from the microscopic view.
In this work, the diffusion coefficients of food flavor organic molecules in LDPE film were studied by two-sided immersion experiment, Brandsch prediction model and MD simulation. The differences in diffusion coefficients obtained by the above three methods were compared. By calculating the interaction energies between the molecules and PE chain, the interaction energies between O2 or H2O molecule and flavor molecules, and the FFV of PE cell, the related diffusion mechanism of diffusion molecules in LDPE film was further analyzed. Furthermore, the diffusion coefficients of O2 and H2O in LDPE film before and after adsorption were calculated by the MD method, and the effects of flavor molecules on the diffusion of O2 and H2O were investigated.
2. Materials and Methods
2.1. Materials
LDPE film with a thickness of 47.76 μm, and a density of 0.923 g/cm3 was donated by Tianjin Baihao Co., Ltd. (Tianjin, China). The chemical reagents used and their corresponding purity, and CAS numbers were as follows: D-limonene (D-LE, 99%, 5989-27-5) from Adamas (Innochem, Beijing China); myrcene (ME, 99%, 123-35-3) from Aladdin (Shanghai Aladdin Biochem. Tech., Shanghai, China); ethyl hexanoate (EH, 99%, 123-66-0) from TCI (J&K Chemical, Beijing, China); 2-nonanone (2-NO, 99%, 821-55-6), and linalool (LO, 98%, 78-70-6) from Macklin (Tianjin Sanjiang, Tianjin, China); anhydrous ethanol (99%, 64-17-5) and n-hexane (99%, 110-54-3) from Jiangtian (Tianjin Jiangtian, Tianjin, China). D-limonene, myrcene, ethyl hexanoate, 2-nonanone, and linalool were selected as volatile flavor molecules in liquid foods, such as fruit juice and liquor [30,31], and 10% (V/V) aqueous ethanol solution was selected as the food simulation solution.
2.2. Film Adsorption Experiment
The contact process between liquid food and LDPE film was simulated by two-sided immersion method in the food simulation solution [10]. Five flavor reagents were mixed together into 10% (V/V) aqueous ethanol solution with a concentration of 500 mg/L for each flavor reagent to prepare a liquid simulator [32]. According to the contact ratio of actual food to material, a 5 cm × 3 cm film was placed into a 20 mL glass bottle with 20 mL of food simulator [33]. The bottle cap was filled with the polytetrafluoroethylene (PTFE) gasket. After the cap was sealed, the outer part was wound with a sealing film to ensure sealability. Storage temperature was set as 23 °C. After storage for a certain period of time, the film was taken out and repeatedly wiped with test paper until dry. The film was then cut into small pieces and placed in a 20 mL n-hexane sample bottle, and then sealed with the PTFE gasket and sealing film. Then the film was extracted in the ultrasonic water bath pot for 1 h. The ultrasonic wave frequency was 60 Hz, and the temperature was 23 °C. Sample bottles after extraction were stored at room temperature for 24 h. The amount of extraction sample was measured by Chromatography-Mass Spectrometer (GC-MS).
2.3. GC-MS Analysis Conditions
GCMS-QP2010 (Shimadzu, Kyoto, Japan) was used to measure the adsorption amount of flavor. The external standard method was used to analyze the measured flavor quantitatively. The GC-MS analysis conditions were as follows: The chromatographic column was DB-5 quartz capillary column (30 m × 0.25 mm × 0.25 µm), the detector was hydrogen flame ionization detector, and the injection volume was 1 µL. The inlet temperature was 250 °C, with a shunt ratio of 20:1, and the ion source temperature was 200 °C. The column temperature was programmed to an initial temperature of 40 °C, which was maintained for 3 min. Column was heated up to 150 °C at the rate of 4 °C/min, and then maintained at 150 °C for 1 min. Then it was heated up to 250 °C at a rate of 8 °C/min and maintained at 250 °C for 6 min.
2.4. Data Analysis
In order to better analyze the amount of flavor adsorbed by packaging film, the data measured by GC-MS need to be standardized. All the data were converted by Equation (1) to obtain the adsorption amount per unit mass of packaging film [3,10]:
where Mi,t is the adsorption amount of flavor i per unit mass of packaging film at time t, mg/g; Ci is the concentration (mL/mL) of flavor i in the extract solution (n-hexane) detected by GC-MS; VE is the volume of the extract solution (n-hexane), mL; ρi is the density (mg/mL) of flavor i and MP (g) is the quality of the adsorption packaging film.
3. Molecular Simulation Details
3.1. Modeling
The molecular models of five flavor organic molecules and PE were constructed with the Materials Visualizer module of Materials Studio 8.0 (MS 8.0). Generally, setting a higher polymerization degree for PE can simulate a more realistic diffusion of molecules in PE [27]. However, considering the computational complexity, a polymerization degree of 160 was selected to build the PE chain (PE 160). After the competition of modeling, the above models were geometrically optimized by using Forcite module with the “Smart Minimizer” method. The amorphous cells containing the molecules and PE chains were built to simulate the composition of the sample prepared in this study (as listed in Table 1). In order to analyze the diffusion of O2 and H2O in LDPE films, three O2 or ten H2O were placed into the cell structure of PE 160. The simulation cells with the initial density of 0.923 g/cm3 were constructed according to the actual density of LDPE film. Figure 1 shows an example of the simulation cells.

Table 1.
Composition of the amorphous cells constructed.
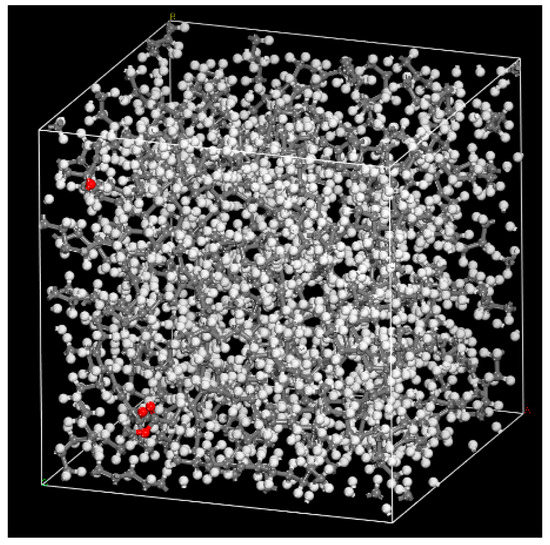
Figure 1.
Amorphous cell of polyethylene (PE) and five flavor organic molecules.
3.2. Simulations
The main procedures of simulation included geometry optimization, annealing and dynamic simulations, using the COMPASS II force field in all stages which is a newer version of the COMPASS force field and mainly used to simulate polymers, metals, metal oxides and small molecules [34]. The Coulomb force was evaluated by the Ewald summation method with an accuracy of 10−3 kcal/mol, and the van der Waals force was computed by the atom-based summation method with a spline cutoff distance of 12.5 Å. The geometric optimization procedure was used to minimize the energy of the cell. The isothermal-isobaric ensemble (NPT) was selected to perform in the molecular dynamics simulations. Compared with other ensembles, NPT simulation is the most relaxed ensemble in the system [35]. The pressure of annealing simulation was set as 0.1 MPa controlled by Berendsen method. The initial temperature was 300 K, and the mid-cycle temperature was 600 K. Three annealing cycles were performed, and the total number of steps was 3.6 × 10⁵. After the annealing, the internal stress of cell decreased, and the unreasonable structure during cell construction was eliminated [36]. Then, the NPT MD simulation was performed for 1000 ps to reach balance and the other constant volume and temperature ensemble (NVT) MD simulation of 100 ns was performed to ensure the convergence of the MD simulation for diffusion analysis. It was found that the diffusion coefficients calculated by allowing only the diffusing species to move, but keeping fixed the rest of the system can be affected by significant errors [37,38]. Therefore, during all the simulations in this study, all the atoms, including the atoms of five flavor molecules, O2, H2O, and LDPE, were allowed to move (see Figure 2).
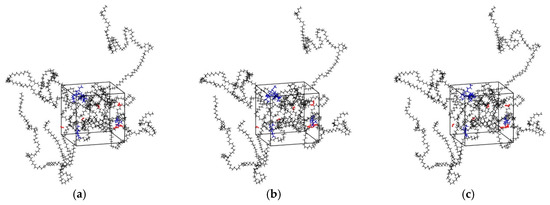
Figure 2.
Snapshots of the simulation boxes at different simulation time (black: PE; red: H2O molecules; blue: Flavor molecules). (a) t = 0; (b) t = 50 ns; (c) t = 100 ns.
4. Results and discussions
4.1. Interaction Energy between Diffusion Molecules and PE Chain
The interaction energy (Eint), indicating the intensity of interaction between the diffusion molecule and polymer, is derived according to the following equation:
where Etotal is the total energy of the system, EPE is the energy of PE chain, Ediff,i is the energy of diffusion molecule i in the PE chain. A negative Eint value is corresponding to stable interaction between the components [39,40]. More negative Eint indicates a stronger interaction in the system.
In this study, there was only physical bonding between diffusion molecules and polymer chains, and no chemical reaction and new chemical bonds involved. The non-bonding interactions between diffusion molecules and polymer chains, and the interatomic potential for the interactions among LDPE atoms and diffusion molecules were considered. The interaction energies of D-limonene, myrcene, ethyl hexanoate, 2-nonanone, linalool, O2 and H2O with PE chain were calculated by MD simulation and were listed in Table 2. The stronger the interaction between diffusion molecules and polymer chains will result in the higher the energy barrier to be overcome and the smaller the corresponding diffusion coefficient. Therefore, if only take the effect of interaction energy on the diffusion into account, the diffusion coefficients of the diffusion molecules in PE should decrease in the following order: DH2O > DO2 > DD-LE > D2-NO > DME > DEH > DLO. However, besides the interaction energy, molecular size and free volume of polymer cell are also important factors affecting the diffusion of molecules, which will be further discussed in a later section.
Table 2.
Interaction energies between flavor, H2O, O2 molecules, and PE chain.
4.2. Diffusion Coefficient (D)
4.2.1. Calculation of D by Prediction Model
Diffusion coefficient is the most important analytical parameter in adsorption of flavor organic molecules by polymers. The classical prediction model of diffusion coefficient, Brandsch model (Equation (3)), was widely used to predict the D of molecules in polymers [41].
Brandsch model introduced two simplification factors, AP and τ, to describe the properties of polymer. Brandsch model was recognized as a general formula for characterizing the diffusion coefficient of molecule in plastic packaging film [42]:
where D is the diffusion coefficient of the diffusion molecule in polymer (cm2/s), Mr is the relative molecular weight of the diffusion molecule, AP is the characteristic parameter of polymer, and T is the absolute temperature (K). For different polymer matrix, the value of AP is different, which is mainly derived from a large number of experimental results. AP is usually a function of temperature, and it can be calculated from the below equation:
where AP* is the adiabatic term of polymer, and τ is the deviation of diffusion activation energy from reference activation energy in polymer. For LDPE films, AP* equals 11.5, and τ equals 0 [43].
The diffusion coefficients (Dpre) of D-limonene, myrcene, ethyl hexanoate, 2-nonanone and linalool in LDPE were calculated by Equations (3) and (4), as shown in Table 3.
Table 3.
Diffusion coefficients (Dpre) calculated by Brandsch model.
4.2.2. Experimental Determination of D
The adsorption of five flavor organic molecules in LDPE film at 23 °C was studied by film immersion experiment. As shown in Figure 3, for all five flavor organic molecules, adsorption equilibrium can be reached within 10 days. After reaching the adsorption equilibrium, the total amount of D-limonene adsorbed is the largest, i.e., 18.4212 mg/g, followed by myrcene, which is 7.5019 mg/g. For linalool, it has the lowest adsorption amount (3.2382 mg/g) among five flavor organic molecules. The adsorption equilibrium amounts of the organic molecules by LDPE films follow the order: D-limonene > myrcene > 2-nonanone > ethyl hexanoate > linalool. Although molecular weights of D-limonene and myrcene are the same, the adsorption amounts of the two molecules are quite different.
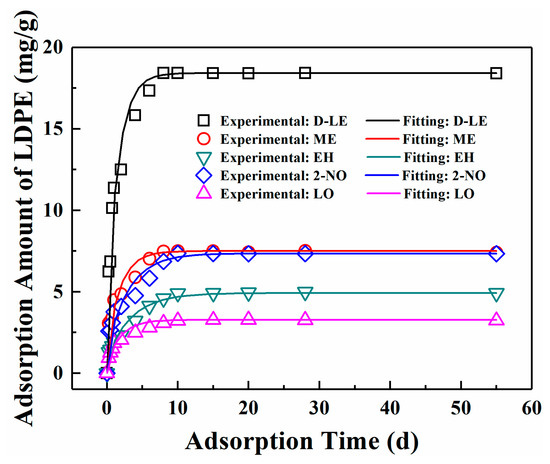
Figure 3.
Comparison of experimental data and fitting values.
When the adsorption amount of the flavor organic molecule was known, the Fick’s second law diffusion model can be used to calculate the diffusion coefficient [44,45]:
where Mi,t is the adsorption amount of flavor i adsorbed by films at t (s) time, mg/g; Mi,e is the adsorption amount of flavor i at equilibrium time, mg/g; and LP is the thickness of films, cm. The experimental diffusion coefficient, D can be derived by fitting the Equation (5) with least square method.
The diffusion coefficients of five flavor organic molecules in LDPE were fitted with the experimental data by using MATLAB Software and listed in Table 4. The comparison between the fitted curve and the experimental scatter points is shown in Figure 3. Table 4 and Figure 3 show that the diffusion of five flavor organic molecules in LDPE well conforms to Fick’s second law.
Table 4.
Diffusion coefficients (Dexp) fitted by experimental data.
4.2.3. Molecular Simulation Results
The diffusion coefficient in MD simulation was calculated by analyzing the mean square displacement (MSD) curve. Four methods can be used to analyze the MSD curve, i.e., Einstein method, Green-Kubo method, differential-zone variational method, and cluster analysis method [46].
Einstein method is a classical method, which correlates diffusion coefficient D with MSD of molecules [42]. The formula is as follows:
where N is the number of diffusion molecule i in the system, t is the diffusion time, and ri(0) and ri(t) are the diffusion position vector of diffusion molecule i at the time of 0 and t, respectively.
Figure 4 shows the MSD curves of five flavor organic molecules in PE derived from MD simulation. All MSD curves contain the linear part, unstable vibration part and the noisy part after a long simulation time. The non-linear and noisy parts usually encountered at the end of the curves may be attributed to the statistical error after longer simulation times. Reynier proposed that there were three diffusion modes of molecules in polymers: Crawling diffusion mode, jumping diffusion mode, and dual mode diffusion [47,48]. The flavor molecules (D-limonene, myrcene, ethyl hexanoate, 2-nonanone and linalool) contain both rigid and flexible groups; therefore, their diffusion may follow the dual mode diffusion (both the jumping and crawling and diffuse modes involved). Figure 4 shows that flavor organic molecules, because of their large size, cannot jump easily and diffuse in polymers like small gas molecules, and the linear part and unstable vibration part of their MSD curves show dual mode diffusion. In order to analyze molecular diffusion behavior more clearly, the MSD curves of five organic molecules are calculated by Log10 and fitted by segments (as shown in Figure 5). In Figure 5, m is the slope of the fitting straight line, which is anomalous (non-Einstein) behavior when m < 1, and Einstein behavior when m is close to 1 [49]. As can be seen from the figure, at the back end of the simulation time, five organic molecules transform from anomalous diffusion to Einstein diffusion. During this time, the diffusion coefficient can be calculated by Einstein Equation (6). The diffusion coefficients of five flavor molecules (D-limonene, myrcene, ethyl hexanoate, 2-nonanone and linalool) in PE are 9.31 × 10⁻¹¹ cm2/s, 7.90 × 10⁻¹¹ cm2/s, 6.90 × 10⁻¹¹ cm2/s, 1.56 × 10⁻¹⁰ cm2/s, 1.72 × 10⁻¹⁰ cm2/s, respectively.
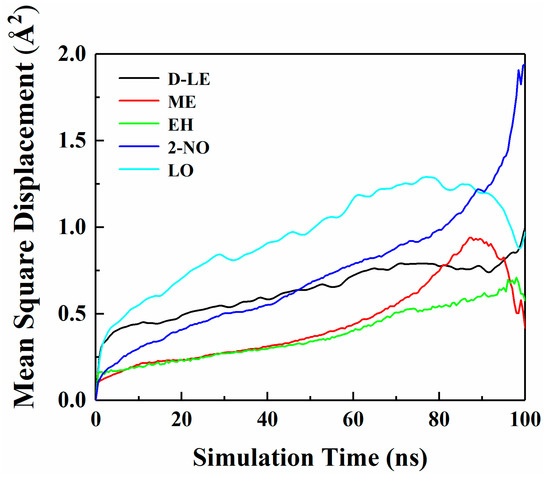
Figure 4.
Mean square displacement (MSD) curves of five flavor organic molecules in PE.
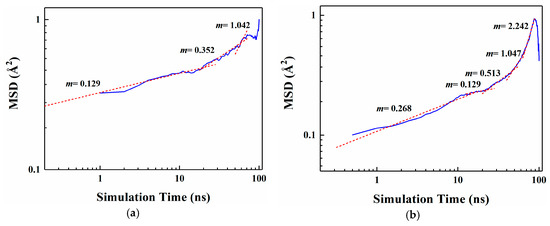
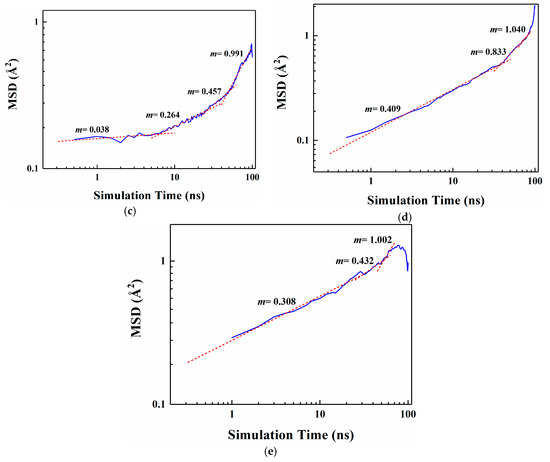
Figure 5.
Segmental linear fitting diagrams of Log10 curves for five organic molecules MSD. (a) D-limonene; (b) Myrcene; (c) Ethyl hexanoate; (d) 2-nonanone; (e) Linalool.
4.2.4. Comparison among Experiment, Prediction Model and MD Simulation Results
The differences among prediction model diffusion coefficient (Dpre), experimental diffusion coefficient (Dexp) and simulated diffusion coefficient (Dsim) were compared as listed in Table 5. The Dpre is higher than that obtained by experiments and MD simulation, which is similar to the results reported by Wang et al. [50] who investigated the diffusion of small molecules in PET. This is because Brandsch prediction model is based on the assumptions given under deteriorating conditions, and it only considers the properties of polymer substrates, the molecular weight of flavor molecules and the temperature, but does not take the interaction between molecules into account.
Table 5.
Comparison between experimental, prediction model and MD simulation results.
The diffusion coefficients obtained by MD simulation are close to those of experimental results, but are slightly larger than those values. This difference may be due to: (1) the setting of finite chain length for PE means that many relaxed free ends make the redistribution of free volume fraction easier and lead to the increase of diffusion coefficient. The simulation results reported by Wang et al. [50] showed a good agreement with that obtained from experiments, this may be due to the PET models built in their study had a polymerization degree of 100, which is close to that of actual PET. Typically, the actual LDPE has a polymerization degree of >1000. Building an LDPE model with such a high polymerization degree will lead to a very large model and an unbearable expense of calculation time in the subsequent MD simulation. (2) The amorphous PE cell was constructed for MD simulation, but the actual PE is an incomplete amorphous polymer which contains a certain crystalline phase. The crystallization zone will hinder the diffusion of flavor organic molecules. (3) MD simulation only considers the diffusion of flavor organic molecules in PE materials, and does not consider the distribution of flavor organic molecules from food simulation solution to PE material, which will lead to the deviation between MD simulation and experimental values. However, it can be concluded that the simulation results are close to the experimental ones by taking the errors of these numbers (listed in Table 5) into account. In addition, the experimental process was more complex than the predictive model and MD simulation. Because the immersion of food simulation solution, i.e., ethanol and water, may be easier to first diffuse into the material than flavor molecules, thus, maybe hinder the diffusion of flavor molecules.
4.3. Fraction of Free Volume
The size and shape of a free volume play an important role in the diffusion behavior of diffusion molecules in polymers. Generally, the larger the free volume fraction of polymers results in the larger the diffusion coefficient. When calculating the free volume of the system, the hard sphere probe model in MS 8.0 was used to analyze the kinetic radius of the diffusion molecule. The free volume and occupied volume of the cell can be obtained when the molecular probe with a certain radius RP moves on the van der Waals surface. The ratio of free volume to simulated cell volume is defined as FFV [51]:
where, VF is the free volume of the polymer, VO is the occupied volume of the polymer, and VS is the total volume of the polymer.
The probe radii of 1.0 Å, 1.5 Å, 2.0 Å, 2.7 Å were selected to calculate the free volume of PE cells. Free volume morphologies with the different probe radius in PE cell are shown in Figure 6.
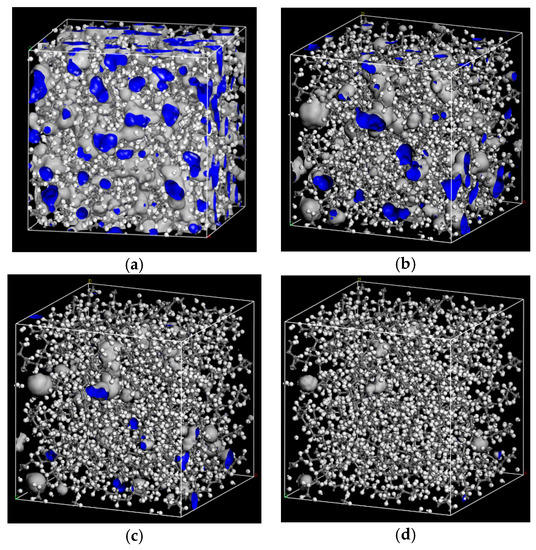
Figure 6.
Free volume morphologies of the different probe radius in PE cell. (a) RP = 1 Å; (b) RP =1.5 Å; (c) RP =2 Å; (d) RP =2.7 Å.
Table 6 shows that with the increase of RP, the FFV of PE cell decreases. The free volume measured by 2.7 Å can meet the space requirement of jump diffusion for O2 and H2O. It also means that for larger flavor organic molecules, there are fewer free holes to jump. The polymer chains can wriggle themselves, and when their wriggling creates enough jumping space, flavor organic molecules will jump from one hole to other holes.
Table 6.
FFV of PE cell with the different probe radius.
4.4. Diffusion of O2 and H2O in PE before and after Adsorption
The diffusion of O2 and H2O in PE before and after adsorption of flavor molecules were simulated by the MD method, and the related MSD curves were shown in Figure 7 and Figure 8. In the long-term MD simulation, the diffusion of molecules in random motion is affected by the steric hindrance of PE chain, resulting in a decrease of diffusion coefficient. Compared with Figure 4, O2 or H2O compete with the flavor molecules for free holes in PE, which restricts the diffusion of O2, H2O and flavor molecules. After adsorption of flavor molecules, O2 and H2O diffuse faster than all flavors, and their MSD curves increase more rapidly. The reason is that O2 and H2O are smaller than flavor molecules and need less diffusion space. Moreover, the effect of flavor molecules on O2 is small; therefore, O2 diffusion is faster than H2O.
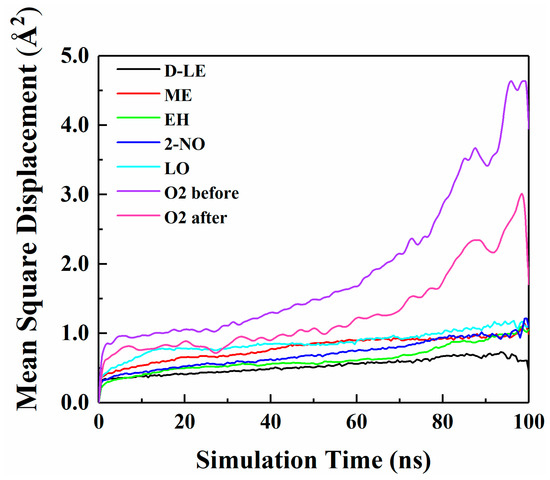
Figure 7.
MSD curves of O2 and five flavor organic molecules in PE.
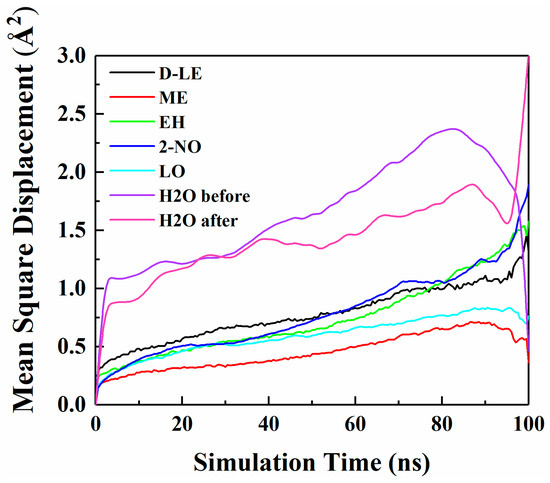
Figure 8.
MSD curves of H2O and five flavor organic molecules in PE.
The diffusion coefficients of O2 and H2O before and after PE adsorption are listed in Table 7. Table 7 indicates that the diffusion of O2 before and after PE adsorption is stronger than that of H2O. This is inconsistent with the results of interaction energy analysis (Section 4.1). Because the difference between the interaction energies of O2 and H2O is relatively small, thus, effects of the interaction energies on the diffusion of both two molecules are not decisive. However, the size of O2 molecule is smaller than that of H2O molecule; therefore, O2 molecule is easier to diffuse in PE. The diffusion coefficients of O2 and H2O in adsorbed PE are all smaller than those in pure PE. In order to better understand the influence of flavor organic molecules on the diffusion of O2 and H2O in PE, the FFV of PE and the interaction energies of O2 or H2O with flavor organic molecules were further analyzed.
Table 7.
Diffusion coefficients of O2 and H2O before and after adsorption of PE by flavor.
The FFV of PE cells, before and after flavor adsorption, was calculated with a probe radius of 1.0 Å and listed in Table 8. The interaction energies of D-limonene, myrcene, ethyl hexanoate, 2-nonanone and linalool with O2 or H2O were calculated by MD simulation and were listed in Table 9.
Table 8.
FFV of PE cell before and after adsorption.
Table 9.
Interaction energies between O2 or H2O and flavor molecules.
Table 8 shows that the FFV of PE cell decreased with the loading of O2, while increased with the loading of H2O. This is because the alkane chain has strong hydrophobicity, and the free volume becomes larger after loading H2O. When flavor molecules were diffused in PE, the FFV of PE cell decreased, which led to the decrease in the diffusion coefficients of O2 and H2O.
In addition to the FFV, the interaction between O2 or H2O molecule and flavor organic molecules also affects the diffusion coefficients of O2 or H2O. Table 9 shows the interaction energies between O2 or H2O molecule and five flavor organic molecules. All the interaction energies were negative, which indicates the presence of the flavor organic molecules will hinder the diffusion of O2 and H2O molecules, and thus, lead to the decrease in the diffusion coefficients (Table 8). Besides, the interaction energies between H2O and five flavor organic molecules were stronger than those between O2 and five flavor organic molecules, especially for ethyl hexanoate, 2-nonanone and linalool. The equilibrium adsorption configurations of H2O molecule with five flavor organic molecules were shown in Figure 9. The H atom in H2O molecule is positively charged and expected to absorb near to the negatively charged C atoms in D-limonene and myrcene (Figure 9a,b). O atom of higher electronegativity is contained in the ethyl hexanoate, 2-nonanone and linalool molecules, which can form the hydrogen bond with the H atom in H2O (Figure 9c–e). Therefore, the interaction between H2O and ethyl hexanoate, 2-nonanone and linalool molecules are stronger than those of D-limonene and myrcene. Therefore, in a word, the presence of the flavor organic molecules results in greater hindrance to the diffusion of H2O compared with the case of O2, which can further explain the greater decrease in the diffusion coefficient of H2O in the presence of flavor organic molecules (Table 7).
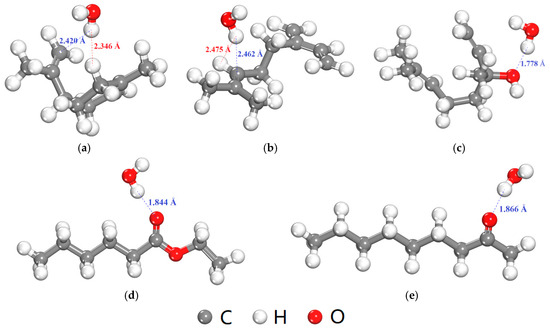
Figure 9.
Equilibrium adsorption configurations of H2O molecule with five flavor organic molecules (the blue and red dash lines show attraction and repulsion interaction, respectively, determined by a distance criterion of 2.5 Å). (a) D-limonene; (b) Myrcene; (c) Linalool; (d) Ethyl hexanoate; (e) 2-nonanone.
5. Conclusions
The diffusion of D-limonene, myrcene, ethyl hexanoate, 2-nonanone and linalool in LDPE were investigated by two-sided immersion experiment, Brandsch prediction model and MD simulation. The diffusion of O2 and H2O in PE before and after the adsorption of the flavor substances were also studied. The following conclusions were drawn: (1) the immersion experiment showed the diffusion of five flavor molecules in LDPE well followed Fick’s second law; (2) MD simulation indicated the dual mode diffusion mechanism of the flavor molecules in LDPE; (3) the diffusion coefficients from MD simulation are close to those from the experimental determination, but are slightly larger than those values; (4) the presence of the flavor organic molecules hindered the diffusion of O2 and H2O, which can be well explained from FFV and interaction energy calculation results derived from MD simulation.
Author Contributions
Conceptualization, L.L.; Data curation, B.S.; Formal analysis, B.S.; Funding acquisition, L.L.; Methodology, B.S.; Project administration, B.S.; Software, Y.Z.; Supervision, L.L.; Writing—original draft, B.S.; Writing—review and editing, L.L.
Funding
This research was funded by the National Natural Science Foundation of China, grant number 31101376, the National Key Research and Development Program of China, grant number 2018YFC1603200 and Tianjin Natural Science Foundation Project, grant number 18JCTPJC57400.
Conflicts of Interest
The authors declare no conflict of interest.
References
- Fu, Y.C.; Lim, L.T. Investigation of multiple-component diffusion through LLDPE film using an FTIR-ATR technique. Polym. Test. 2012, 31, 56–67. [Google Scholar] [CrossRef]
- Júnior, L.M.; Cristianini, M.; Padula, M.; Anjos, C.A.R. Effect of high-pressure processing on characteristics of flexible packaging for foods and beverages. Food Res. Int. 2019, 119, 920–930. [Google Scholar] [CrossRef] [PubMed]
- Lu, L.X.; Sun, Y.C.; Tang, Y.L.; Liu, Z.G.; Wang, J. Effects of flavor compounds concentrations and external temperatures on absorption by LDPE. J. Food Sci. Biotechnol. 2016, 35, 635–639. [Google Scholar]
- Brody, A.L. Flavor scalping: Quality loss due to packaging. Food Technol. 2002, 56, 124–125. [Google Scholar]
- Ros-Chumillas, M.; Belissario, Y.; Iguaz, A.; López, A. Quality and shelf life of orange juice aseptically packaged in PET bottles. J. Food Eng. 2007, 79, 234–242. [Google Scholar] [CrossRef]
- Lozano, P.R.; Drake, M.; Bentez, D.; Cadwallader, K.R. Instrumental and sensory characterization of heat-induced odorants in aseptically packaged soy milk. J. Agric. Food Chem. 2007, 55, 3018–3026. [Google Scholar] [CrossRef] [PubMed]
- Farhoodi, M.; EmamDjomeh, Z.; Falah, A. Effect of menthol absorption by packaging material on the quality of yogurt drink during storage time. J. Agric. Sci. Technol. 2013, 15, 1373–1380. [Google Scholar]
- Lloyd, M.A.; Hess, S.J.; Drake, M.A. Effect of nitrogen flushing and storage temperature on flavor and shelf-life of whole milk powder. J. Dairy Sci. 2009, 92, 2409–2422. [Google Scholar] [CrossRef]
- Caner, C. Sorption phenomena in packaged foods: Factors affecting sorption processes in package-product systems. Packag. Technol. Sci. 2011, 24, 259–270. [Google Scholar] [CrossRef]
- Sun, Y.C.; Lu, L.X. Effect of flavor compound kinds on absorption behavior of LDPE film. Packag. Eng. 2013, 34, 34–37. [Google Scholar]
- Dias, M.V.; Medeiros, H.S.; Soares, N.F.F.; Melo, N.R.; Borges, S.V.; Carneiro, J.D.S.; de Assis Kluge Pereira, J.M.T. Development of low-density polyethylene films with lemon aroma. Food Sci. Technol. 2013, 50, 167–171. [Google Scholar] [CrossRef]
- Petrus, R.R.; Walter, E.H.M.; Faria, J.A.F.; Abreu, L.F. Sensory stability of ultra-high temperature milk in polyethylene bottle. J. Food Sci. 2009, 74, 53–57. [Google Scholar] [CrossRef] [PubMed]
- Mauricio-Iglesias, M.; Peyron, S.; Chalier, P.; Gontard, N. Scalping of four aroma compounds by one common (LDPE) and one biosourced (PLA) packaging materials during high pressure treatments. J. Food Eng. 2011, 102, 9–15. [Google Scholar] [CrossRef]
- Johansson, F.; Leufvén, A. Concentration and interactive effects on the sorption of aroma liquids and vapors into polypropylene. J. Food Sci. 1997, 62, 355–358. [Google Scholar] [CrossRef]
- Bacigalupi, C.; Lemaistre, M.H.; Boutroy, N.; Bunel, C.; Peyron, S.; Guillard, V.; Chalier, P. Changes in nutritional and sensory properties of orange juice packed in PET bottles: An experimental and modelling approach. Food Chem. 2013, 141, 3827–3836. [Google Scholar] [CrossRef]
- Peychès-Bach, A.; Moutounet, M.; Peyron, S.; Chalier, P. Factors determining the transport coefficients of aroma compounds through polyethylene films. J. Food Eng. 2009, 95, 45–53. [Google Scholar] [CrossRef]
- Cava, D.; Catala, R.; Gavara, R.; Lagaron, J.M. Testing limonene diffusion through food contact polyethylene by FT-IR spectroscopy: Film thickness, permeant concentration and outer medium effects. Polym. Test. 2005, 24, 483–489. [Google Scholar] [CrossRef]
- Suppakul, P.; Sonneveld, K.; Bigger, S.W.; Miltz, J. Diffusion of linalool and methylchavicol from polyethylene-based antimicrobial packaging films. Food Sci. Tech. 2011, 44, 1888–1893. [Google Scholar] [CrossRef]
- Limam, M.; Tighzert, L.; Fricoteaux, F.; Bureau, G. Sorption of organic solvents by packaging materials: Polyethylene terephthalate and TOPAS. Polym. Test. 2005, 24, 395–402. [Google Scholar] [CrossRef]
- Dury-Brun, C.; Fournier, N.; Pernin, K.; Guichard, E.; Voilley, A. A new approach to studying sponge cake aroma after storage in treated paper and plastic packaging by direct gas chromatography- olfactometry (D-GC-O). Flavour Fragr. J. 2007, 22, 255–264. [Google Scholar] [CrossRef]
- Xu, Y.; Liu, Y.L.; He, D.D.; Liu, G.S. Adsorption of cationic collectors and water on muscovite (001) surface: A molecular dynamics simulation study. Miner. Eng. 2013, 53, 101–107. [Google Scholar] [CrossRef]
- Feenstraa, P.; Brunsteiner, M.; Khinast, J. Prediction of drug-packaging interactions via molecular dynamics (MD) simulations. Int. J. Pharm. 2012, 431, 26–32. [Google Scholar] [CrossRef] [PubMed]
- Moyassari, A.; Gkourmpis, T.; Hedenqvist, M.S.; Gedde, U.W. Molecular dynamics simulation of linear polyethylene blends: Effect of molar mass bimodality on topological characteristics and mechanical behavior. Polymer 2019, 161, 139–150. [Google Scholar] [CrossRef]
- Paajanen, A.; Vaari, J.; Verho, T. Crystallization of cross-linked polyethylene by molecular dynamics simulation. Polymer 2019, 171, 80–86. [Google Scholar] [CrossRef]
- Gee, R.H.; Boyd, R.H. The role of the torsional potential in relaxation dynamics: A molecular dynamics study of polyethylene. Comput. Theor. Polym. Sci. 1998, 8, 93–98. [Google Scholar] [CrossRef]
- Börjessona, A.; Erdtman, E.; Ahlström, P.; Berlin, M.; Andersson, T.; Bolton, K. Molecular modelling of oxygen and water permeation in polyethylene. Polymer 2013, 54, 2988–2998. [Google Scholar] [CrossRef]
- Yue, Y.J.; Liu, Q.Z.; Wu, L.Y.; Hu, Y.D. Molecular dynamics simulation for diffusion of organic molecules in polyethylene membranes. CIESC J. 2012, 63, 109–113. [Google Scholar]
- Wang, P.L.; Wang, Z.W.; Hu, C.Y.; Chen, M. Molecular dynamics simulation of diffusion coefficients of small molecules in amorphous PET. CIESC J. 2009, 60, 1920–1925. [Google Scholar]
- Tao, C.G.; Feng, H.J.; Zhou, J.; Lü, L.H.; Lu, X.H. Molecular simulation of oxygen adsorption and diffusion in polypropylene. Acta Phys.-Chim. Sin. 2009, 25, 1373–1378. [Google Scholar]
- Cíhal, P.; Vopička, O.; Pilnáček, K.; Poustka, J.; Friess, K.; Hajšlová, J.; Dobiáš, J.; Dole, P. Aroma scalping characteristics of polybutylene succinate based films. Polym. Test. 2015, 46, 108–115. [Google Scholar] [CrossRef]
- Hambleton, A.; Voilley, A.; Debeaufort, F. Transport parameters for aroma compounds through i-carrageenan and sodium alginate-based edible films. Food Hydrocoll. 2011, 25, 1128–1133. [Google Scholar] [CrossRef]
- Follain, N.; Valleton, J.M.; Lebrun, L.; Alexandre, B.; Schaetzel, P.; Metayer, M.; Marais, S. Simulation of kinetic curves in mass transfer phenomena for a concentration-dependent diffusion coefficient in polymer membranes. J. Membr. Sci. 2010, 349, 195–207. [Google Scholar] [CrossRef]
- Ibarra, V.G.; Quirós, A.R.B.; Losada, P.P.; Sendón, R. Non-target analysis of intentionally and non intentionally added substances from plastic packaging materials and their migration into food simulants. Food Packag. Shelf. 2019, 21, 100325. [Google Scholar] [CrossRef]
- Guo, X.; Liu, Y.; Wang, J.L. Sorption of sulfamethazine onto different types of microplastics: A combined experimental and molecular dynamics simulation study. Mar. Pollut. Bull. 2019, 145, 547–554. [Google Scholar] [CrossRef] [PubMed]
- Harami, H.R.; Fini, F.R.; Rezakazemi, M.; Shirazian, S. Sorption in mixed matrix membranes: Experimental and molecular dynamic simulation and Grand Canonical Monte Carlo method. J. Mol. Liq. 2019, 282, 566–576. [Google Scholar] [CrossRef]
- Saha, S.; Bhowmick, A.K. An Insight into molecular structure and properties of flexible amorphous polymers: A molecular dynamics simulation approach. J. Appl. Polym. Sci. 2019, 136, 47457. [Google Scholar] [CrossRef]
- Demontis, P.; Fois, E.; Suffritti, G.B.; Quartieri, S. Molecular dynamics studies on zeolites. 4. Diffusion of methane in silicalite. J. Phys. Chem. 1990, 94, 4329–4334. [Google Scholar] [CrossRef]
- Demontis, P.; Suffritti, G.B.; Fois, E.; Quartieri, S. Molecular dynamics studies on zeolites. 6. Temperature dependence of diffusion of methane in silicaiite. J. Phys. Chem. 1992, 96, 1482–1490. [Google Scholar] [CrossRef]
- Han, L.; Liu, K.Z.; Wang, M.H.; Fang, L.M.; Chen, H.T.; Zhou, J.; Lu, X. Mussel-inspired adhesive and conductive hydrogel with Long-lasting moisture and extreme temperature tolerance. Adv. Funct. Mater. 2018, 28, 1704195. [Google Scholar] [CrossRef]
- Meng, J.Q.; Yin, F.F.; Li, S.C.; Zhong, R.Q.; Sheng, Z.Y.; Nie, B.S. Effect of different concentrations of surfactant on the wettability of coal by molecular dynamics simulation. Int. J. Min. Sci. Technol. 2019, 29, 577–584. [Google Scholar] [CrossRef]
- Sun, B.Q.; Wang, Z.W. Analysis of diffusion coefficient for migration model in food packaging material. Packag. Eng. 2006, 27, 34–36. [Google Scholar]
- Brandsch, J.; Mercea, P.; Rüter, M.; Tosa, V.; Piringer, O. Migration modelling as a tool for quality assurance of food packaging. Food Addit. Contam. A 2002, 19, 29–41. [Google Scholar] [CrossRef] [PubMed]
- Piringer, O.G.; Baner, A.L. Food Plastic Packaging Material: Barrier Function, Mass Transfer, Quality Assurance and Legislation; Chemical Industry Press: Beijing, China, 2004; pp. 396–397. [Google Scholar]
- Fertikh, N.; Toubal, A.; Larbi, L.; Messadi, D.; Duprat, F. Sorption and diffusion of flavours contained in rose-water in plastic packaging. IJETS 2013, 1, 149–162. [Google Scholar]
- Laoubi, S.; Vergnaud, J.M. Food sandwich packaging with a recycled polymer between two functional barriers of different thicknesses. Polym. Test. 1996, 15, 269–279. [Google Scholar] [CrossRef]
- Wang, Z.H.; Xin, Y. Molecular dynamics simulation on the relationship of oxygen diffusion and polymer chains activity. Mater. Rep. 2019, 33, 1293–1297. [Google Scholar]
- Reynier, A.; Dole, P.; Humbel, S.; Feigenbaum, A. Diffusion coefficients of additives in polymers. I. Correlation with geometric parameters. J. Appl. Polym. Sci. 2001, 82, 2422–2433. [Google Scholar] [CrossRef]
- Reynier, A.; Dole, P.; Feigenbaum, A. Additive diffusion coefficients in polyolefins. II. Effect of swelling and temperature on the D = f(M) correlation. J. Appl. Polym. Sci. 2001, 82, 2434–2443. [Google Scholar] [CrossRef]
- Müller-Plathe, F.; Rogers, S.C.; Gunsteren, W.F. Computational evidence for anomalous diffusion of small molecules in amorphous polymers. Chem. Phys. Lett. 1992, 199, 237–243. [Google Scholar] [CrossRef]
- Wang, Z.W.; Wang, P.L.; Hu, C.Y. Molecular dynamics simulation on diffusion of 13 kinds of small molecules in polyethylene terephthalate. Packag. Technol. Sci. 2010, 23, 457–469. [Google Scholar] [CrossRef]
- Mei, L.Y.; Liao, L.Q.; Fu, Y.Z.; Zhang, M.Y.; Liu, Y.Q. Molecular dynamics simulations of diffusion coefficients of small molecules in PET/PLA blends. Polym. Mater. Sci. Eng. 2012, 28, 179–182 + 186. [Google Scholar]


© 2019 by the authors. Licensee MDPI, Basel, Switzerland. This article is an open access article distributed under the terms and conditions of the Creative Commons Attribution (CC BY) license (http://creativecommons.org/licenses/by/4.0/).