Article

Amorphous Tin Oxide Applied to Solution Processed Thin-Film Transistors

Advanced Display Research Center and Department of Information Display, Kyung Hee University, Seoul 130-701, Korea
*
Author to whom correspondence should be addressed.
Materials 2019, 12(20), 3341; https://doi.org/10.3390/ma12203341
Submission received: 2 September 2019 / Revised: 1 October 2019 / Accepted: 7 October 2019 / Published: 14 October 2019

Abstract

:
The limited choice of materials for large area electronics limits the expansion of applications. Polycrystalline silicon (poly-Si) and indium gallium zinc oxide (IGZO) lead to thin-film transistors (TFTs) with high field-effect mobilities (>10 cm2/Vs) and high current ON/OFF ratios (IOn/IOff > ~107). But they both require vacuum processing that needs high investments and maintenance costs. Also, IGZO is prone to the scarcity and price of Ga and In. Other oxide semiconductors require the use of at least two cations (commonly chosen among Ga, Sn, Zn, and In) in order to obtain the amorphous phase. To solve these problems, we demonstrated an amorphous oxide material made using one earth-abundant metal: amorphous tin oxide (a-SnOx). Through XPS, AFM, optical analysis, and Hall effect, we determined that a-SnOx is a transparent n-type oxide semiconductor, where the SnO2 phase is predominant over the SnO phase. Used as the active material in TFTs having a bottom-gate, top-contact structure, a high field-effect mobility of ~100 cm2/Vs and an IOn/IOff ratio of ~108 were achieved. The stability under 1 h of negative positive gate bias stress revealed a Vth shift smaller than 1 V.

1. Introduction

Amorphous oxide semiconductors (AOS) with high mobility ~10 cm2/Vs and high transparency (>80% in the visible region) [1] are under extensive research and are considered for wide application in electronics, such as displays [2]. In addition, AOS-based thin-film transistors (TFTs) provide new manufacturing possibilities for applications, such as flexible devices [3].
Amorphous oxide semiconductors use multiple post-transition metal cations, usually chosen among indium, zinc, tin, and gallium. Being fabricated by vacuum process or solution process, indium gallium zinc oxide (IGZO), zinc tin oxide (ZTO), indium zinc tin oxide (IZTO), and indium zinc oxide (IZO) have been investigated and have shown the potential for careful selection of cations and processes for high-performance AOS TFTs [4,5,6]. High-k dielectrics (Al2O3, HfO2, ZrO2, Y2O3, etc.) have also improved the performances of oxide TFTs [7,8,9,10,11].
On the other hand, single cation metal oxide materials (ZnO, In2O3, SnO2) demonstrate a polycrystalline phase. For example, In2O3 leads to high-performance TFTs but doping is usually required to obtain high-performance and stable TFTs [5,12]. The amorphous phase is preferred for its higher uniformity over large areas for electronics applications.
Tin oxide, SnO2, was the first transparent conducting oxide (TCO) material used as a channel region in a TFT [13]. Since then, because SnO2 is an n-type semiconductor and SnO a p-type semiconductor, extensive research has been conducted for large area electronics [14,15] and its potential use in complementary metal oxide semiconductors (CMOS). Nevertheless, one of the major issues has been the small Ion/Ioff ratio due to the high conductivity of polycrystalline SnO2 [14,16].
Recently, solution processed polycrystalline SnO2 TFTs have regained interest because of their high field-effect mobility of 40, and even 90 cm2/V has been achieved, but the devices lacked either high Ion/Ioff ratios or low leakage currents [17,18]. Although the amorphous phase of tin oxide made via solution process was reported, it was not applied as the active material in TFTs [17]. Vacuum processed amorphous tin oxide used in TFTs has been reported, but the field-effect mobility was lower than 1 cm2/Vs [19]. On the other hand, vacuum processed polycrystalline SnO2 was used in TFTs leading to mobilities of 147 cm2/Vs [20].
In this work, we developed amorphous tin oxide (a-SnOx) using a solution process and investigated the optical (i.e., transmittance, optical bandgap), physical (i.e., surface roughness, crystallinity), chemical, and electronic (i.e., composition, phases, nature of bonds) properties. The material was then used as the active material in TFTs, which had HfO2 as the dielectric. The TFTs showed exceptional high mobility (~100 cm2/Vs) and high Ion/Ioff ratios (~108), and low leakage currents. Justified by the TFTs’ remarkable high performances, various stresses such as positive bias stress (PBS) and negative bias stress (NBS) were applied to evaluate the practical use of the TFTs in large area applications. This work is innovative in that it demonstrates the development and usage of an amorphous oxide material having only one metal, and shows stable TFTs competing with vacuum processed counterparts for large area electronics.

2. Materials and Methods

2.1. Precursor Solutions

The SnOx and HfO2 precursor solutions were made by mixing SnCl2 (99.99%, metals basis) or HfCl4 (99.9% metals basis) into acetonitrile/ethylene glycol (35 vol.%/65 vol.%) in an N2 environment. The solutions were stirred for at least 2 h before use. All precursors and solvents were purchased from Sigma–Aldrich (Yongin-Si, Gyeonggi-do, Korea). The precursor solution concentration of HfO2 was 0.2 M. The concentration of the SnOx precursor solution was 0.167 M, if not otherwise mentioned.

2.2. Thin-Film Transistor Fabrication and Characterization

Molybdenum was deposited by sputtering and patterned as the gate on a glass substrate. The HfO2 was fabricated by spin-coating the HfO2 precursor solution. The solution was first spin-coated at 2000 rpm during 25 s. Then, curing was performed during 3 min at 250 °C on a hotplate followed by UV treatment (320 W, wavelengths of 185 and 254 nm) at 100 °C. Spin-coating, curing, and UV treatment were repeated 4 times. The sample was then annealed at 350 °C for 2 h in air.
The SnOx precursor solution was then spin-coated at 4000 rpm during 25 s. A first curing step at 100 °C was then followed by a second curing step at 280 °C. Each curing step lasted for 5 min.
Then, an active island was made. After a 2 h annealing step at 300 °C, via-holes were made to reach the gate contacts. Finally, indium zinc oxide (10 wt % In2O3) was deposited by sputtering and patterned as the source/drain. The samples had a final annealing step at 300 °C for 2 h in air on a hotplate.
The TFT IV curves were measured with a 4156B semiconductor parameter analyzer (HEWLETT PACKARD, Palo Alto, CA, USA). Twenty-five TFTs with a width (W) of 50 µm and a length (L) of 10 µm were measured to obtain average and standard deviation values. For simplicity, the threshold voltage was determined from the value at which the TFT reached IDS = W/L × 10−10 A at a drain voltage VDS = 0.1 V. The saturation mobility was extracted from the linear part of the √IDS versus VGS curve. The IOn/IOff ratio was extracted at VDS = 1 V from the ratio of maximum IDS and minimum IDS. The C-f characteristics of HfO2 were measured using a MIM structure (Mo/HfO2/Mo) with an Agilent E4980A precision LCR meter (Agilent Technologies, Inc., Santa Clara, CA, USA).

2.3. Thin Film Characterization

For atomic force microscopy (AFM) and X-ray spectroscopy (XPS), thin films were characterized with the same condition used in TFTs. For X-ray diffraction (XRD), X-ray reflectivity (XRR), and Hall effect, a 40 nm thick a-SnOx (using a 0.2 M precursor solution, coating and curing at 100 °C and 280 °C twice before annealing at 300 °C) was used for characterization. Atomic force microscopy was measured using an XE-100 (Park Systems, Suwon-Si, Gyeonggi-do, Korea) in tapping mode. Both XRD and XRR data were acquired with Cu-Kα radiation (λ = 1.54 Å). Time of flight secondary ion mass spectroscopy (TOF-SIMS) was measured using a TOF.SIMS 5 (IONTOF, Münster, Germany). The Cs+ ions were used as the sputtering ions at 1 keV, with a current of 10 nA.
The XPS was performed using a PHI 5000 VersaProbe (Ulvac-PHI, Kanagawa, Japan) at a base pressure of 2.0 × 10⁻⁷ Pa by calibrating with the C1s peak at 284.6 eV. The a-SnOx was deposited on the HfO2 for analysis.
The HR-TEM measurements were performed using an Titan 80–300 (Thermo Scientific™, former FEI, Hillsboro, OR, USA) on a TFT cut using the Focused Ion Beam (FIB) technique with a Nova 600 NanoLab (Thermo Scientific™, Former FEI, Hillsboro, OR, USA). A thin carbon layer was deposited to protect the sample from damage during FIB sampling. The Hall effect was measured with an ECOPIA HMS-3000 Hall effect measurement system (Ecopia, Anyang-si, Gyeonggi-do, Korea) using a Van der Pauw configuration. The average over 15 points were used to evaluate the Hall coefficient.

3. Results and Discussion

Figure 1 shows the thin film characteristics of solution processed tin oxide annealed in air at 300 °C. Figure 1a,b depicts the crystallinity as measured by a 2500D XRD system (Rigaku, Tokyo, Japan) and HR-TEM, respectively. The XRD pattern shows the broad amorphous peak related to the glass substrate [17]. The HR-TEM and the inset—showing the local fast Fourier transform (FFT)—further demonstrate the amorphous phase of SnOx.
Figure 1c,d shows the optical characteristics of the a-SnOx, which had a transmittance of 85.9% at 550 nm. The optical bandgap was extracted from the (αhυ)2 versus photon energy, as shown in Figure 1d [21]. The optical bandgap was 3.26 eV. The value was smaller than the polycrystalline counterpart (3.6 eV) [22] and is further discussed in this paper.
The surface roughness was analyzed via AFM, and the results are shown in Figure 1e. The root mean square (RMS) roughness was 0.155 nm. The density of the material was evaluated by XRR (Figure 1f) and showed a density of 5.29 g/cm3. The value was smaller than the density of polycrystalline SnO2, but similar to the one reported by Huang et al. [17] for the amorphous phase of SnO2 (5.01 g/cm3). The density and the optical bandgap of the a-SnOx were smaller than the values of crystalline SnO2. The reason could be that denser metal oxide materials have a higher density of overlap of the s-orbitals which, in turn, leads to a higher bandgap [23].
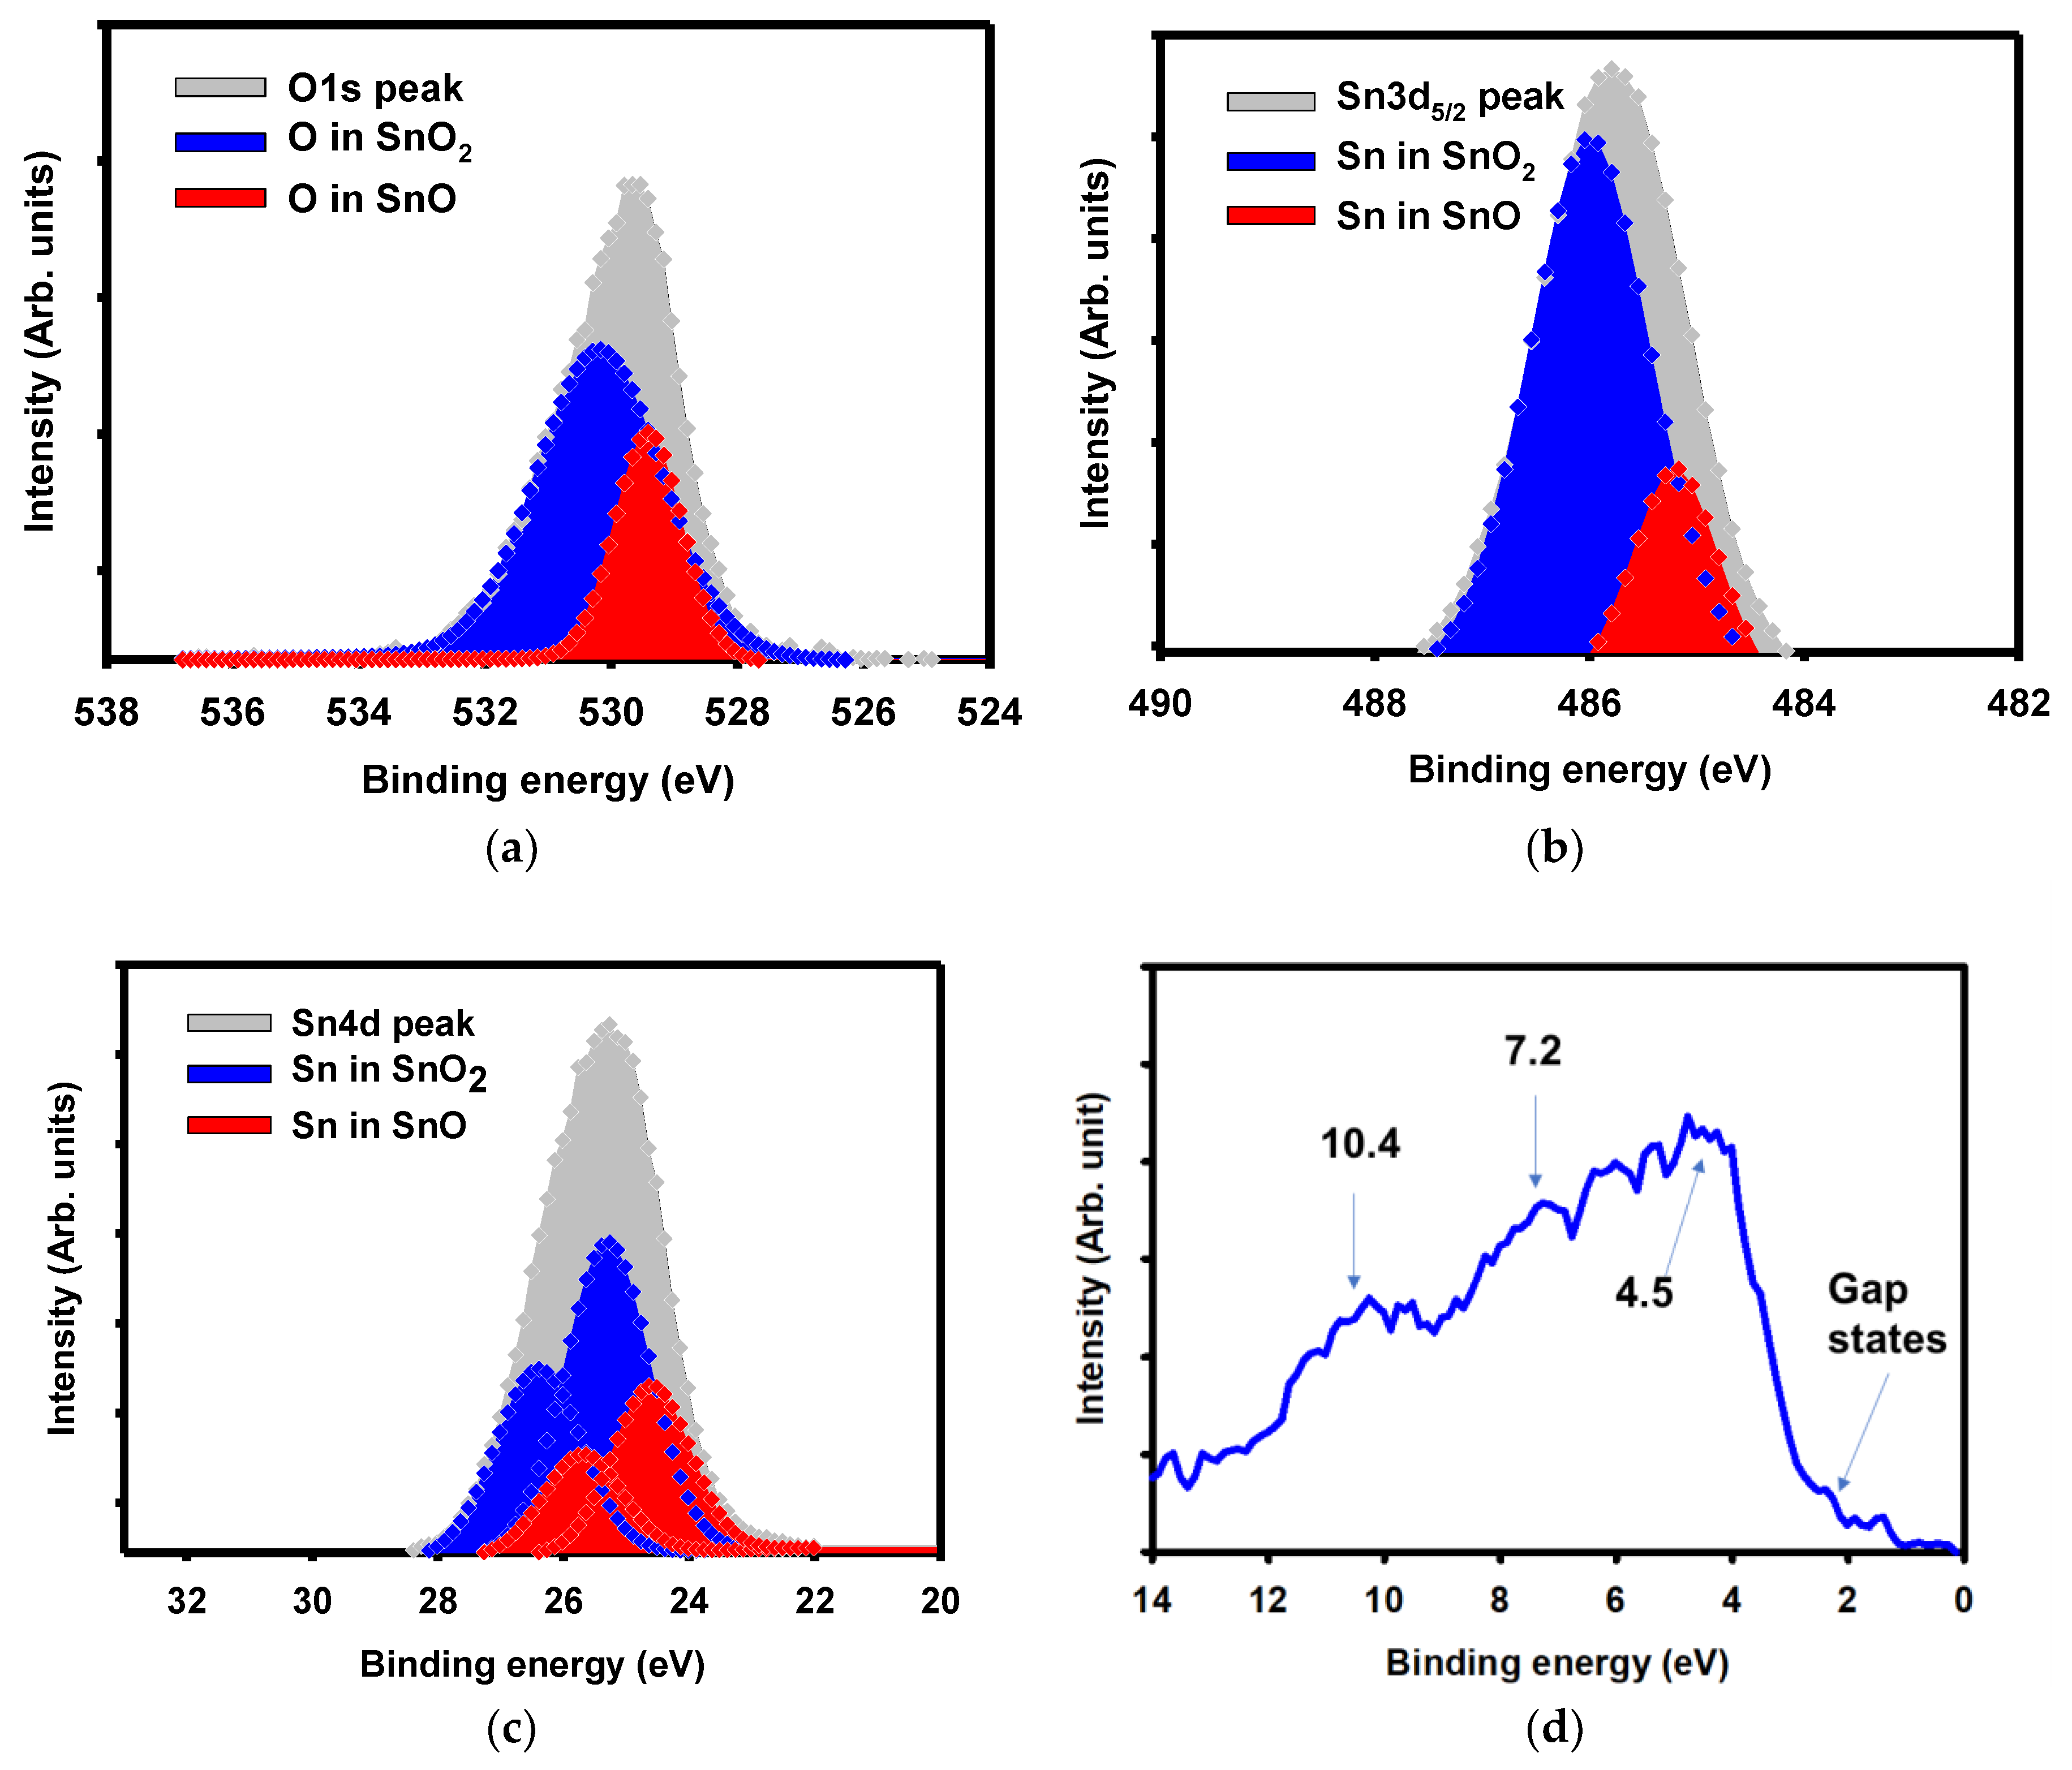
The electronic configuration of a-SnOx is shown in Figure 2. The O1s, Sn 3d5/2, Sn4d, and the valence band as measured by XPS are shown in Figure 2a–d. The deconvolution of the O1s follows the analysis used for tin oxide and not the conventional metal-oxide analysis [24,25,26]. The O1s peak in metal-oxides compounds are conventionally analyzed as having three parts: metal-oxygen, oxygen vacancies, and –OH groups. Here, the deconvolution of the O1s peak led to the knowledge of the phase composition of the film. The O1s can be deconvoluted into two peaks centered at 530.1 eV and at 529.4 eV. The separation of the two peaks by 0.7 eV indicates that the former was related to oxygen as in SnO2 while the latter was related to SnO [23,24]. The relative ratios of each component led to the presence of 72% of SnO2 and 28% of SnO. The O:Sn ratio was therefore 1.72. The deconvolution of the O1s peak into only two peaks is further justified by the analysis of the Sn3d5/2 peak.
The Sn3d5/2 peak can be deconvoluted into two peaks as well: one at 485.2 eV and another one at 485.9 eV. The energy separation of 0.7 eV is understood as before as the presence of Sn4+ and Sn2+ species. The relative ratios led to a phase ratio with a dominance of SnO2 over SnO—77% and 23%, respectively; the ratio O:Sn was 1.77 and in concordance with the one presented for O1s.
The analysis of the Sn4d core level further confirmed the presence of SnO2 and SnO, as shown in Figure 2c. The spin-orbit doublet was separated by 1.1 eV and an intensity ratio of 3:2 fit both Sn4+ (in blue in Figure 2c) and Sn2+ (in red in Figure 2c) related doublets. Note that both parts of a doublet have the same full width at half maximum (FWHM). The doublet related to Sn4+ was positioned at 25.3 and 26.4 eV and the doublet for Sn2+ was positioned at 24.6 and 25.7 eV.
The presence of the SnO2 phase over the SnO phase suggests that the material was n-type. To confirm, Hall effect measurements were performed. A negative Hall coefficient of −2.7266 cm3/C confirmed the n-type character of the a-SnOx.
Figure 2d shows the valence band (VB) of the a-SnOx as measured by XPS. The VB region usually shows three main peaks at 4.5, 7.2, and 10.4 eV [24]. The oxygen 2p bonding and anti-bonding related peak was at approximately 4.5 eV. The states resulting from the ppσ hybridization between Sn 5p and O 2p orbitals appeared at 7.2 eV, and bonds between the 5s and O2p orbitals appeared at 10.4 eV. Last but not least, the distance between the main peak (at 4.5 eV) and the 4d peak was ~21 eV and further confirmed the formation of SnO2 [26].
We evaluated the presence of carbon in the thin film by TOF-SIMS. We chose TOF-SIMS to evaluate the carbon content as the measurement gives higher precision than XPS. The depth profile of a-SnOx is shown in Figure 2e; only traces of carbon were observed in the film. The result exhibits the quality of the process, leading to an amorphous tin oxide thin film without carbon contamination.
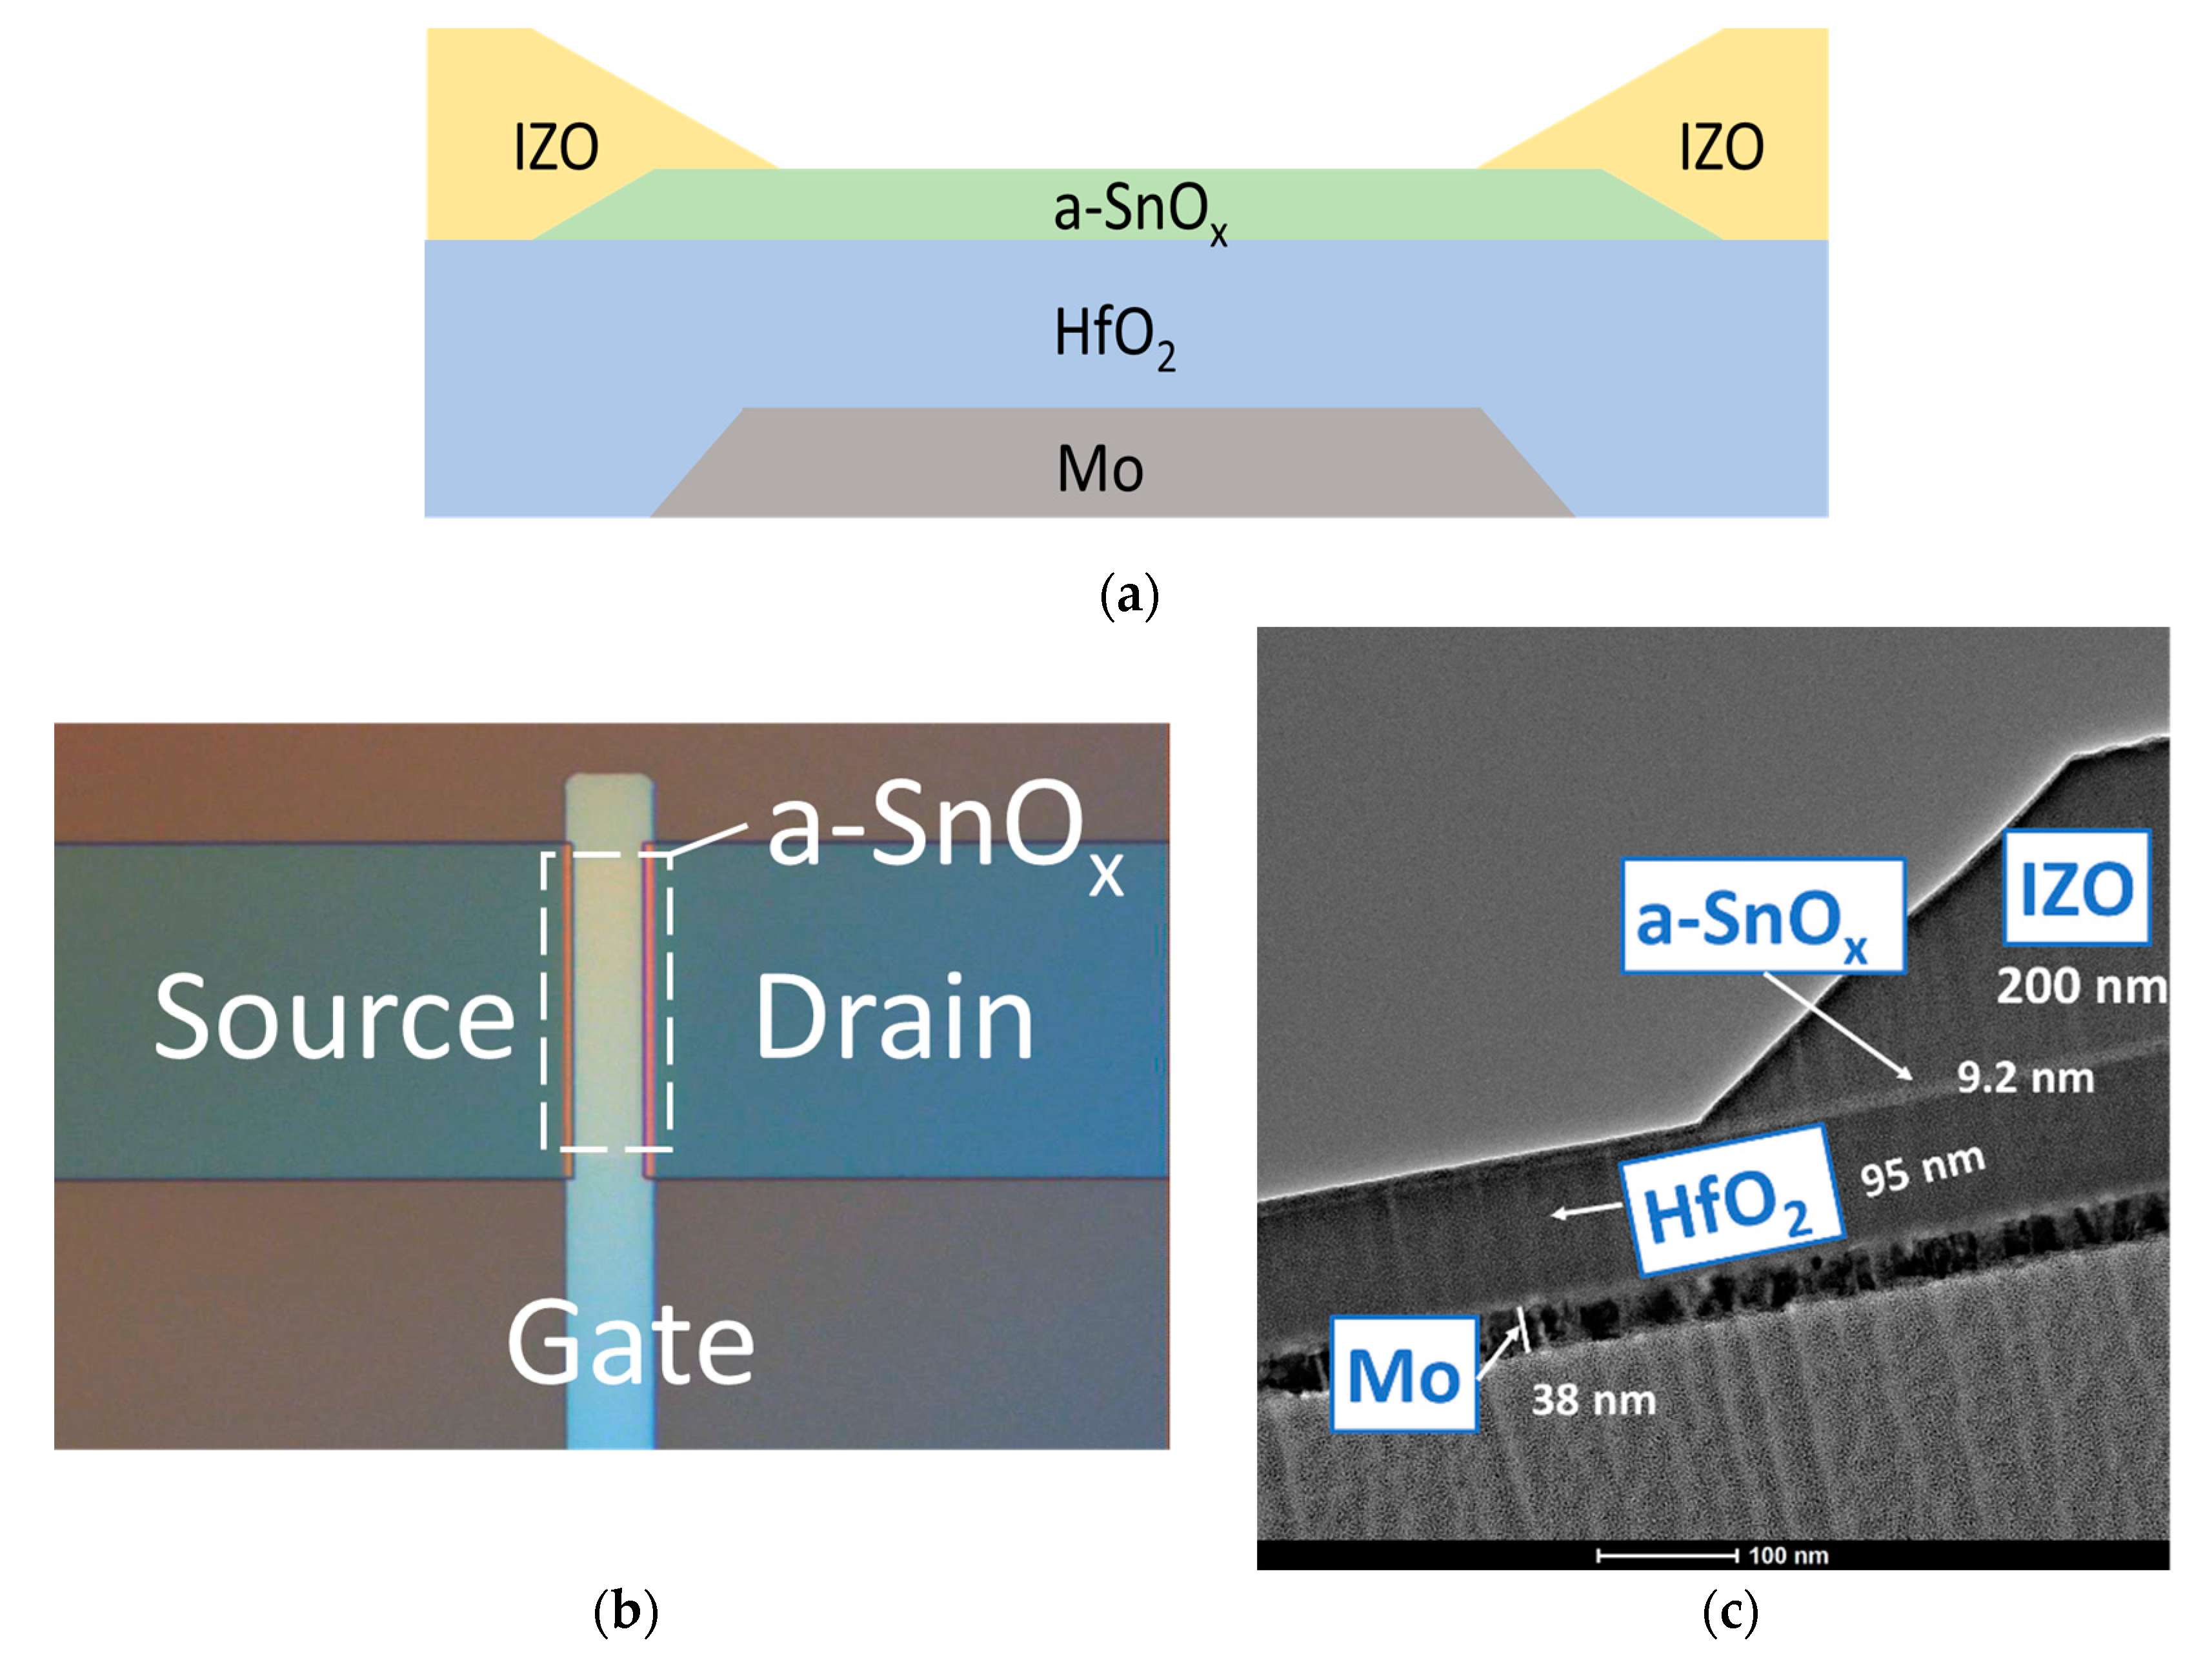
For potential use of a-SnOx in further applications, we employed a-SnOx as the active material in TFTs. Figure 3a shows the structure of the TFT used. Figure 3b shows a top view of a a-SnOx TFT taken by an optical microscope. Figure 3c shows a TEM image near the source/drain region. The thicknesses of Mo, HfO2, SnO2, and IZO were 38 nm, 95 nm, 9.2 nm, and 200 nm, respectively.
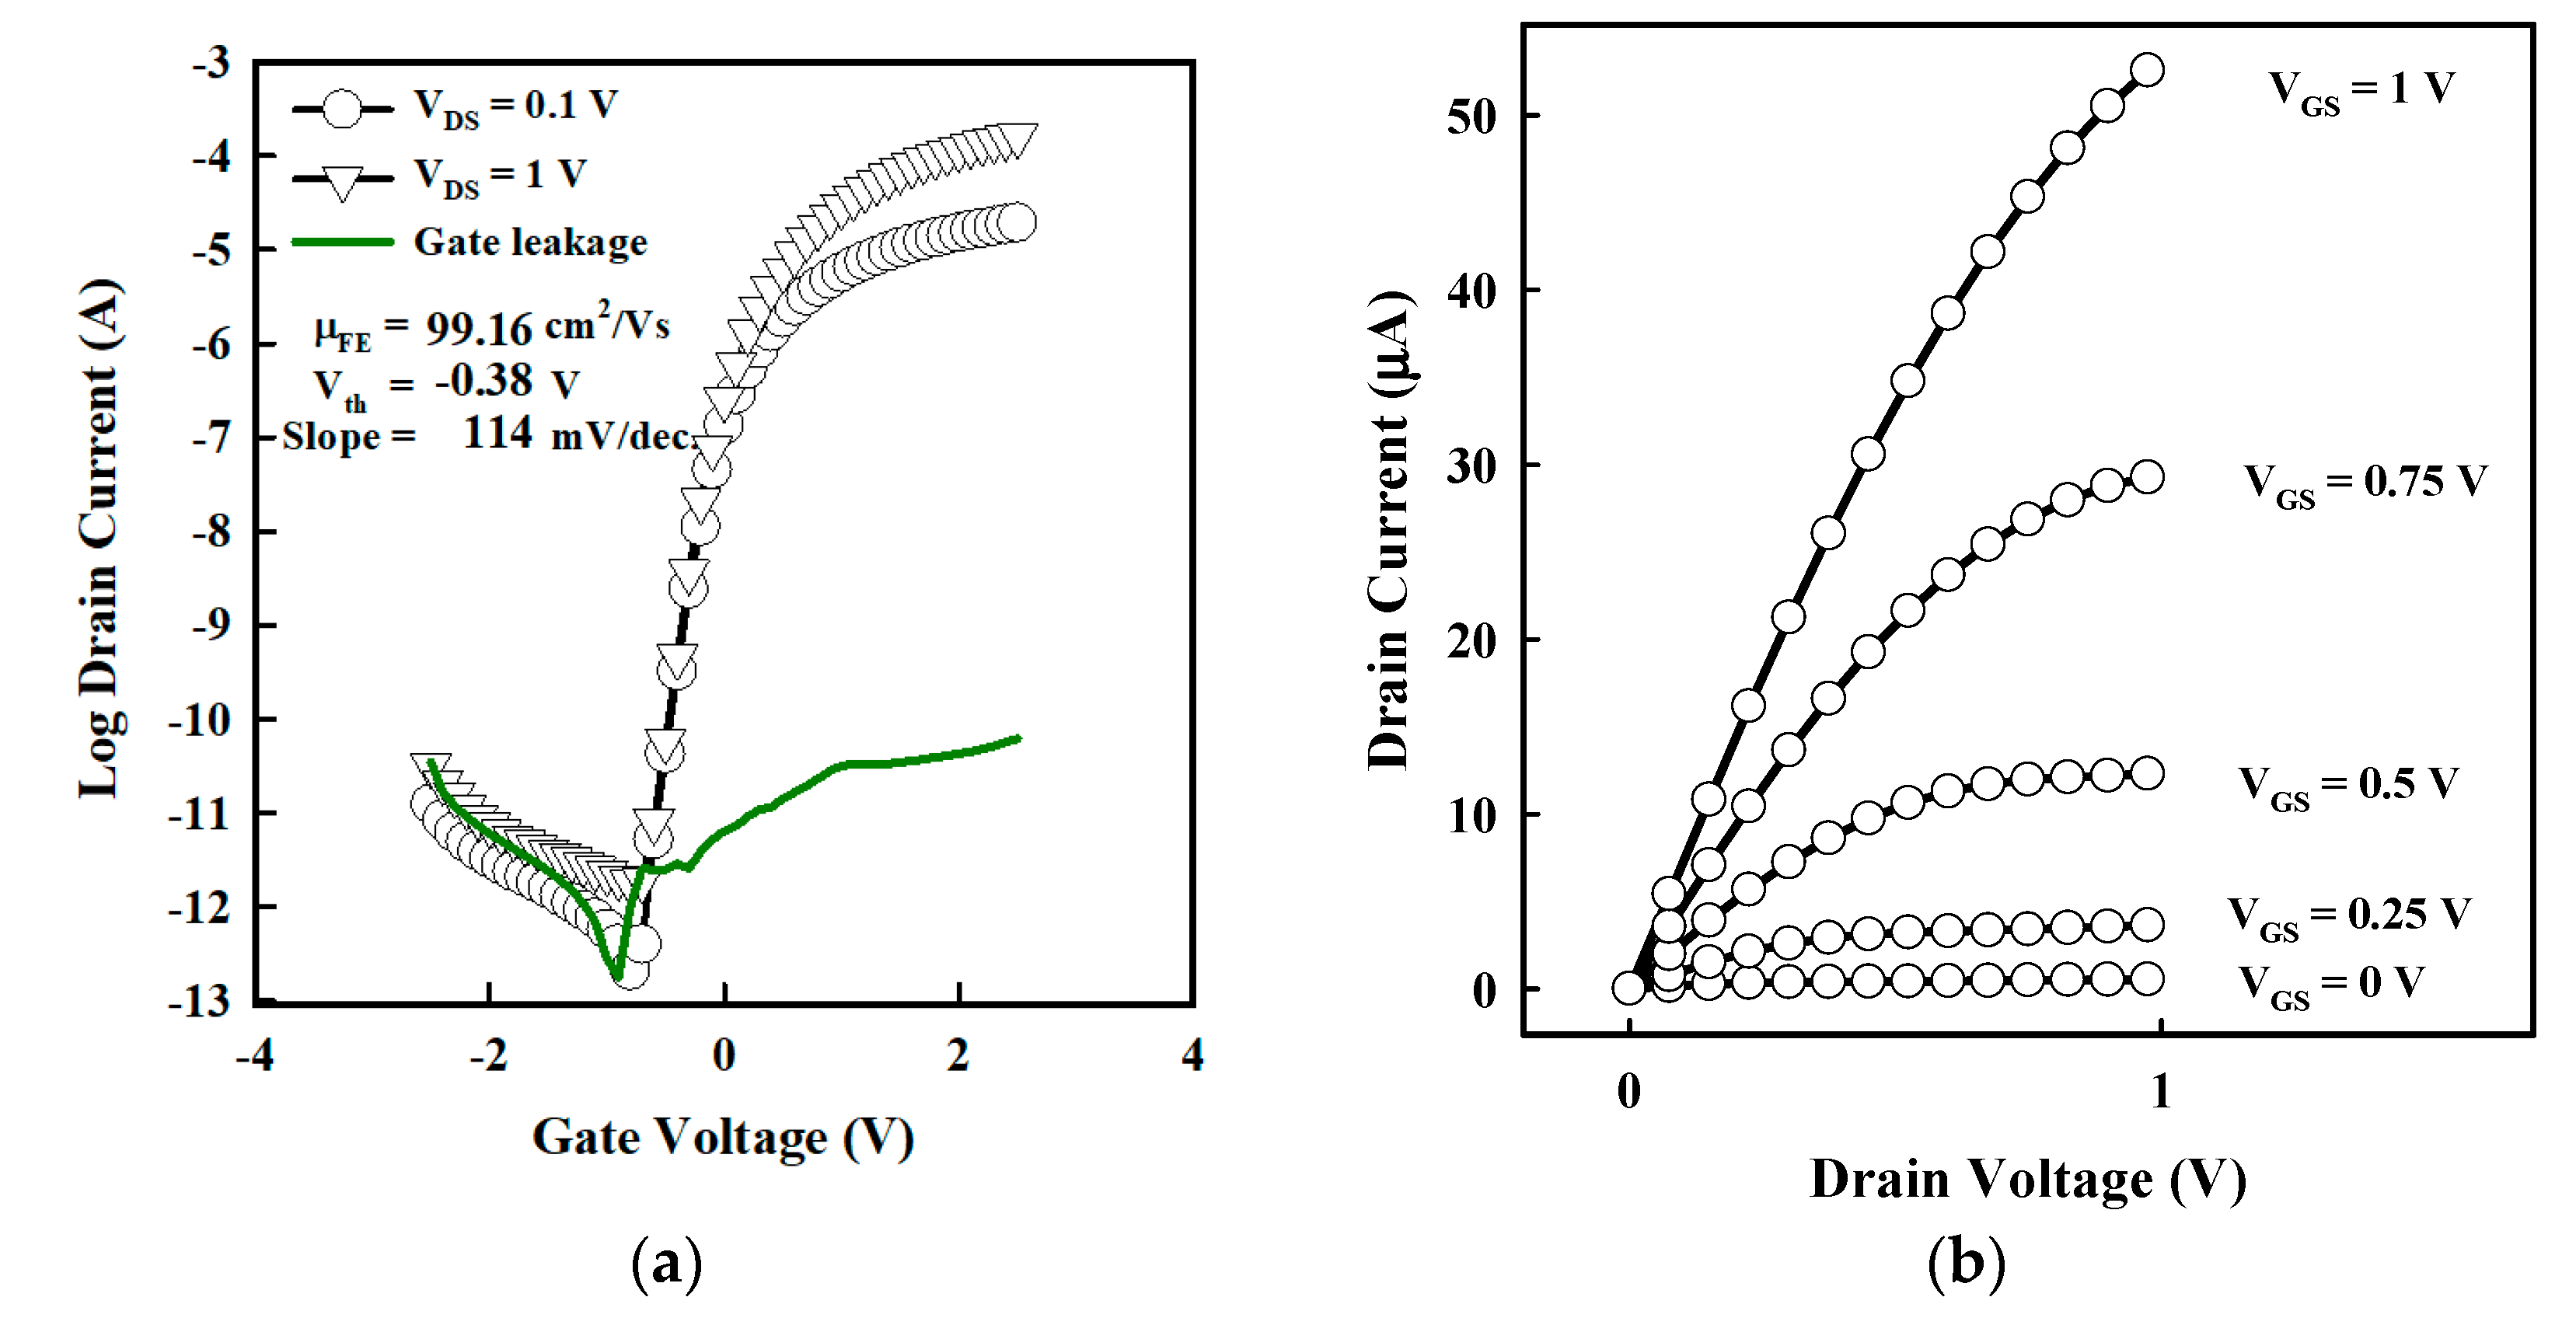
The TFTs were evaluated under DC operation; therefore, a low-frequency operation was used to evaluate the dielectric capacitance value. At 100 Hz, the capacitance of the HfO2 had a value of 219 nF/cm2. Note that the permittivity of HfO2 was 23, close to its theoretical value [27]. The TFTs field-effect mobility µFE, threshold voltage (Vth), subthreshold swing (S.S.), and ION/IOFF were 99.5 ± 15.4 cm2/Vs, −0.4 ± 0.04 V, 103 ± 16 mV/dec, and 2.2 ± 1.4 108, respectively. The typical TFT transfer and output characteristics are shown in Figure 4a,b. The TFTs had µFE, Vth, SS, and ION/IOFF values of 99.16 cm2/Vs, −0.38 V, 114 mV/dec, and 1.7 × 10⁸. Note that the gate leakage was at least 105 smaller than the IDS current, ensuring that the TFT operation was not influenced by the gate leakage.
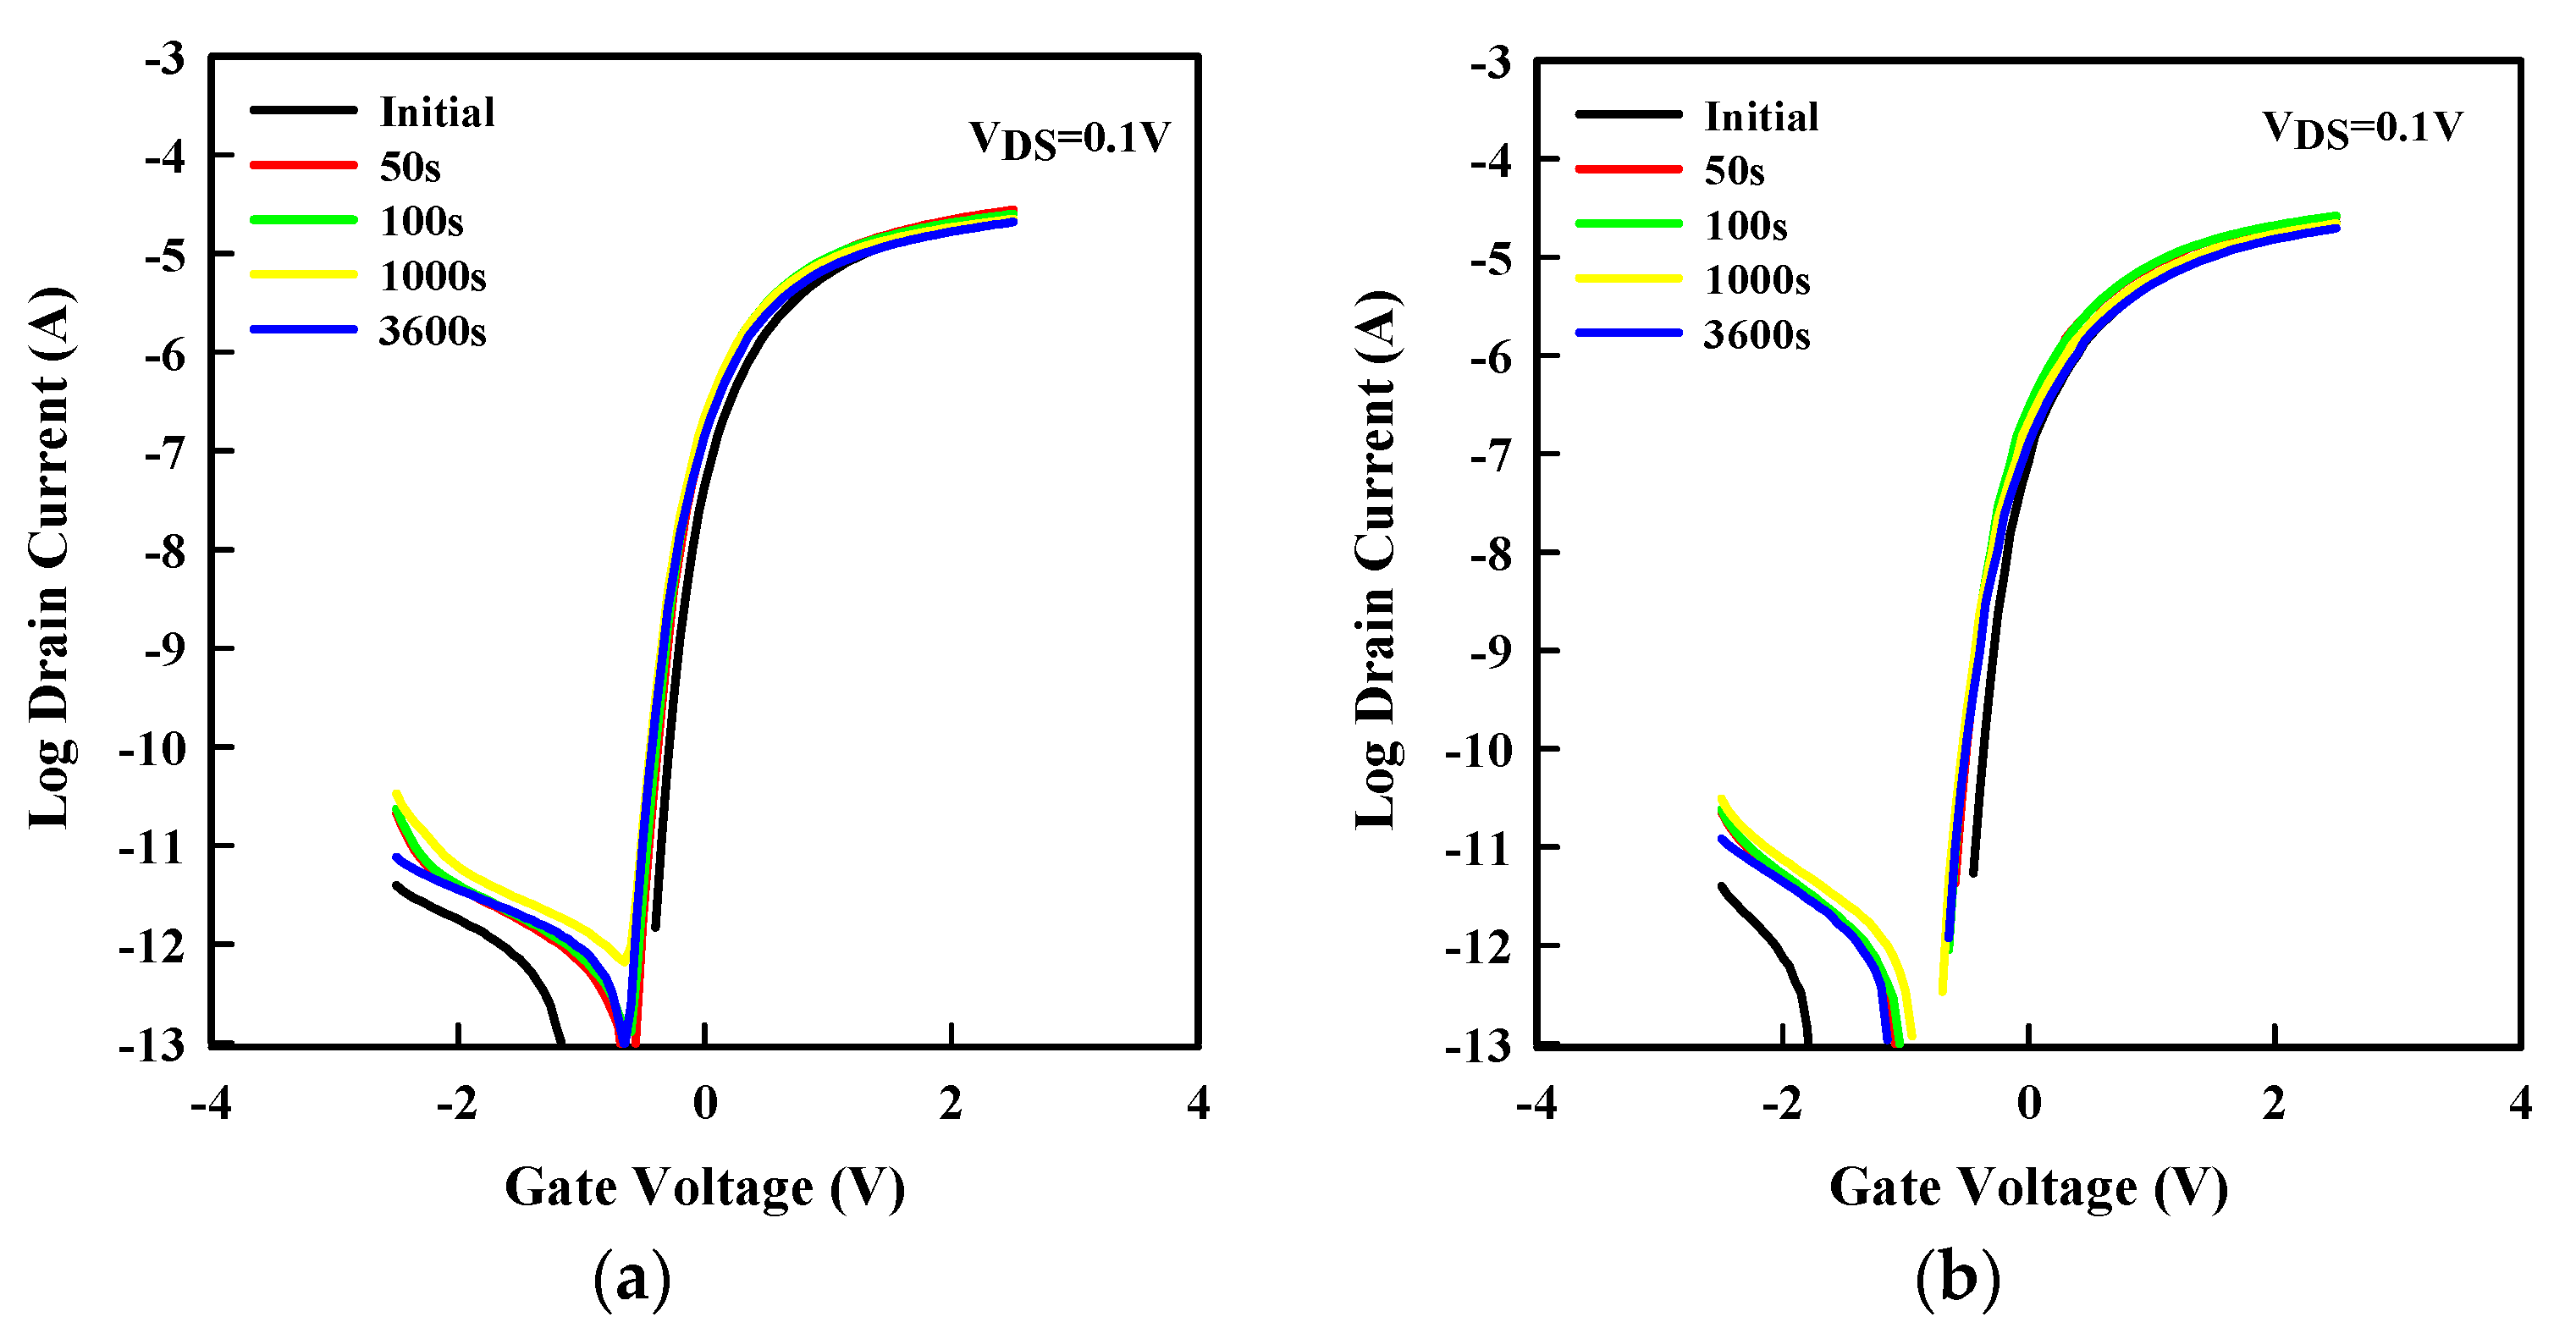
To evaluate the potential use of a-SnOx in TFTs, other metrics such as stability under gate bias stress can be used. Positive and negative gate bias stresses were applied for 1 h under VGS = 2.5 V and VGS = −2.5 V, respectively. Figure 5a,b shows the evolution of the transfer curve under PBS and NBS, which led to a |ΔVth| of 0.15 V and 0.05 V, respectively. Note that most of the ΔVth occurred within the first 50 s. It is suggested that defects are created near/at the dielectric interface with the a-SnOx layer [4,10,12]. Also note an increase in the IOFF during the applied stress. The increase in the OFF region can be understood as that more holes are available in the channel region. The holes may come from the created defects. Nonetheless, the IOFF remains in the 10 pA range suggesting that the number of holes remained small. Higher stability may be achieved via surface treatment such as UV treatment or plasma treatment [28,29].

4. Conclusions

The properties of amorphous SnOx were investigated. The amorphous phase was confirmed by both XRD and HR-TEM. The a-SnOx was an n-type semiconductor with SnO2 as the main phase; the material had a density of 5.29 g/cm3; it showed a transmittance of 85.9% at 550 nm; and the a-SnOx demonstrated a band gap of 3.26 eV. Implementation in TFTs with HfO2 as the dielectric led to field-effect mobilities of 99.5 cm2/Vs and ION/IOFF over 107 at operating voltages below 3 V.
The proposed solution processed a-SnOx was an amorphous metal oxide semiconductor based on one cation only. The results demonstrated possible competition with other high-performance materials—including poly-Si and multiple cation-based AOS such as IGZO—and could potentially be used in a wider range of applications.

Author Contributions

Formal analysis, C.A.; Funding acquisition, J.J.; Investigation, C.A. and Y.K.

Funding

This research was supported by the MOTIE (Ministry of Trade, Industry & Energy (10052044)) and KDRC (Korea Display Research Corporation) support program for the development of future device technology for the display industry.

Conflicts of Interest

The authors declare no conflict of interest.

References

  1. Nomura, K.; Ohta, H.; Takagi, A.; Kamiya, T.; Hirano, M.; Hosono, H. Room-temperature fabrication of transparent flexible thin-film transistors using amorphous oxide semiconductors. Nature 2004, 432, 488–492. [Google Scholar] [CrossRef] [PubMed]
  2. Sheng, J.; Jeong, H.; Han, K.; Hong, T.; Park, J. Review of recent advances in flexible oxide semiconductor thin-film transistors. J. Inf. Disp. 2017, 18, 159–172. [Google Scholar] [CrossRef]
  3. Fortunato, E.; Barquinha, P.; Martins, R. Oxide Semiconductor Thin-Film Transistors: A Review of Recent Advances. Adv. Mater. 2012, 24, 2945–2986. [Google Scholar] [CrossRef] [PubMed]
  4. Avis, C.; Hwang, H.R.; Jang, J. Effect of Channel Layer Thickness on the Performance of Indium Zinc Tin Oxide Thin Film Transistors Manufactured by Inkjet Printing. ACS Appl. Mater. Interfaces 2014, 6, 10941–10945. [Google Scholar] [CrossRef] [PubMed]
  5. Banger, K.K.; Yamashita, Y.; Mori, K.; Peterson, R.; Leedham, T.; Rickard, J.; Sirringhaus, H. Low-temperature, high-performance solution-processed metal oxide thin-film transistors formed by a ‘sol–gel on chip’ process. Nat. Mater. 2011, 10, 45–50. [Google Scholar] [CrossRef] [PubMed]
  6. Yu, X.; Marks, T.; Facchetti, A. Metal oxides for optoelectronic applications. Nat. Mater. 2016, 15, 383–396. [Google Scholar] [CrossRef]
  7. Xu, W.; Wang, H.; Ye, L.; Xu, J. The role of solution-processed high-k gate dielectrics in electrical performance of oxide thin-film transistors. Mater. Chem. C 2014, 2, 5389–5396. [Google Scholar] [CrossRef]
  8. Pal, B.N.; Mukund Dhar, B.; See, K.C.; Katz, H.E. Solution-deposited sodium beta-alumina gate dielectrics for low-voltage and transparent field-effect transistors. Nat. Mater. 2009, 8, 898–903. [Google Scholar] [CrossRef]
  9. Liu, A.; Zhu, H.; Sun, H.; Xu, Y.; Noh, Y.-Y. Solution Processed Metal Oxide High-κ Dielectrics for Emerging Transistors and Circuits. Adv. Mater. 2018, 30, 1–39. [Google Scholar] [CrossRef]
  10. Avis, C.; Jang, J. High-performance solution processed oxide TFT with aluminum oxide gate dielectric fabricated by a sol–gel method. J. Mater. Chem. 2011, 21, 10649–10652. [Google Scholar] [CrossRef]
  11. Nomura, K.; Ohta, H.; Ueda, K.; Kamiya, T.; Hirano, M.; Hosono, H. Thin-Film Transistor Fabricated in Single-Crystalline Transparent Oxide Semiconductor. Science 2003, 300, 1269–1272. [Google Scholar] [CrossRef] [PubMed]
  12. Kim, Y.G.; Kim, T.; Avis, C.; Lee, S.H.; Jang, J. Stable and High-Performance Indium Oxide Thin-Film Transistor by Ga Doping. IEEE Trans. Electron. Dev. 2016, 63, 1078–1084. [Google Scholar] [CrossRef]
  13. Klasens, H.A.; Koelmans, H. A tin oxide field-effect transistor. Solid State Electron. 1964, 7, 701–702. [Google Scholar] [CrossRef]
  14. Nomura, K.; Kamiya, T.; Hosono, H. Ambipolar Oxide Thin-Film Transistor. Adv. Mater. 2011, 23, 3431–3434. [Google Scholar] [CrossRef] [PubMed]
  15. Sajiz, K.J.; Reena Mary, A.P. Tin Oxide Based P and N-Type Thin Film Transistors Developed by RF Sputtering. ECS J. Solid State Sci. Technol. 2015, 4, Q101–Q104. [Google Scholar] [CrossRef]
  16. Presley, R.E.; Munsee, C.L.; Park, C.-H.; Hong, D.; Wager, J.F.; Keszler, D.A. Tin Oxide Transparent Thin-Film Transistors. J. Phys. D Appl. Phys. 2004, 37, 2810–2813. [Google Scholar] [CrossRef]
  17. Huang, G.; Duan, L.; Dong, G.; Zhang, D.; Qiu, Y. High-Mobility Solution-Processed Tin Oxide Thin-Film Transistors with High κ Alumina Dielectric Working in Enhancement Mode. ACS Appl. Mater. Interfaces 2014, 6, 20786–20794. [Google Scholar] [CrossRef]
  18. Jang, J.; Kitsomboonloha, R.; Swisher, S.L.; Park, E.S.; Kang, H.; Subramanian, V. Transparent High-Performance Thin Film Transistors from Solution-Processed SnO2/ZrO2 Gel-like Precursors. Adv. Mater. 2013, 25, 1042–1047. [Google Scholar] [CrossRef]
  19. Priyadarshini, D.M.; Ramanjaneyulu, M.; Rao, M.S.; Das Gupta, N. Effect of annealing ambient on SnO2 thin film transistors. Appl. Surf. Sci. 2017, 418, 414–417. [Google Scholar] [CrossRef]
  20. Shih, C.; Chin, A.; Lu, C.F.; Su, W.F. Remarkably high mobility ultrathin-film metal-oxide transistor with strongly overlapped orbitals. Sci. Rep. 2016, 6, 19023. [Google Scholar] [CrossRef]
  21. Tauc, J. Optical properties and electronic structure of amorphous Ge and Si. Mat. Res. Bull. 1968, 3, 37–46. [Google Scholar] [CrossRef]
  22. Ganose, A.M.; Scanlon, D.O. Band gap and work function tailoring of SnO2 for improved transparent conducting ability in photovoltaics. J. Mater. Chem. C 2016, 7, 1467–1475. [Google Scholar] [CrossRef]
  23. Kang, Y.; Song, H.; Nahm, H.; Jeon, S.; Cho, Y.; Han, S. Intrinsic nature of visible-light absorption in amorphous semiconducting oxides. Appl. Mater. 2014, 2, 032108. [Google Scholar] [CrossRef] [Green Version]
  24. Themlin, J.M.; Chtaib, M.; Henrard, L.; Lambin, P.; Darville, J.; Gilles, J.M. Characterization of tin oxides by X-ray-photoemission spectroscopy. Phys. Rev. B 1992, 46, 2460–2466. [Google Scholar] [CrossRef]
  25. Kwoka, M.; Ottaviano, L.; Passacantando, M.; Santucci, S.; Czempika, G.; Szuber, J. XPS study of the surface chemistry of L-CVD SnO2 thin films after oxidation. Thin Solid Films 2005, 490, 36–42. [Google Scholar] [CrossRef]
  26. Akgul, F.; Gumus, C.; Er, A.; Farha, A.H.; Akgul, G.; Ufuktepe, Y.; Liu, Z. Structural and electronic properties of SnO2. J. Alloy. Compd. 2013, 579, 50–56. [Google Scholar] [CrossRef]
  27. Robertson, J.; Wallace, R.M. High-K materials and metal gates for CMOS applications. Mater. Sci. Eng. R Rep. 2015, 88, 1–41. [Google Scholar] [CrossRef]
  28. Bukke, R.; Avis, C.; Chowdhury, M.D.H.; Kim, T.; Lin, T.; Jang, J. Improvement in performance of solution processed indium–zinc–tin oxide thin-film transistors by UV/O3 treatment on zirconium oxide gate insulator. J. Jpn. J. Appl. Phys. 2016, 55, 03CC02. [Google Scholar] [CrossRef]
  29. Fan, C.; Tseng, F.; Tseng, C. Electrical Performance and Reliability Improvement of Amorphous-Indium-Gallium-Zinc-Oxide Thin-Film Transistors with HfO2 Gate Dielectrics by CF4 Plasma Treatment. Materials 2018, 11, 824. [Google Scholar] [CrossRef]
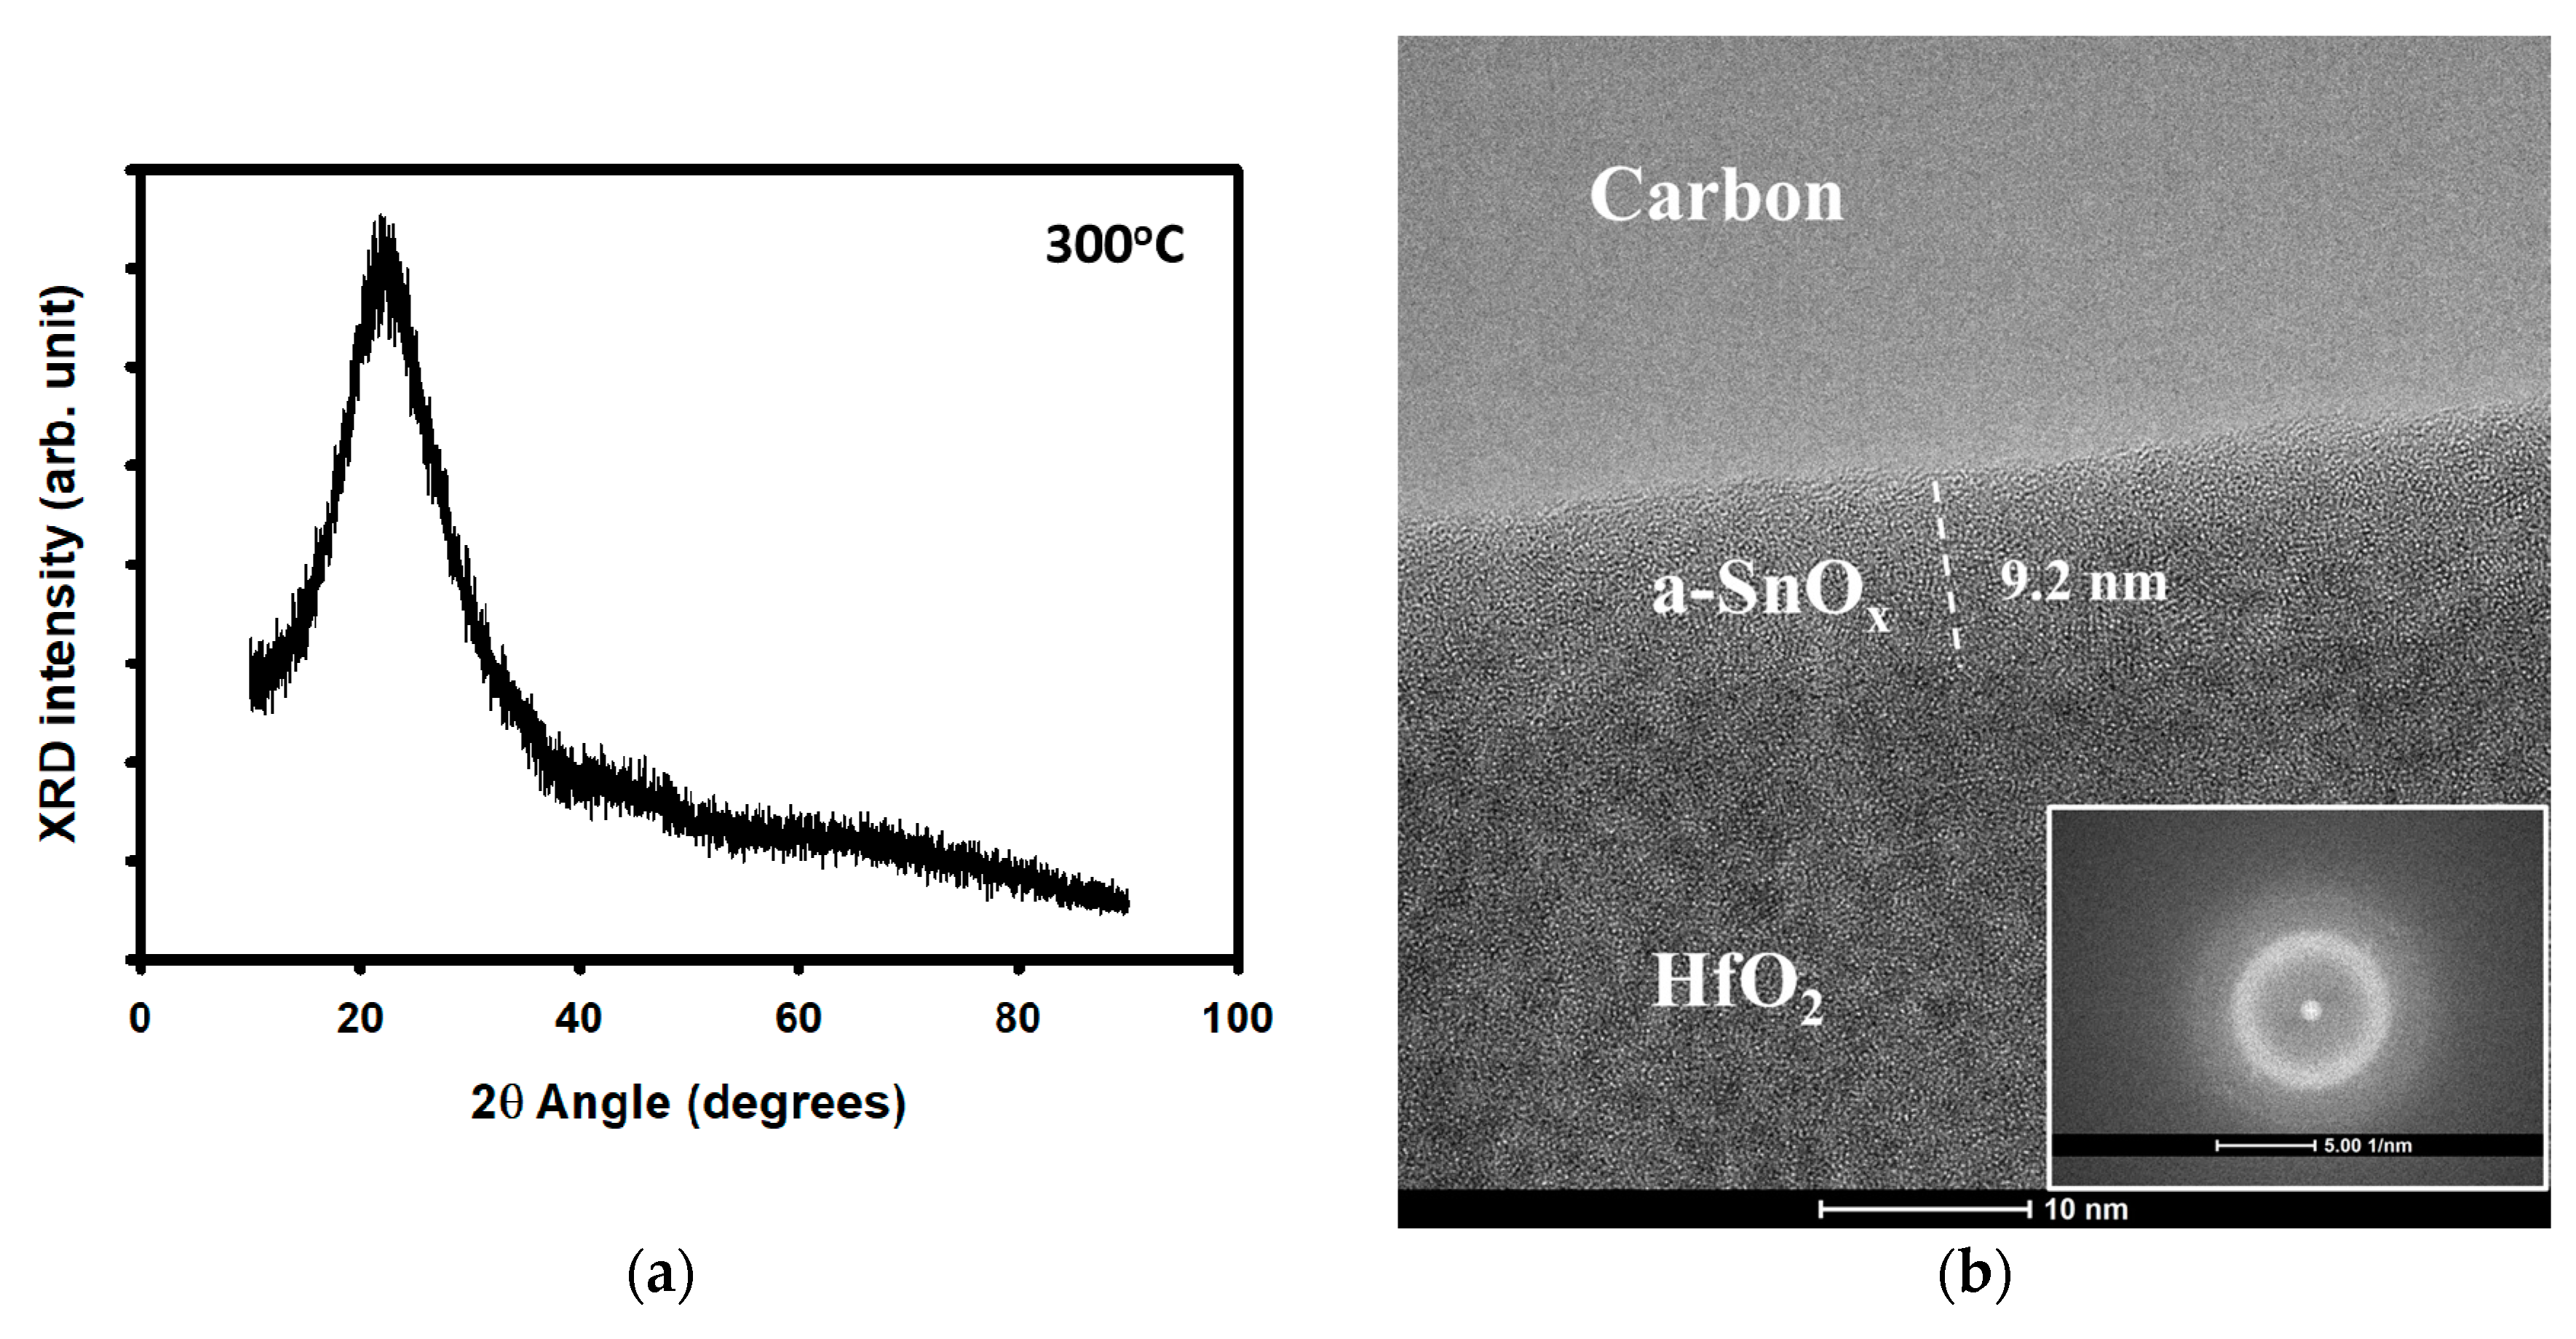
Figure 1. Physical properties of a-SnOx thin films annealed at 300 °C. (a) XRD pattern of a 40 nm thick SnOx. (b) High-resolution TEM image of SnOx used in a thin-film transistor (TFT) channel region; the inset shows the local fast Fourier transform (FFT) pattern. (c) Transmittance of a-SnOx thin film and (d) extraction of a-SnOx optical bandgap using a Tauc plot. The orange line is the extrapolation from the curve and the intersection with the abscissa axis gives the optical bandgap; the value is indicated in the blue box. (e) An AFM image of the a-SnOx surface. (f) The XRR measurement of the a-SnOx. In (a,f) arb. Stands for arbitrary.
Materials 12 03341 g001aMaterials 12 03341 g001b
Figure 2. Composition analysis of a-SnOx. (a) O1s spectrum and decomposed components of a-SnOx thin film. The blue part represents oxygen in SnO2, the red one oxygen in SnO. (b) Deconvolution of the Sn3d 5/2 peak. The blue part represents Sn as in SnO2, the red part Sn as in SnO. (c) Sn4d peak analysis. The two doublets related to SnO2 are in blue, the doublets related to SnO are in red. (d) Valence band analysis of a-SnOx. (e) TOF-SIMS profile of a-SnOx. In blue, red, and black are shown CsSi+, CsC+, and CsSn+ depth profile, respectively. In the above charts, Arb. stands for arbitrary.
Materials 12 03341 g002aMaterials 12 03341 g002b
Figure 3. The a-SnOx TFT structure: (a) a schematic diagram of the bottom gate and top contact a-SnOx TFT. (b) An illustration of an a-SnOx TFT. (c) TEM image of an a-SnOx TFT taken near the source/drain region.
Materials 12 03341 g003
Figure 4. Electrical characterization of a-SnOx TFT. Typical (a) transfer and (b) output of a TFT using HfO2 as the gate insulator. For the transfer curve, VDS = 0.1 and 1 V are shown in dark lines with symbols. The green line is the gate leakage. For the output curves, VDS was varied from 0 to 1 V, and VGS was set from 0–1 V.
Materials 12 03341 g004
Figure 5. a-SnOx TFTs under various stress during 3600 s. The evolution of the transfer curve of a-SnOx TFT under (a) positive gate bias stress and (b) negative bias stress. After 50, 100, 1000, and 3600 s, a transfer curve was measured (at VDS = 0.1 V). One color is shown per measurement.
Materials 12 03341 g005