Analysis of the Behavior of SMA Mixtures with Different Fillers Through the Semicircular Bend (SCB) Fracture Test

 ,
,
Abstract
1. Introduction
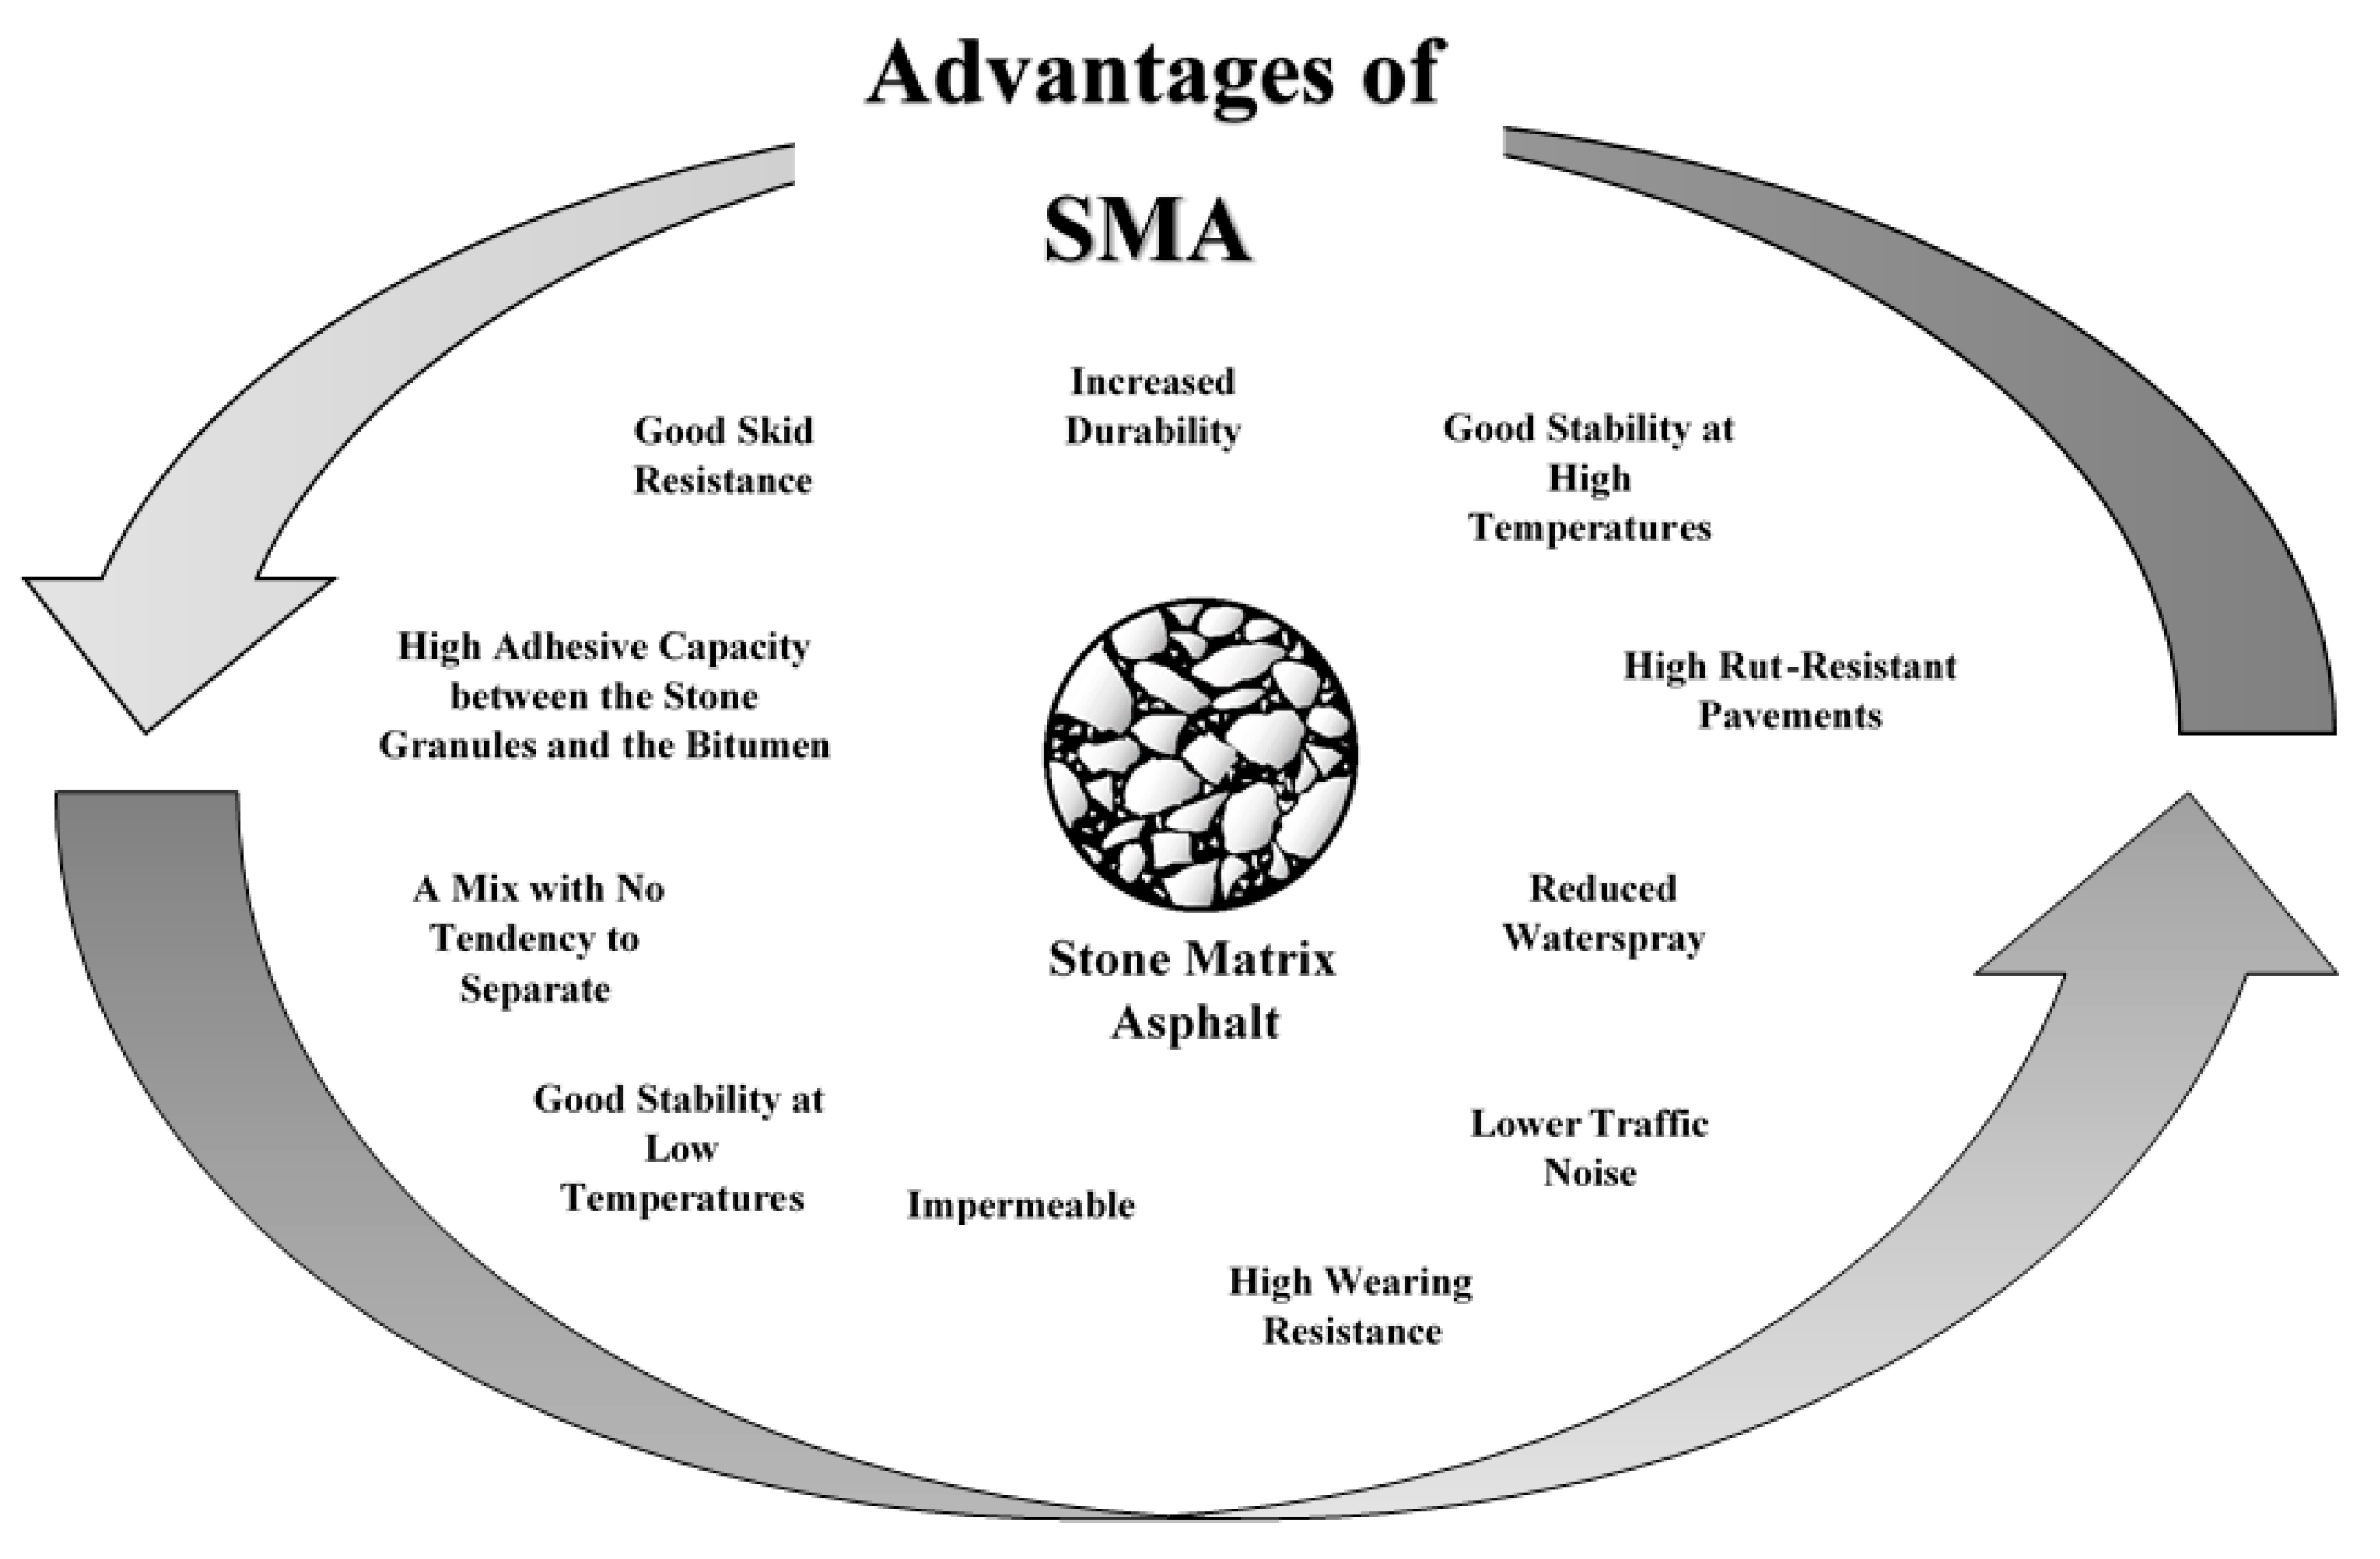
2. Background
3. Materials and Methods
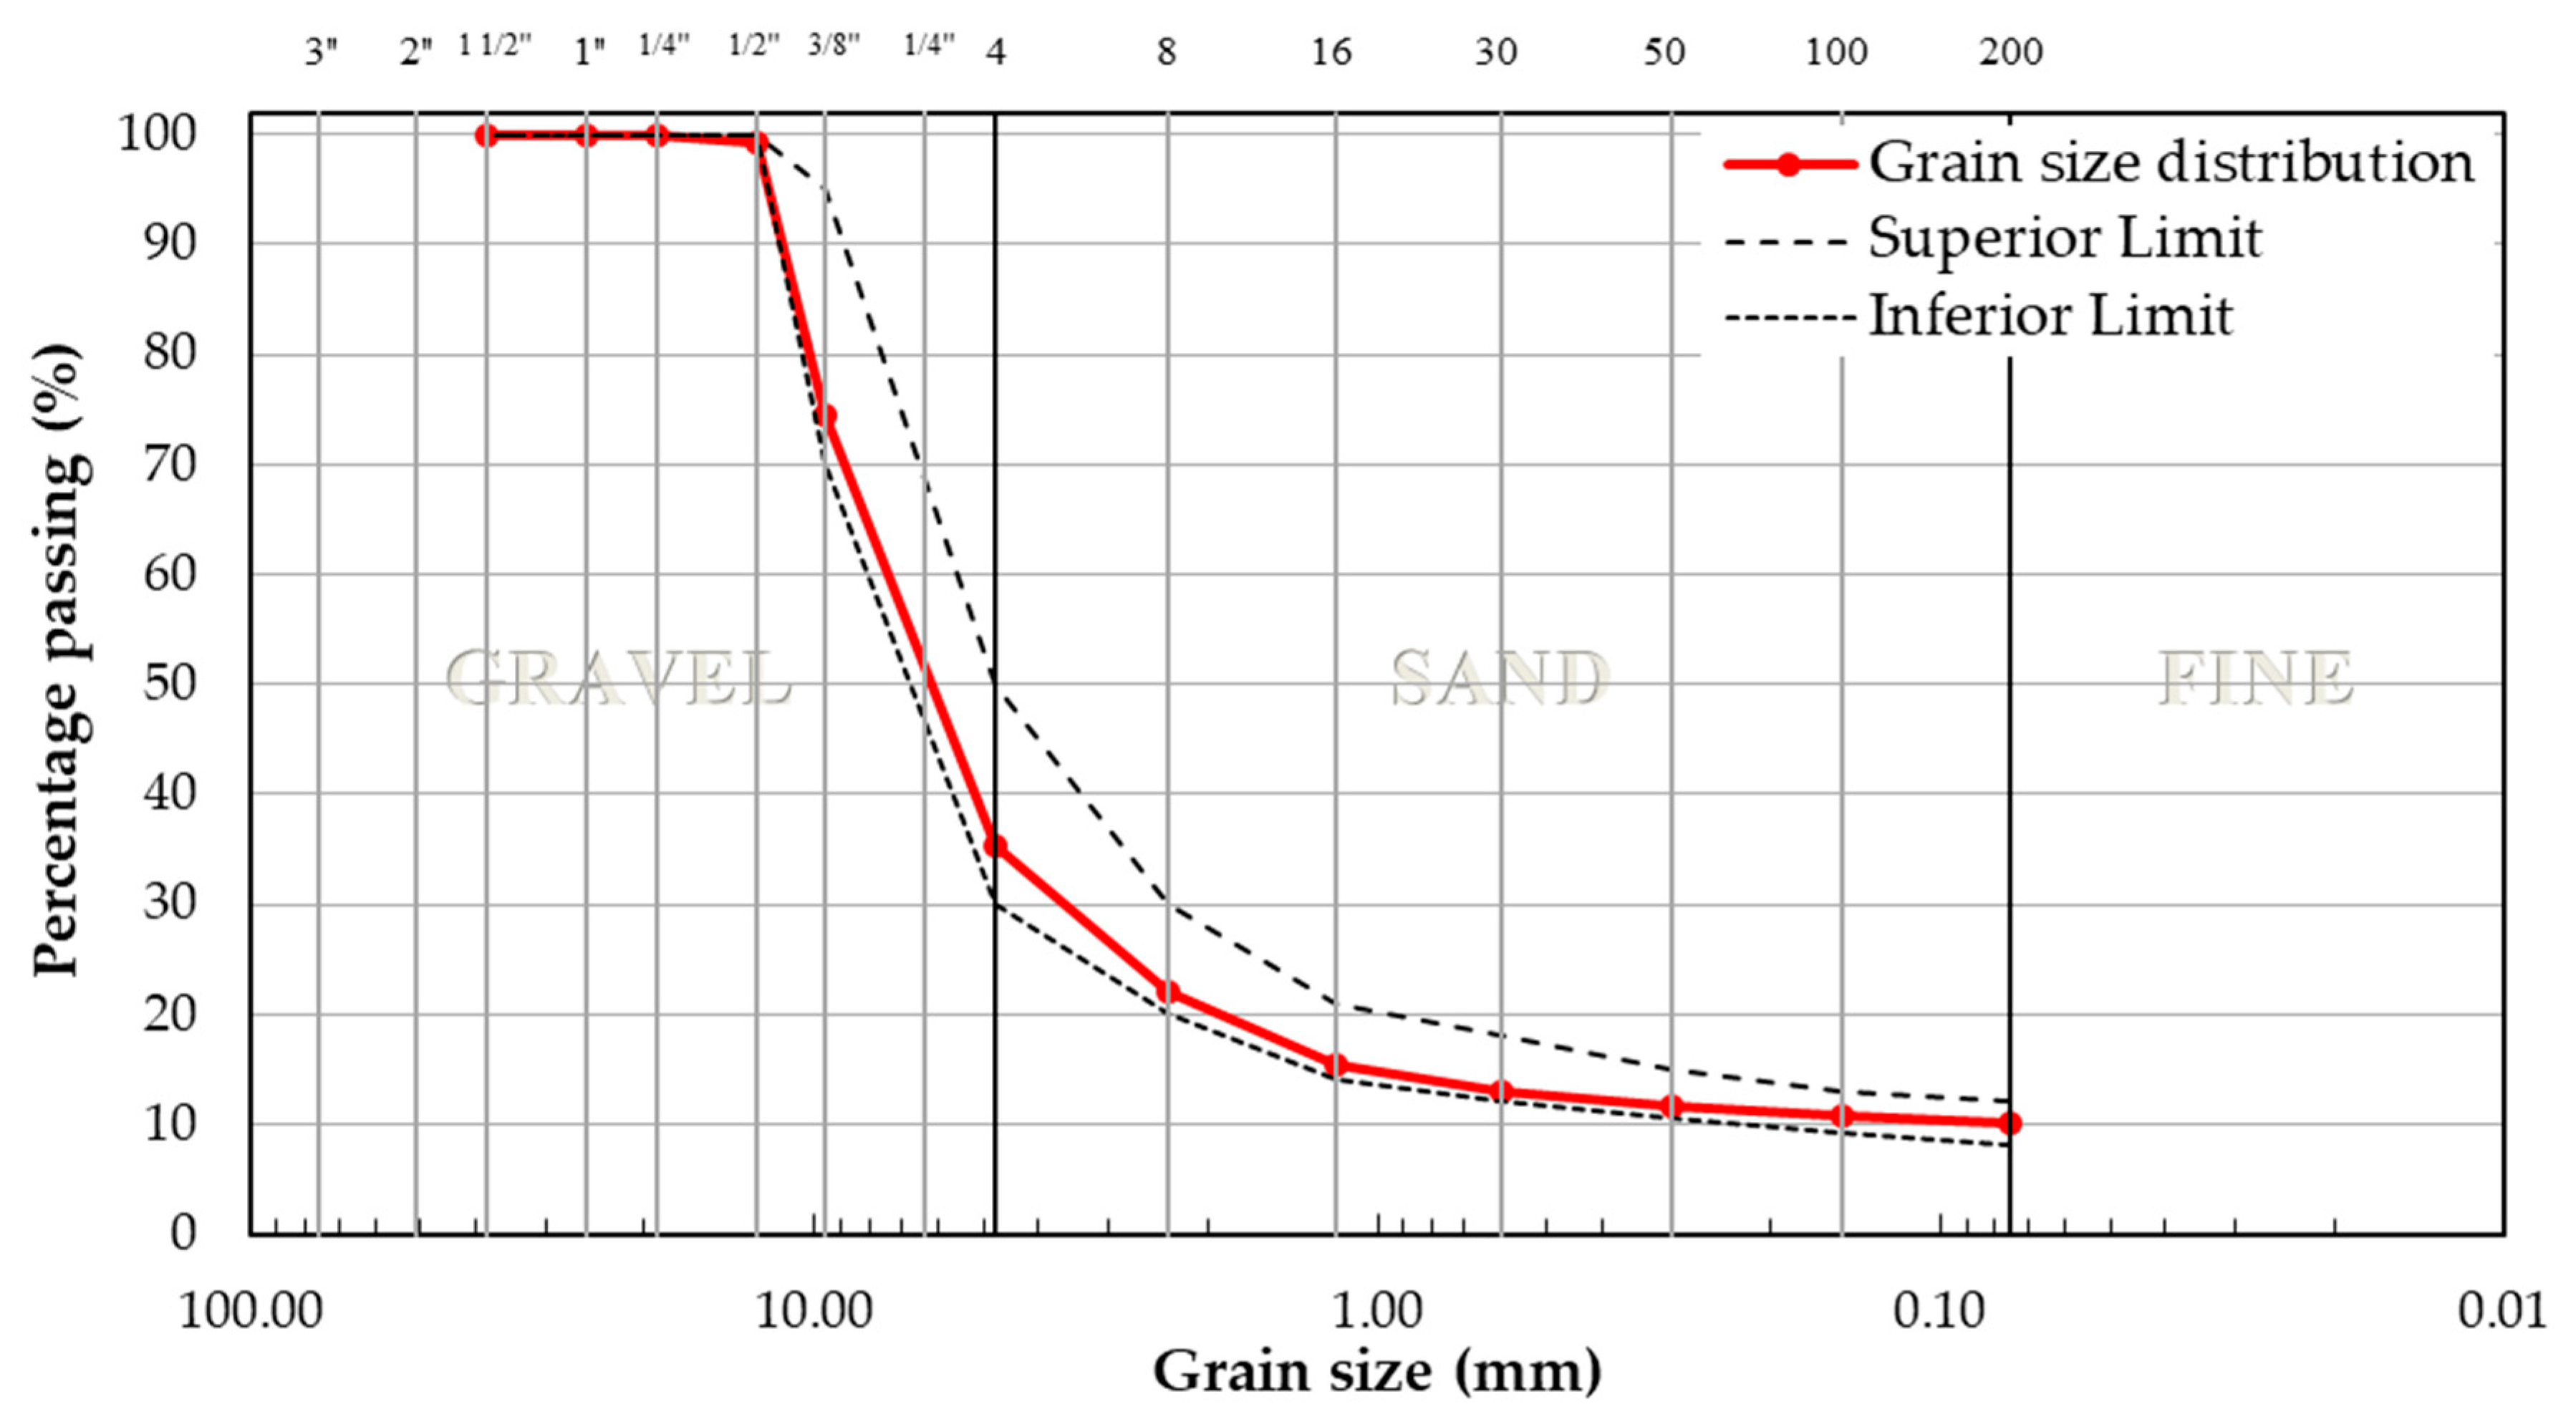
3.1. Aggregate Characteristics
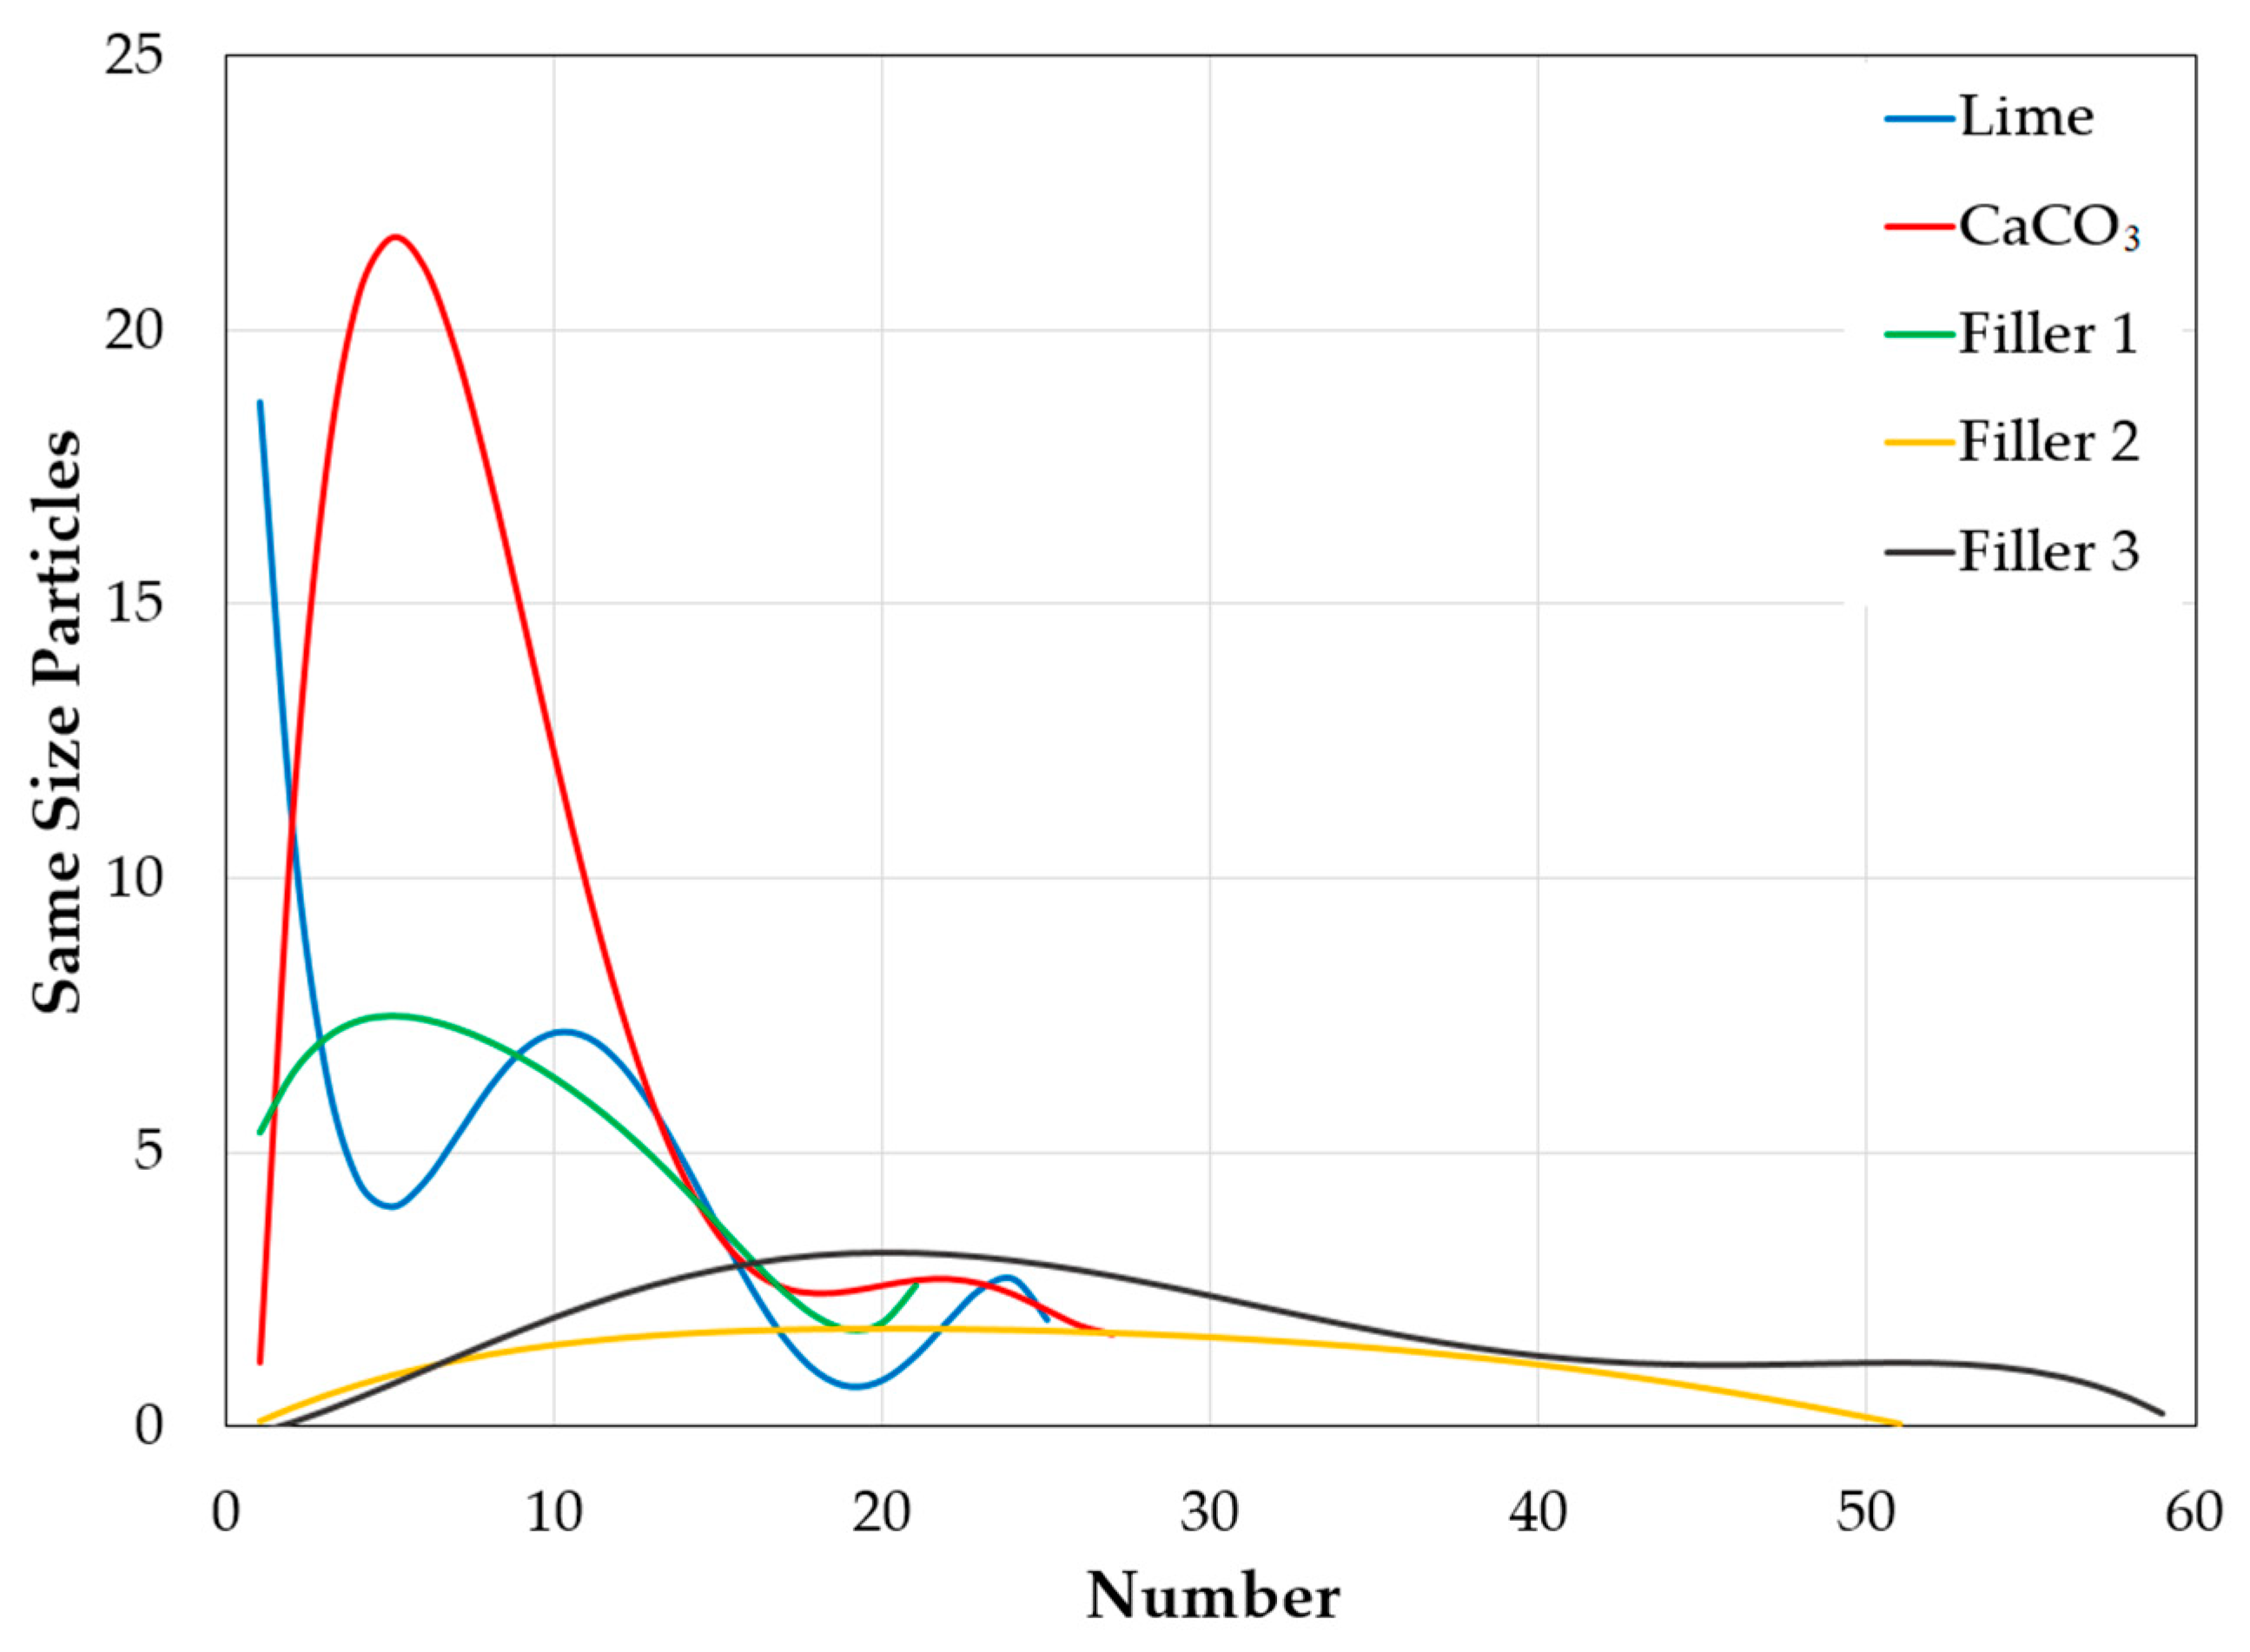
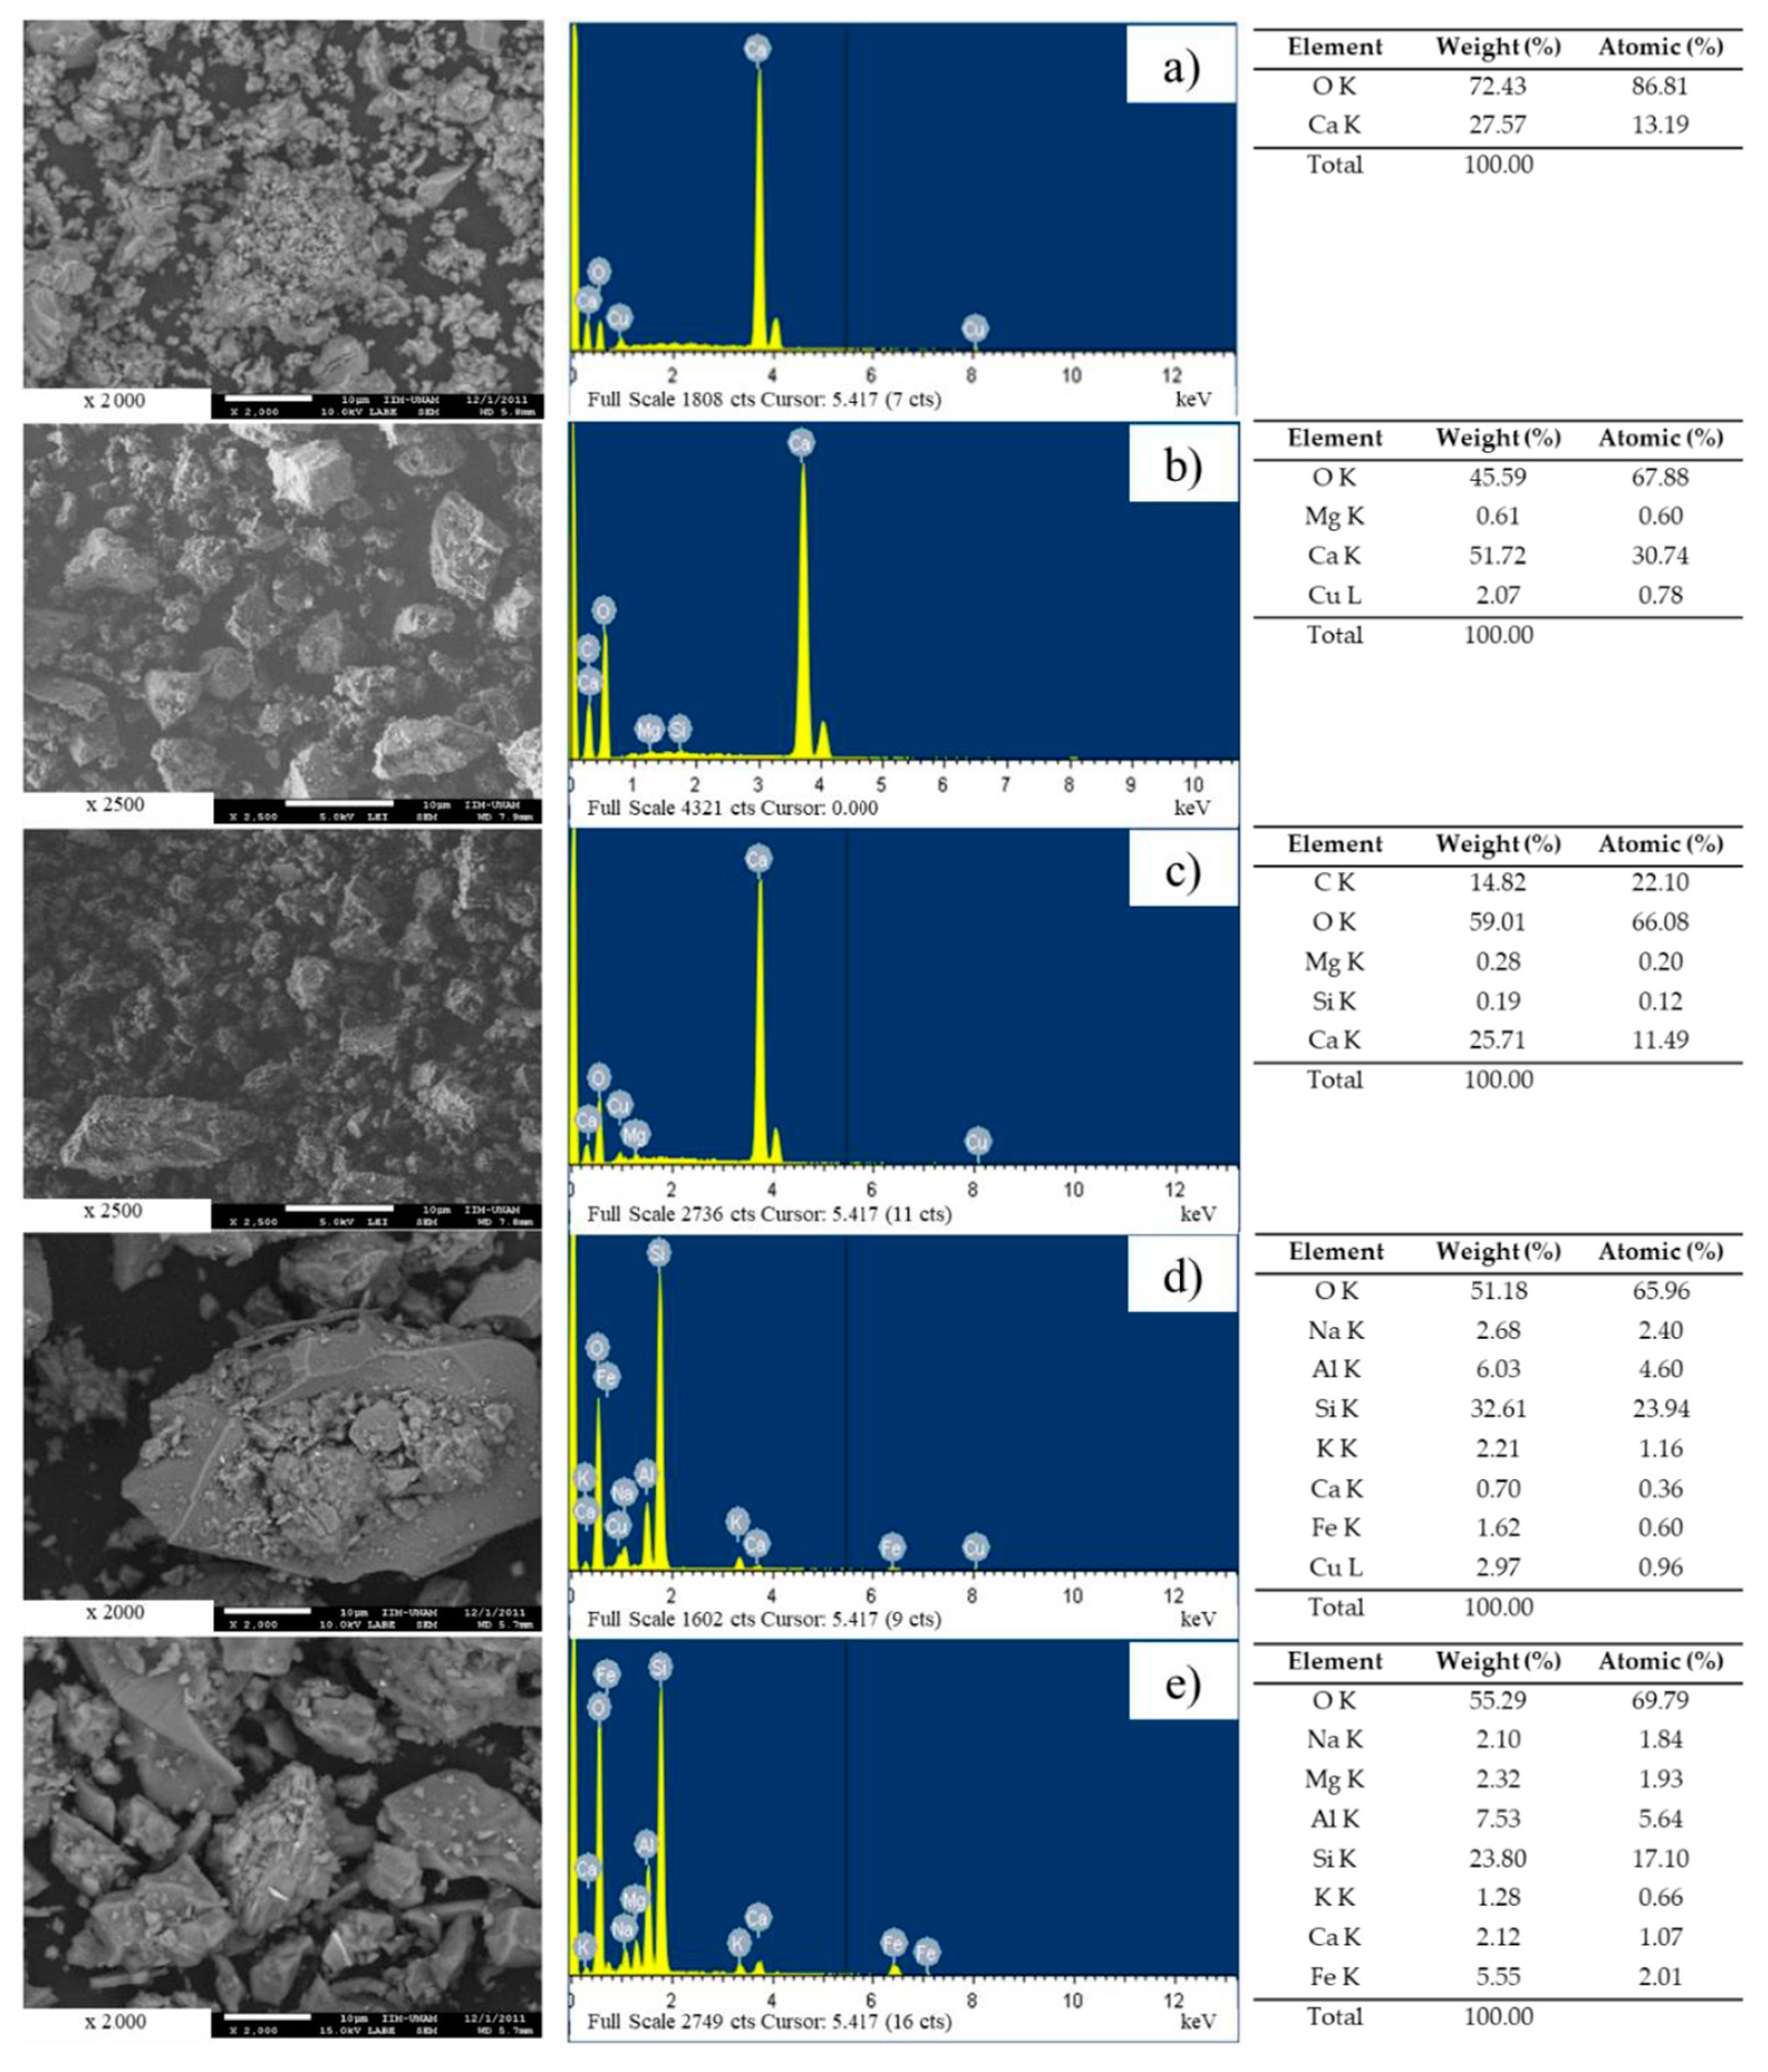
3.2. Physicochemical Properties of Fillers
- Absorption of methylene blue (TC-Technologies, Puebla, Mexico): This test measures the amount of undesirable clay present in the filler; high values (>13 mg/g) are associated with laminar particles with a large specific surface that react in the presence of water, which activates its expansive potential (deleterious).
- Plasticity index (ALCON, Guadalajara, Mexico): This test assesses the plasticity properties of the clay contained in the filler, and plastic index values greater than 4 are considered unsuitable and associated with laminar-shaped particles.
- Granulometric composition (ALCON, Guadalajara, Mexico): The particle size distribution is obtained, including the percentage of colloidal materials smaller than 0.002 mm, which are considered detrimental due to their expansion potential.
- Analysis by scanning electron microscopy (JEOL USA Inc., Peabody, MA, USA): The micrographs reveal the shapes (equidimensional or laminar) and sizes of the particles; therefore, the results of methylene blue and plasticity index can be verified.
- Chemical analysis (Surfax, Zapopan, Mexico): The aim of this test is to determine the chemical elements contained in each filler.
3.3. Asphalt Binder Characteristics Used in Test SMA Mixtures
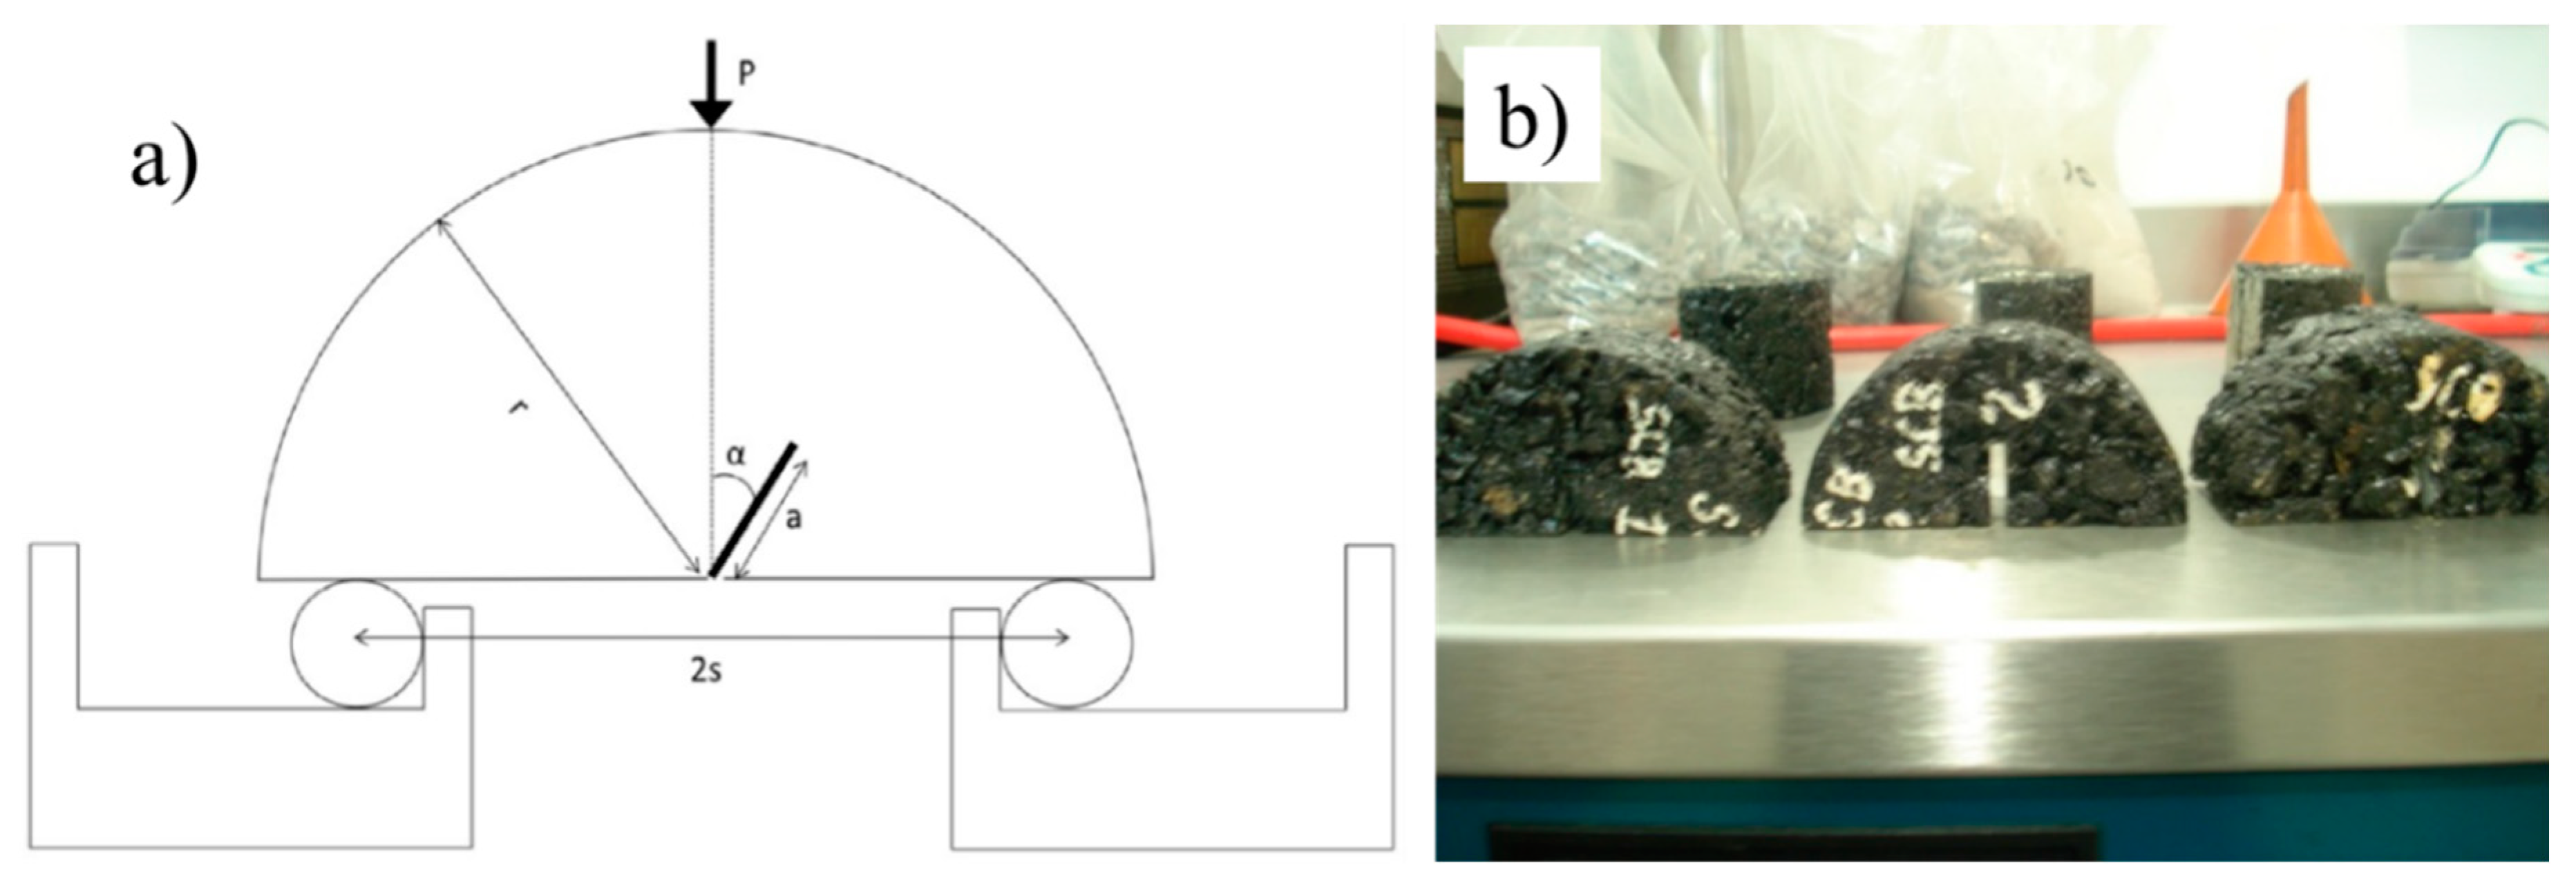
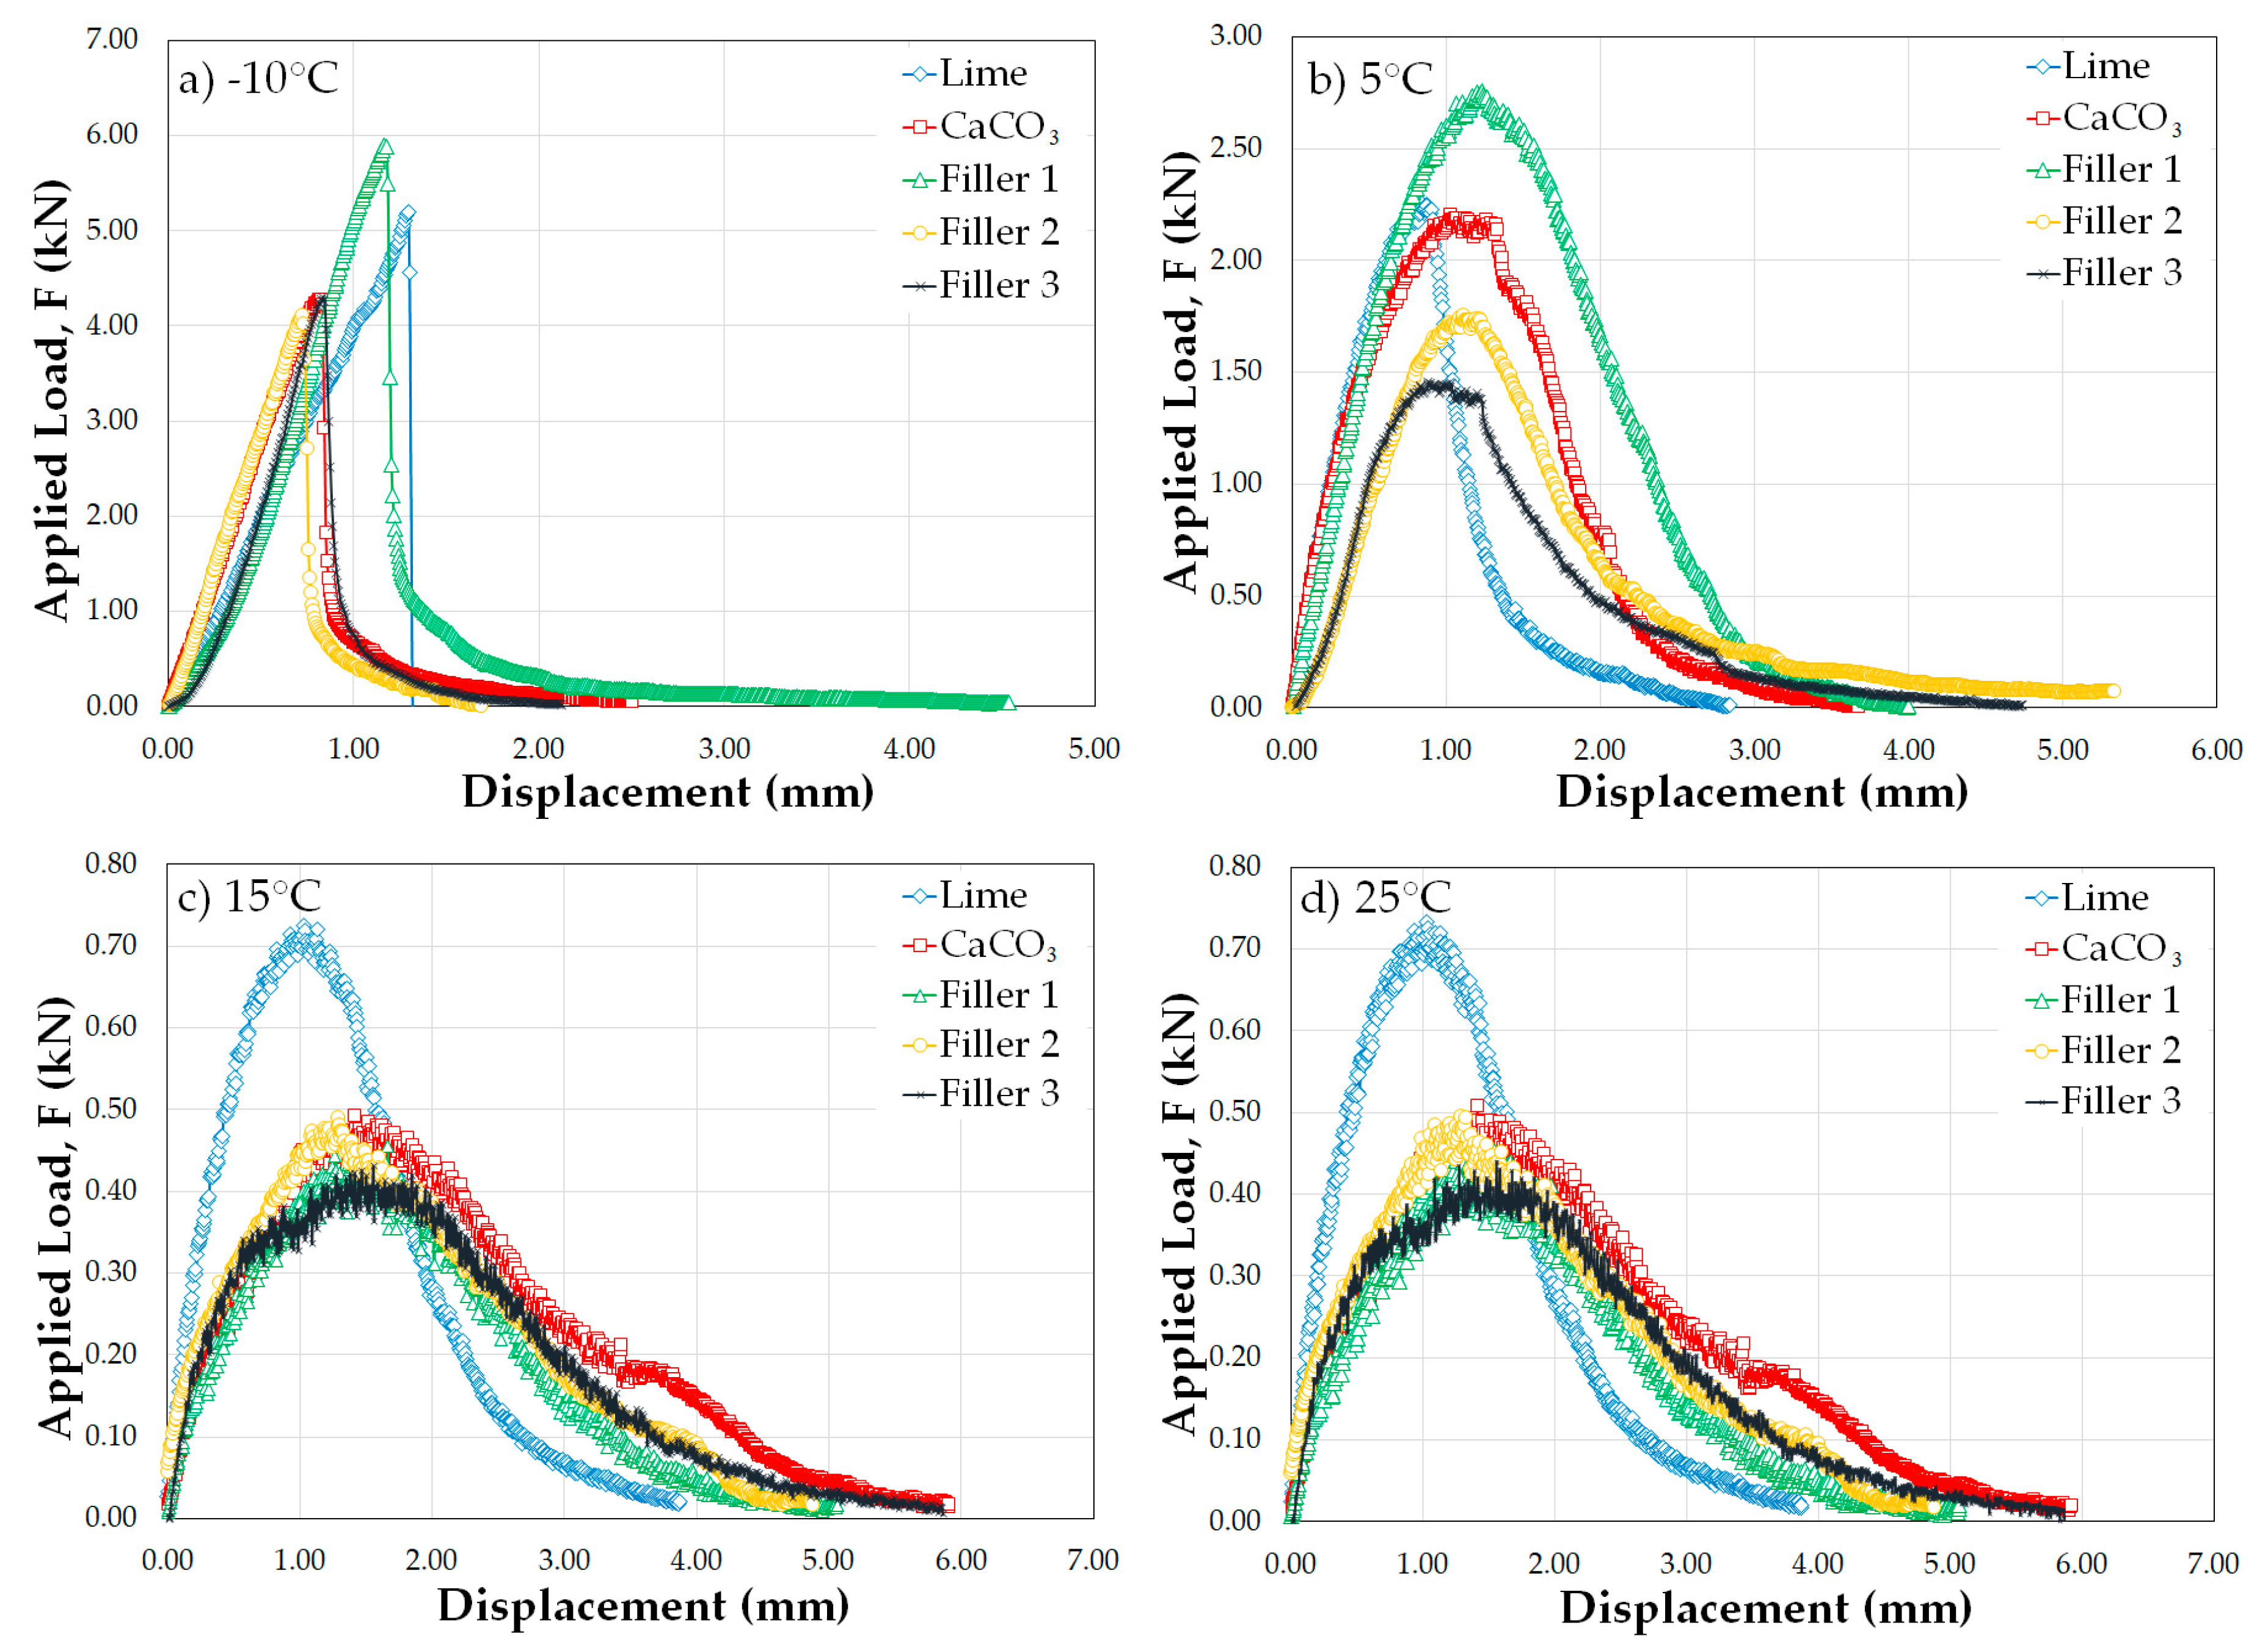
3.4. Semicircular Bend Fracture Test
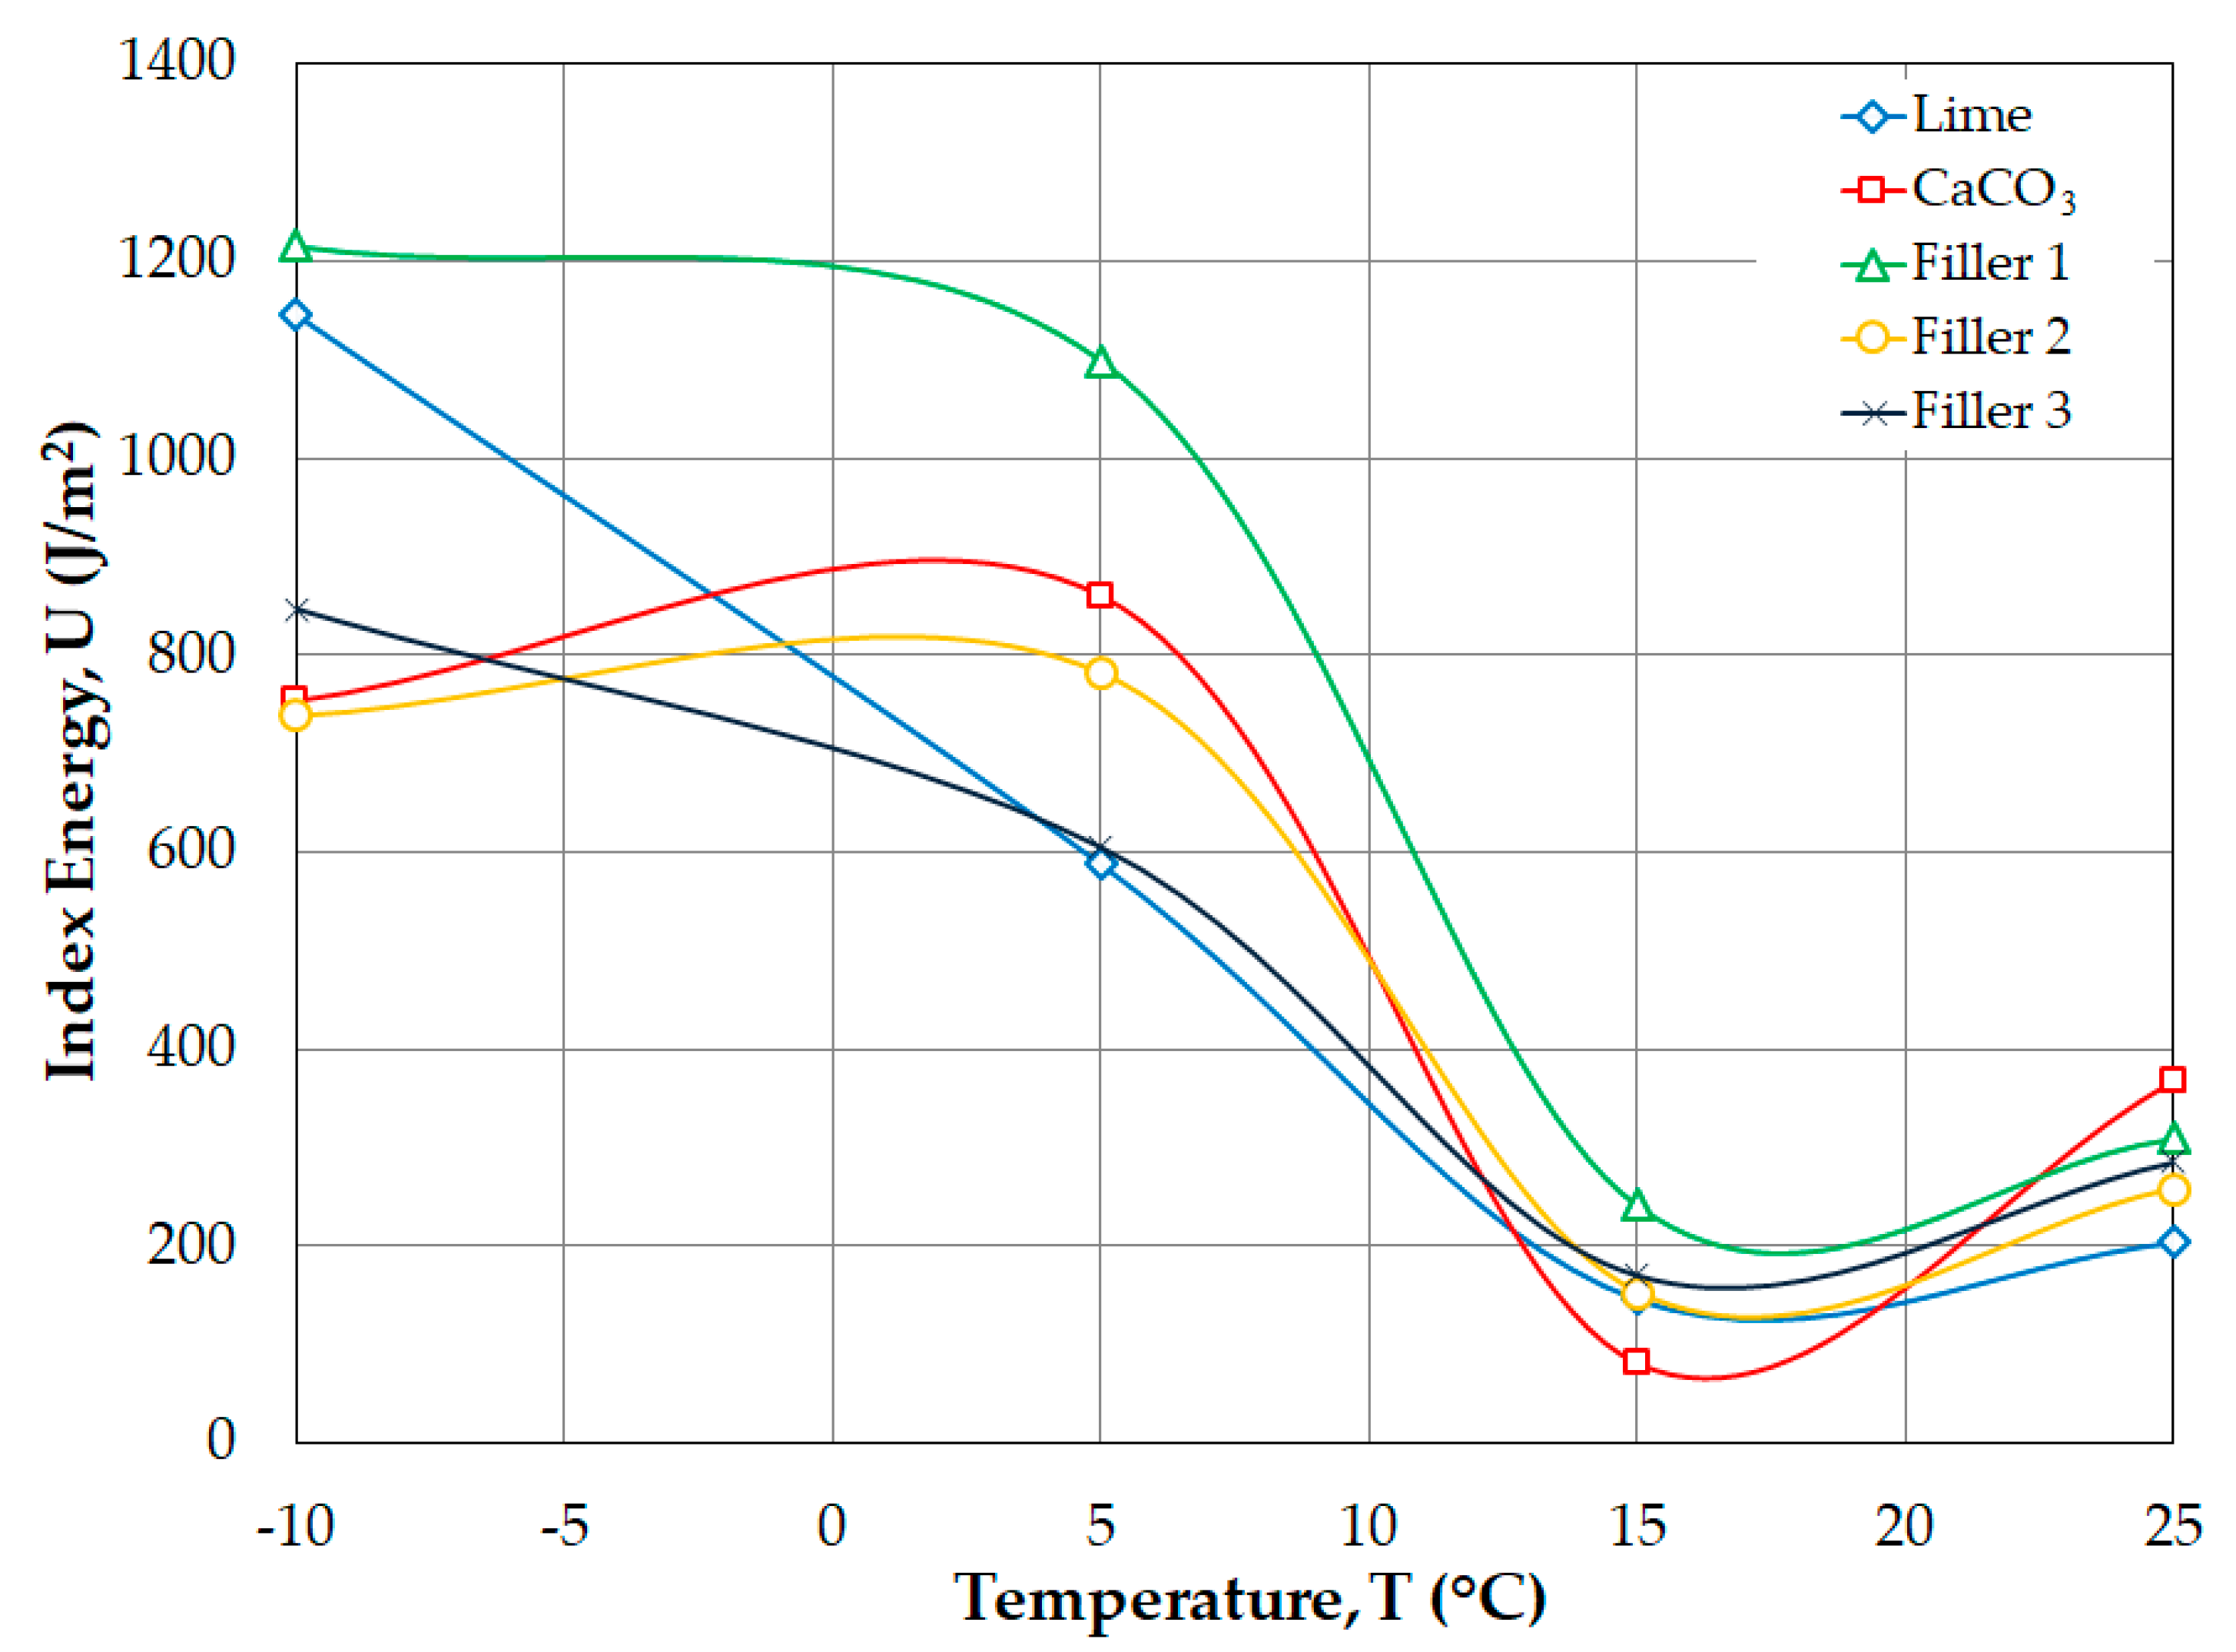
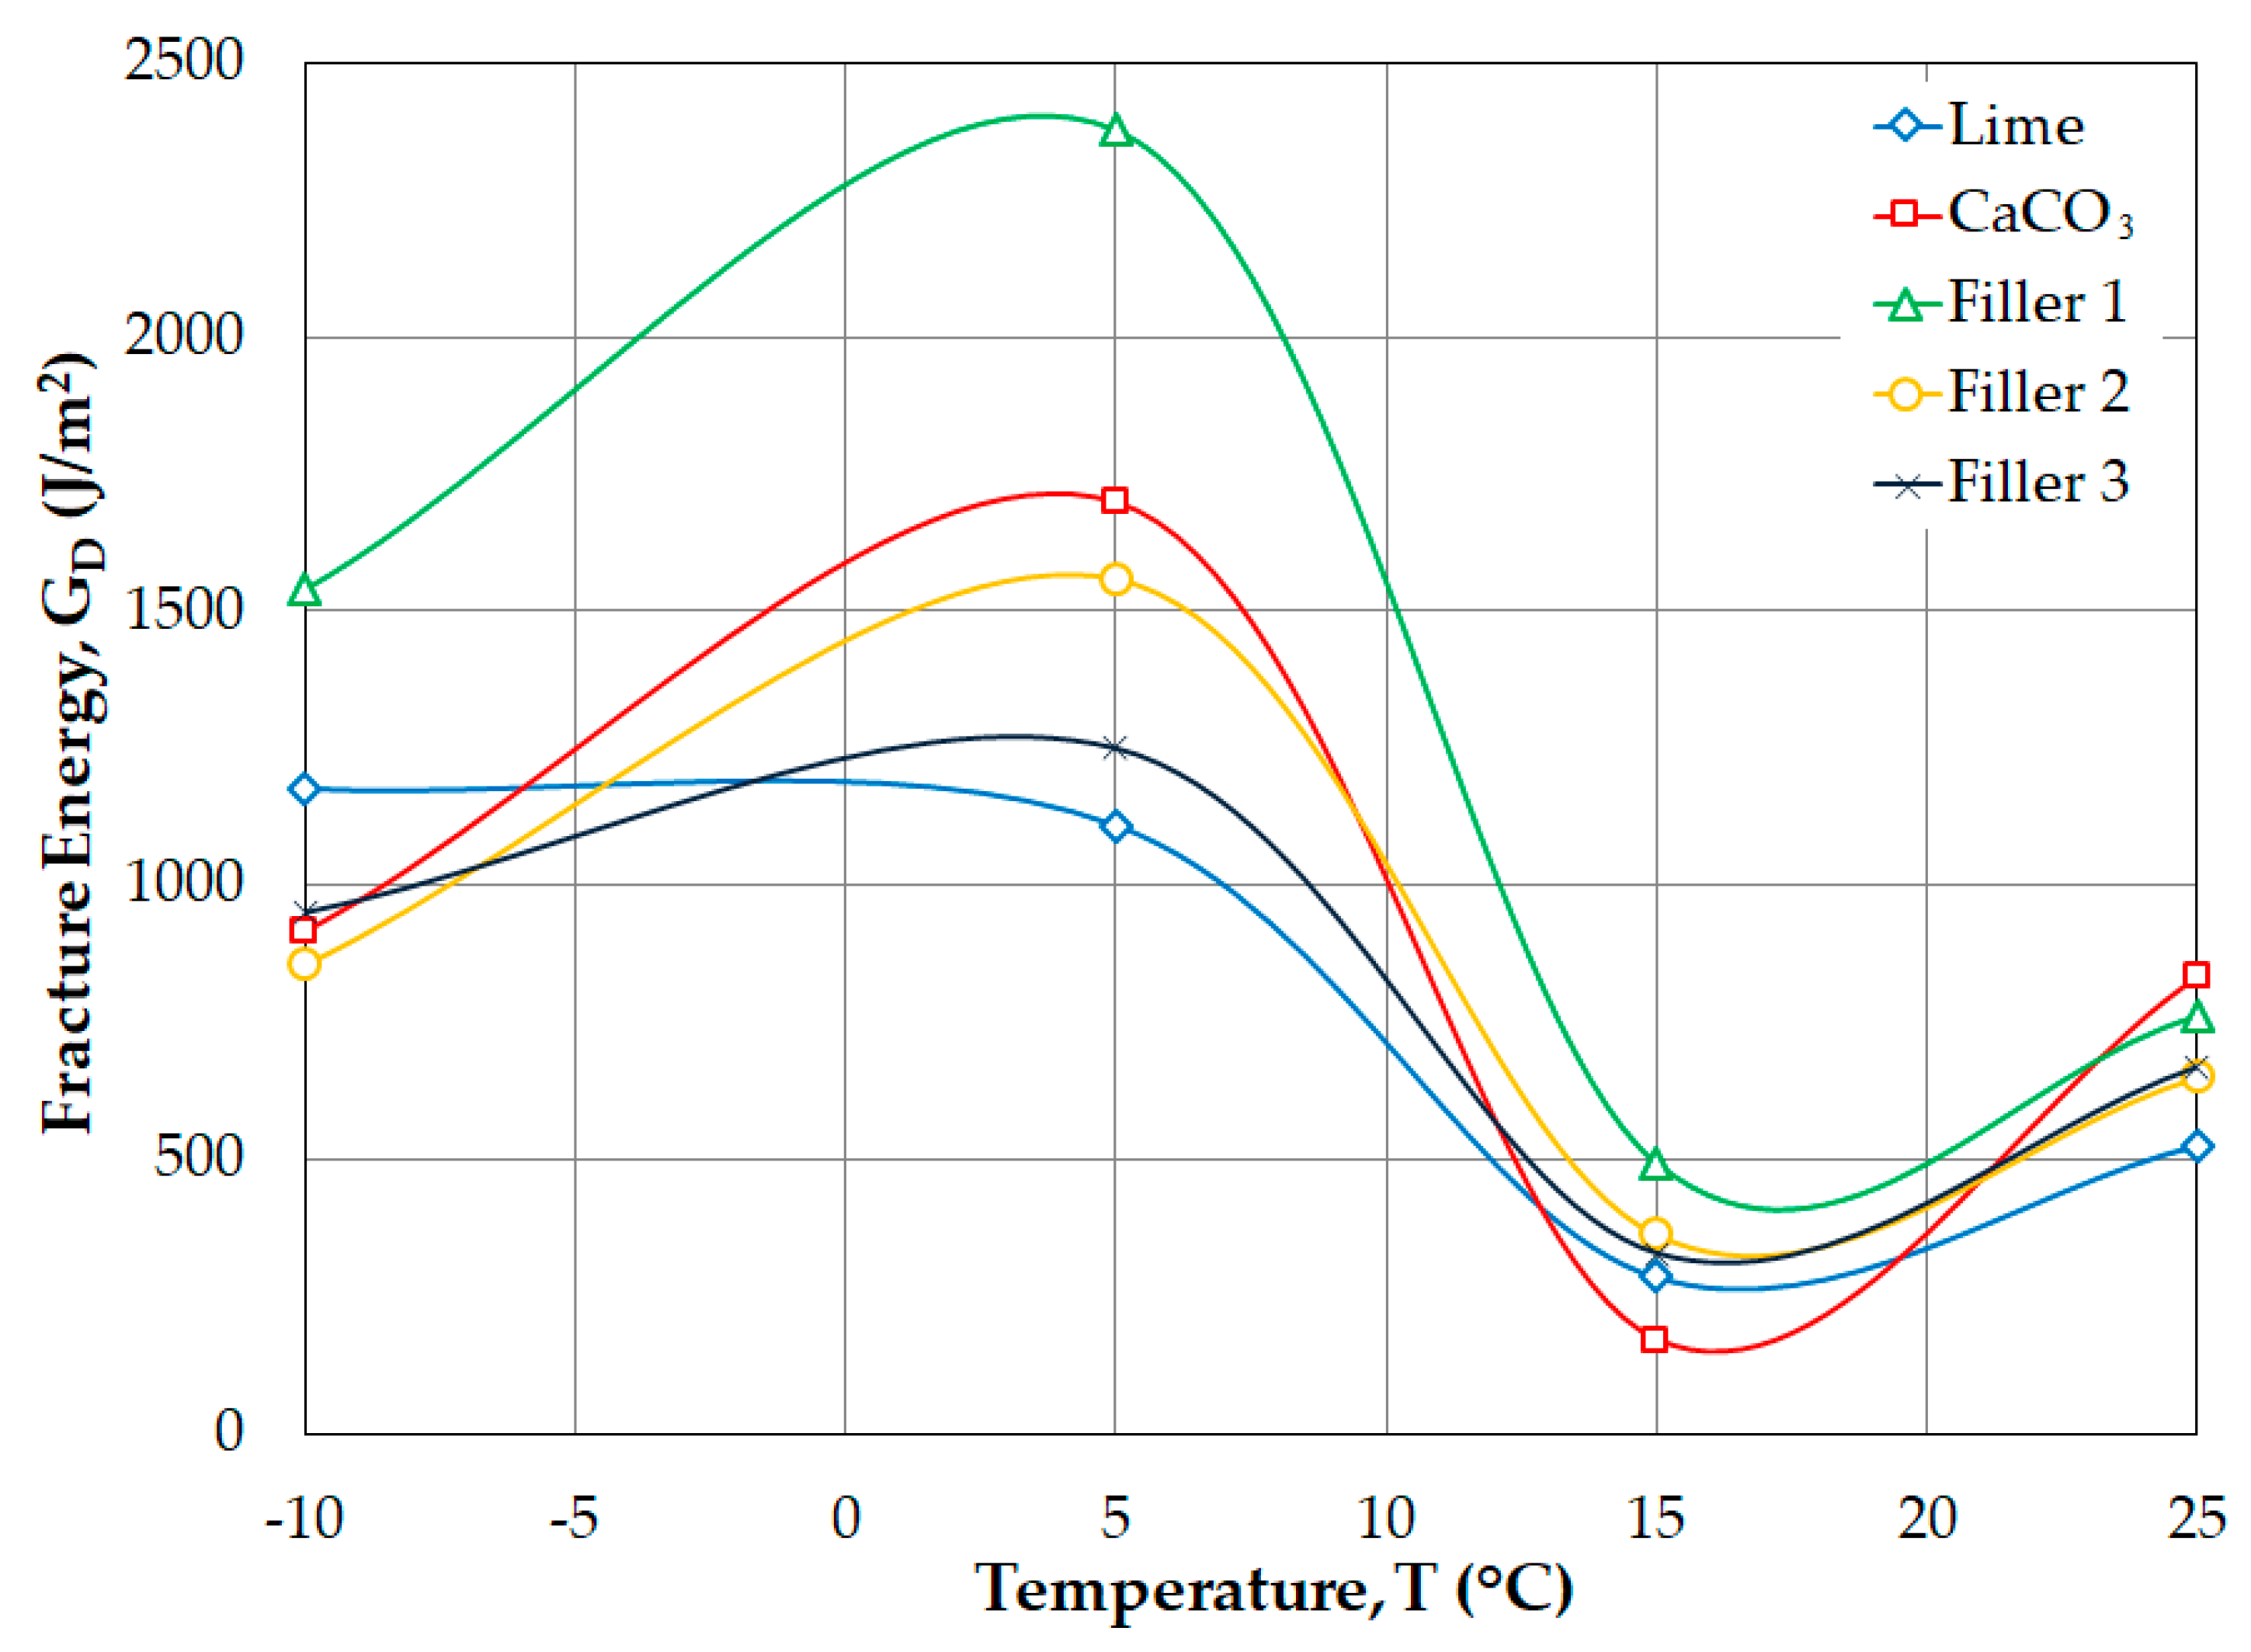
4. Results and Discussion
5. Conclusions
Author Contributions
Funding
Acknowledgments
Conflicts of Interest
References
- White, G. State of the art: Asphalt for airport pavement surfacing. Int. J. Pavement Res. Technol. 2017, 11, 79–98. [Google Scholar] [CrossRef]
- Ahmadinia, E.; Zargar, M.; Karim, M.R.; Abdelaziz, M.; Shafigh, P. Using waste plastic bottles as additive for stone mastic asphalt. Mater. Des. 2011, 32, 4844–4849. [Google Scholar] [CrossRef]
- Brown, E.; Haddock, J.E.; Mallick, R.B.; Lynn, T.A. Development of a Mixture Design Procedure for Stone Matrix Asphalt (SMA); Report; National Center for Asphalt Technology: Auburn, AL, USA, 1997. [Google Scholar]
- Shafiei, A.; Namin, M.L. Experimental investigation on the effect of hydrated lime on mechanical properties of SMA. Constr. Build. Mater. 2014, 70, 379–387. [Google Scholar] [CrossRef]
- Topini, D.; Toraldo, E.; Andena, L.; Mariani, E. Use of recycled fillers in bituminous mixtures for road pavements. Constr. Build. Mater. 2018, 159, 189–197. [Google Scholar] [CrossRef]
- Pereira, L.; Freire, A.C.; Sá da Costa, M.; Antunes, V.; Quaresma, L.; Micaelo, R. Experimental study of the effect of filler on the ductility of filler-bitumen mastics. Constr. Build. Mater. 2018, 189, 1045–1053. [Google Scholar] [CrossRef]
- Erdlen, H.; Yu, J. Stone mastic asphalt: Pavement technology for the new millennium. In Proceedings of the 10th Road Engineering Association of Asia and Australasia (REAAA) Conference, Tokyo, Japan, 4–9 September 2000. [Google Scholar]
- Hainin, R.; Reshi, W.F.; Niroumand, H. The importance of stone mastic asphalt in construction. EJGE 1995, 2150, 49–56. [Google Scholar]
- HMA Pavement Mix Type Selection Guide; Information Series 128; US Department of Transportation-Federal Highway Administration and National Asphalt Pavement (NAPA): Washington, DC, USA, 2001.
- Kandhal, P.S. Designing and Constructing SMA Mixtures: State of the Practice; National Asphalt Pavement Association: Lanham, MD, USA, 2002. [Google Scholar]
- Arabani, M.; Ferdowsi, B. Evaluating the semi-circular bending test for HMA mixtures. Int. J. Eng.-Trans. A Basics 2008, 22, 47–58. [Google Scholar]
- Nejad, F.M.; Aflaki, E.; Mohammadi, M. Fatigue behavior of SMA and HMA mixtures. Constr. Build. Mater. 2010, 24, 1158–1165. [Google Scholar] [CrossRef]
- Mamlouk, M.; Mobasher, B. Cracking resistance of asphalt rubber mix versus hot-mix asphalt. Road Mater. Pavement Des. 2004, 5, 435–451. [Google Scholar] [CrossRef]
- Portillo, O.; Cebon, D. Fracture of Bitumen and Bituminous Mixes. In Proceedings of the Oatley Seminar, Cambridge University Engineering Department, Cambridge, UK, 21 November 2018. [Google Scholar]
- Vidal, G.V. Evaluación del Proceso de Fisuración en las Mezclas Bituminosas Mediante el Desarrollo de un nuevo Ensayo Experimental: Ensayo Fénix; Universitat Politècnica de Catalunya: Barcelona, Spain, 2011. [Google Scholar]
- Cooley, L., Jr.; Brown, E. Potential of Using Stone Matrix Asphalt (SMA) for Thin Overlays; NCAT Report 03-01; National Center for Asphalt Technology, Auburn University: Auburn, AL, USA, 2003. [Google Scholar]
- Cooley, L.A., Jr.; Hurley, G.C. Potential of Using Stone Matrix Asphalt (SMA) in Mississippi; National Center for Asphalt Technology, Auburn University: Auburn, AL, USA, 2004. [Google Scholar]
- Vale, A.C.D.; Casagrande, M.D.T.; Soares, J.B. Behavior of natural fiber in stone matrix asphalt mixtures using two design methods. J. Mater. Civ. Eng. 2013, 26, 457–465. [Google Scholar] [CrossRef]
- Al-Qadi, I.L.; Wang, H.; Baek, J.; Leng, Z.; Doyen, M.; Gillen, S. Effects of Curing Time and Reheating on Performance of Warm Stone-Matrix Asphalt. J. Mater. Civ. Eng. 2012, 24, 1422–1428. [Google Scholar] [CrossRef]
- Li, X.; Marasteanu, M. Evaluation of the low temperature fracture resistance of asphalt mixtures using the semi circular bend test (with discussion). J. Assoc. Asph. Paving Technol. 2004, 73, 401–426. [Google Scholar]
- Monney, O.K.; Khalid, H.A.; Artamendi, I. Assessment of fracture properties of emulsified asphalt mixtures. Road Mater. Pavement Des. 2007, 8, 87–102. [Google Scholar] [CrossRef]
- Wu, Z.; Mohammad, L.N.; Wang, L.; Mull, M.A. Fracture resistance characterization of superpave mixtures using the semi-circular bending test. J. ASTM Int. 2005, 2, 1–15. [Google Scholar] [CrossRef]
- Medani, T.; Molenaar, A. Estimation of fatique characteristics of asphaltic mixes using simple tests. Heron-Engl. Ed. 2000, 45, 155–166. [Google Scholar]
- Kuruppu, M.D.; Obara, Y.; Ayatollahi, M.R.; Chong, K.P.; Funatsu, T. ISRM-suggested method for determining the mode I static fracture toughness using semi-circular bend specimen. Rock Mech. Rock Eng. 2014, 47, 267–274. [Google Scholar] [CrossRef]
- Kim, H.; Buttlar, W.G. Discrete fracture modeling of asphalt concrete. Int. J. Solids Struct. 2009, 46, 2593–2604. [Google Scholar] [CrossRef]
- Loizos, A.; Partl, M.N.; Scarpas, T.; Al-Qadi, I.L. Modeling of top-down cracking (TDC) propagation in asphalt concrete pavements using fracture mechanics theory. Adv. Test. Charact. Bitum. Mater. II 2009, 713–724. [Google Scholar]
- Huang, L.; Cao, K.; Zeng, M. Evaluation of semicircular bending test for determining tensile strength and stiffness modulus of asphalt mixtures. J. Test. Eval. 2009, 37, 122–128. [Google Scholar]
- Kim, M.; Mohammad, L.N.; Elseifi, M.A. Characterization of fracture properties of asphalt mixtures as measured by semicircular bend test and indirect tension test. Transp. Res. Rec. 2012, 2296, 115–124. [Google Scholar] [CrossRef]
- Pszczola, M.; Szydlowski, C. Influence of Bitumen Type and Asphalt Mixture Composition on Low-Temperature Strength Properties According to Various Test Methods. Materials 2018, 11, 2118. [Google Scholar] [CrossRef]
- Ban, H.; Im, S.; Kim, Y.-R. Mixed-mode fracture characterization of fine aggregate mixtures using semicircular bend fracture test and extended finite element modeling. Constr. Build. Mater. 2015, 101, 721–729. [Google Scholar] [CrossRef]
- Asociación Mexicana del Asfalto, A.C. RECOMENDACIÓN AMAAC. In Determinación del Valor de Azul de Metileno Para Filler y Finos; Instituto Mexicano del Transporte: Ciudad de Mexico, Mexico, 2010; Volume RA 05/2010. [Google Scholar]


| Characteristic | Normative | Value Obtained | Specification PA-MA-001/2008 |
|---|---|---|---|
| Abrasion and Impact in the Los Angeles Machine, % | ASTM C131-03 | 13% | 30 max. (structural layers) |
| Percentage of Fractured Particles in Coarse Aggregate, % (2 faces or more) | ASTM D 5821 | 100% | 90 min. |
| Elongated Particles in Coarse Aggregate, % | ASTM D 4791 | 24% | 3 a 1%, 15 max. |
| Flat Particles in Coarse Aggregate, % | ASTM D 4791 | 16% | 3 a 1%, 15 max. |
| Specific Gravity of Coarse Aggregate | ASTM C127-07 | 2.72 | - |
| Absorption of Coarse Aggregate | ASTM C127-07 | 0.75% | - |
| Test | Normative | Value Obtained | Specification PA-MA-001/2008 |
|---|---|---|---|
| Equivalent Value of Fine Aggregate, % | ASTM D 2419 | 61 | 50 min. (structural layers) |
| Methylene blue, mg/g | Recommendation AMAAC RA-05/2010 | 10 | 15 max. (structural layers) |
| Specific Gravity of Fine Aggregate | ASTM C128-04 | 2.55 | - |
| Binder Analysis | Test | Result |
|---|---|---|
| Original binder | Penetration at 25 °C 100 g 5 s (1/10 mm) | 69 |
| Elastic recovery by torsion at 25 °C (%) | 5 | |
| Softening point at 5 °C/min. (°C) | 49 | |
| Performance grade, PG | 70 | |
| Cleveland flash point | >260 | |
| Brookfield viscosity at 135 °C sc4-27 12 rpm (cP) | 530 | |
| Module DSR to PG (G*/senδ) (kPa) | 1.21 | |
| Aged binder RTFO | Loss mass at 163 °C (%) | 0.57 |
| Performance grade, PG | 70 | |
| Module DSR to PG (G*/senδ) (kPa) | 2.23 | |
| Aged binder PAV | Module DSR at 34 °C (G*senδ) (kPa) | 2102 |
| Slope (m) BBR test at −6 °C | 0.312 | |
| Module stiffness BBR test at −6 °C (MPa) | 287 |
| Filler Type | AC (%) | Gmm | Gmb | Air Voids (%) | VMA (%) | VFA (%) |
|---|---|---|---|---|---|---|
| Lime | 6.5 | 2.394 | 2.298 | 4.0 | 18.2 | 78.0 |
| CaCO3 | 6.5 | 2.394 | 2.298 | 4.0 | 18.2 | 78.0 |
| Filler 1 | 6.5 | 2.393 | 2.299 | 3.9 | 18.3 | 78.6 |
| Filler 2 | 6.5 | 2.394 | 2.300 | 3.9 | 18.3 | 78.6 |
| Filler 3 | 6.5 | 2.393 | 2.299 | 3.9 | 18.3 | 78.6 |
| Filler Type | Methylene Blue Value (mg/g) | Performance Recommendation AMAAC RA-05 | Plasticity Index (%) | Early Performance | Potential of Hydrogen, pH |
|---|---|---|---|---|---|
| Lime | 1 | Excellent | No plasticity | No plasticity | 12.80 |
| CaCO3 | 3 | Excellent | No plasticity | No plasticity | 11.60 |
| Filler 1 | 4 | Excellent | No plasticity | No plasticity | 10.60 |
| Filler 2 | 17 | Problems/possible failure | 5.20 | Medium plasticity | 9.30 |
| Filler 3 | 32 | Failed | 9.40 | High plasticity | 7.50 |
| Filler Type | −10 °C | 5 °C | ||||||||||||
| ΔFmax | ΔFmax | ΔR | IRT | U | GD | IT | ΔFmax | ΔFmax | ΔR | IRT | U | GD | IT | |
| (kN) | (mm) | (mm) | (kN/mm) | (J/m2) | (J/m2) | (J/m2) | (kN) | (mm) | (mm) | (kN/mm) | (J/m2) | (J/m2) | (J/m2) | |
| Lime | 4.72 | 0.95 | 0.95 | 5.59 | 1146 | 1176 | n.a. | 2.30 | 0.83 | 2.17 | 3.93 | 588 | 1109 | 190 |
| CaCO3 | 4.27 | 0.69 | 1.35 | 7.13 | 753 | 914 | n.a. | 2.28 | 1.14 | 2.89 | 3.11 | 860 | 1699 | 487 |
| Filler 1 | 4.91 | 0.99 | 2.46 | 5.70 | 1215 | 1540 | n.a. | 2.85 | 1.28 | 3.46 | 2.95 | 1099 | 2379 | 979 |
| Filler 2 | 4.44 | 0.74 | 0.94 | 6.13 | 738 | 855 | n.a. | 2.39 | 1.06 | 2.66 | 3.20 | 782 | 1559 | 344 |
| Filler 3 | 4.63 | 0.85 | 0.78 | 5.97 | 847 | 949 | n.a. | 1.83 | 1.04 | 2.61 | 3.06 | 605 | 1249 | 403 |
| Filler Type | 15 °C | 25 °C | ||||||||||||
| ΔFmax | ΔFmax | ΔR | IRT | U | GD | IT | ΔFmax | ΔFmax | ΔR | IRT | U | GD | IT | |
| (kN) | (mm) | (mm) | (kN/mm) | (J/m2) | (J/m2) | (J/m2) | (kN) | (mm) | (mm) | (kN/mm) | (J/m2) | (J/m2) | (J/m2) | |
| Lime | 0.74 | 0.58 | 1.18 | 2.33 | 146 | 286 | 56 | 0.76 | 0.87 | 2.40 | 1.43 | 204 | 526 | 159 |
| CaCO3 | 0.31 | 0.78 | 1.49 | 1.55 | 81 | 170 | 58 | 0.62 | 1.80 | 4.37 | 0.48 | 367 | 832 | 305 |
| Filler 1 | 0.66 | 1.05 | 2.37 | 1.65 | 241 | 494 | 182 | 0.60 | 1.63 | 3.91 | 0.64 | 309 | 762 | 484 |
| Filler 2 | 0.62 | 0.71 | 1.76 | 2.16 | 153 | 363 | 130 | 0.60 | 1.25 | 3.17 | 0.74 | 258 | 650 | 287 |
| Filler 3 | 0.58 | 0.85 | 1.69 | 1.63 | 170 | 328 | 87 | 0.60 | 1.67 | 3.81 | 0.60 | 285 | 668 | 323 |
© 2019 by the authors. Licensee MDPI, Basel, Switzerland. This article is an open access article distributed under the terms and conditions of the Creative Commons Attribution (CC BY) license (http://creativecommons.org/licenses/by/4.0/).
Share and Cite
Limón-Covarrubias, P.; Avalos Cueva, D.; Valdés Vidal, G.; Reyes Ortiz, O.J.; Adame Hernández, R.O.; Galaviz González, J.R. Analysis of the Behavior of SMA Mixtures with Different Fillers Through the Semicircular Bend (SCB) Fracture Test. Materials 2019, 12, 288. https://doi.org/10.3390/ma12020288
Limón-Covarrubias P, Avalos Cueva D, Valdés Vidal G, Reyes Ortiz OJ, Adame Hernández RO, Galaviz González JR. Analysis of the Behavior of SMA Mixtures with Different Fillers Through the Semicircular Bend (SCB) Fracture Test. Materials. 2019; 12(2):288. https://doi.org/10.3390/ma12020288
Chicago/Turabian StyleLimón-Covarrubias, Pedro, David Avalos Cueva, Gonzalo Valdés Vidal, Oscar Javier Reyes Ortiz, Rey Omar Adame Hernández, and José Roberto Galaviz González. 2019. "Analysis of the Behavior of SMA Mixtures with Different Fillers Through the Semicircular Bend (SCB) Fracture Test" Materials 12, no. 2: 288. https://doi.org/10.3390/ma12020288
APA StyleLimón-Covarrubias, P., Avalos Cueva, D., Valdés Vidal, G., Reyes Ortiz, O. J., Adame Hernández, R. O., & Galaviz González, J. R. (2019). Analysis of the Behavior of SMA Mixtures with Different Fillers Through the Semicircular Bend (SCB) Fracture Test. Materials, 12(2), 288. https://doi.org/10.3390/ma12020288