Article

Preparation and Characterization of Nanoporous Activated Carbon Derived from Prawn Shell and Its Application for Removal of Heavy Metal Ions

1
College of Food and Medical, Zhejiang Ocean University, Zhoushan 316022, China
2
Institute of Innovation & Application, Zhejiang Ocean University, Zhoushan 316022, China
3
College of Petrochemical and Energy Engineering, Zhejiang Ocean University, Zhoushan 316022, China
*
Authors to whom correspondence should be addressed.
Materials 2019, 12(2), 241; https://doi.org/10.3390/ma12020241
Submission received: 18 December 2018 / Revised: 6 January 2019 / Accepted: 7 January 2019 / Published: 12 January 2019
(This article belongs to the Collection Advanced Biomass-Derived Carbon Materials)

Abstract

:
The aim of this study was to optimize the adsorption performance of activated carbon (AC), derived from the shell of Penaeus vannamei prawns, on heavy metal ions. Inexpensive, non-toxic, and renewable prawn shells were subjected to carbonization and, subsequently, KOH-activation to produce nanoporous K-Ac. Carbonized prawn shells (CPS) and nanoporous KOH-activated carbon (K-Ac) from prawn shells were prepared and characterized by FTIR, XRD, BET, SEM, and TEM. The results showed that as-produced K-Ac samples were a porous material with microporous and mesoporous structures and had a high specific surface area of 3160 m2/g, average pore size of about 10 nm, and large pore volume of 2.38 m3/g. Furthermore, batches of K-Ac samples were employed for testing the adsorption behavior of Cd2+ in solution. The effects of pH value, initial concentration, and adsorption time on Cd2+ were systematically investigated. Kinetics and isotherm model analysis of the adsorption of Cd2+ on K-Ac showed that experimental data were not only consistent with the Langmuir adsorption isotherm, but also well-described by the quasi-first-order model. Finally, the adsorption behaviors of as-prepared K-Ac were also tested in a ternary mixture of heavy metal ions Cu2+, Cr6+, and Cd2+, and the total adsorption amount of 560 mg/g was obtained.

1. Introduction

Activated carbon (AC) is a remarkable adsorbent with high specific surface area, high pore volume, and adjustable surface physical and chemical properties. It is widely used in the remediation of industrial waste water and contaminated groundwater [1,2]. Heavy metal pollution is a serious environmental problem [3,4]. Copper is one of the most widely used and most common heavy metals in industrial production activities [5,6,7,8]. Excessive exposure to Cu(II) can lead to the accumulation of Cu(II) through aquaculture organisms to the human body via food chains [9,10,11]. Cr(VI) mainly exists as anions (CrO42−, HCrO4, and Cr2O72−) in solution, and its solubility and mobility are higher than that of Cr(III) [12,13]. Furthermore, Cr(VI) is a strong carcinogenic and mutagenic agent, and its antoxicity is 100 times higher than that of Cr(III) [14]. Among heavy metals, Cd, as one of the most important persistent inorganic pollutants, can generate severe toxicity to plants, animals, and humans, even at low concentrations [15]. Thus, the removal of heavy metals from water is urgently needed. In order to enable AC to adsorb various heavy metal ions in wastewater rapidly and effectively, the internal structure and surface properties of AC can be purposefully modified and altered according to the various characteristics of the heavy metal ions to be removed and the differences between the external environment. However, the high production cost of AC is a major challenge, which has greatly hindered its practical application. In recent decades, renewable, nontoxic, and low-cost alternative bio-based materials, such as shells, agricultural residues, and other biomass [16,17,18,19] have been paid much attention. By using a very promising cost-efficient technology, researchers can turn those waste materials into carbonaceous materials, i.e., ACs. There are many studies that have been devoted to the manufacturing of high specific surface area carbon adsorbents [20,21,22,23]. Basically, two methods, i.e., physical and chemical activation, are usually employed to produce ACs [24]. It has been reported that KOH chemical activation is better than steam activation, with respect to the development of porosity, specific surface area, and total pore volume [25]. A large number of experimental studies have shown that biomass adsorbents prepared using different raw materials have good adsorption properties for various heavy metal ions. For instance, a piece of charcoal derived from coconut shell has a higher Cr adsorption capacity than that of commercial activated carbon after being oxidized with nitric acid [26]. Activated carbon with a high specific surface area of 2943 m2/g was reported and prepared from lignin of papermaking black liquor by KOH activation and used for the application of Ni(II) adsorption [27]. Banana peels were also subjected to carbonization and, subsequently, KOH-activation, and its maximum adsorption capacity for Cu2+, Ni2+, and Pb2+ was reported to follow the order: Cu2+ (14.3 mg/g) < Ni2+ (27.4 mg/g) < Pb2+ (34.5 mg/g) [28].
Prawn shell is a kind of food waste and industrial by-product in our daily life, which mainly contains chitin (polysaccharide), calcium protein, and crude fat, which can be converted to carbon material by simple pyrolysis [29]. In industrial prawn processing, approximately 20% of the gross weight of prawn is abandoned as waste. Most prawn shells are discarded, or made into fodder. Only a small portion can be used to extract chitin, and its preparation process leads to very serious environmental pollution [30,31,32]. Research on the use of prawn shell waste to prepare a new type of biomass carbon material with high specific surface area can not only solve the problem of ecological environment pollution, but also reduce production costs.
Biochar has attracted widespread attention due to its low cost, high specific surface area, good stability, and wide range of sources [33]. The adsorption capacity of biological carbon is mainly determined by its physical and chemical properties, such as elemental composition, surface chemistry, and structural characteristics, which are usually controlled by preparation conditions, including calcination temperature, inert gas flow, heating rate, and time [34]. Therefore, in the process of preparing carbon material with high specific surface areas, some modifiers are usually used to modify its structure and surface functional groups. Among many activated agents, KOH has been widely employed for preparing AC materials by many researchers, since it can result in ACs with defined micropore size distribution, high pore volume, and a very high specific surface area of up to 3000 m2/g [35,36,37]. Ru-Ling Tseng [38] produced carbonaceous adsorbents with surface areas ranging from 841 to 1221 m2/g by using corncobs at 780 °C for carbonization and, subsequently, KOH-activation.
In this study, the preparation of AC derived from prawn shells was designed by processing carbonization (CPS) and KOH activation (K-Ac). The adsorption performance of as-prepared adsorbent samples was investigated, and the adsorption efficiency of as-prepared K-Ac was carried out by using Cd2+ in aqueous solution as a model adsorbate, and the effect of pH value, initial concentration, and adsorption time on Cd2+ adsorption was systematically investigated. The data of these experiments were evaluated and simulated by various adsorption kinetics and thermodynamics. Finally, the adsorption properties of K-Ac in heavy metal ions Cu2+, Cr6+, and Cd2+ ternary systems were also studied.

2. Materials and Methods

2.1. Materials

Raw prawn shell (Penaeus vannamei) was provided by Zhoushan Evergreen Seafood Food Co., Ltd., Zhoushan, Zhejiang, China. It was washed repeatedly with deionized water to remove various impurities, and dried at 110 °C. A metal ion Cd2+ solution was prepared by using cadmium nitrate, which was purchased from China Traditional Chinese Medicine Group Chemical Reagents Co., Ltd. (Shanghai, China). Cadmium stock solution (Cd2+ mass concentration of 0.1 g/L) was prepared by dissolving 0.2744 g of cadmium nitrate in 1 L deionized water.
All work solutions were obtained by proper dilution with deionized water. Hydrochloric acid, sulfuric acid, phosphoric acid, potassium hydroxide, copper nitrate, potassium dichromate, and other chemicals used in this study were all of analytical reagent grade and purchased from Sinopharm Chemical Reagent Co., Ltd. (Shanghai, China). Deionized water was used throughout the experimental process.

2.2. Preparation of K-Ac Materials

The tubular furnace process carbonization and KOH activation method were employed for preparing K-Ac adsorbents according to the method reported previously, with some modifications [39]. Firstly, the square crucible containing 20 g of raw prawn shell was placed in a three-zone tube furnace (Guangzhou Dijiduo Instrument Co., Ltd, Guangzhou, China). Then, nitrogen was introduced at a flow rate of 100 mL/min for about 1 h, followed by a 10 °C/min heating rate. After carbonization at 800 °C for 3 h, the residue was mixed with 1 mol/L HCl for 1 h. Subsequently, the residue was filtered, washed to neutrality, and dried for 8 h at 105 °C to give the prawn shell biochar (CPS). For activation, the mass ratio of potassium hydroxide and CPS 3:1 was uniformly mixed, and ground in a mortar. The mixture was then placed in a three-temperature zone tube furnace, and activated at 800 °C for 1 h. The residue was mixed with 2 mol/L HCl for 2 h. Finally, the residue was filtered, washed to neutrality, and dried for 6 h at 105 °C to obtain the modified prawn shell biomass carbon (K-Ac). The resultant K-Ac materials were used for characterization and Cd2+ adsorption studies. The production steps are illustrated in Figure 1.

2.3. Adsorbent Characterization

Scanning Electron Microscopy (SEM, JSM-6360LV, JEOL, Japan Electronics Corporation, Beijing, China) with high resolution was employed to analyze the morphology of the adsorbent surface. A small amount of the sample with double-sided adhesive was fixed to the sample holder, and then sprayed with an ultra-thin gold film in a vacuum-coating machine. Acquired information was obtained for 100 s at 20 kV and 15 mm scan spacing. Nitrogen adsorption-desorption experiments (BET) were performed by using the Quantachrome Autosorb NOVA2200e analyzer (American Conta Instrument Co., Ltd., Shanghai, China) at 77.0 K; the specific surface area was calculated by using the BET method; the distribution of pore size was determined from the adsorption branch; and the total pore volume was determined by nitrogen adsorption at p/p0 = 0–1 to obtain nitrogen adsorption desorption isothermal curves. The elemental mapping image (EMI) was obtained by transmission electron microscopy (TEM) (JEM-2100F, Beijing Kesi Instrument Co., Ltd., Beijing, China). The DX-2700 X-ray diffractometer (XRD) (Japan Science Co., Ltd., Shanghai, China) was used to analyze the phase transition of as-prepared samples. Functional groups and the chemical bond analysis of the sample were carried out using a Fourier transform infrared spectrometer in a wave-number range of 500–4500 cm−1 by a resolution of 4 cm−1 in transmittance mode (FTIR, IR Affinity-1s, Nikon Corporation, Shanghai, China). The residual Cd2+ ion concentration after adsorption was determined by a UV-Vis Spectrophotometer (UV-1200, Shanghai Mapada Instruments, Shanghai, China) at 518 nm. The residual concentration of Cd2+, Cr6+, and Cu2+ was analyzed using an Atomic absorption spectrophotometer (TAS-990, Shanghai Mapada Instruments, Shanghai, China).

2.4. Adsorption Experiments

Batch mode adsorption experiments were conducted by agitating 50 mL 10 mg/L of Cd2+ solution and 0.25 g K-Ac in a sealed reagent bottle. All batch adsorption experiments were first oscillated for 60 min on a shaker (150 r/min) to reach the adsorption equilibrium, and then centrifuged for 5 min at 8000 r/min. The purpose of centrifugation was to separate the activated carbon from the solution, because the K-Ac is insoluble in water. After being adsorbed, it needed to be centrifugally separated from solution; the ion concentration in the solution could be measured accurately. The pH of the solutions were adjusted to the desired values, with 0.1 mol/L HCl or 0.1 mol/L NaOH solutions. Some other conditions were researched, including the effect of pH values of adsorbent solutions (pH = 1.0–7.0) using 10 mg/L of the initial Cd2+ concentration; the contact time (20–200 min) at pH 5.0 using 10 mg/L inital Cd2+ solution and took samples every 20 min; and the influence of cadmium concentration in the solution (10–400 mg/L) at pH 5.0. The Cd2+ equilibrium adsorption was calculated using the following equation:
q = ( C 0 C ) V m
where q (mg/g) is the adsorption capacity values of prawn shell-based biosorbent for Cd2+, and C0 and C (mg/L) are the liquid-phase concentrations of Cd2+ before and after the adsorptions, respectively. V (L) is the volume of the solution and m (g) is the mass of the dry adsorbent used. The experimental results are the average values from three replicated runs.
A metal ion Cu2+ solution was prepared from copper nitrate and used to study the adsorption capacities of K-Ac in heavy metal ions Cu2+, Cr6+, and Cd2+ ternary systems. Copper stock solution (Cu2+ mass concentration of 0.2 g/L) was prepared by dissolving 0.5861 g of copper nitrate in 1 L deionized water; then, 10 mL of copper stock solution was transferred to a 100 mL volumetric flask to prepare a Cu2+ standard solution (Cu2+ mass concentration of 2 μg/mL). A metal ion Cr6+ solution, applied to determine the adsorption amounts of K-Ac in heavy metal ions Cu2+, Cr6+, and Cd2+ ternary systems, was potassium dichromate. Chromium stock solution (Cr6+ mass concentration of 0.1 g/L) was prepared by dissolving 0.2829 g of potassium dichromate in 1 L deionized water, and then, 10 mL of chromium stock solution was transferred to a 1 L volumetric flask to produce a Cr6+ standard solution (Cr6+ mass concentration of 1 μg/mL).
For the ternary system, batch mode adsorption experiments were conducted by stirring 50 mL of the desired concentration of metal ion solutions of desired concentrations in sealed reagent bottles in all of the adsorption experiments. Cu2+ and Cr6+ were added as interfering ions to solutions of various Cd2+ concentrations (10–400 mg/L), and then corresponding amounts of Cu2+ and Cr6+ standards were added. 0.25 g K-Ac sample was added at pH 5.0 and the solution was first oscillated for 60 min on a shaker (150 r/min) to achieve adsorption equilibrium, and then centrifuged for 5 min at 8000 r/min.

2.5. Thermodynamics and Kinetics of K-Ac

2.5.1. Adsorption Thermodynamics

In order to study the maximum adsorption and adsorption isotherm curves of K-Ac for Cd2+, the two most common adsorption isotherms, Langmuir and Freundlich, were used to fit the adsorption process [40]. The Langmuir monolayer adsorption isotherm can be applied to the adsorption of heavy metals for a certain period of time, while the Freundlich adsorption isotherm model is often used to fit the interaction between adsorbed molecules on the surface of heterogeneous media. The Freundlich adsorption isotherm model is often used to fit the interaction between the adsorption and distribution on the surface of non-uniform medium, and can be used in various non-ideal conditions for the adsorption process and the multi molecular adsorption process. Therefore, the adsorption process can be well-described at an appropriate concentration. The expression formulas are given below:
Q e = K L Q m C e 1 + K L C e
Q e = K F C e 1 n
R L = 1 ( 1 + K L C e )
where Qe and Qm (mg/g) are the adsorption amounts when reaching equilibrium and the monolayer adsorption capacity, respectively. Ce (mg/L) is the liquid phase concentration of Cd2+ at equilibrium. KL and KF (mg/g) are the Langmuir and Freundlich equilibrium kinetic models, respectively; n (dimensionless) is a constant related to the nature and the intensity of adsorption; RL is a non-dimensional separation factor, which can predict whether the adsorption isotherm form is favorable to the adsorption process between the adsorbate and adsorbent (if RL > 1 indicates that it is not suitable for adsorption, RL = 1 means that the isotherm form is linear; 0 < RL < 1 indicates that it is suitable for adsorption; and RL = 0 is irrelevant [41]).

2.5.2. Adsorption Kinetics

In order to study the kinetics of adsorption, the experimental curve was fitted to a quasi-first-order and quasi-second-order model. The quasi-first-order kinetic model is a Lagergren first-order rate equation based on the amount of solid adsorption. The quasi-second model is based on the assumption that the adsorption rate is controlled by the chemisorption mechanism, which involves electron sharing or electron transfer between the adsorbent and adsorbate. Both models are the difference between the amount of Cd2+ adsorbed by K-Ac at t-time and the amount of adsorption at equilibrium. They are the driving force for adsorption. The adsorption rate of the quasi-first-order kinetic model [42,43,44,45] is proportional to the driving force, and the adsorption rate of the quasi-second-order kinetic model [46,47,48,49] is proportional to the square of the driving force. The expression formulas are given below:
In ( Q e Q t ) = InQ e K 1 2.303 t
t Q t = 1 K 2 Q e 2 + t Q e
where Qe and Qt (mg/g) are the adsorption amounts when reaching equilibrium and at time t, respectively. K1 (1/min) is the first-order kinetic constant. K2 (mg/(g·min)) is the second-order kinetic constant.

3. Results and Discussion

3.1. Surface Pore and Morphology Analysis

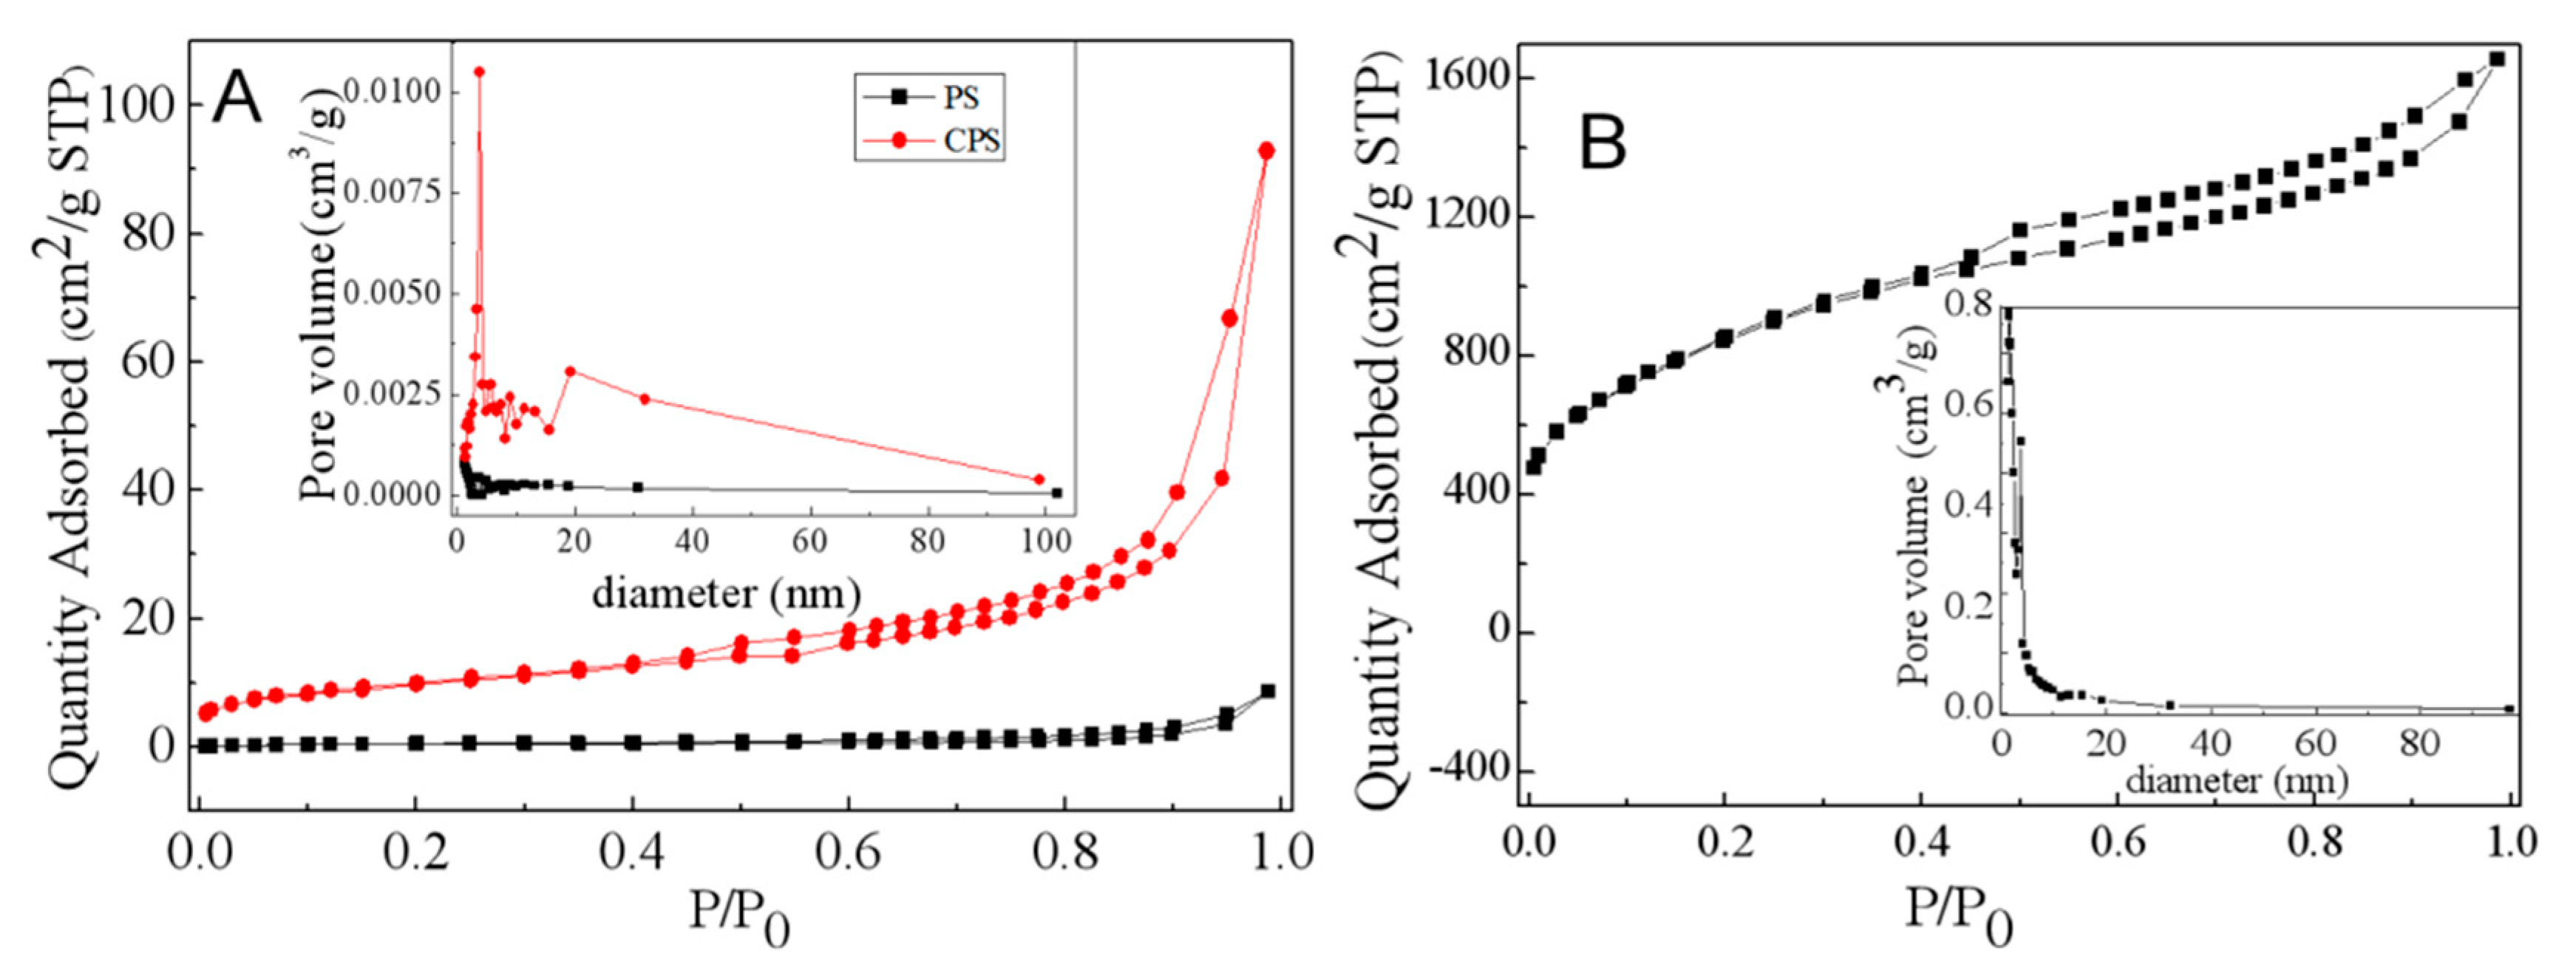
Identifying the pore structure of adsorbents is the first step before designing the adsorption processes. The pore diameter of as-prepared samples can be determined from BET measurements. These characterizations are performed for PS (prawn shell) and CPS samples in order to verify the possible modification caused by the KOH treatment. The N2 adsorption-desorption isotherms and the pore-size distribution at 77 K are presented in Figure 2. As seen in Figure 2: (i) The adsorption isotherms demonstrate a sharp rise and convex curve at low relative pressure ratios because of strong interactions on adsorbate surfaces; (ii) immediately, there is the appearance of an isotherm inflection point and a monolayer adsorption; (iii) and then, a multilayer adsorption gradually forms and saturates the vapor pressure, with the relative pressure continuing to increase. As shown in Figure 2A, PS does not have significant adsorption capacity, and it increases slowly when the relative pressure is high (P/P0 ≥ 0.9). The slow growth adsorption curve of CPS indicates that there is a certain amount of micropores, and a hysteresis loop appears as the relative pressure P/P0 > 0.4. It suggests the presence of a large number of large pores, or it may be a pseudo-pore formed by stacking [26]. According to the classification of IUPAC (International Union of Pure and Applied Chemistry), these are type II for PS and CPS, characteristic of macroporous solids. The adsorption isotherm of K-Ac exhibits an isotherm profile of type I, as shown in Figure 2B. When P/P0 is very low (P/P0 ≤ 0.1), the amount of adsorption is directly proportional to a relative pressure, indicating that K-Ac has a larger number of micropores because of this stage, filled with a nitrogen sample. When P/P0 > 0.1, the curve slowly rises, but does not reach the level state due to capillary condensation of nitrogen filled with the micropore, indicating that there is a small number of narrow mesopores or macropores. Furthermore, the condensation of nitrogen can lead to a rising curve when the relative pressure reaches the saturation pressure (P/P0 > 0.99). Figure 2 shows that at the same diameter, the volume of pores after calcination increases, indicating that a certain number of pores are generated. Most pore sizes of K-Ac are in the range of 0–10 nm, and the peak value is close to 1.5 nm, indicating that the most developed pore structure is at 1.5 nm. In addition, the BET surface area, total pore volume, and average pore diameter of isotherm data are analyzed. The results obtained from nitrogen isotherms are presented in Table 1. As indicated in Table 1, the surface area of K-Ac is 86 times greater than that of CPS, and 835 times that of PS. All the above results indicate that developing the pore structure of K-Ac results from the KOH activation. These increases in the value of specific surface area, pore volume, and average pore radius reveal that K-Ac has stronger adsorption characteristics of heavy-metal adsorption than PS and CPS. In order to facilitate the movement of adsorbates on the porous structure of adsorbents, high values of surface area, pore volume, and average pore radius are desirable [50].
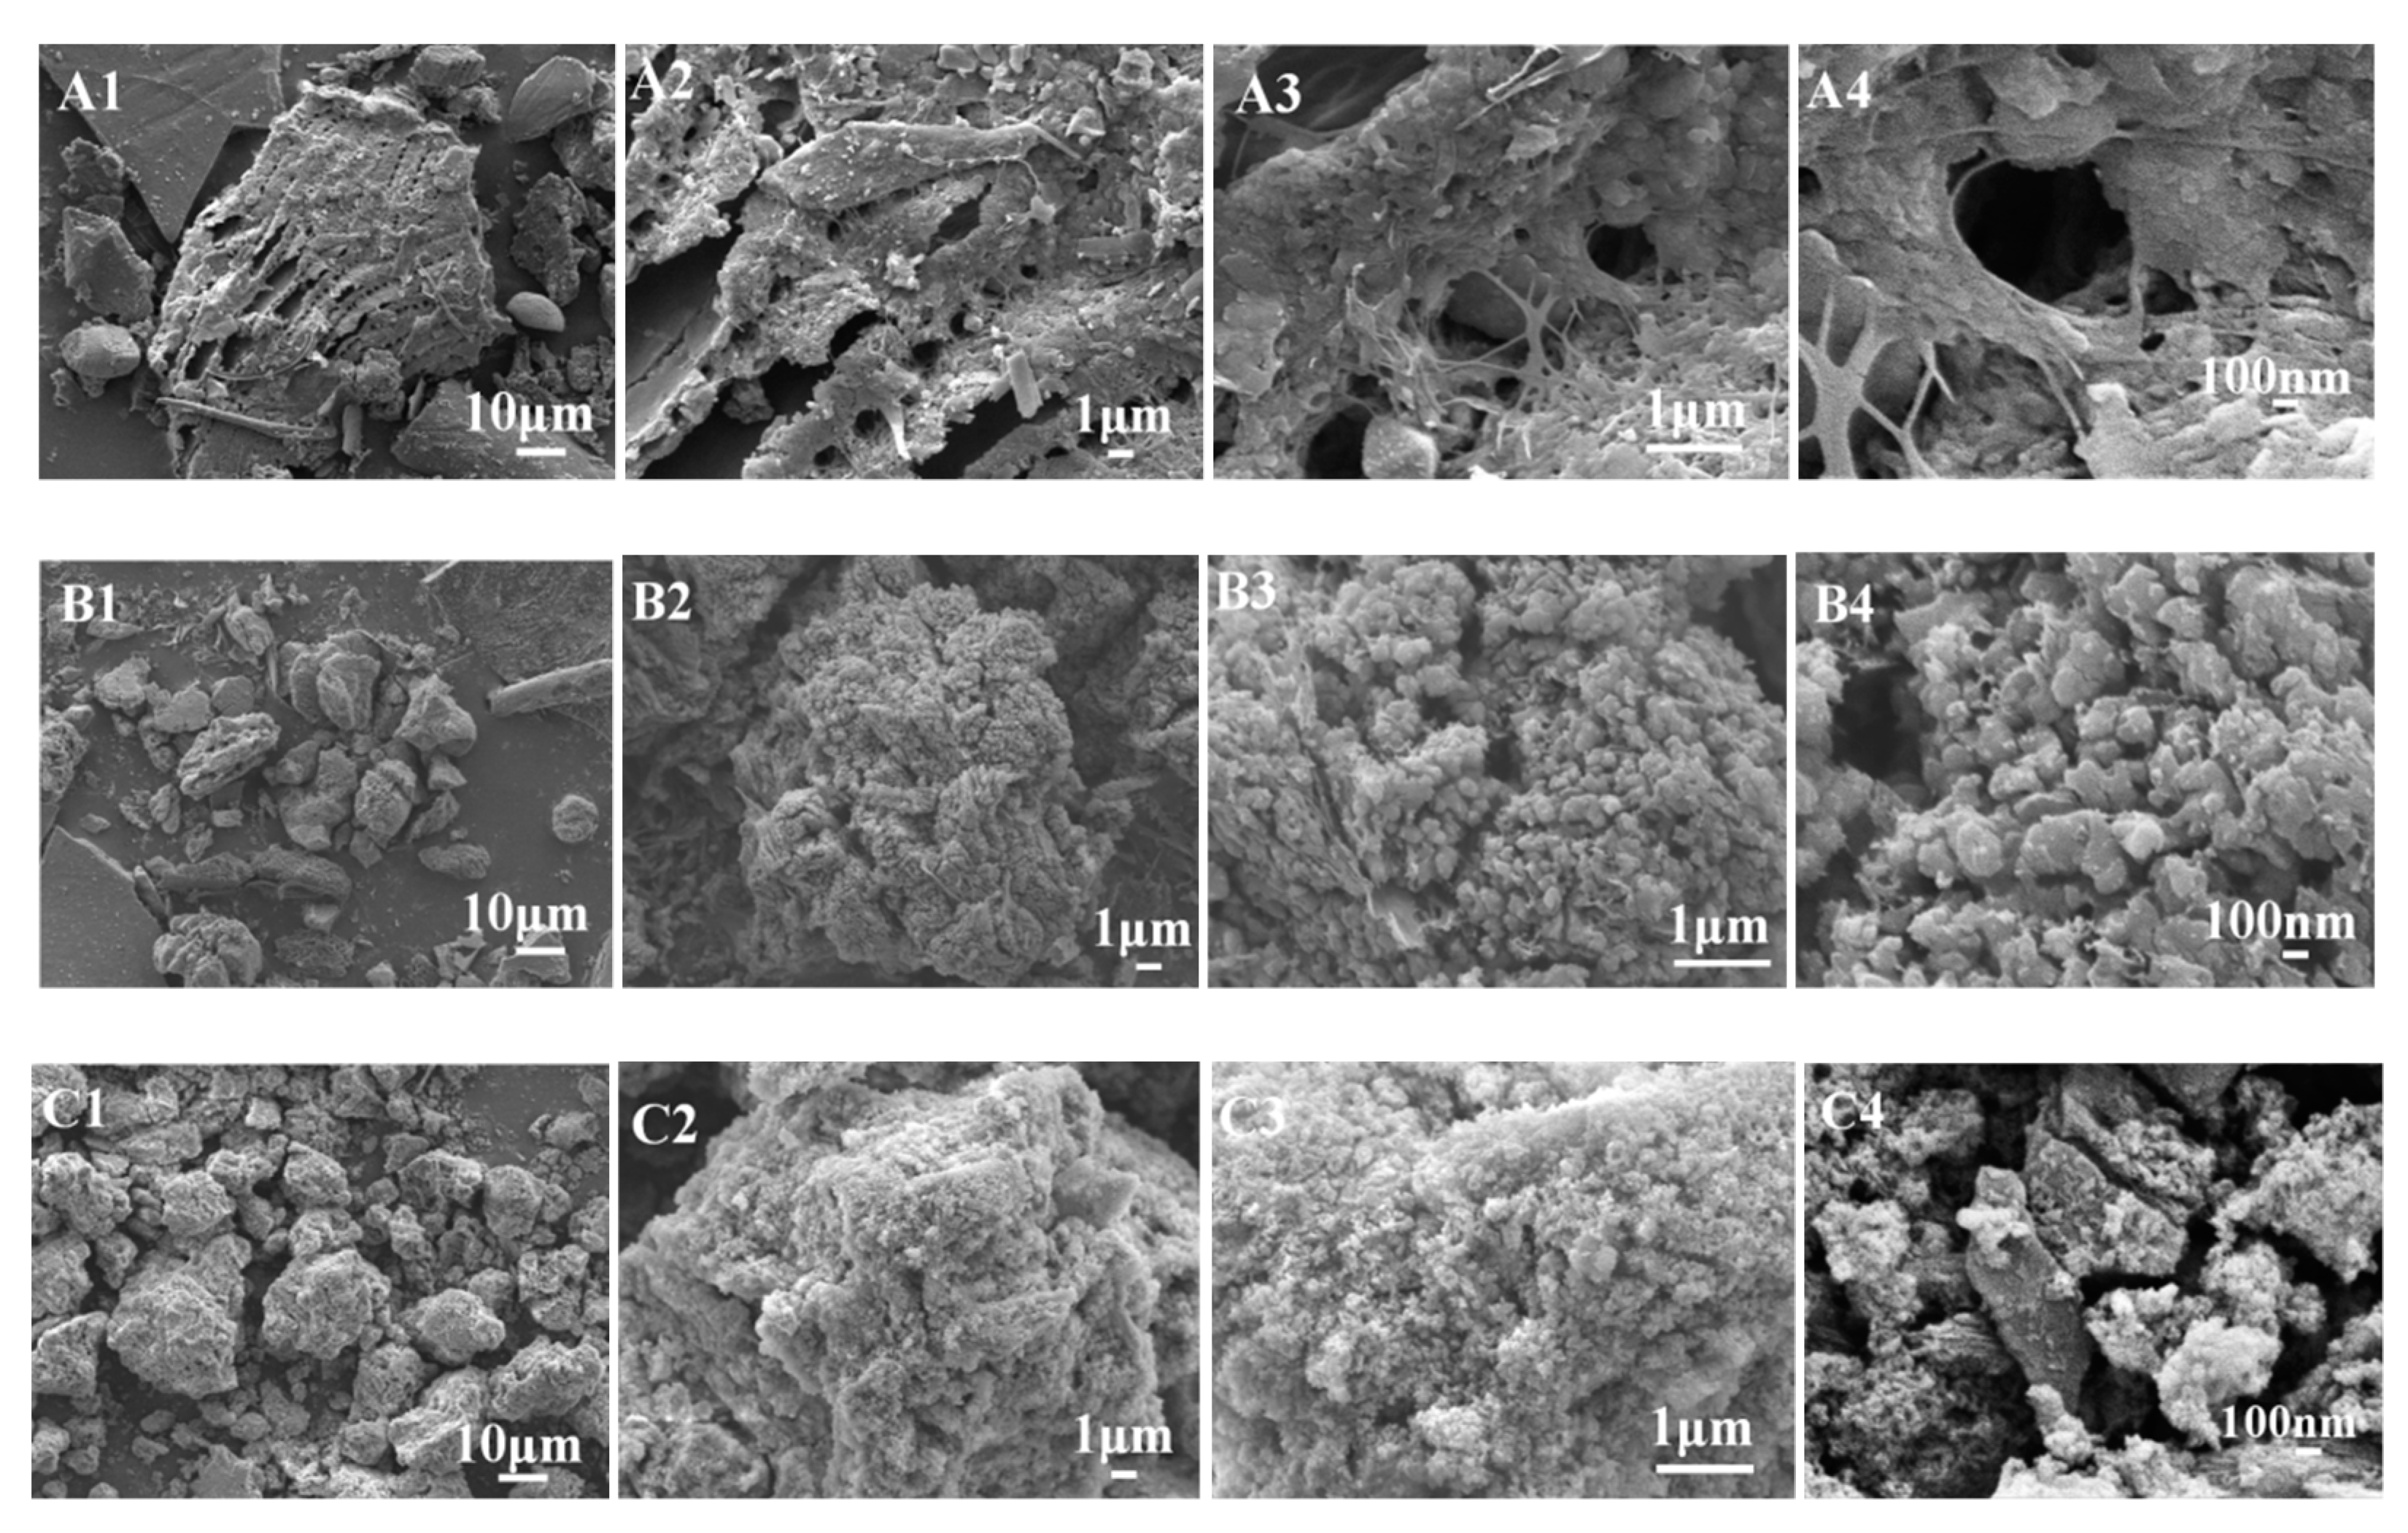
The typical SEM photographs of the as-prepared samples PS (A), CPS (B), and K-Ac (C) are shown in Figure 3. It can be seen from Figure 3A that there are some organic substances in PS which appear as a fibrous shape and may act as a binder, and other components are arranged in a layered structure. The structure of CPS is a porous microsphere-stacking structure, as illustrated in Figure 3B. In Figure 3B2, it illustrates that after a carbonization process, CPS particles appear as irregular cottony features. The distribution of pores is homogeneous, rich, and abundant, with diameters ranging from 100 to 200 nm. As can be seen from Figure 3C, the surface of K-Ac samples becomes a fluffy, porous microsphere-stacking structure, showing relatively regular pores and an increase in the number of pores, with diameters ranging from 20 to 100 nm. On the other hand, K-Ac (Figure 3C) has retained porous microspheres before activation, the crystals are significantly smaller, the nanopore structure becomes more developed, and the arrangement is more compact, which are key factors for the adsorption of the adsorbent.
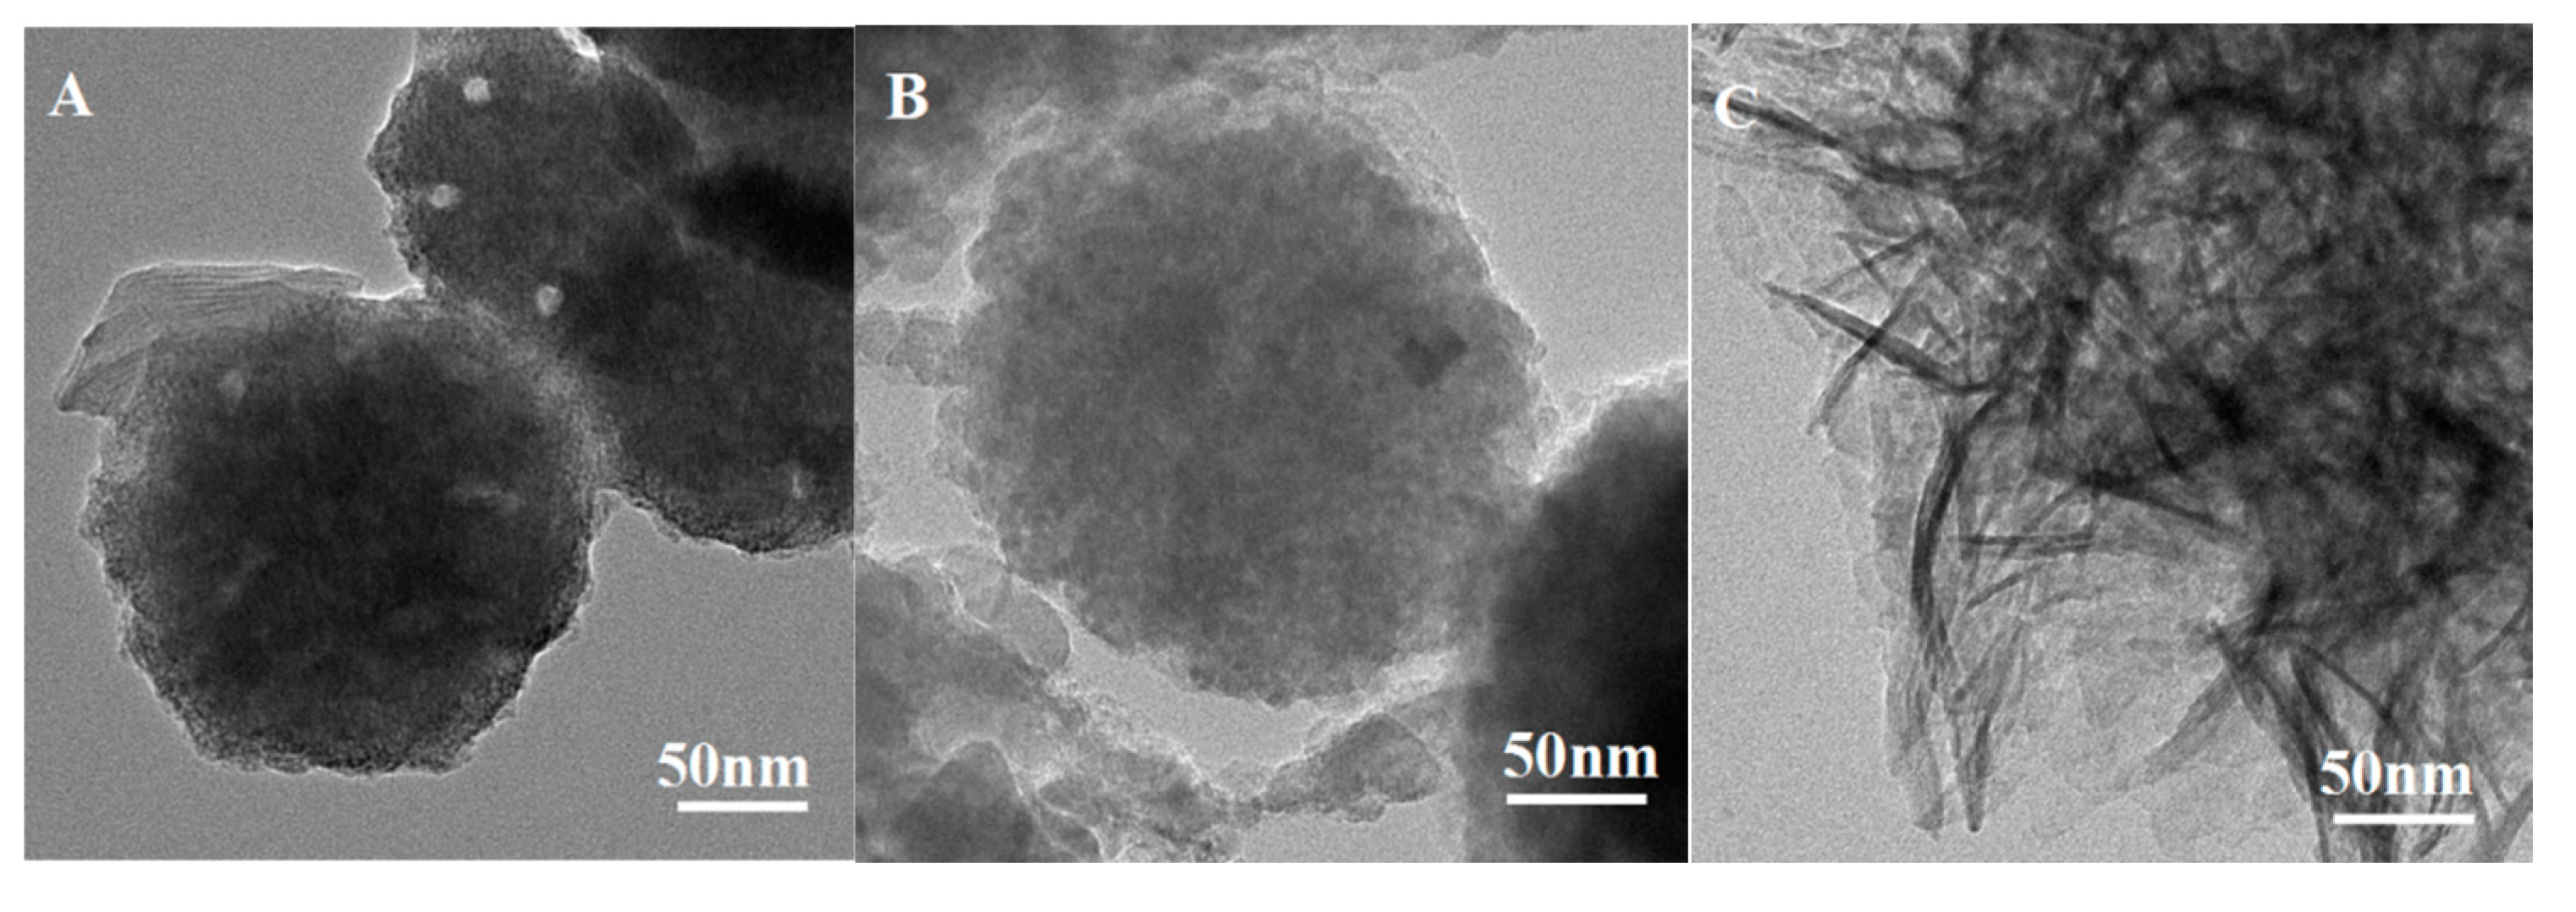
After treatment with 3 M HCl, morphologies of PS, CPS, and K-Ac could be observed by TEM, as illustrated in Figure 4. The results show that these three samples appear as a spherical shape with some sporadic distribution of pores, which is in accordance with the results of SEM. As shown in Figure 4A, the number of holes on the surface of PS is relatively small, the agglomeration of holes is not very obvious, and the aperture or pore size is relatively large. As illustrated in Figure 4B, the distribution of pores is homogeneous and abundant. As indicated by the BET results, the average pore size of CPS is 3.83 nm. As exhibited in Figure 4C, K-Ac shows a relatively regular aperture and an increase in the number of pores, with a more compact arrangement to render nanoporosity, and high specific surface areas. This is probably due to the interior etching process of KOH activation [51]. It has been indicated that KOH might promote the development of new micropores induced by KOH activation [28].

3.2. XRD Crystalline and FTIR Phase Analysis

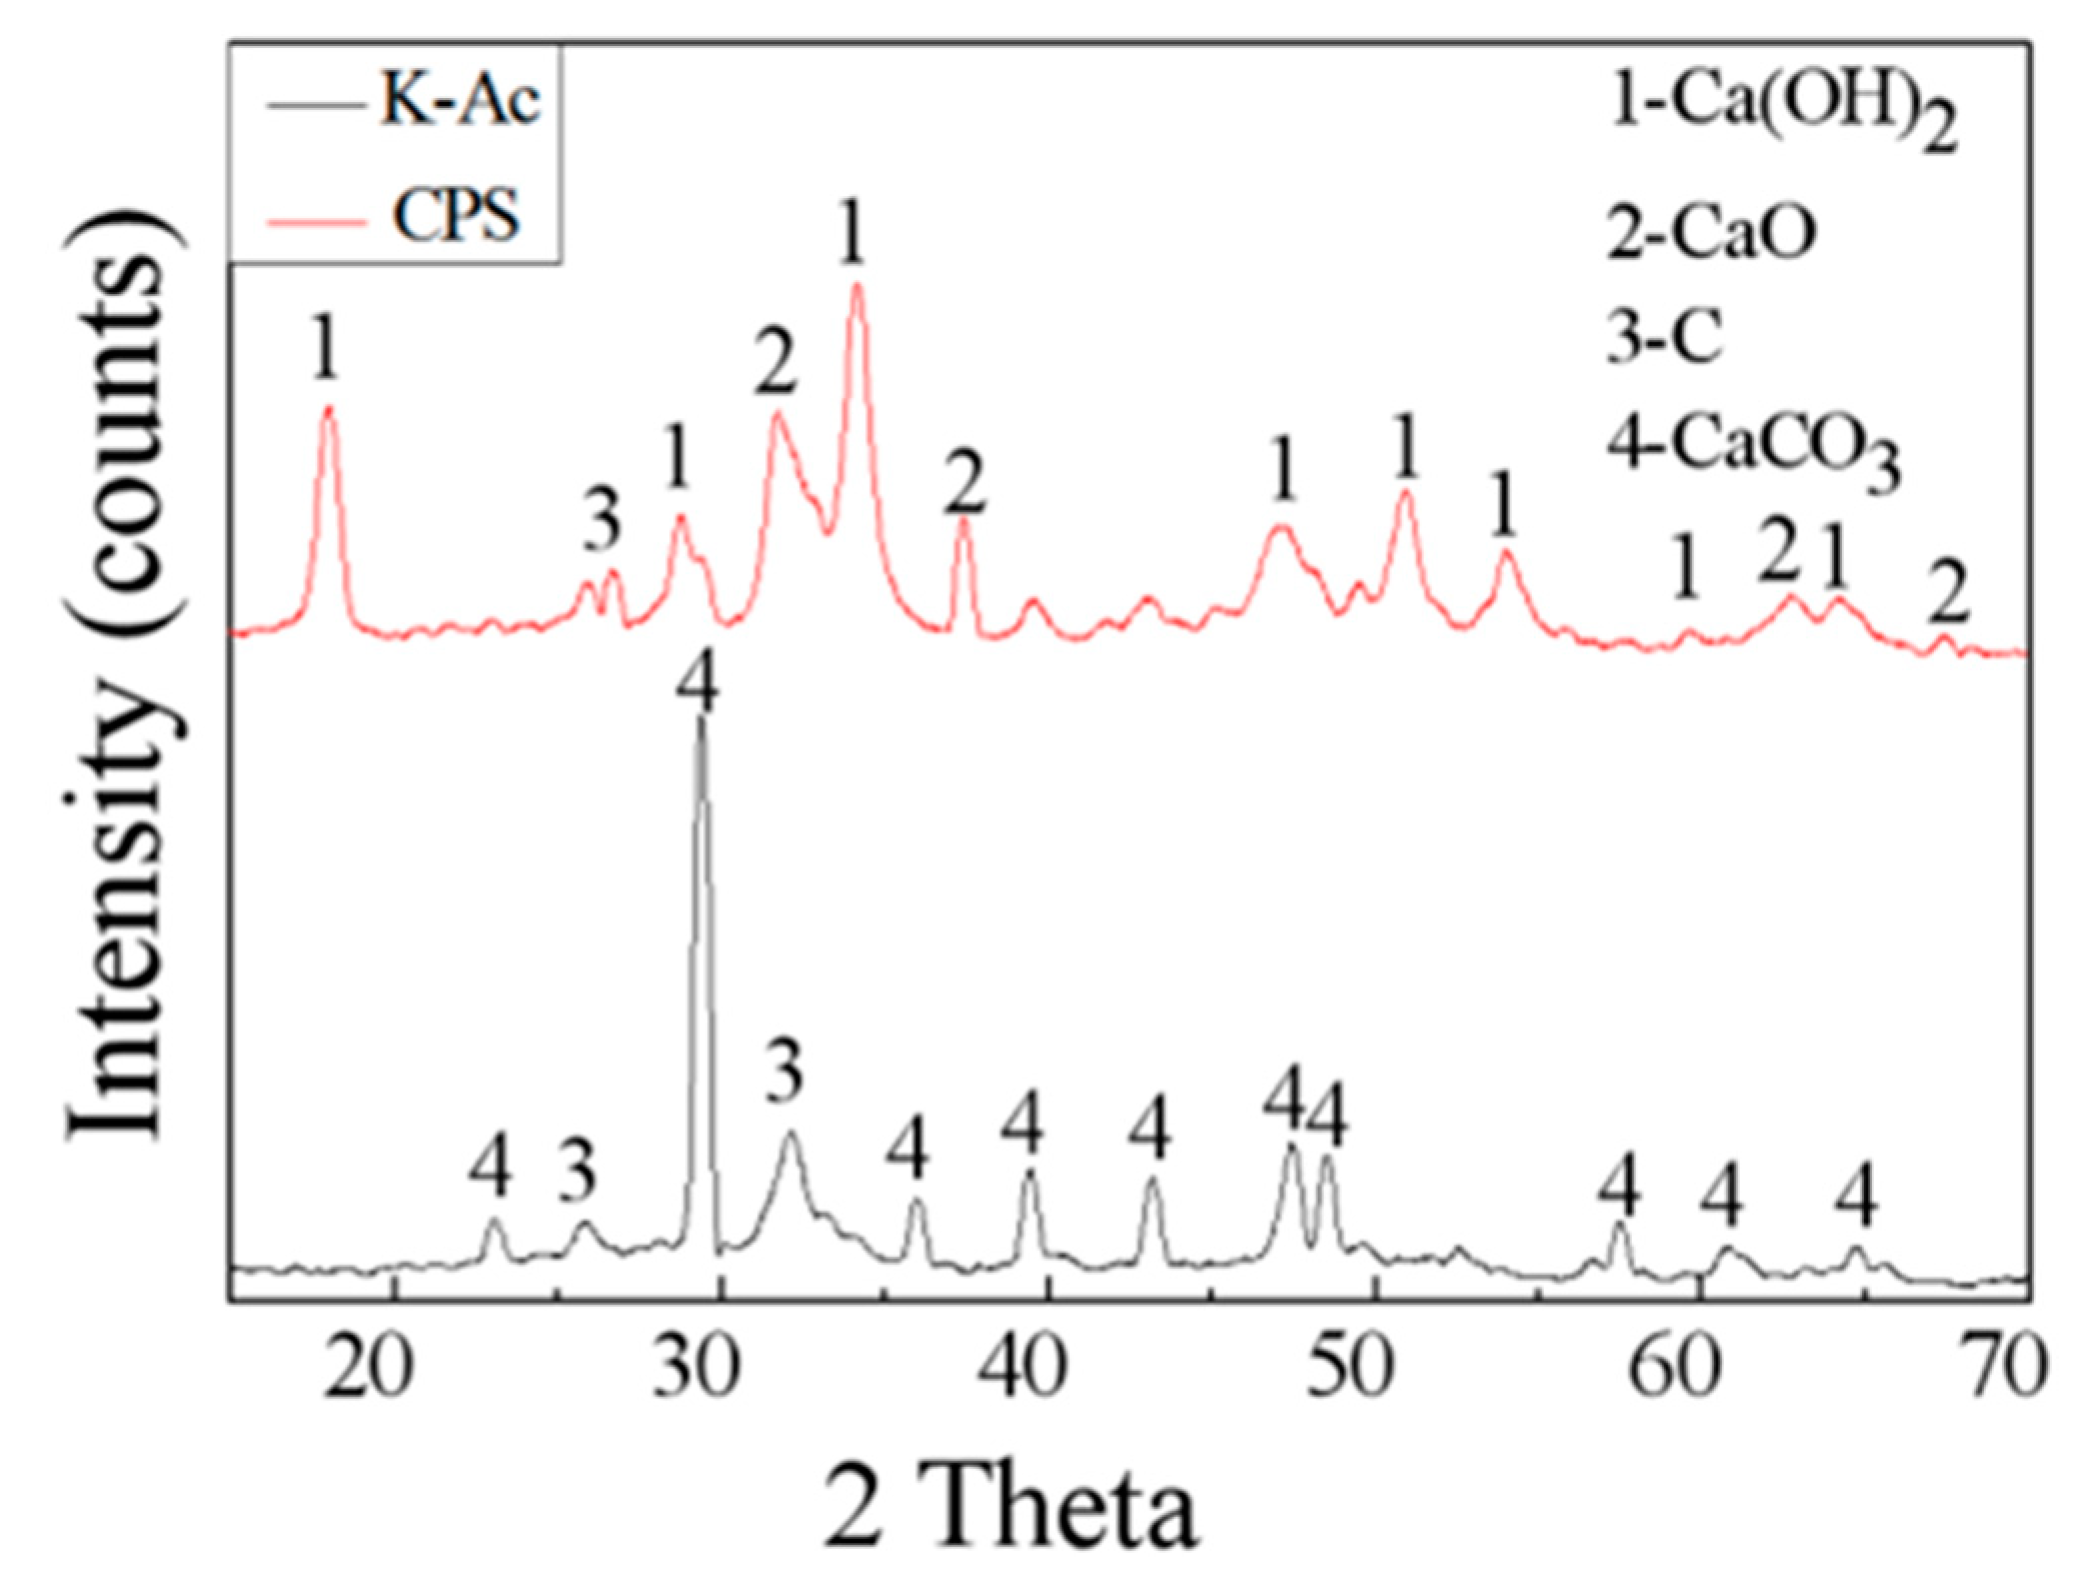
The crystalline structure of as-prepared samples is characterized by XRD. The XRD spectrum of CPS and K-Ac is presented in Figure 5. From Figure 5, it can be seen that almost all peaks of CaCO3 in PS became CaO (PDF# 78-0649), and the corresponding peaks are at 2θ = 32.203°, 37.346°, 53.854°, 64.152°, and 67.373 [52,53]. Since CaO reacts easily with H2O in the air and becomes Ca(OH)2, there is a characteristic peak of Ca(OH)2 (PDF# 87-0673) in the XRD pattern of the untreated adsorbent [10], and its corresponding characteristic spectra are at 2θ = 18.089°, 28.662°, 34.088°, 47.123°, 50.794°, 54.336°, 62.538°, and 64.226°. In addition, the strong diffraction peak at 26.381 may have been caused by the partial ordering of carbon, and there is a less pronounced amorphous diffraction peak around 31°, which may be residual amorphous carbon. Compared with K-Ac, the number and intensity of characteristic diffraction peaks decreases after KOH activation. The corresponding characteristic peaks are at 2θ = 23.022°, 29.405°, 35.965°, 39.401°, 43.145°, 47.489°, and 48.512°, indicating that the degree of crystallinity decreases. There is a distinct characteristic peak in the spectrum at about 2θ = 25°, and a faint characteristic peak at 2θ = 42°, which are the diffraction peaks of microcrystalline (002) and (100) crystal planes in the structure of disorder layer graphite, respectively. The diffraction peaks corresponding the (002) crystal plane are broader in the spectrum, indicating the amorphous state of K-Ac. The (100) peak of K-Ac is flat or almost disappears, and shows a diffusive shape with a large diffraction angle, which indicates that through KOH activation, K-Ac has a disordered crystallite layer, disordered carbon structure, and a smaller size of graphite-like crystallites, which may suggest strong adsorption capacity [54,55,56].
FTIR vibrational spectra of CPS and K-Ac are presented in Figure 6. For CPS, it can be seen from Figure 6 that CPS peaks at 1440 cm–1 and 1041 cm–1 are characteristic peaks of calcium carbonate, and the out-of-plane vibrational deformation peak of CO32– appears near 872 cm–1. The main intense bands of K-Ac are observed at 3640 cm–1, 3430 cm–1, 1420 cm–1, and 1040 cm–1. There are no major changes in the location of main absorption peaks, indicating their specific similar chemical structure. The peak at 3640 cm–1 is the characteristic infrared peak of Ca(OH)2. At the same time, a large number of –OH stretching vibration peaks appear at 3430 cm–1, representing hydroxyl groups (vibration frequencies of water, alcohols, and phenols) and N–H stretching vibrations. Two broad peaks are located in the range 1620–1380 cm–1, which can be assigned to the vibration of C=C bonds in aromatics and aromatic C–O stretching. The 1440 cm–1 peak shifts to 1420 cm–1, and the enhanced peak intensity at 1040 cm–1 is a characteristic peak of calcium carbonate. From the above analysis, it suggests that the KOH modification does not completely change existing groups on the surface of adsorbent CPS; however, after modification, the functional groups favoring metal adsorption, such as the hydroxyl groups, increase greatly, and the adsorption capacity of modified samples (K-Ac) to heavy metals is enhanced significantly. The reason for this may be that the large specific surface area, porous structure, and good adsorption properties of K-Ac are increased and promoted by KOH activation at high temperatures [57,58,59].

3.3. Effect of Solution pH

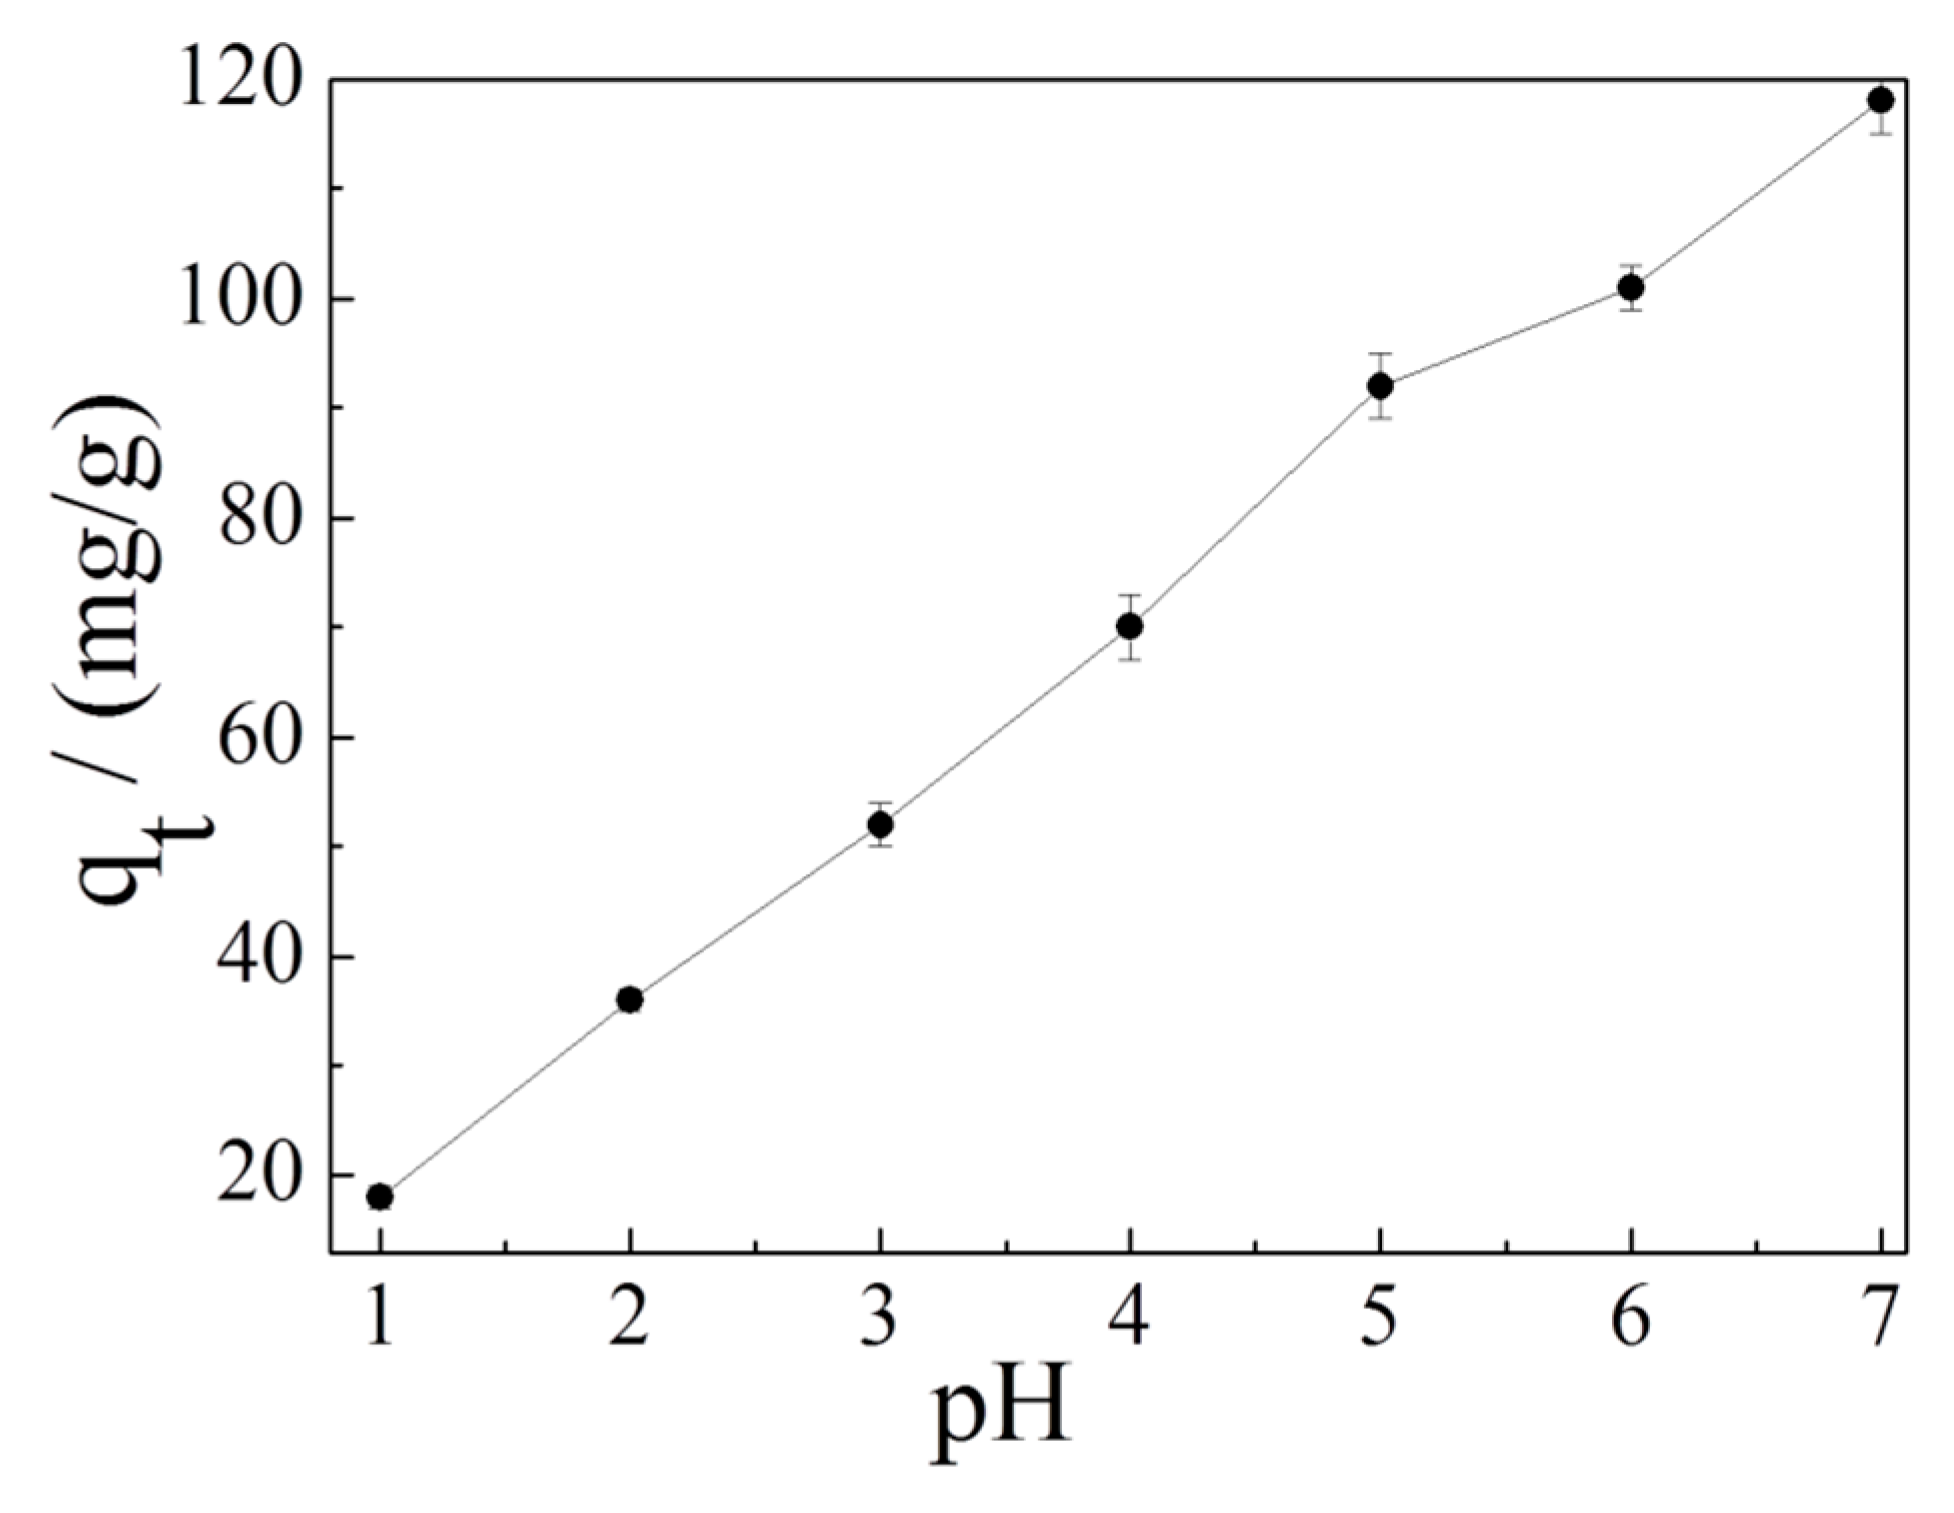
It is well-known that pH value is a key factor for promoting or restraining the adsorption process because it can affect the existence and the surface charge of the adsorbent [60,61]. As shown in Figure 7, the adsorption capacity of Cd2+ on K-Ac is significantly dependent on pH values. With the increase of pH value in the solution, the adsorption capacity of K-Ac to Cd2+ increases. When the pH value is 7, the adsorption amount of K-Ac is as high as 120 mg/g. The results clearly illustrate that the pH values have affected the functional groups or charges on the surface of the adsorbent. Under an acidic condition, the solution contains a large number of H+ ions. These H+ ions will occupy the adsorption sites on the surface of the adsorbent, which in turn will cause Cd2+ to be unable to precipitate on the surface of the adsorbent, weakening its adsorption capacity. On the other hand, the H+ ion concentration decreases as pH increases, the H+ ions do not compete with Cd2+ anymore, and there are more active groups and active sites available; thus, Cd2+ ions can obtain more OH ions in the solution. Generally, the adsorption capacity of heavy metals by an adsorbent increases with an increasing pH value. When the pH value is higher than the critical pH value of a heavy metal, hydrolysis and precipitation are dominant in the solution [62]. The critical pH value of Cd(II) ion is around 8.0 [63].

3.4. Effect of Contact Time and Adsorption Kinetics

The strong ability of K-Ac interacting with Cd2+ was desirable and beneficial with respect to real practical application. To investigate the adsorption kinetics of Cd2+ on K-Ac, an initial concentration of 10 mg/L was used, and results are shown in Figure 8. At the initial period (20–80 min), the adsorption capacity of Cd2+ on K-Ac increased rapidly, as illustrated in Figure 8A; then, it slowly increased and began to stagnate as its contact time prolonged with K-Ac. This phenomenon could be interpreted by the fact that a great number of vacant adsorption sites were available for Cd2+ adsorption at the initial stage, and after that, the remaining effectively adsorption sites were difficult to be occupied due to repulsive forces from occupied sites nearby or between molecules on the top surface of K-Ac, or from the bulk solution. In addition, the quasi-first-order (QF) and the quasi-second-order (QS) models were employed to further understand the characteristics of the adsorption process of Cd2+ on K-Ac. The QF and the QS models were fitted with the adsorption kinetic data of Cd2+ on K-Ac, and the curves are shown in Figure 8B and Figure 8C, respectively. The kinetic parameters and correlation coefficients (R2) determined from these two models are listed in Table 2. We noticed that the experimental data closely followed the nonlinear regression of QF, and the R2 values (0.99587) of the QF kinetic model was much higher than that of QS (0.91054), suggesting that the adsorption process of Cd2+ on K-Ac was more suitable for the QF kinetic model.

3.5. Effect of Initial Cd2+ Concentration and Adsorption Isotherms

The effect of initial Cd2+ concentration on the adsorption capacity of K-Ac was investigated by adsorption experiments, and the results obtained are presented in Figure 9. From Figure 9A, the adsorption capacity of Cd2+ adsorbed on K-Ac was enhanced with the increase of initial Cd2+ concentration from 10 to 400 mg/L and reached up to 258 mg/g, and there was a trend of further increase. These results showed that, at lower initial Cd2+ concentrations (10–80 mg/L), intense competition for Cd2+ under aqueous conditions caused these ions to be condensed to a K-Ac host system with a reticulated porous structure and a rich OH group on the surface, and the adsorption rate increased rapidly. When the initial concentration of Cd2+ increased (80–400 mg/L), the adsorption rate gradually decreased, where the decrease in adsorption rate may have been due to the limited number of active sites on the K-Ac surface.
In order to further interpret the experimental adsorption data, the adsorption isotherm characteristics were also employed to investigate the adsorption behaviors of the heavy metals onto the prawn shell-derived activated carbon. Among a number of isotherm models, Langmuir and Freundlich’s isotherms are the most commonly used ones for describing the adsorption of heavy metals and organic compounds on ACs [64]. The adsorption fitting curves of the two models are described in Figure 9B,C. According to the R2 values of the two isotherm models listed in Table 3, it was found that the experimental results could be best fitted by the Langmuir model, as shown as Figure 9B. It was illustrated that this adsorption process was homogeneous, and the active sites on the K-Ac surface were evenly distributed. The value of the dimensionless separation factor RL, 0.862, was in the range of 0 < RL <1, indicating that it was within the range of the concentration studied. In addition, the n value of the Freundlich isotherm model constant was 1.011, within the range of 1–7, suggesting that the K-Ac is beneficial to the adsorption of Cd2+ after activation.

3.6. Adsorption Capacity in Cu2+, Cr6+, and Cd2+ Ternary System

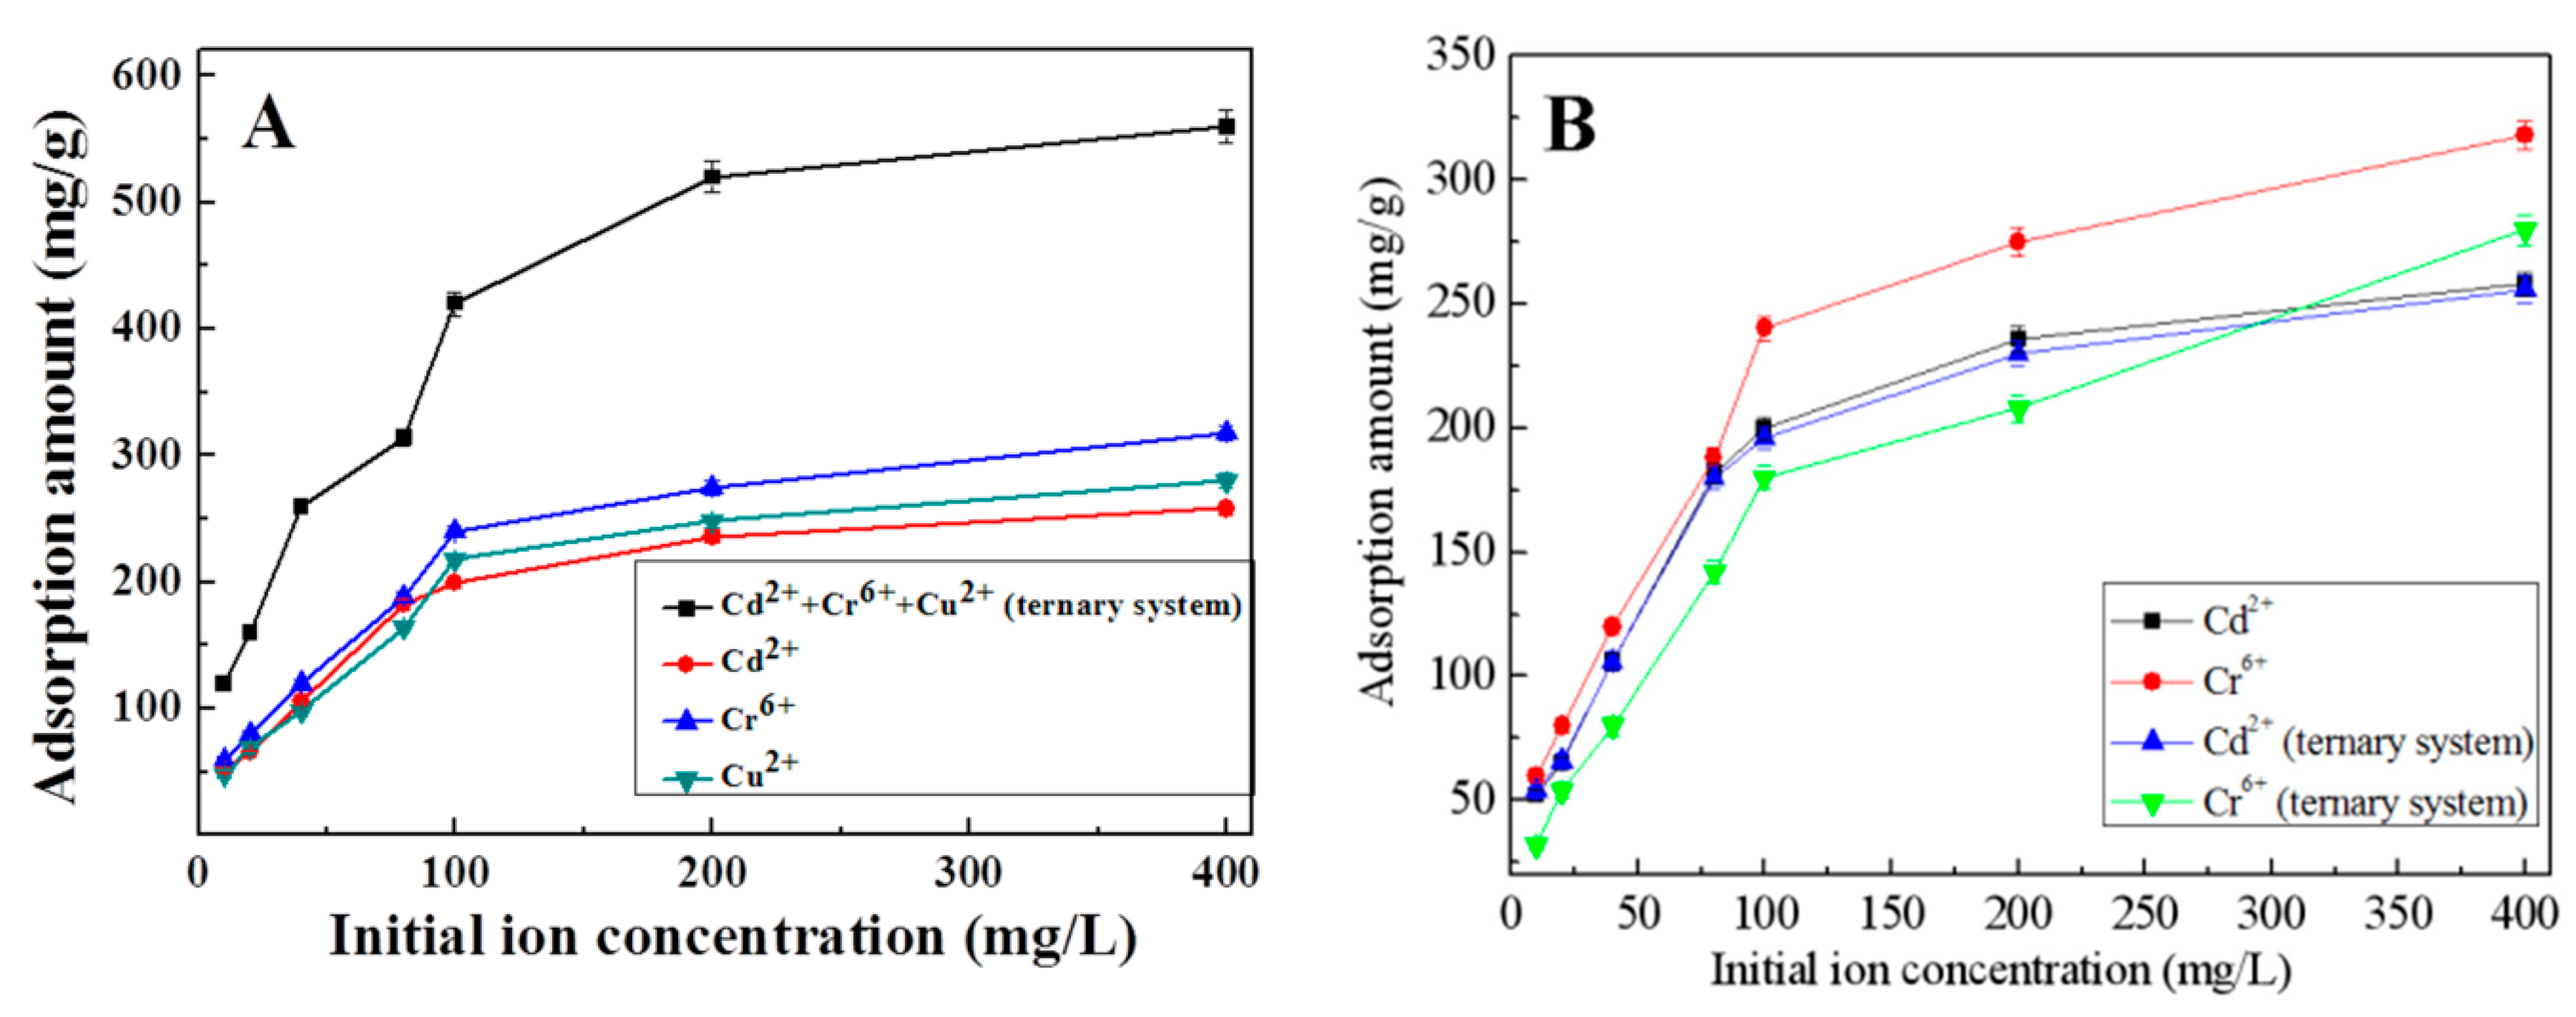
The adsorption capacities of K-Ac in the Cu2+, Cr6+, and Cd2+ ternary system and in their single systems are shown in Figure 10. The experimental results illustrated that the adsorption performance of K-Ac for metal ions in the multi-component heavy metal ion system was different from those in a single system. The adsorption amount of metal ions in single systems and the total adsorption amount of metal ions in a ternary system are shown in Figure 10A. As the initial concentration of the three metal ions increases, the adsorption amount of K-Ac gradually reaches equilibrium, and the order of sorption is Cr(VI) (318 mg/g) > Cu (280 mg/g) > Cd(II) (256 mg/g). As shown in Figure 10A, for the ternary system after equilibrium, the total adsorption amount of K-Ac for the three ions is 560 mg/g, which is about two times greater than that in the single system, but not the superimposed sum of ions adsorbed in their single ion system. It is suggested that for the adsorption experiments in the ternary system, there would be a competitive relationship among the three ions, which will affect the adsorption of metal ions by K-Ac. Furthermore, in the ternary system, as the initial concentration of the metal solution increases, the adsorption amount of Cd2+ by K-Ac was almost unchanged, while the adsorption capacity of Cr6+ was greatly decreased, as shown in Figure 10B, which is the individual adsorption amount of each metal in a single system and a ternary system. Compared with the single system, the adsorption amount of Cd2+ by K-Ac in the ternary system was slightly reduced in the same condition, indicating that the presence of Cu2+ and Cr6+ had little effect on the adsorption of Cd2+ by K-Ac. The adsorption capacity of K-Ac for Cr6+ in the ternary system was lower than that in the single system, suggesting that the presence of Cu2+ and Cd2+ had a strong antagonistic inhibition effect on the adsorption of K-Ac to Cr6+. Meanwhile, the difference in the adsorption capability of K-Ac to each heavy metal ion can be expressed by the ratio of adsorption amounts, i.e., Q3/Q1 (where Q3 is the adsorption capacity of K-Ac to a certain heavy metal ion in the ternary system; Q1 is the adsorption capacity of K-Ac to corresponding metal ions in a single system). The Q3/Q1 ratio of Cd2+ was approximately equal to 1, and the value of Cr6+ was much less than 1, which indicated that the adsorption of Cd2+ by K-Ac was not affected by interfering ions Cu2+ and Cr6+, while by the presence of Cd2+ and Cu2+, the adsorption of Cr6+ by K-Ac was inhibited to some extent; thus, the adsorption amount of Cr6+ was reduced. However, the total adsorption capacity of K-Ac for three metal ions in the ternary system could reach up to 560 mg/g, which was higher than that of the single heavy metal ion. From these data, it can be inferred that in the ternary system, the adsorption capacity of copper becomes the lowest due to the presence of Cd2+ and Cr6+ ions, and the adsorption capacity of copper drops from 280 to 24 mg/g.
The possible sorption mechanism on bioadsorbents can be explained by interactions between the heavy metal pollutant ions and the functional groups present on the adsorbent surface. Among various factors that affect the biosorption preferences of a sorbent, binding of metal ions on biomaterials largely depends on the physicochemical properties of metals [65]. It has been reported that in general, the greater the atomic weight, electronegativity, electrode potential, and ionic size, the greater the affinity for sorption will be [66]. The order of sorption will be Cd(II) > Cu(II) > Cr(VI), according to atomic weight. In the single system, the adsorption amount of K-Ac to Cr6+ is higher than that to Cu2+ and Cd2+, as shown in Figure 10A. In accordance with electronegativity, the larger the radius of metal ions, the smaller the electronegativity. Therefore, the order of sorption will become Cr(VI) > Cu(II) > Cd(II) [67]. The obtained results are consistent with the physicochemical properties of metal ions under this study. Compared with the adsorption amount in the single system under the same condition, the adsorption capacity of K-Ac to Cd2+ and Cr6+ in the ternary system is reduced, while the adsorption capacity of K-Ac to Cr6+ decreases greatly, which can be ascribed to the overlapping of adsorption sites of respective metal ions. There exist a variety of binding sites on the K-Ac biomass that are partially specific for individual metal species [68]. The removal efficiency of the same adsorbent in a multi-component solution is normally lower than that of single-component ones, due to the less availability of binding sites [69]. Metal ions have been revealed to coordinate in adsorbent predominantly to carboxylic moieties without excluding hydroxyl groups [67]. Thus, in the present trimetallic combination, the sorption of metal ions is a competitive process between ions in solution and those sorbed onto the biomass surface. The results of this study indicate that the presence of Cu2+ and Cr6+ has little effect on the adsorption of Cd2+ by K-Ac, while Cu2+ and Cd2+ have strong antagonistic inhibition on the adsorption of K-Ac to Cr6+.

4. Conclusions

ACs with a higher specific area and excellent Cd2+ adsorption performance have been successfully prepared from prawn shell waste through high-temperature carbonization and KOH activation. The resultant activated carbons had alarge specific area of 3159.65 m2/g and nanoporosity with narrow pore size distribution and lower crystallinity, which presented more advantages for adsorption purposes than PS and CPS, and its specific surface area was also 835 and 86 times higher than PS and CPS, respectively. After treatment and enhancement, the adsorption capacity of K-Ac to Cd2+ could reach up to 256 mg/g, and there was a trend of further increase. An analysis of the kinetic and isotherm models for the adsorption of Cd2+ on K-Ac indicated that the experimental data were well-described by the quasi-first-order model and Langmuir isotherm. Furthermore, the adsorption properties of K-Ac in a ternary mixture of heavy metal ions Cu2+, Cr6+, and Cd2+ were also examined. The sorption preferences of K-Ac were found, that binding of metal ions on biomass largely depended on the physicochemical properties of the metals. For the ternary system after equilibrium, the maximum adsorption capacity of K-Ac at 25 °C was 560 mg/g. In summary, it is expected that the inexpensive K-Ac could be used as a promising bioadsorbent to remove heavy metal ions from industrial wastewater.

Author Contributions

Conceptualization, W.S.; Methodology, W.S. and J.G.; Validation, Y.W. and H.Z.; Formal analysis, L.C.; Investigation, L.J. and X.J.; Resources, Y.W.; Data curation, J.G. and X.J.; Writing—original draft preparation, Y.S.; Writing—review and editing, H.Z.; Visualization, Y.S.; Supervision, H.Z. and W.D.; Project administration, L.J. and L.C.; Funding acquisition, W.S.

Funding

This study was supported by the Natural Science Foundation of Zhejiang Province of China (No. LQ16D060004), Key Research and Development Projects of Zhejiang Province of China (No. 2018C02043), Demonstration Project of Marine Economic Innovation and Development of Zhoushan City of China, and Demonstration Project of Marine Economic Innovation and Development of Yantai City of China (No. YHCX-SW-L-201705).

Conflicts of Interest

The authors declare no conflict of interest.

References

  1. Ahmad, A.L.; Loh, M.M.; Aziz, J.A. Preparation and characterization of activated carbon from oil palm wood and its evaluation on methylene blue adsorption. Dyes Pigment. 2007, 75, 263–272. [Google Scholar] [CrossRef]
  2. Bestani, B.; Benderdouche, N.; Benstaali, B.; Belhakem, M.; Addou, A. Methylene blue and iodine adsorption onto an activated desert plant. Bioresour. Technol. 2008, 99, 8441–8444. [Google Scholar] [CrossRef] [PubMed]
  3. Mahmud, H.N.M.E.; ObidulHuq, K.; Yahya, R.B. The removal of heavy metal ions from wastewater/aqueous solution using polypyrrole-based adsorbents: A review. RSC Adv. 2016, 6, 14778–14791. [Google Scholar] [CrossRef]
  4. Yeung, P.T.; Chung, P.Y.; Tsang, H.C.; Tang, J.O.; Cheng, G.Y.M.; Gambari, R.; Chui, C.H.; Lam, K.H. Preparation and characterization of bio-safe activated charcoal derived from coffee waste residue and its application for removal of lead and copper ions. RSC Adv. 2014, 4, 38839–38847. [Google Scholar] [CrossRef]
  5. Susan, E.; Bailey, T.J.; Olin, R.M.; Bricka, D.; Dean, A. A review of potentially low-cost sorbents for heavy metals. Water Res. 1999, 11, 2469–2479. [Google Scholar]
  6. Zhang, Q.; Li, Y.; Phanlavong, P.; Wang, Z.; Jiao, T.; Qiu, H.; Peng, Q. Highly efficient and rapid fluoride scavenger using an acid/base tolerant zirconium phosphate nanoflake: Behavior and mechanism. J. Clean. Prod. 2017, 161, 317–326. [Google Scholar] [CrossRef]
  7. Zhang, Q.; Li, Y.; Yang, Q.; Chen, H.; Chen, X.; Jiao, T.; Peng, Q. Distinguished Cr (VI) capture with rapid and superior capability using polydopamine microsphere: Behavior and mechanism. J. Hazard Mater. 2017, 342, 732. [Google Scholar] [CrossRef]
  8. Zhang, X.; Li, X.; Yang, H.; Cui, Z. Biochemical mechanism of phytoremediation process of lead and cadmium pollution with Mucor circinelloides and Trichoderma asperellum. Ecotoxicol. Environ. Saf. 2018, 157, 21–28. [Google Scholar] [CrossRef]
  9. Feng, J.X.; Gao, Q.F.; Dong, S.L.; Sun, Z.L. Transference of heavy metals (Hg, Cu, Pb and Zn) with the trophic structure in a polyculture pond: Evidence from nitrogen stable isotope. Aquac. Res. 2016, 47, 1996–2003. [Google Scholar] [CrossRef]
  10. Mendoza-Carranza, M.; Sepulveda-Lozada, A.; Dias-Ferreira, C. Distribution and bioconcentration of heavy metals in a tropical aquatic food web: A case study of a tropical estuarine lagoon in SE Mexico. Environ. Pollut. 2016, 210, 155–165. [Google Scholar] [CrossRef]
  11. Squadrone, S.; Brizio, P.; Stella, C.; Prearo, M.; Pastorino, P.; Serracca, L.; Ercolini, C.; Abete, M.C. Presence of trace metals in aquaculture marine ecosystems of the northwestern Mediterranean sea (Italy). Environ. Pollut. 2016, 215, 77–83. [Google Scholar] [CrossRef] [PubMed]
  12. Ai, Z.; Cheng, Y.; Zhang, L.; Qiu, J. Efficient Removal of Cr(VI) from Aqueous Solution with Fe@Fe2O3Core−Shell Nanowires. Environ. Sci. Technol. 2008, 42, 6955–6960. [Google Scholar] [CrossRef] [PubMed]
  13. Habibul, N.; Hu, Y.; Wang, Y.K.; Chen, W.; Yu, H.Q.; Sheng, G.P. Bioelectrochemical Chromium(VI) Removal in Plant-Microbial Fuel Cells. Environ. Sci. Technol. 2016, 50, 3882–3889. [Google Scholar] [CrossRef] [PubMed]
  14. Lv, X.; Xu, J.; Jiang, G.; Xu, X. Removal of chromium(VI) from wastewater by nanoscale zero-valent iron particles supported on multiwalled carbon nanotubes. Chemosphere 2011, 85, 1204–1209. [Google Scholar] [CrossRef] [PubMed]
  15. Wahid, A.; Ghani, A. Varietal differences in mungbean (Vigna radiata) for growth, yield, toxicity symptoms and cadmium accumulation. Ann. Appl. Biol. 2008, 152, 59–69. [Google Scholar] [CrossRef]
  16. Maneerung, T.; Liew, J.; Dai, Y.; Kawi, S.; Chong, C.; Wang, C.-H. Activated carbon derived from carbon residue from biomass gasification and its application for dye adsorption: Kinetics, isotherms and thermodynamic studies. Bioresour. Technol. 2016, 200, 350–359. [Google Scholar] [CrossRef] [PubMed]
  17. Foo, K.Y.; Hameed, B.H. Dynamic adsorption behavior of methylene blue onto oil plam shell granular activated carbon prepared by microwave heating. Chem. Eng. J. 2012, 203, 81–87. [Google Scholar] [CrossRef]
  18. Mahapatra, K.; Ramteke, D.S.; Paliwal, L.J. Production of activated carbon from sludge of food processing industry under controlled pyrolysis and its application for methylene blue removal. J. Anal. Appl. Pyrolysis 2012, 95, 79–86. [Google Scholar] [CrossRef]
  19. Nor, N.M.; Chung, L.L.; Teong, L.K.; Mohamed, A.R. Synthesis of activated carbon from lignocellulosic biomass and its applications in air pollution control—A review. J. Chem. Eng. 2013, 1, 658–666. [Google Scholar]
  20. Ruey-Shin, J.; Yao-Chung, Y.; Chien-Shiun, L.; Kuen-Song, L.; Hsi-Chuan, L.; Sea-Fue, W.; An-Cheng, S. Synthesis of magnetic Fe3O4/activated carbon nanocomposites with high surface area as recoverable adsorbents. J. Taiwan Inst. Chem. Eng. 2018, 90, 51–60. [Google Scholar]
  21. Omer, K.; Yasin, R.E.; Haluk, B.; Ali, T. Preparation of chemically-activated high surface area carbon from waste vinasse and its efficiency as adsorbent material. J. Mol. Liquids 2018, 272, 189–197. [Google Scholar]
  22. Junting, S.; Zhengping, Z.; Jing, J.; Meiling, D.; Feng, W. Removal of Cr6+ from wastewater via adsorption with high-specific-surface-area nitrogen-doped hierarchical porous carbon derived from silkworm cocoon. Appl. Surf. Sci. 2017, 405, 372–379. [Google Scholar]
  23. Ait Ahsaine, H.; Zbair, M.; Anfar, Z.; Naciri, Y.; El haouti, R.; El Alem, N.; Ezahri, M. Cationic dyes adsorption onto high surface area ‘almond shell’ activated carbon: Kinetics, equilibrium isotherms and surface statistical modeling. Mater. Today Chem. 2018, 8, 121–132. [Google Scholar] [CrossRef]
  24. Ahmed, M.J.; Theydan, S.K. Optimization of microwave preparation conditions for activated carbon from Albizia lebbeck speed pods for methylene blue dye adsorption. J. Anal. Appl. Pyrol. 2014, 105, 199–208. [Google Scholar] [CrossRef]
  25. Song, M.; Jin, B.; Xiao, R.; Yang, L.; Wu, Y.; Zhong, Z.; Huang, Y. The comparison of two activation techniques to prepare activated carbon from corn cob. Biomass Bioenergy 2013, 48, 250–256. [Google Scholar] [CrossRef]
  26. Babel, S.; Kurniawan, T.A. Cr(VI) removal from synthetic wastewater using coconut shell charcoal and commercial activated carbon modified with oxidizing agents and/or chitosan. Chemosphere 2004, 54, 951–967. [Google Scholar] [CrossRef] [PubMed]
  27. Gao, Y.; Yue, Q.; Gao, B.; Sun, Y.; Wang, W.; Li, Q.; Wang, Y. Preparation of high surface area-activated carbon from lignin of papermaking black liquor by KOH activation for Ni(II) adsorption. Chem. Eng. J. 2013, 217, 345–353. [Google Scholar] [CrossRef]
  28. Thuana, T.V.; Quynha, B.T.P.; Nguyena, T.D.; Ho, V.T.T.; Bach, L.G. Response surface methodology approach for optimization of Cu2+, Ni2+ and Pb2+ adsorption using KOH-activated carbon from banana peel. Surf. Interfaces 2017, 6, 209–217. [Google Scholar] [CrossRef]
  29. White, R.J.; Antonietti, M.; Titirici, M.M. Naturally inspired nitrogen doped porous carbon. J. Mater. Chem. 2009, 19, 8645–8650. [Google Scholar] [CrossRef]
  30. De Holanda, H.D.; Netto, F.M. Recovery of components from shrimp (Xiphopenoeous kryerl) processing waste by enzymatic hydrolysis. J. Food Sci. 2006, 71, C298–C303. [Google Scholar] [CrossRef]
  31. Kandra, P.; Challa, M.M.; Kalangi Padma Jyothi, H. Efficient use of shrimp waste: Present and future trends. Appl. Microbiol. Biotechnol. 2012, 93, 17–29. [Google Scholar] [CrossRef] [PubMed]
  32. Beaney, P.; Mendoza, J.L.; Healy, M. Comparison of chitins produced by chemical and bioprocedding methods. J. Chem. Technol. Biotechnol. 2005, 80, 145–150. [Google Scholar] [CrossRef]
  33. Ahmad, M.; Rajapaksha, A.U.; Lim, J.E.; Zhang, M.; Bolan, N.; Mohan, D.; Vithanage, M.; Lee, S.S.; Ok, Y.S. Biochar as a sorbent for contaminant management in soil and water: A review. Chemosphere 2014, 99, 19–33. [Google Scholar] [CrossRef] [PubMed]
  34. Qin, L.; Zhou, Z. Novel N-doped hierarchically porous carbons derived from sustainable shrimp shell for high-performance removal of sulfamethazine and chloramphenicol. J. Taiwan Inst. Chem. Eng. 2016, 62, 228–238. [Google Scholar] [CrossRef]
  35. Lillo-Rodenas, M.A.; Marco-Lozar, J.P.; Cazorla-Amoros, D.; Linares-Solano, A. Activated carbons prepared by pyrolysis of mixtures of carbon precursor/alkaline hydroxide. J. Anal. Appl. Pyrol. 2007, 80, 166–174. [Google Scholar] [CrossRef]
  36. Król, M.; Gryglewicz, G.; Machnikowski, J. KOH activation of pitch-derived carbonaceous materials—Effect of carbonization degree. Fuel Process. Technol. 2011, 92, 158–165. [Google Scholar] [CrossRef]
  37. Abechi, S.E.; Gimba, C.E.; Uzairu, A.; Dallatu, Y.A. Preparation and characterization of activated carbon from palm kernel shell by chemical activation. Res. J. Chem. Sci. 2013, 3, 54–61. [Google Scholar]
  38. Tseng, R.-L.; Tseng, S.-K. Pore structure and adsorption performance of the KOH-activated carbons prepared from corncob. J. Colloid Interface Sci. 2005, 287, 428–437. [Google Scholar] [CrossRef]
  39. Yang, K.; Zhu, L.; Yang, J.; Lin, D. Adsorption and correlations of selected aromatic compounds on a KOH-activated carbon with large surface area. Sci. Total Environ. 2018, 618, 1677–1684. [Google Scholar] [CrossRef]
  40. Kanogwan, T.; Lupong, K.A. Enhancement of adsorption efficiency of heavy metal Cu(II) and Zn(II) onto cationic surfactant modified bentonite. Environ. Chem. Eng. 2018, 6, 2821–2828. [Google Scholar]
  41. Bedin, K.C.; Martins, A.C.; Cazetta, A.L.; Pezoti, O.; Almeida, V.C. KOH-activated carbon prepared from sucrose spherical carbon: Adsorption equilibrium, kinetic and thermodynamic studies for methylene bule removal. Chem. Eng. J. 2016, 286, 476–484. [Google Scholar] [CrossRef]
  42. Ho, Y.S.; Huang, C.T.; Huang, H.W. Equilibrium sorption isotherm for metal ions on tree fern. Process Biocherm. 2002, 37, 1421–1430. [Google Scholar] [CrossRef]
  43. Keskinkan, O.; Goksu, M.Z.I.; Basibuyuk, M.; Forster, C.F. Heavy metal adsorption characteristics of a submerged aquatic plant (Myriophyllum spicatum). Process Biochem. 2003, 39, 179–183. [Google Scholar] [CrossRef]
  44. Keskinkan, O.; Goksu, M.Z.I.; Basibuyuk, M.; Forster, C.F. Heavy metal adsorption characteristics of a submerged aquatic plant (Ceratophyllum deersum). Process Biochem. 2004, 92, 197–200. [Google Scholar]
  45. Ho, Y.S. Citation review of Lagerren kinetic rate equation on adsorption reactions. Scientometrics 2004, 59, 171–177. [Google Scholar]
  46. Ho, Y.S.; McKay, G.A. Kinetic study of dye sorption by biosorbent waste product pith. Resour. Conserv. Recyc. 1999, 25, 171–193. [Google Scholar] [CrossRef]
  47. Benquella, B.; Benaissa, H. Cadmium removal frm aqueous solution by chitin: Kinetic and equilibrium studies. Water Res. 2002, 36, 2463–2474. [Google Scholar] [CrossRef]
  48. Cheng, C.W.; Porter, C.F.; McKay, G. Sorption kinetics for the removal of copper and zinc from effluents using bone char. Sep. Purif. Technol. 1997, 19, 55–64. [Google Scholar] [CrossRef]
  49. Ho, Y.S.; McKay, G. Kinetic Models for the Sorption of Dye from Aqueous Solution by Wood Trans. ICHemE 1998, 76, 183–191. [Google Scholar]
  50. Liu, X.; He, C.; Yu, X.; Bai, Y.; Ye, L.; Wang, B.; Zhang, L. Net-like porous activated carbon materials from shrimp shell by solution-processed carbonization and H3PO4 activation for methylene blue adsorption. Powder Technol. 2018, 326, 181–189. [Google Scholar] [CrossRef]
  51. Yoon, S.-H.; Lim, S.; Song, Y.; Ota, Y.; Qiao, W.; Tanaka, A.; Mochida, I. KOH activation of carbon nanofibers. Carbon 2004, 42, 1723–1729. [Google Scholar] [CrossRef]
  52. Cho, I.; No, K.; Meyers, P. Physicochemical characteristics and functional properties of various commercial chitin and chitosan products. J. Agric. Food Chem. 1998, 46, 3839–3843. [Google Scholar] [CrossRef]
  53. Sachindra, M.; Bhaskar, N. In vitro antioxidant activity of liquor from fermented shrimp biowaste. Bioresour. Technol. 2008, 99, 9013–9016. [Google Scholar] [CrossRef] [PubMed]
  54. Saikia, B.K.; Boruah, R.K.; Gogoi, P.K.A. X-ray diffraction analysis on graphene layers of Assam coal. J. Chem. Sci. 2009, 121, 103–106. [Google Scholar] [CrossRef]
  55. Muniandy, L.; Adam, F.; Mohamed, A.R.; Ng, E.-P. The synthesis and characterization of high purity mixed microporous/mesoporous activated carbon from rice husk using chemical activation with NaOH and KOH. Microporous Mesoporous Mater. 2014, 197, 316–323. [Google Scholar] [CrossRef]
  56. Pari, G.; Darmawan, S.; Prihandoko, B. Porous carbon spheres from hydrothermal carbonization and KOH activation on cassava and tapioca flour raw material. Procedia Environ. Sci. 2014, 20, 342–351. [Google Scholar] [CrossRef]
  57. Li, S.; Han, K.; Li, J.; Li, M.; Lu, C. Preparation and characterization of super activated carbon produced from gulfweed by KOH activation. Microporous Mesoporous Mater. 2017, 243, 291–300. [Google Scholar] [CrossRef]
  58. Chomiak, K.; Gryglewicz, S.; Kierzek, K.; Machnikowski, J. Optimizing the properties of granular walnut-shell based KOH activated carbons for carbon dioxide adsorption. J. CO2 Util. 2017, 21, 436–443. [Google Scholar] [CrossRef]
  59. Abdel-Ghani, N.T.; El-Chaghaby, G.A.; ElGammal, M.H.; Rawash, E.-S.A. Rawash. Optimizing the preparation conditions of activated carbons from olive cake using KOH activation. New Carbon Mater. 2016, 31, 492–500. [Google Scholar] [CrossRef]
  60. Khosravi, L.; Yazdanbakhsh, M.; Eftekhar, M.; Haddadi, Z. Fabrication of nano Delafossite LiCo0.5Fe0.5O2 as the new adsorbent in efficient removal of reactive blue 5 from aqueous solutions. Mater. Res. Blue 2013, 48, 2213–2219. [Google Scholar] [CrossRef]
  61. Ma, J.; Shen, Y.; Shen, C.; Wen, Y.; Liu, W. Al-doping chitosan-Fe(III) hydrogel for the removal of fluoride from aqueous solutions. Chem. Eng. J. 2014, 248, 98–106. [Google Scholar] [CrossRef]
  62. Fang, L.; Kanggen, Z.; Quan, C.; Wang, A.; Wei, C. Preparation of magnetic ferrite by optimizing the synthetic pH and its application for the removal of Cd(II) from Cd-NH3-H2O system. Mol. Liquids 2018, 264, 215–222. [Google Scholar]
  63. Wang, X.R. Environmental Chemistry; Nanjing University Press: Nanjing, China, 1993. [Google Scholar]
  64. Ghorbani, F.; Younesi, H.; Seyed, G.; Ali, Z.; Amini, M.; Ali, D. Application of response surface methodology for optimization of cadmium biosorption in an aqueous solution by Saccharomy cescerevisiae. Chem. Eng. J. 2008, 145, 267–275. [Google Scholar] [CrossRef]
  65. Sharma, P.; Kumari, P.; Srivastava, M.M.; Srivastava, S. Ternary biosorption studies of Cd(II), Cr(III) and Ni(II) on shelled Moringa oleifera seeds. Bioresour. Technol. 2007, 98, 474–477. [Google Scholar] [CrossRef] [PubMed]
  66. Mattuschka, B.; Straube, G. Biosorption of metals by a waste biomass. J. Chem. Technol. 1993, 58, 57–63. [Google Scholar] [CrossRef]
  67. Qin, F.; Wen, B.; Shan, X.Q.; Xie, Y.N.; Liu, T.; Zhang, S.Z.; Khan, S.U. Mechanisms of competitive adsorption of Pb, Cu, and Cd on peat. Environ. Pollut. 2006, 144, 669–680. [Google Scholar] [CrossRef] [PubMed] [Green Version]
  68. Horsfall, M., Jr.; Abia, A.A.; Spiff, A.I. Removal of Cu(II) and Zn(II) ions from waste water by cassava (Manihot esculenta Cranz) waste biomass. Afr. J. Biotechnol. 2003, 2, 360–364. [Google Scholar]
  69. He, I.; Li, Y.; Wang, C.; Zhang, K.; Lin, D.; Kong, L.; Liu, J. Rapid adsorption of Pb, Cu and Cd from aqueous solutions by -cyclodextrin polymers. Appl. Surface Sci. 2017, 426, 29–39. [Google Scholar] [CrossRef]
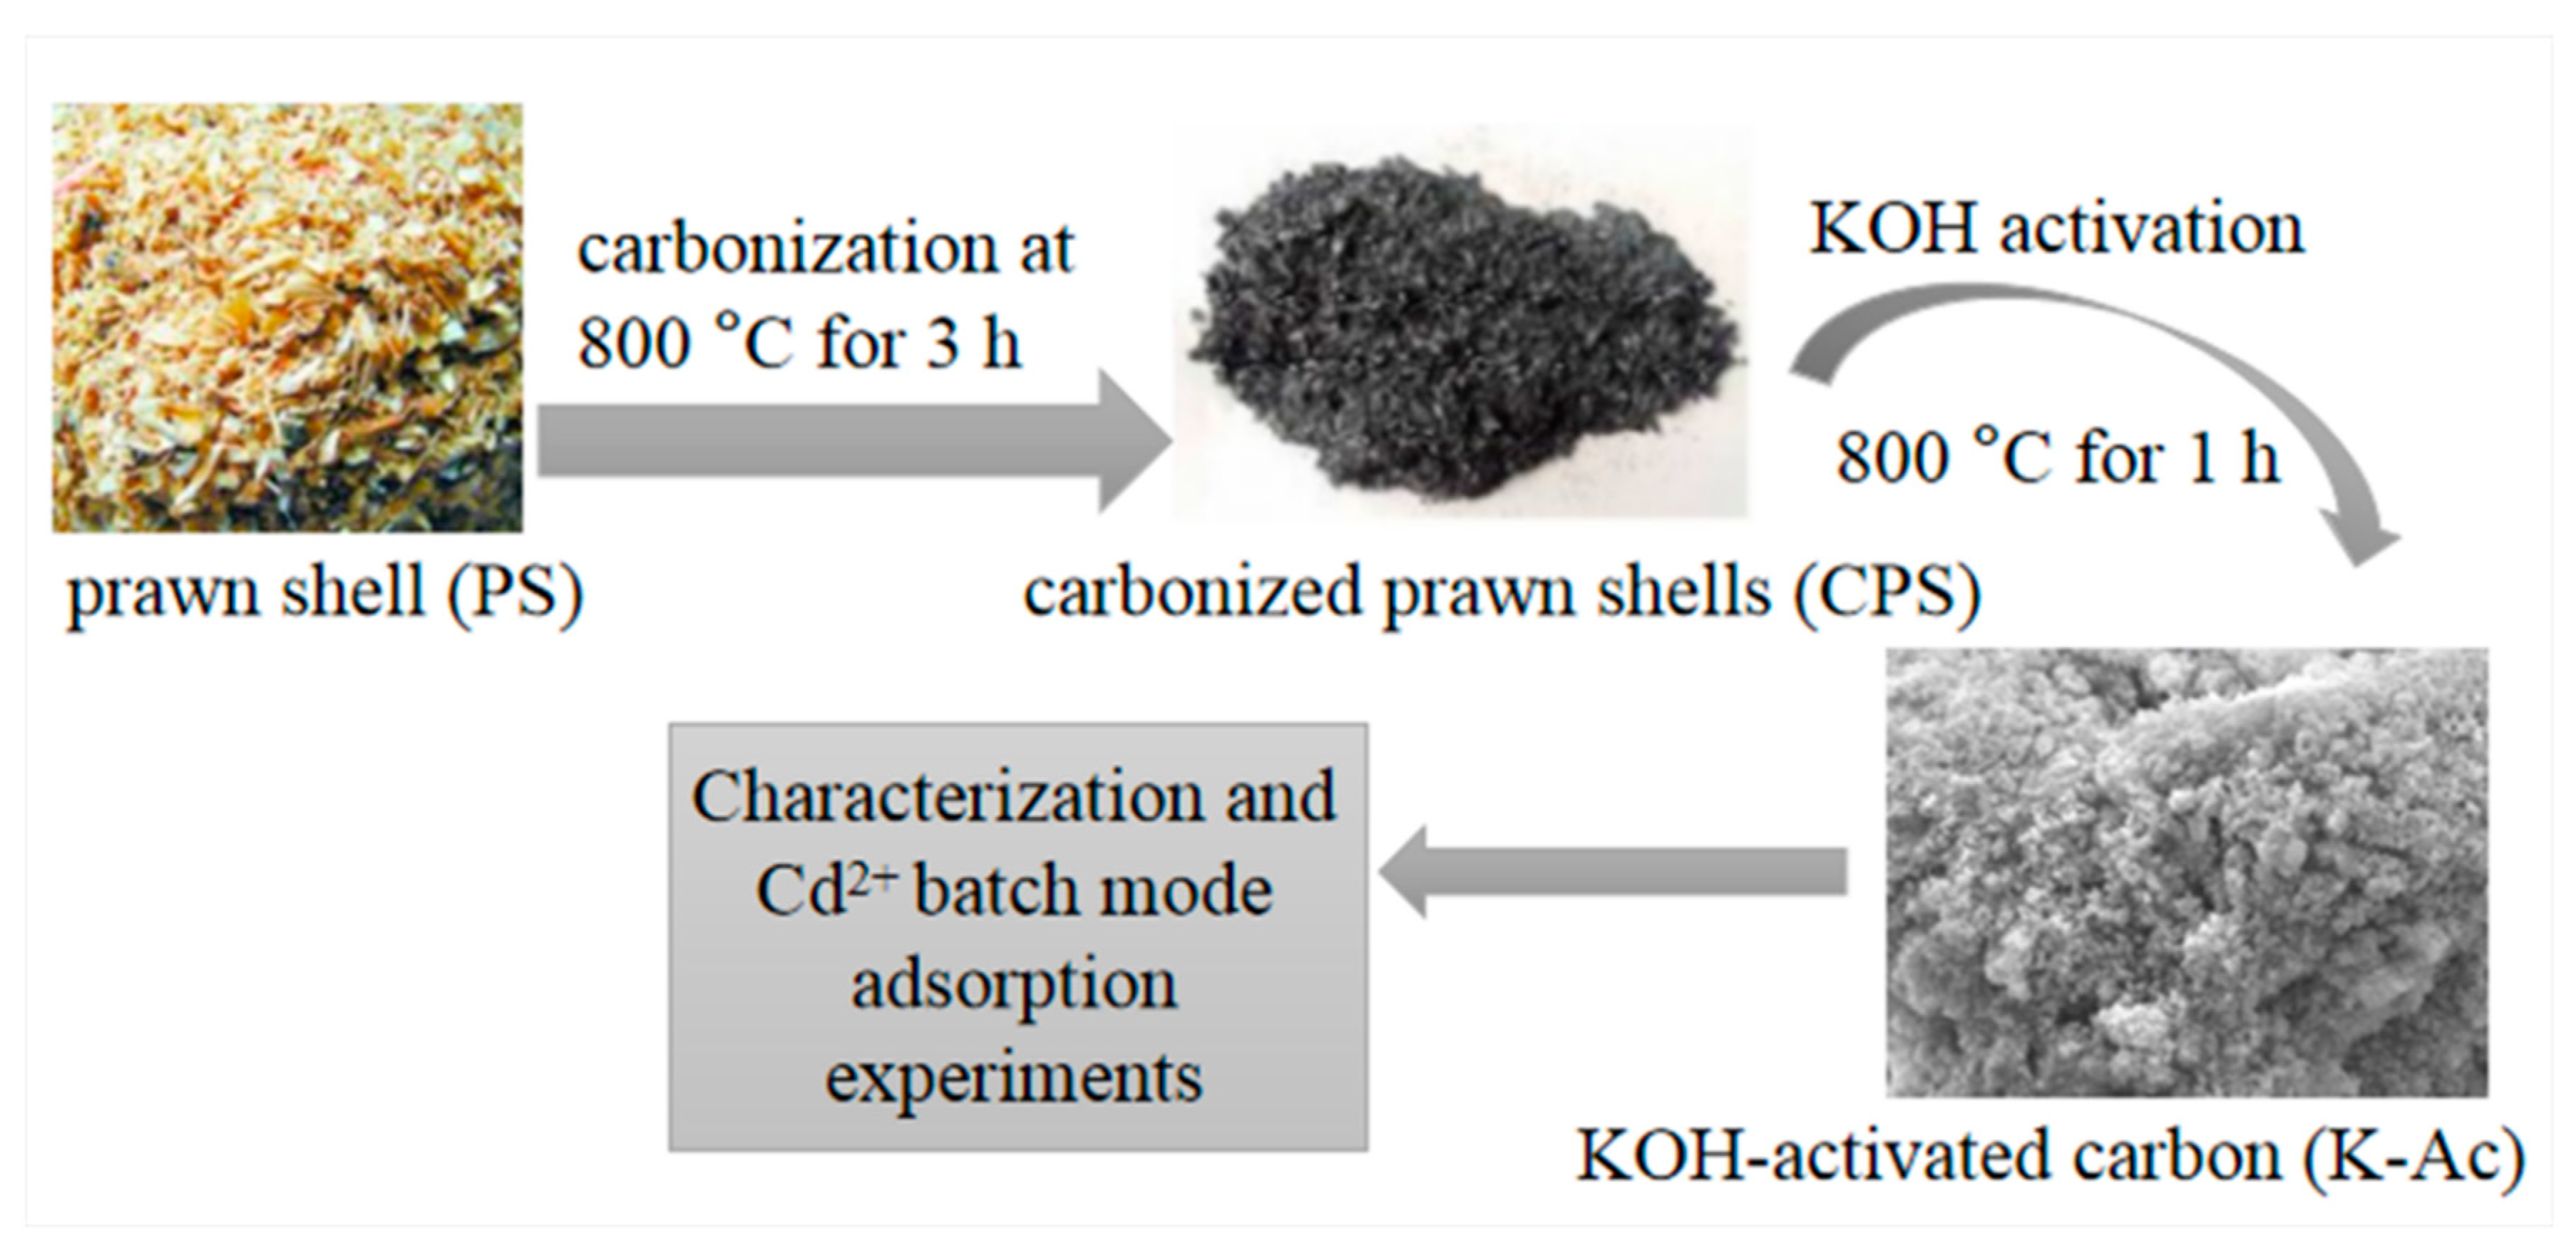
Figure 1. Diagram of the K-Ac preparation process.
Materials 12 00241 g001
Figure 2. Nitrogen adsorption-desorption isotherm and pore size distribution of (A) PS and CPS; (B) K-Ac.
Materials 12 00241 g002
Figure 3. Observations with SEM: (A) PS (A1–A4: magnified ×5000, ×10,000, ×20,000, ×50,000, respectively), (B) CPS (B1–B4: porous microsphere-stacking structures of CPS with different magnification), and (C) K-Ac (C1–C4: nanopore structures of K-Ac with different magnification).
Materials 12 00241 g003
Figure 4. TEM images of (A) PS, (B) CPS, and (C) K-Ac.
Materials 12 00241 g004
Figure 5. XRD spectra of as-prepared samples, CPS and K-Ac.
Materials 12 00241 g005
Figure 6. FTIR spectra of CPS and K-Ac.
Materials 12 00241 g006
Figure 7. Effect of pH on the adsorption of Cd2+ ion on K-Ac.
Materials 12 00241 g007
Figure 8. (A) Effect of contact time for Cd2+ adsorption by K-Ac; (B) adsorption kinetics of Cd2+-fitted quasi-first-order rate model; (C) adsorption kinetics of Cd2-fitted quasi-second-order rate model.
Materials 12 00241 g008
Figure 9. (A) Effect of initial concentration for Cd2+ adsorption by K-Ac; (B) Langmuir; (C) Freundlich.
Materials 12 00241 g009
Figure 10. Adsorption capacity of K-Ac examined in heavy metal ion Cu2+, Cr6+, and Cd2+ solution; (A) total adsorption amount of elements in ternary systems and single adsorption capacity of each ion in single system; (B) single-element adsorption amount of Cd2+ and Cr6+ in different systems.
Materials 12 00241 g010
Table 1. The specific surface area parameter of as-prepared samples.
SampleSurface Area (m2/g)Pore Volume (cm3/g)Average Pore Radius (nm)
PS40.0141.349
CPS370.1433.831
K-Ac31602.3821.351
Table 2. The kinetic parameters of the quasi-first-order (QF) and quasi-second-order (QS) models on the adsorption of Cd2+.
SampleQFQS
K-AcK1/(1/min)R2K2/(mg/g·min)R2
0.0660.9958719.7230.91054
Table 3. Adsorption isotherm model parameters.
SampleLangmuirFreundlich
K-AcKLR2RLnKFR2
0.0160.97370.8621.0111.8290.93716