Influence of Thermal Parameters Related to Destabilization Treatments on Erosive Wear Resistance and Microstructural Variation of White Cast Iron Containing 18% Cr. Application of Design of Experiments and Rietveld Structural Analysis


Abstract
1. Introduction
2. Materials and Methods
- The Vickers hardness. The applied load was of 981 N, while the hardness value was the average value obtained from 10 indentations.
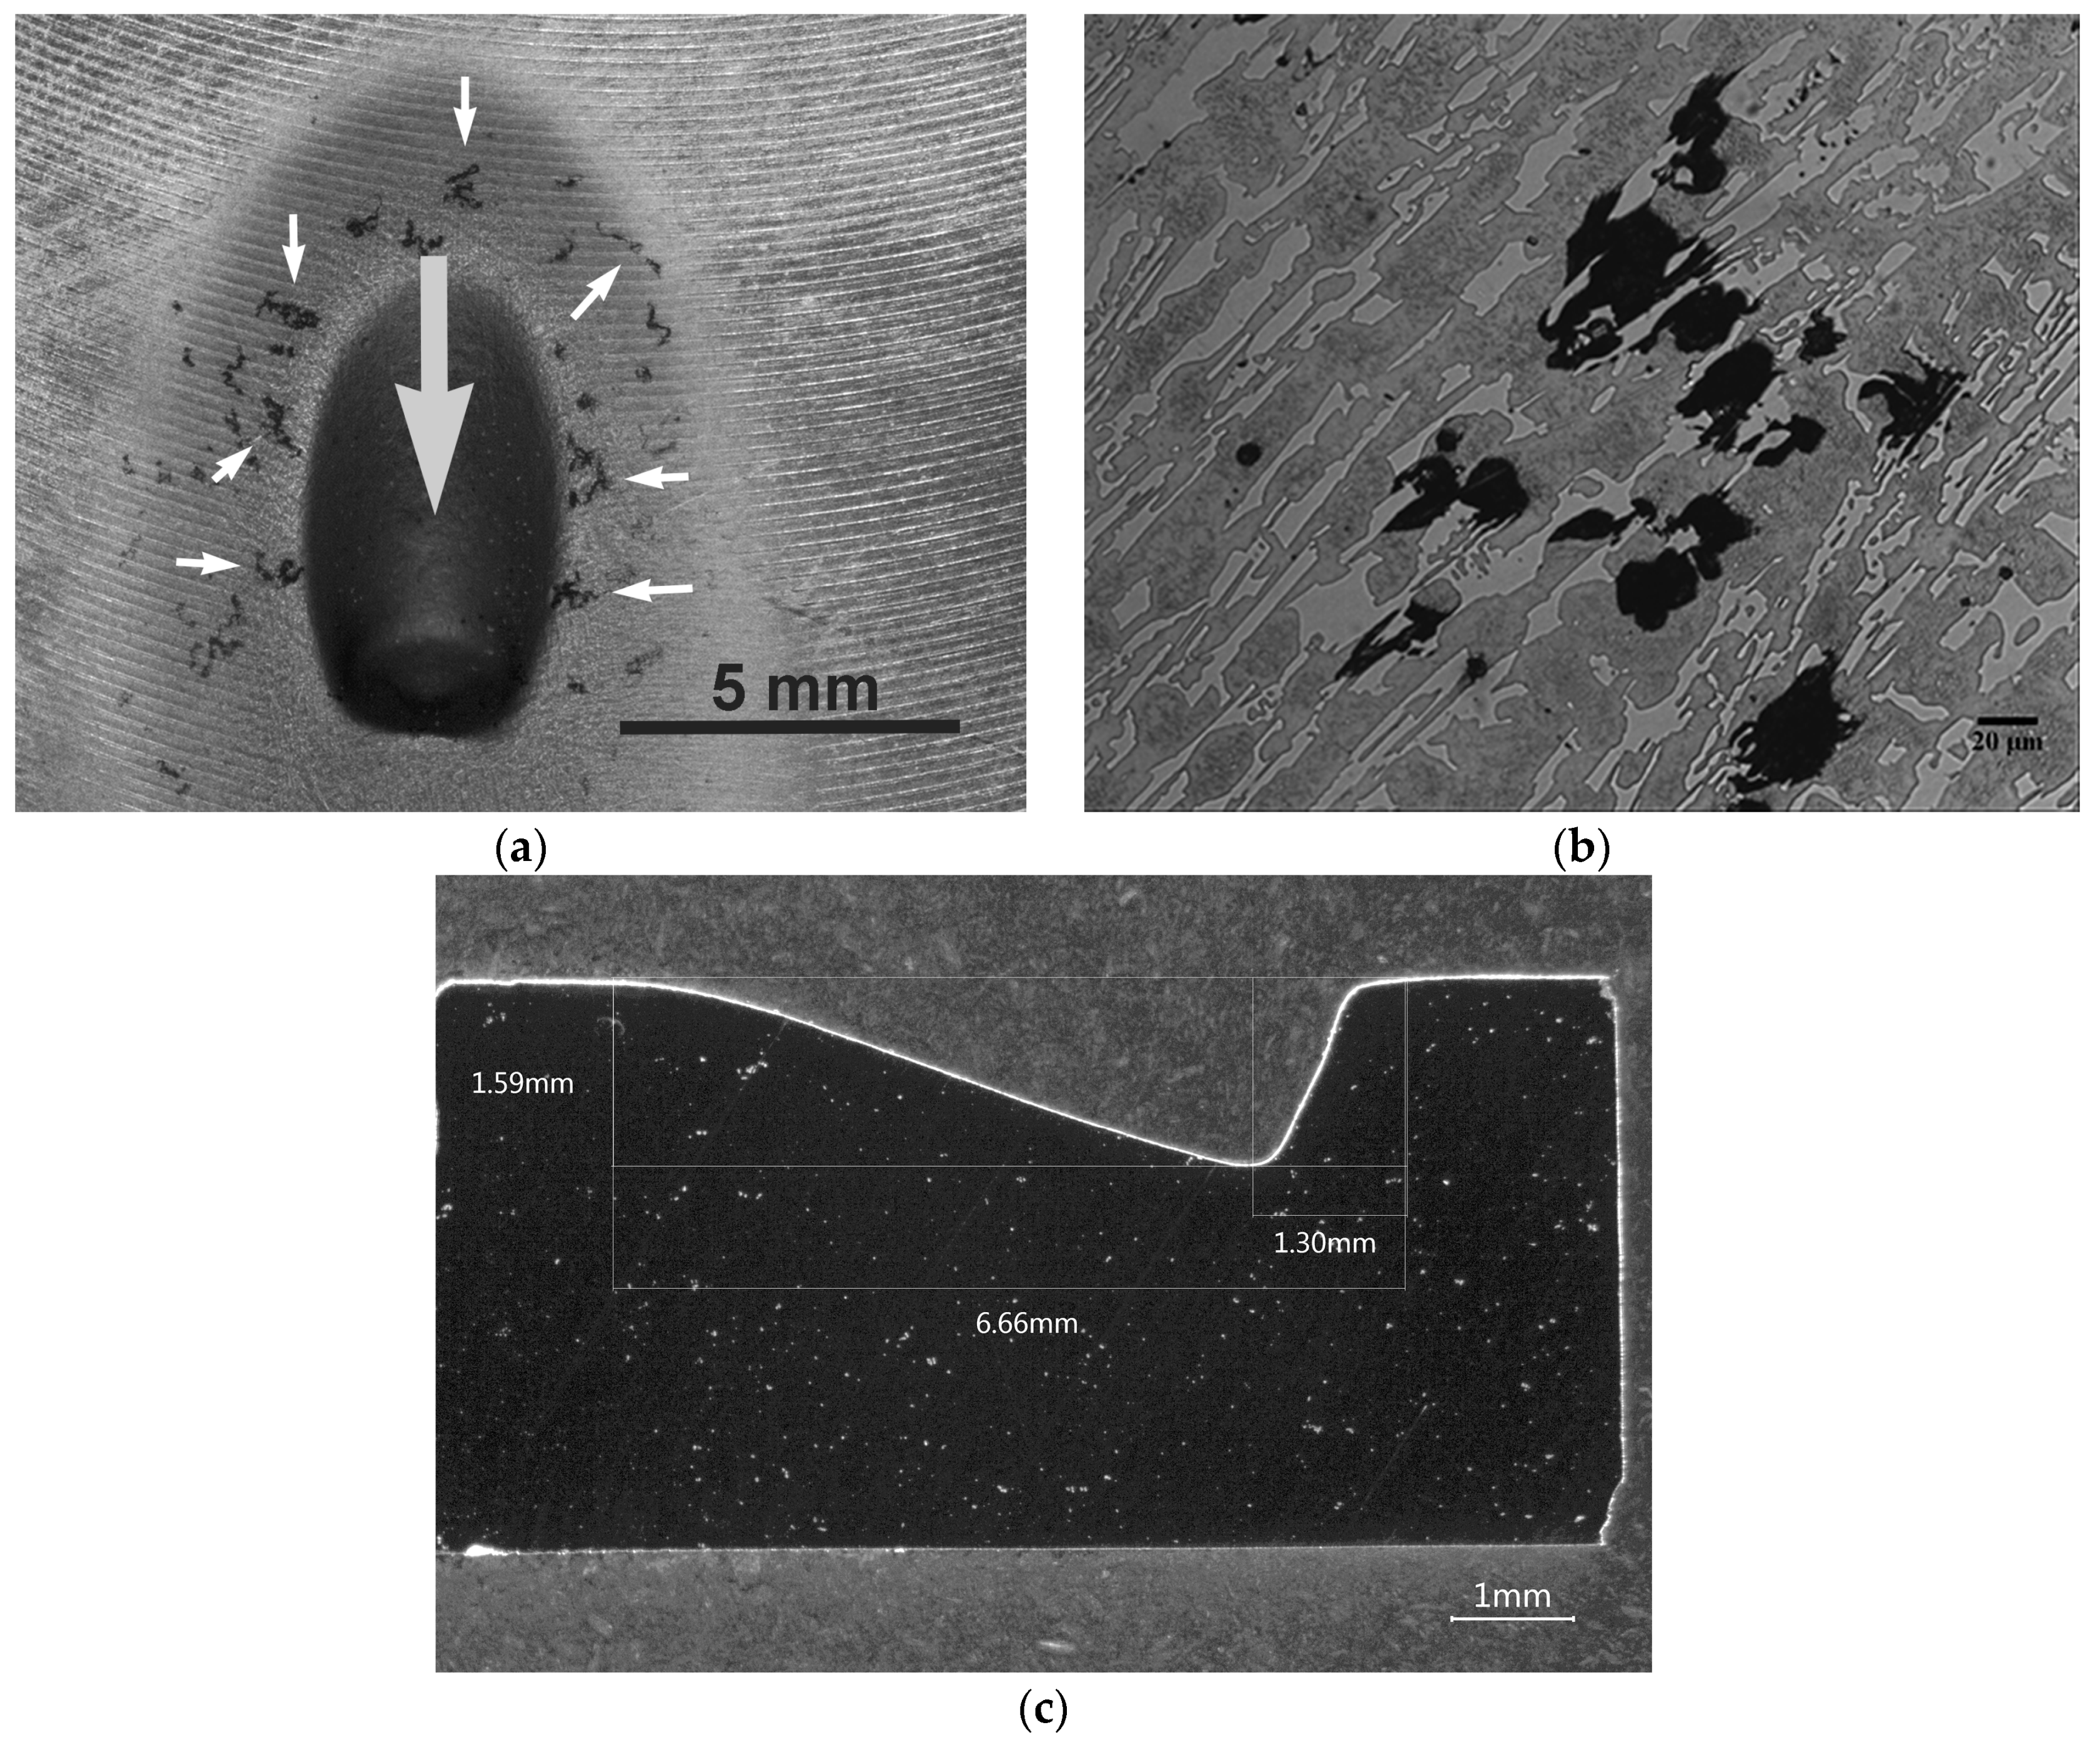
- Erosive wear resistance. This test was carried out as per ASTM G76 [21] by means of compressed air blasting with corundum particles, applying a pressure of 4 bar, a flow rate of 120 g/min and a 30° angle of incidence on the sample surface. Three repetitions were performed per test. The duration of each test was 1 min. The abrasive particles were 50 microns in size and had an angular surface.
- The following microstructural variables:
- ▪
- Percentage by weight of austenite
- ▪
- Percentage by weight of martensite
- ▪
- Percentage by weight of carbides
- ▪
- Volume of the austenite crystal cell
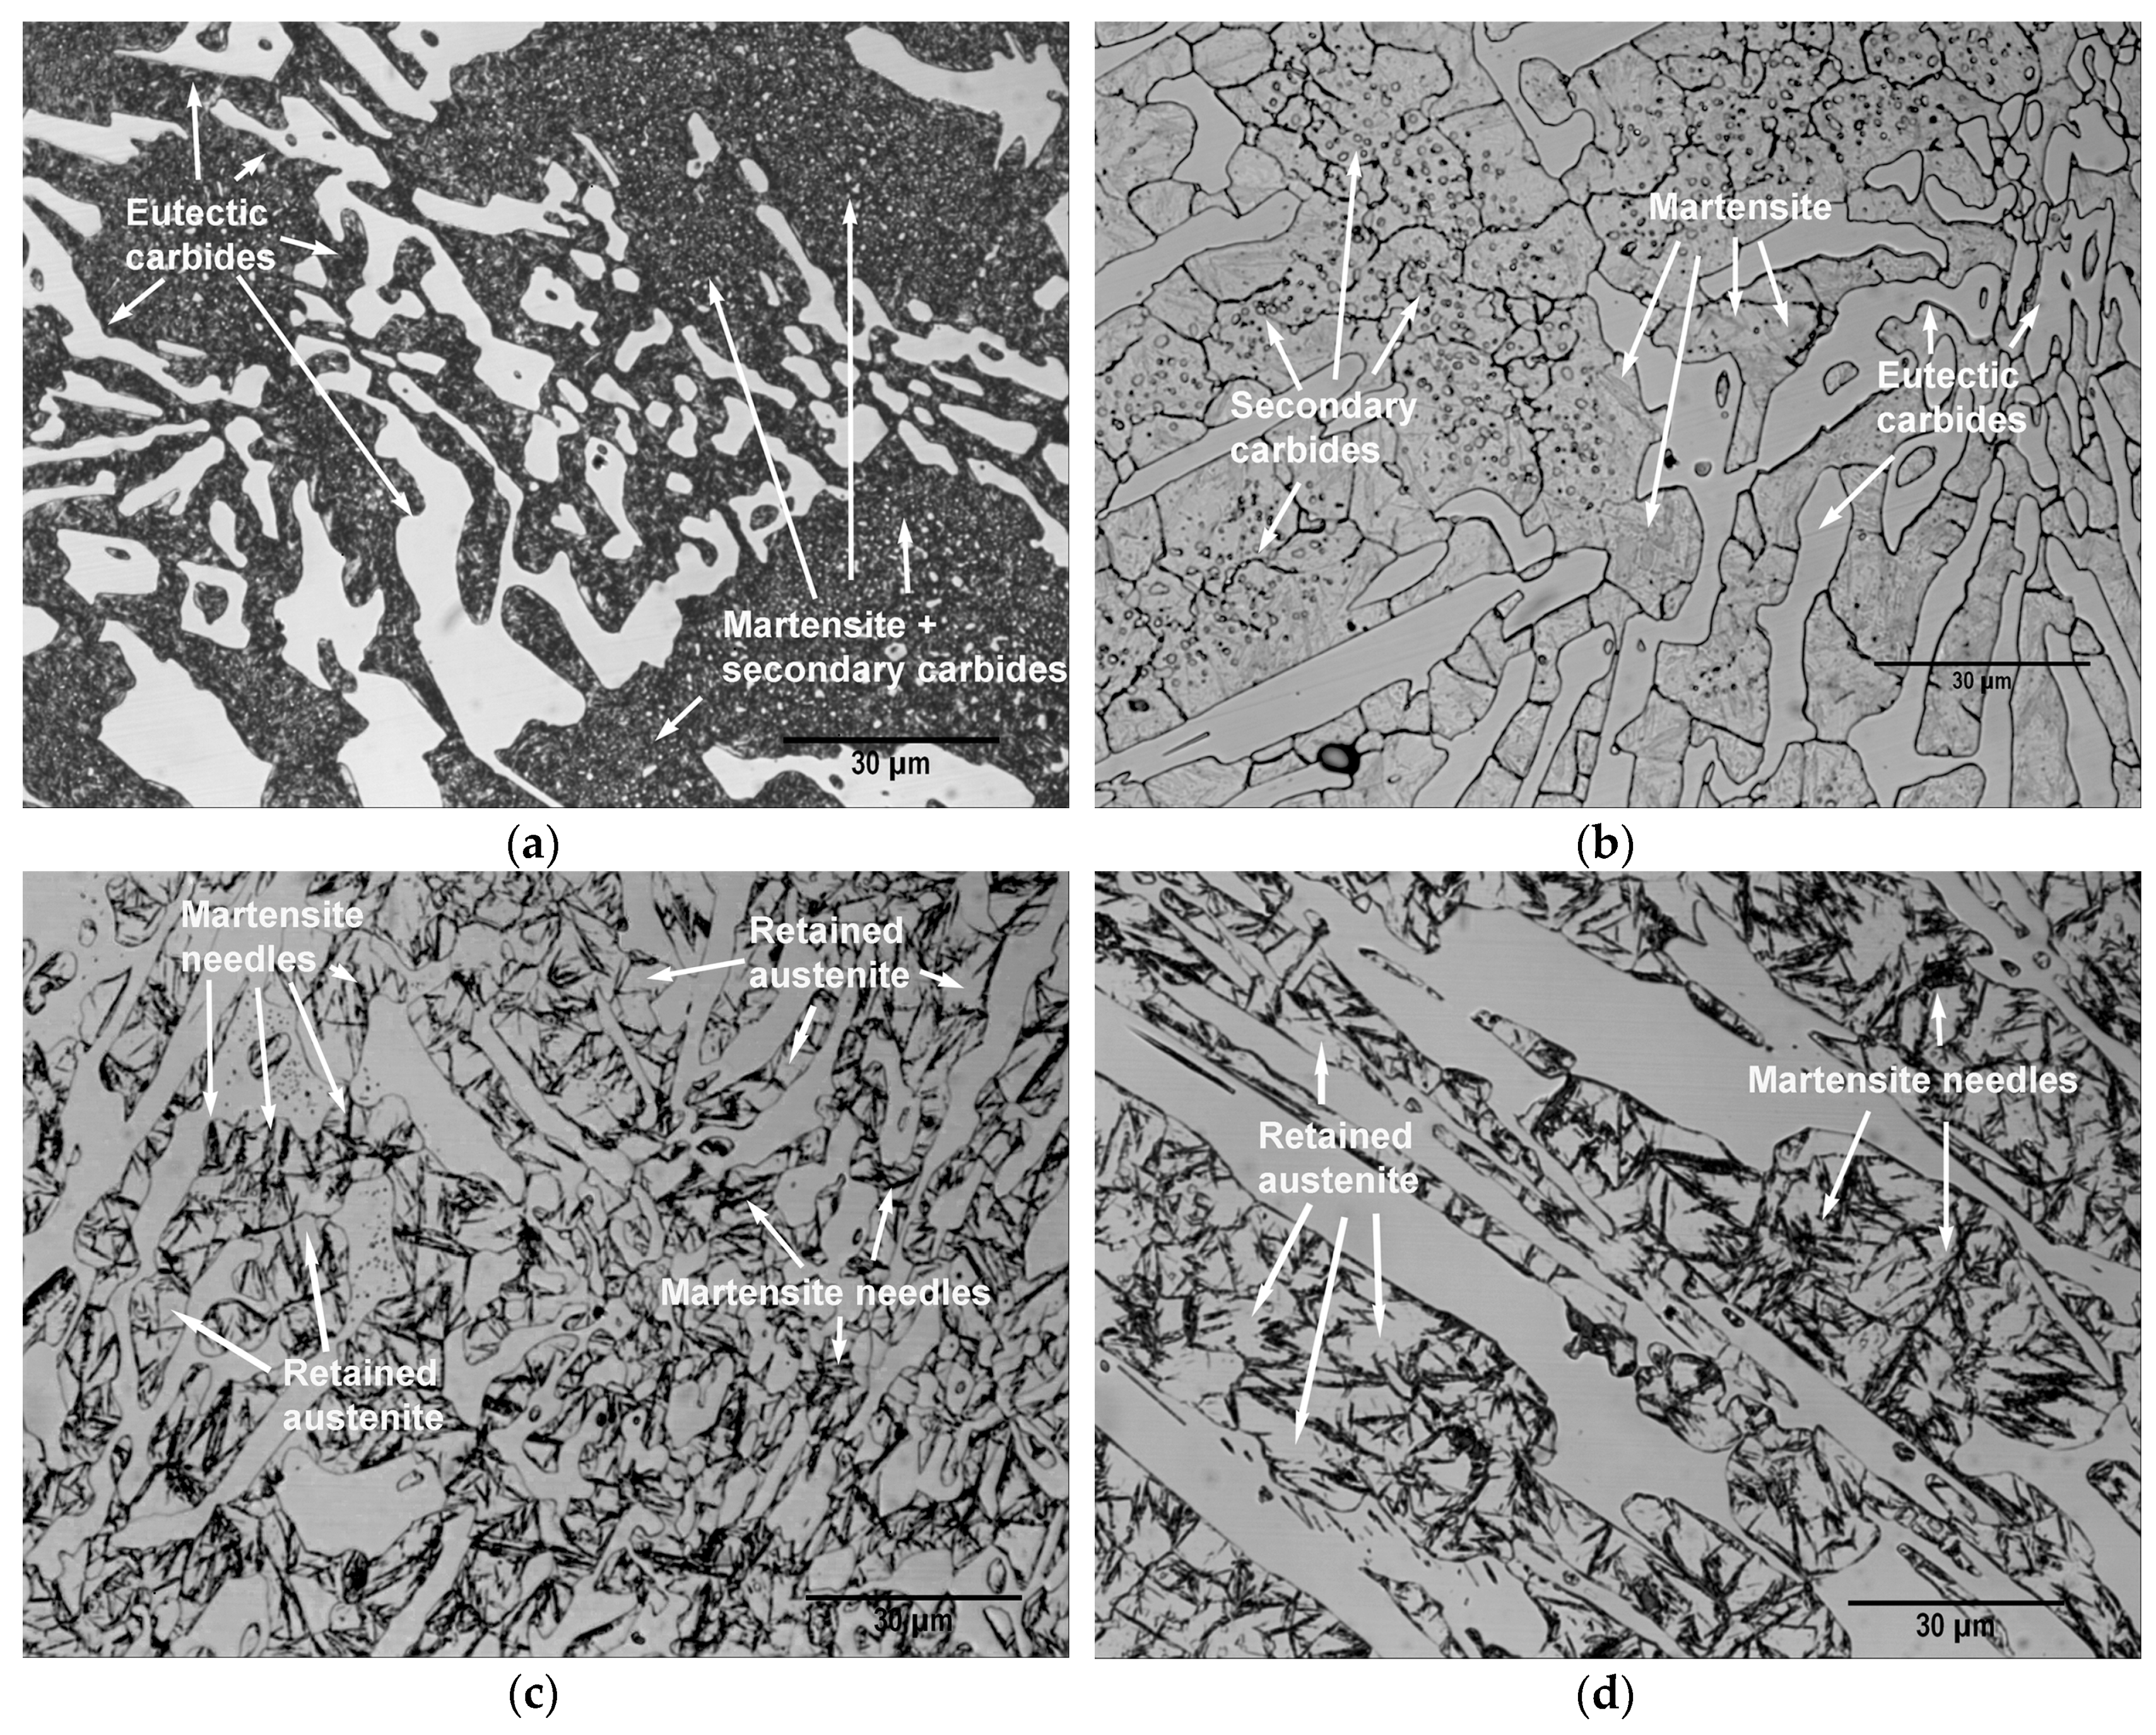
3. Results and Discussion
4. Conclusions
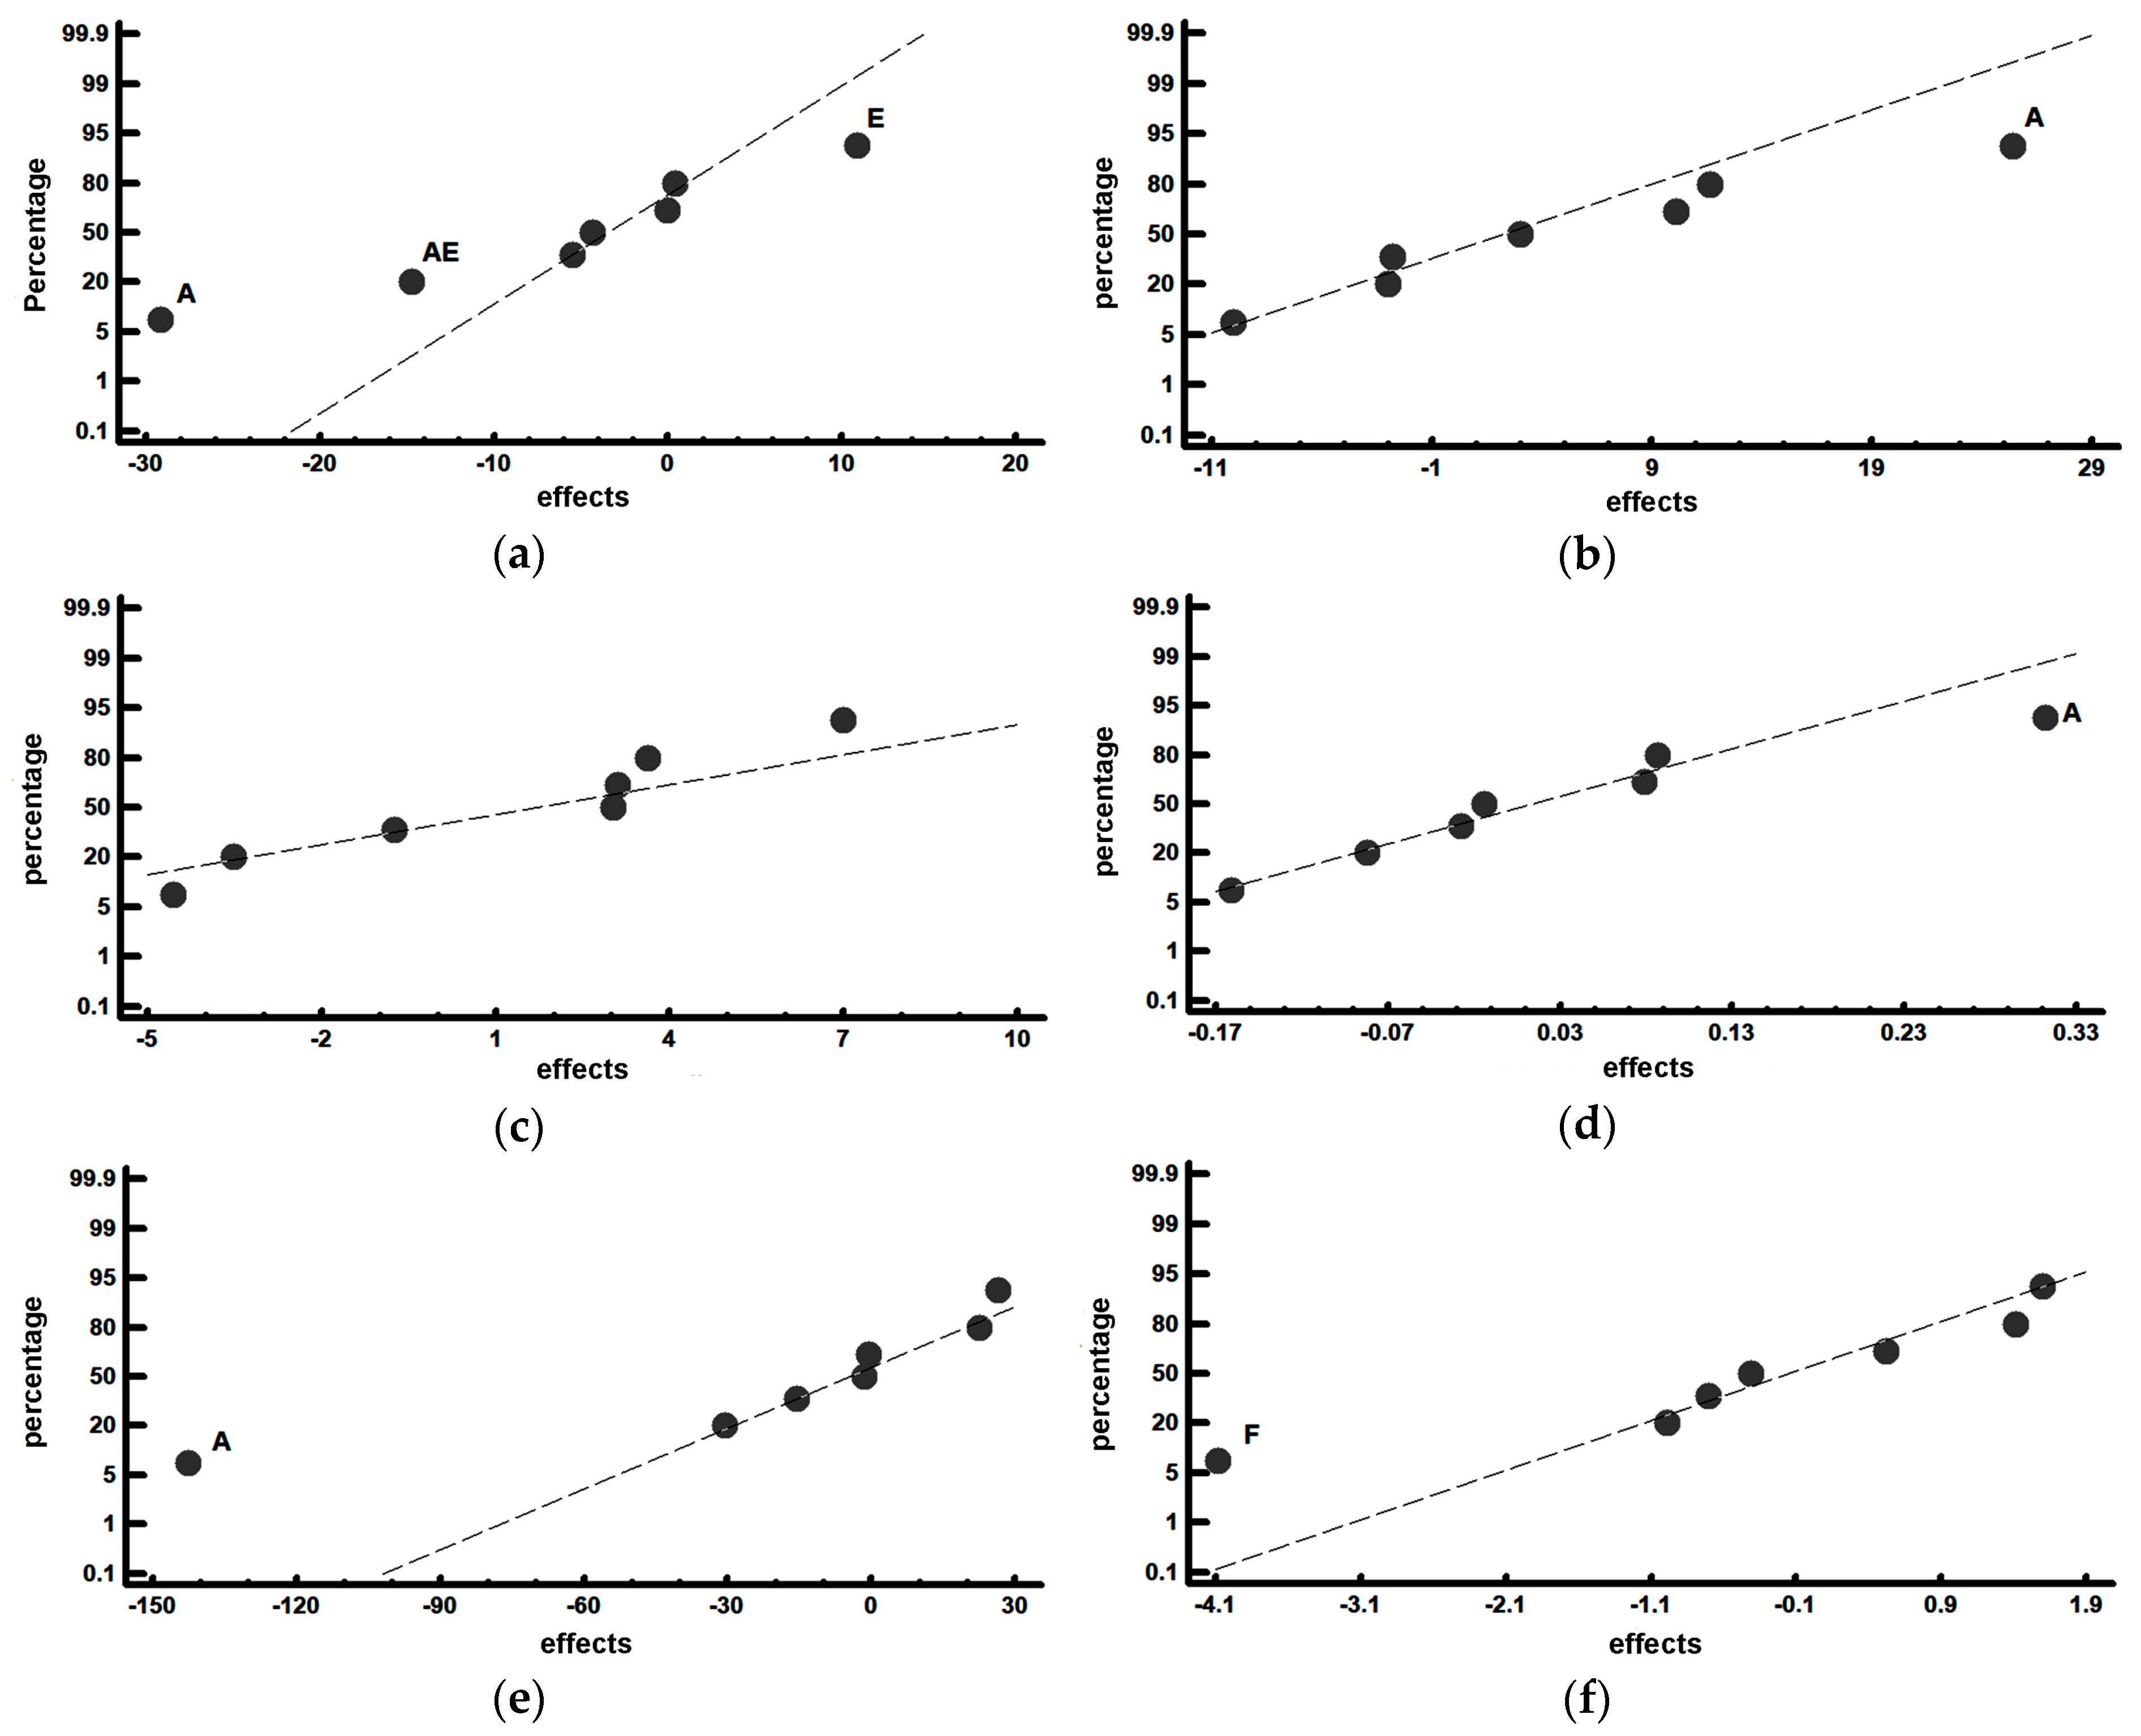
- The severity of the quench cooling medium does not significantly influence hardness, erosive wear resistance or the proportion of martensite or retained austenite.
- The destabilization temperature is a key factor with respect to the percentage of retained austenite. In order to increase the amount of martensite and decrease the amount of retained austenite, low destabilization temperatures not exceeding 1000 °C are required. An increase of 100 °C in the destabilization temperature can lead to a 25% increase in retained austenite.
- Moreover, tempering temperatures of around 500 °C favour an additional increase in the percentage of martensite.
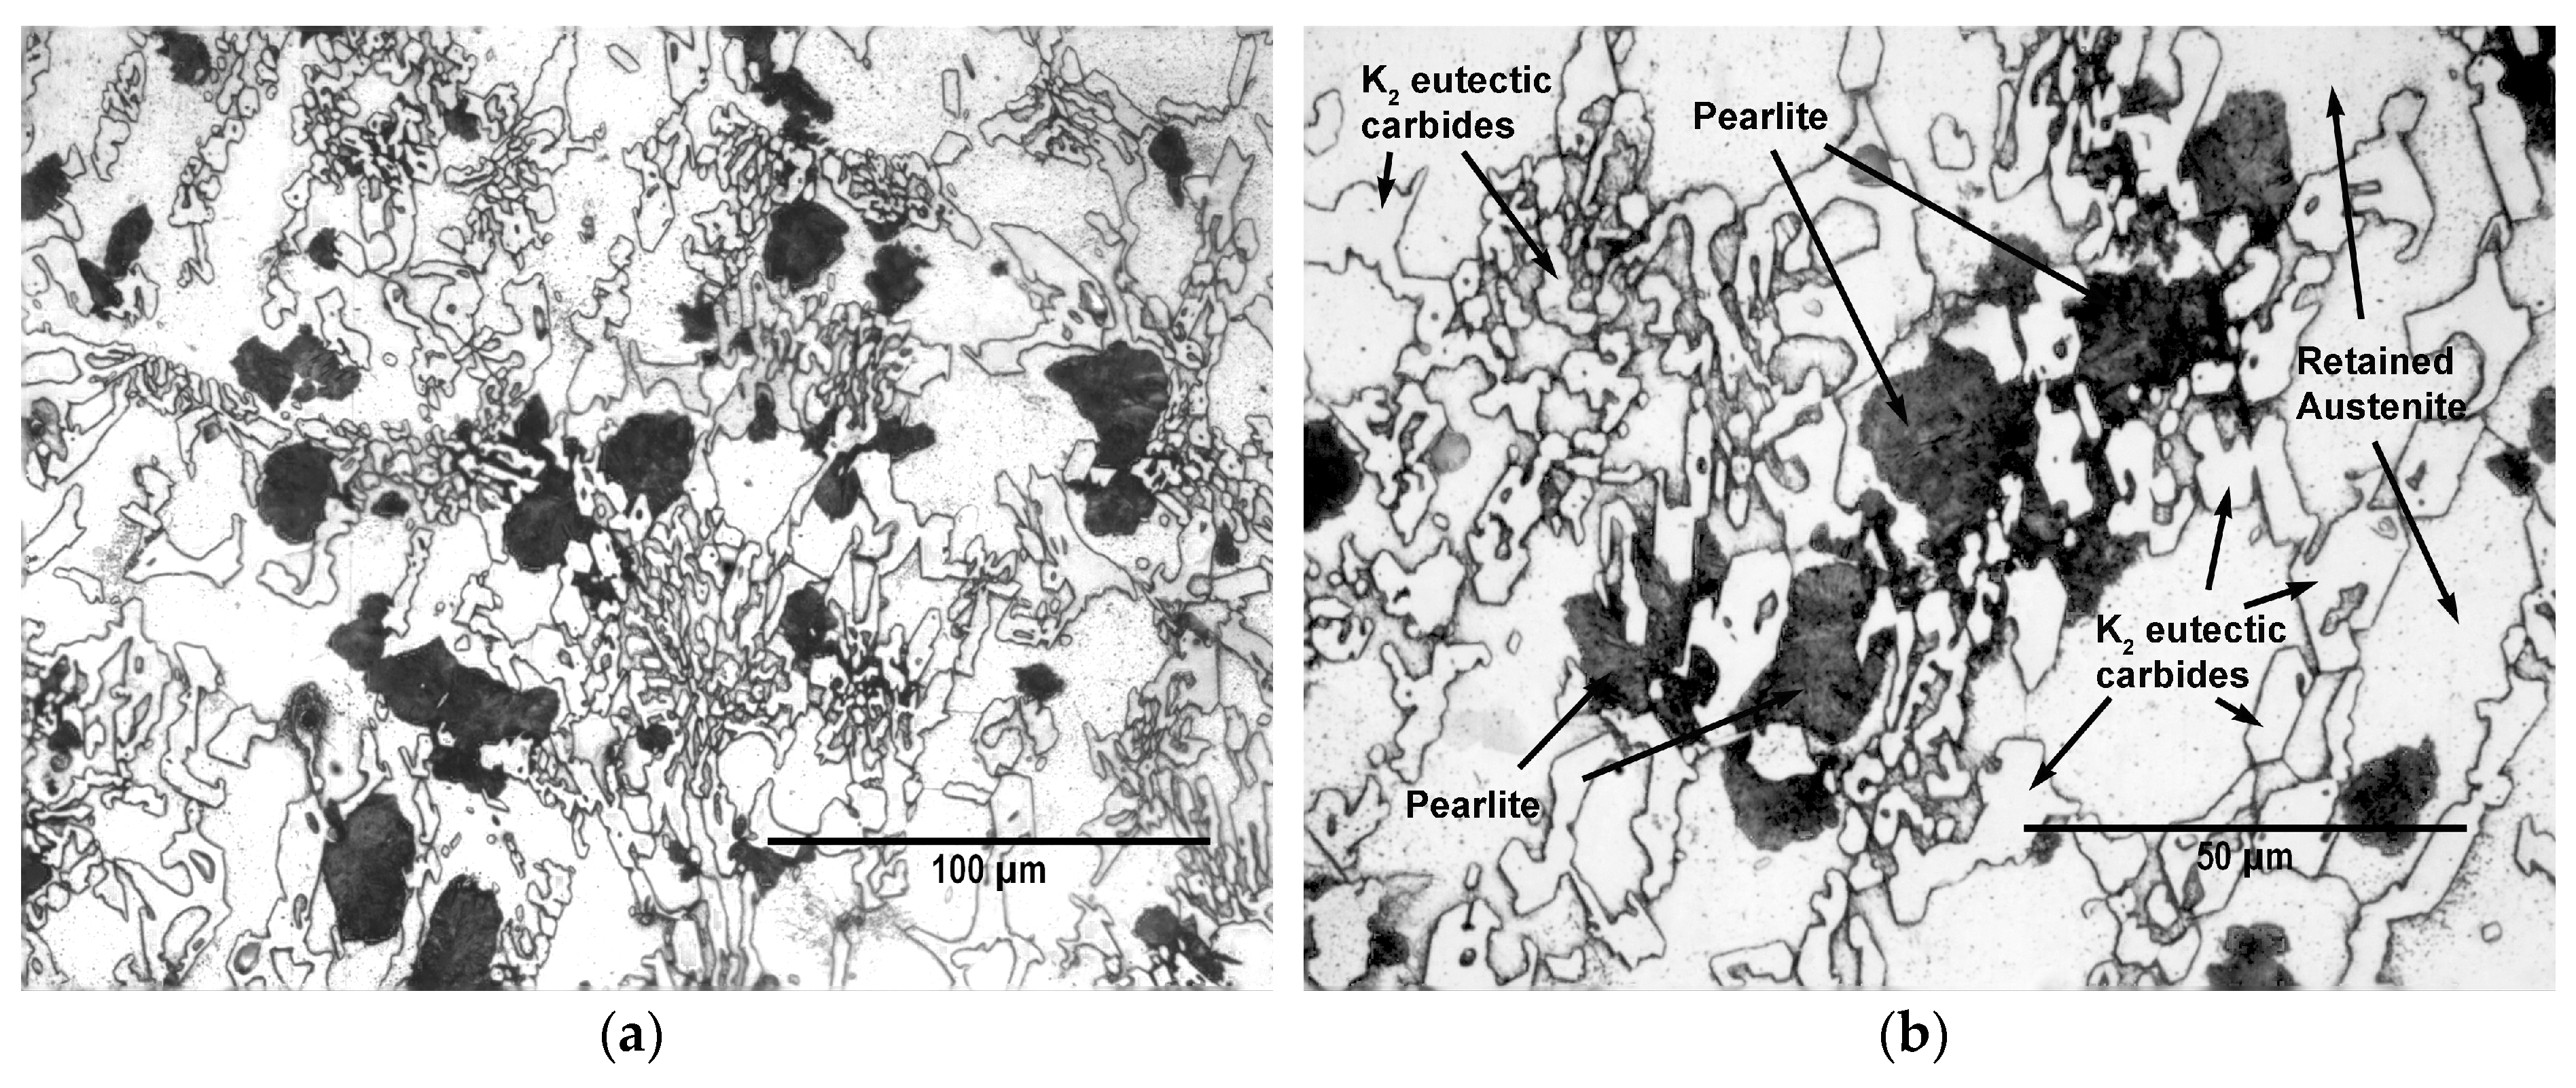
- Erosive wear commences on the matrix constituent without initially affecting the eutectic carbides. Once the deterioration of the matrix constituent surrounding these carbides occurs, they are released.
- Long tempering times, of around 6 h, provide an increase in resistance to erosive wear due to a second destabilization of austenite during the said tempering. This destabilization delays the deterioration of the matrix constituent.
Author Contributions
Funding
Conflicts of Interest
References
- Maja, M. Effect of niobium on the solidification structure and properties of hypoeutectic high-chromium white cast irons. J. South. Afr. Inst. Min. Met. 2016, 116, 981–986. [Google Scholar] [CrossRef]
- Hadji, A.; Bouhamla, K.; Maouche, H. Improving Wear Properties of High-Chromium Cast Iron by Manganese Alloying. Int. J. Met. 2016, 10, 43–55. [Google Scholar] [CrossRef]
- Pearce, J.T.H. Structural characterisation of high chromium cast irons. In Proceedings of the International Conference on Solidification Science and Processing: Outlook for the 21st Century, Bangalore, India, 18–21 February 2001. [Google Scholar]
- Antolin, J.F.A.; Garrote, L.F.; Lozano, J.A. Application of Rietveld Refinement to the correlation of the microstructure evolution of white cast irons with 18 and 25%-wt. Cr after oil quench and successive temper treatments, with abrasive wear and bending testing. Rev. De Metal. 2018, 54, 11. [Google Scholar] [CrossRef]
- Pero-Sanz Elorz, J.A. Ciencia e Ingeniería de Materiales, 5th ed.; Cie Inversiones Editoriales-Dossat: Madrid, Spain, 2000; p. 673. [Google Scholar]
- Powell, G.L.F.; Bee, J.V. Secondary carbide precipitation in an 18 wt%Cr-1 wt% Mo white iron. J. Mater. Sci. 1996, 31, 707–711. [Google Scholar] [CrossRef]
- Sun, Z.; Zuo, R.; Li, C.; Shen, B.; Yan, J.; Huang, S. TEM study on precipitation and transformation of secondary carbides in 16Cr–1Mo–1Cu white iron subjected to subcritical treatment. Mater. Charact. 2004, 53, 403–409. [Google Scholar] [CrossRef]
- Gasan, H.; Erturk, F. Effects of a Destabilization Heat Treatment on the Microstructure and Abrasive Wear Behavior of High-Chromium White Cast Iron Investigated Using Different Characterization Techniques. Met. Mater. Trans. A 2013, 44, 4993–5005. [Google Scholar] [CrossRef]
- Guitar, M.A.; Suárez, S.; Prat, O.; Guigou, M.D.; Gari, V.; Pereira, G.; Mücklich, F. High Chromium Cast Irons: Destabilized-Subcritical Secondary Carbide Precipitation and Its Effect on Hardness and Wear Properties. J. Mater. Eng. Perform. 2018, 27, 3877–3885. [Google Scholar] [CrossRef]
- Wiengmoon, A.; Pearce, J.; Chairuangsri, T. Relationship between microstructure, hardness and corrosion resistance in 20wt.%Cr, 27wt.%Cr and 36wt.%Cr high chromium cast irons. Mater. Chem. Phys. 2011, 125, 739–748. [Google Scholar] [CrossRef]
- Bedolla-Jacuide, A.; Arias, L.; Hernandez, B.; Jacuinde, A.B. Kinetics of Secondary Carbides Precipitation in a High-Chromium White Iron. J. Mater. Eng. Perform. 2003, 12, 371–382. [Google Scholar] [CrossRef]
- Efremenko, V.; Shimizu, K.; Chabak, Y. Effect of Destabilizing Heat Treatment on Solid-State Phase Transformation in High-Chromium Cast Irons. Met. Mater. Trans. A 2013, 44, 5434–5446. [Google Scholar] [CrossRef]
- Yang, H.-S.; Jun, W.; Bao-Luo, S.; Hao-Huai, L.; Sheng-Ji, G.; Si-Jiu, H. Effect of cryogenic treatment on the matrix structure and abrasion resistance of white cast iron subjected to destabilization treatment. Wear 2006, 261, 1150–1154. [Google Scholar] [CrossRef]
- Bedolla-Jacuinde, A.; Guerra, F.V.; Mejia, I.; Zuno-Silva, J.; Maldonado, C. Boron effect on the precipitation of secondary carbides during destabilisation of high chromium white iron. Int. J. Cast Met. Res. 2016, 29, 55–61. [Google Scholar] [CrossRef]
- Gonzalez-Pociño, A.; Alvarez-Antolin, F.; Asensio-Lozano, J. Erosive Wear Resistance Regarding Different Destabilization Heat Treatments of Austenite in High Chromium White Cast Iron, Alloyed with Mo. Metals 2019, 9, 522. [Google Scholar] [CrossRef]
- Opapaiboon, J.; Sricharoenchai, P.; Inthidech, S.; Matsubara, Y. Effect of Carbon Content on Heat Treatment Behavior of Multi-Alloyed White Cast Iron for Abrasive Wear Resistance. Mater. Trans. 2015, 56, 720–725. [Google Scholar] [CrossRef]
- Liu, Z.L.; Li, Y.X.; Chen, X. Effect of tempering temperature on microstructure and mechanical properties of high boron white cast iron. China Foundry 2012, 9, 313–317. [Google Scholar]
- Opapaiboon, J.; Na Ayudhaya, M.S.; Sricharoenchai, P.; Inthidech, S.; Matsubara, Y. Effect of Chromium Content on Heat Treatment Behavior of Multi-Alloyed White Cast Iron for Abrasive Wear Resistance. Mater. Trans. 2019, 60, 346–354. [Google Scholar] [CrossRef]
- Li, D.; Liu, L.; Zhang, Y.; Ye, C.; Ren, X.; Yang, Y.; Yang, Q. Phase diagram calculation of high chromium cast irons and influence of its chemical composition. Mater. Des. 2009, 30, 340–345. [Google Scholar] [CrossRef]
- Prat-Bartés, A.; Tort-Martorell, X.; Grima-Cintas, P.; Pozueta-Fernández, L.; Solé-Vidal, I. Métodos Estadísticos, 2nd ed.; UPC: Barcelona, Spain, 2004; pp. 127–200. [Google Scholar]
- ASTM G76-18. Standard Test Method for Conducting Erosion Tests by Solid Particle Impingement Using Gas Jets; ASTM International: West Conshohocken, PA, USA, 2018. [Google Scholar]


| C | Si | Mn | Cr | Mo |
|---|---|---|---|---|
| 2.9 | 1.2 | 0.8 | 18.1 | 1.8 |
| Factors | Levels | |||
|---|---|---|---|---|
| Code | Description of the Factors | Units | −1 Level | +1 Level |
| A | Destabilization temperature of austenite | °C | 1000 | 1100 |
| B | Dwell time at the destabilization temperature | h | 4 | 8 |
| C | Number of tempers | – | 1 | 2 |
| D | Quench cooling medium | – | air | oil |
| E | Tempering temperature | °C | 200 | 500 |
| F | Tempering time (h) | h | 3 | 6 |
| No. | A | B | C | D | E | F | Restricted Confounding Pattern |
|---|---|---|---|---|---|---|---|
| 1 | −1 | −1 | −1 | +1 | +1 | +1 | A + BD + CE B + AD + CF C + AE + BF D + AB + EF E + AC + DF F + BC + DE AF + BE + CD |
| 2 | +1 | −1 | −1 | −1 | −1 | +1 | |
| 3 | −1 | +1 | −1 | −1 | +1 | -1 | |
| 4 | +1 | +1 | −1 | +1 | −1 | -1 | |
| 5 | −1 | −1 | +1 | +1 | −1 | -1 | |
| 6 | +1 | −1 | +1 | −1 | +1 | -1 | |
| 7 | −1 | +1 | +1 | −1 | −1 | +1 | |
| 8 | +1 | +1 | +1 | +1 | +1 | +1 |
| No. | (111) | (200) | (222) | |||
|---|---|---|---|---|---|---|
| 2θ (°) | I | 2θ (°) | I | 2θ (°) | I | |
| 1 | 43.657 | 2115 | 49.893 | 83 | 74.581 | 133 |
| 2 | 43.472 | 8041 | 50.395 | 737 | 74.438 | 367 |
| 3 | 44.110 | 4967 | 50.117 | 148 | 74.565 | 114 |
| 4 | 43.430 | 8417 | 50.183 | 575 | 74.562 | 121 |
| 5 | 43.529 | 5346 | 50.176 | 268 | 74.275 | 119 |
| 6 | 43.462 | 6454 | 50.276 | 532 | 74.171 | 95 |
| 7 | 43.466 | 6238 | 50.103 | 128 | 74.263 | 92 |
| 8 | 43.483 | 8096 | 49.469 | 116 | 74.368 | 217 |
| No. | (110) | (200) | (211) | |||
|---|---|---|---|---|---|---|
| 2θ (°) | I | 2θ (°) | I | 2θ (°) | I | |
| 1 | 44.501 | 12203 | 64.743 | 270 | 82.118 | 1158 |
| 2 | 44.447 | 3817 | 65.095 | 183 | 82.632 | 319 |
| 3 | 44.498 | 6010 | 64.631 | 434 | 82.044 | 956 |
| 4 | 44.353 | 3029 | 64.733 | 180 | 82.142 | 224 |
| 5 | 44.431 | 6427 | 64.874 | 171 | 82.120 | 778 |
| 6 | 44.418 | 3521 | 67.232 | 108 | 82.167 | 383 |
| 7 | 44.438 | 5827 | 64.898 | 106 | 82.165 | 381 |
| 8 | 44.479 | 3675 | 64.926 | 104 | 82.374 | 321 |
| No. | 2θ (°) | I | 2θ (°) | I |
|---|---|---|---|---|
| 1 | 39.417 | 1032 | 52.358 | 317 |
| 2 | 39.413 | 1035 | 52.391 | 399 |
| 3 | 39.354 | 814 | 52.356 | 148 |
| 4 | 39.351 | 378 | 52.292 | 186 |
| 5 | 39.354 | 731 | 52.219 | 175 |
| 6 | 39.337 | 591 | 52.358 | 317 |
| 7 | 39.405 | 798 | 52.319 | 163 |
| 8 | 39.413 | 803 | 52.405 | 221 |
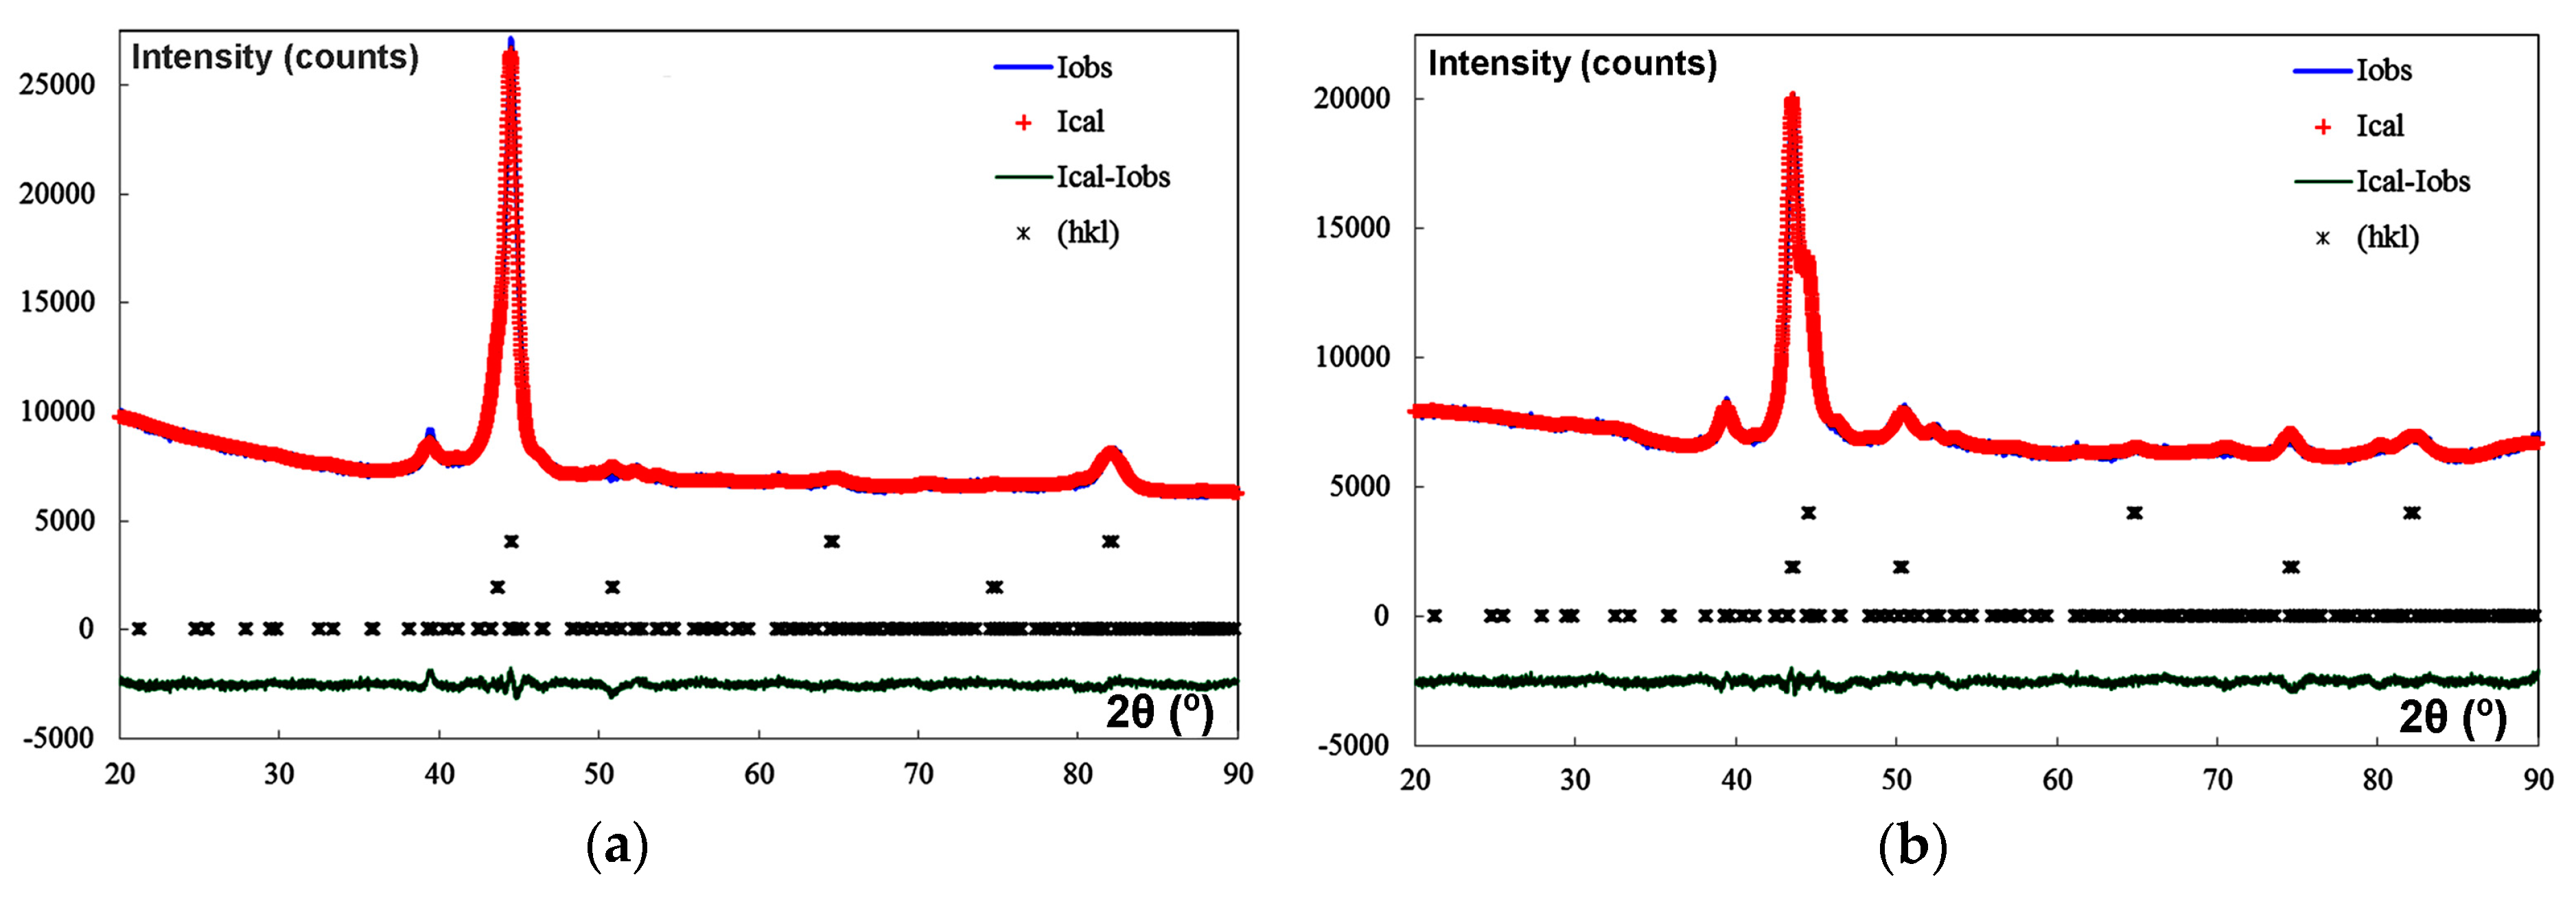
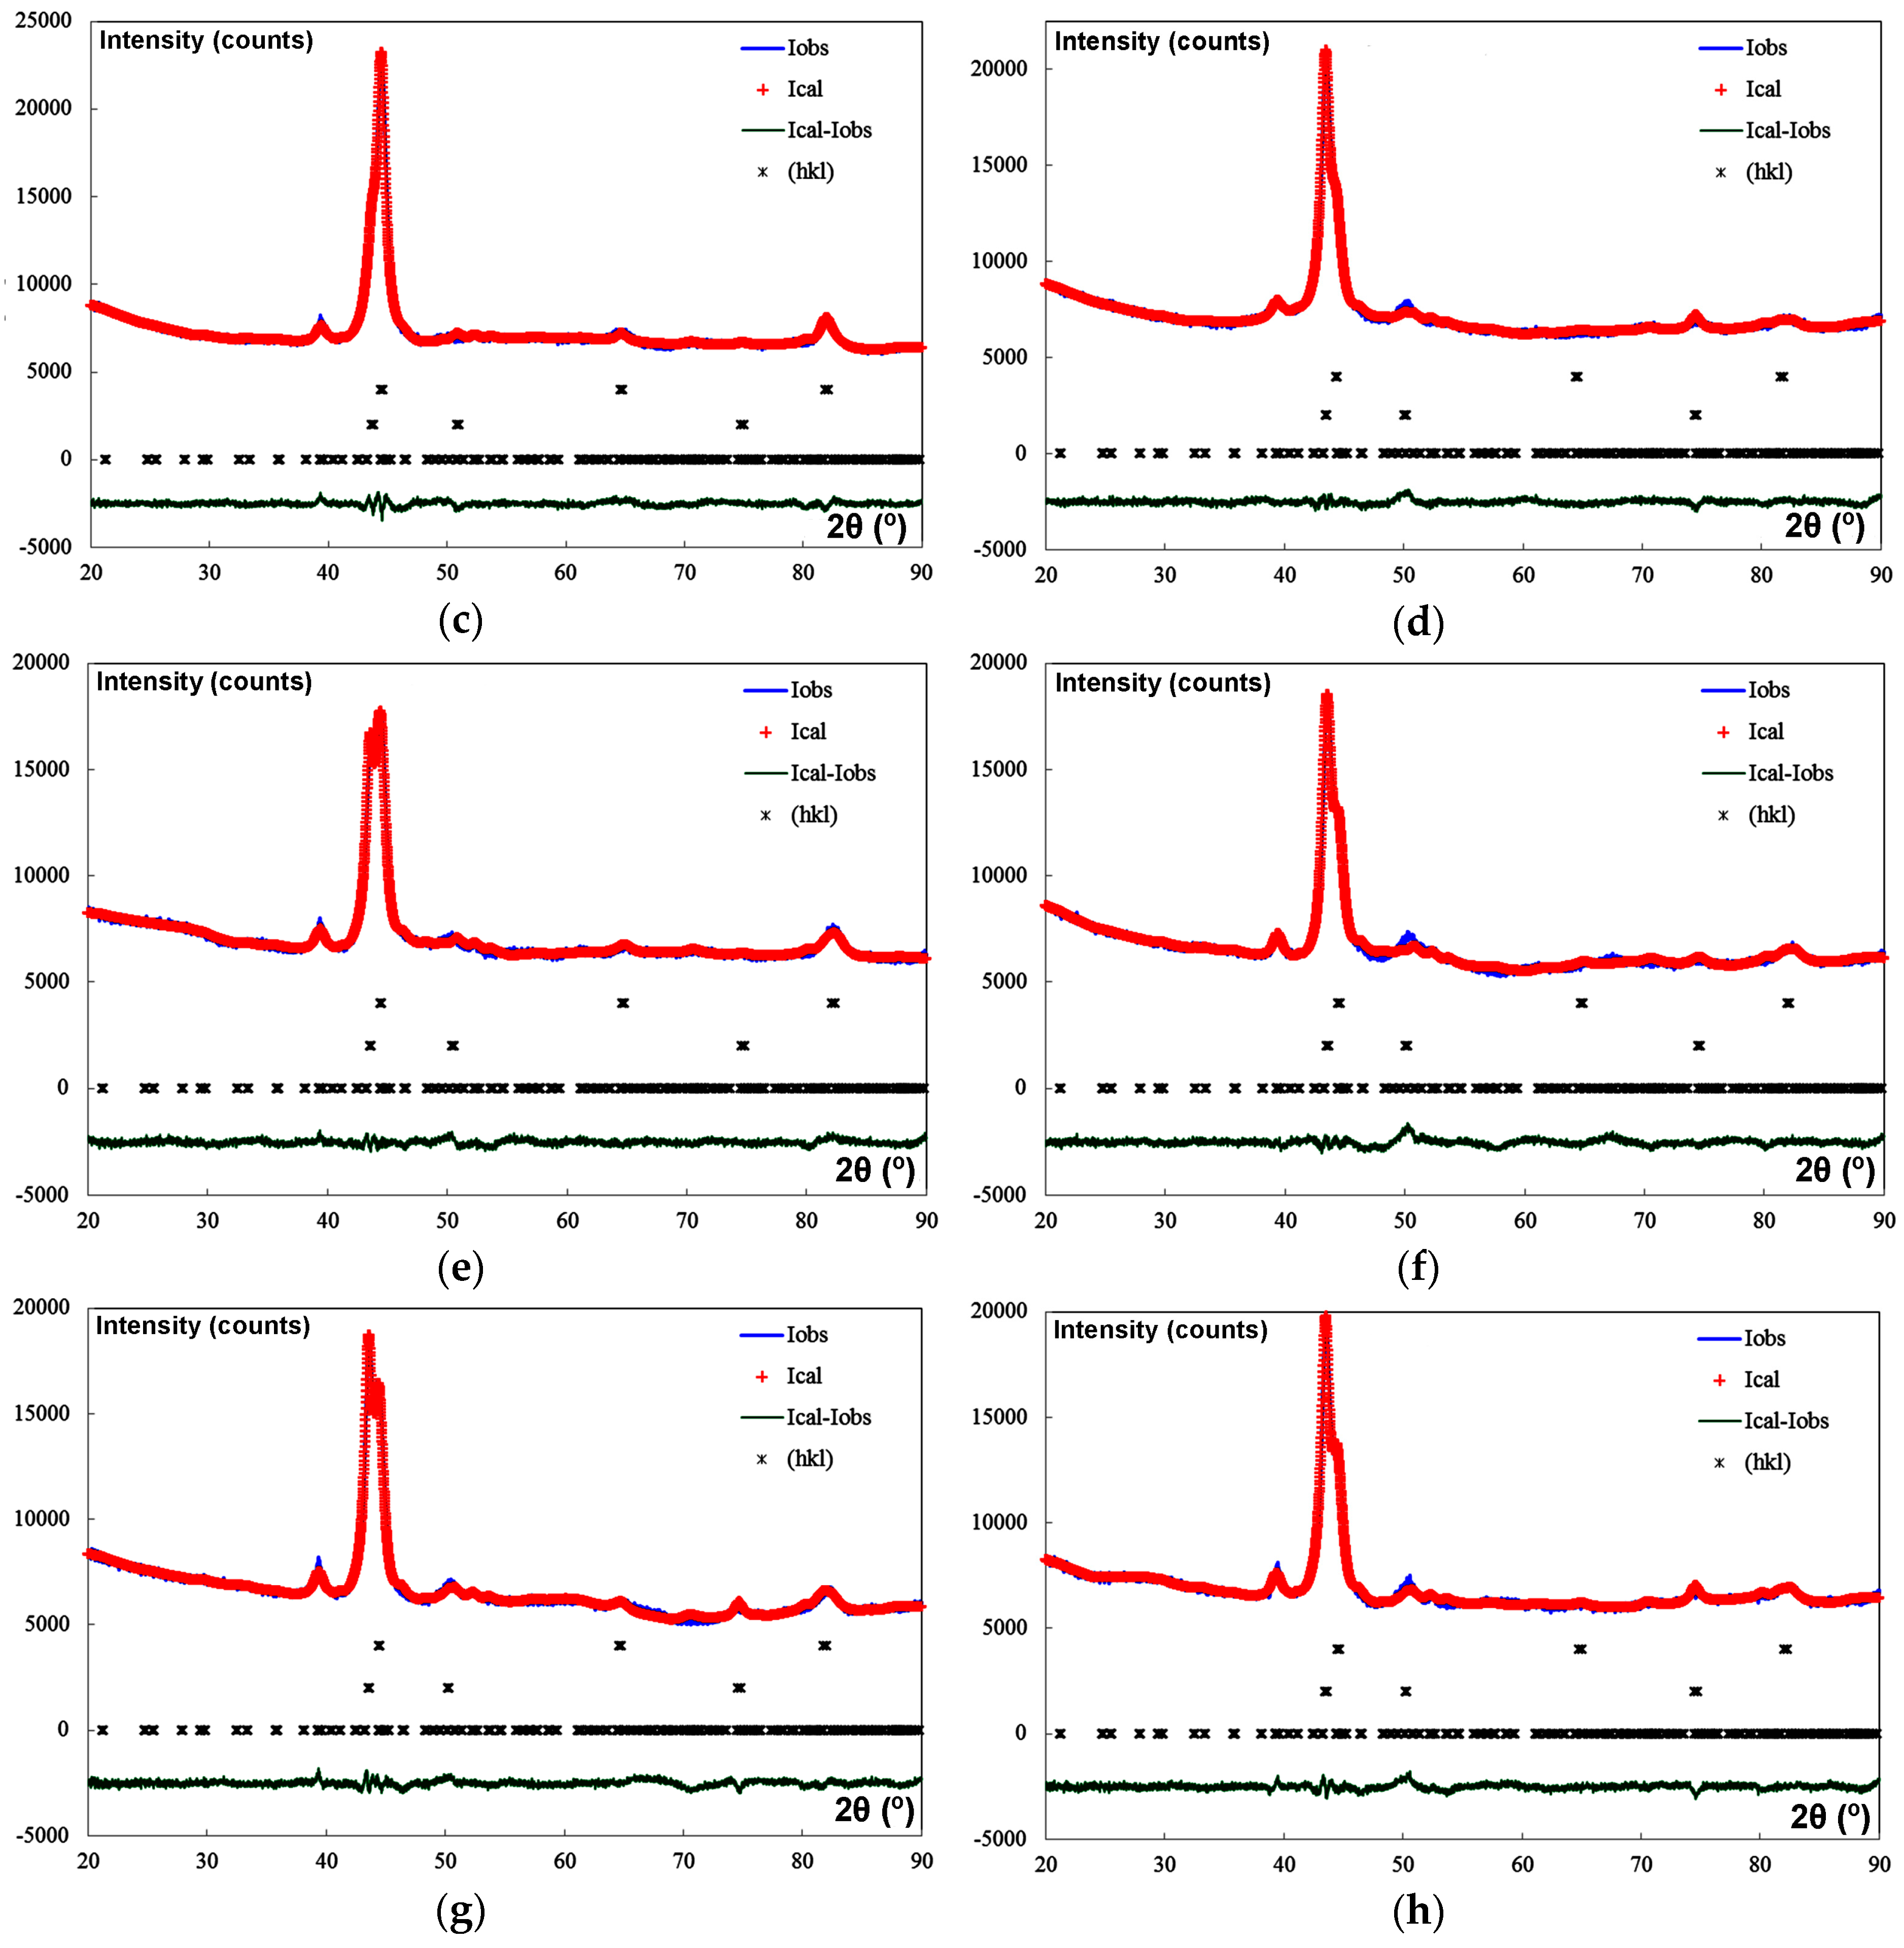
| No. | Rietveld Fitting | Phases | a (Å) | b (Å) | c (Å) | wt. % | Vol. (Å3) |
|---|---|---|---|---|---|---|---|
| 1 | Rwp = 9.54 Rexp = 6.67 Chi2 = 2.05 | Martensite | 2.87643 | - | - | 50.48 ± 1.59 | - |
| Austenite | 3.59057 | - | - | 12.76 ± 1.17 | 46.290 ± 0.019 | ||
| K2 carbide | 4.46111 | 6.99491 | 12.10891 | 36.76 ± 2.15 | - | ||
| 2 | Rwp = 10.1 Rexp = 7.25 Chi2 = 1.95 | Martensite | 2.87511 | - | - | 10.05 ± 0.86 | - |
| Austenite | 3.59862 | - | - | 42.2 ± 1.38 | 46.602 ± 0.004 | ||
| K2 carbide | 4.46111 | 6.99491 | 12.10891 | 47.74 ± 2.25 | - | ||
| 3 | Rwp = 10.0 Rexp = 6.72 Chi2 = 2.22 | Martensite | 2.87890 | - | - | 48.47 ± 1.61 | - |
| Austenite | 3.58676 | - | - | 19.69 ± 1.39 | 46.143 ± 0.013 | ||
| K2 carbide | 4.46111 | 6.99491 | 12.10891 | 31.83 ± 1.95 | - | ||
| 4 | Rwp = 11.4 Rexp = 7.71 Chi2 = 2.18 | Martensite | 2.88817 | - | - | 9.34 ± 1.14 | - |
| Austenite | 3.60308 | - | - | 61.09 ± 2.12 | 46.776 ± 0.005 | ||
| K2 carbide | 4.46111 | 6.99491 | 12.10891 | 29.57 ± 2.03 | - | ||
| 5 | Rwp = 10.5 Rexp = 7.37 Chi2 = 2.04 | Martensite | 2.88171 | - | - | 29.15 ± 1.32 | - |
| Austenite | 3.59555 | - | - | 34.22 ± 1.53 | 46.483 ± 0.007 | ||
| K2 carbide | 4.46111 | 6.99491 | 12.10891 | 36.63 ± 2.15 | - | ||
| 6 | Rwp = 13.4 Rexp = 7.5 Chi2 = 3.2 | Martensite | 2.87831 | - | - | 10.52 ± 0.99 | - |
| Austenite | 3.59951 | - | - | 49.58 ± 1.73 | 46.637 ± 0.005 | ||
| K2 carbide | 4.46111 | 6.99491 | 12.10891 | 39.91 ± 2.16 | - | ||
| 7 | Rwp=11.6 Rexp = 7.05 Chi2 = 2.69 | Martensite | 2.88122 | - | - | 19.01 ± 0.96 | - |
| Austenite | 3.58456 | - | - | 41.51 ± 1.36 | 46.445 ± 0.005 | ||
| K2 carbide | 4.46111 | 6.99491 | 12.10891 | 39.48 ± 2.05 | - | ||
| 8 | Rwp = 11.0 Rexp = 7.18 Chi2 = 2.35 | Martensite | 2.87366 | - | - | 1.09 ± 0.62 | - |
| Austenite | 3.59837 | - | - | 56.95 ± 1.68 | 46.593 ± 0.004 | ||
| K2 carbide | 4.46111 | 6.99491 | 12.10891 | 41.97 ± 2.22 | - |
| No. | Martensite | Austenite | M7C3 | Calculated Effects | |||
|---|---|---|---|---|---|---|---|
| (wt %) | Effect | (wt %) | Effect | (wt %) | Effect | ||
| 1 | 50.48 | 22.313 | 12.76 | 39.750 | 36.76 | 37.986 | Average |
| 2 | 10.05 | −29.127 | 42.2 | 25.41 | 47.74 | 3.622 | A+BD+CE |
| 3 | 48.87 | −5.472 | 19.69 | 10.12 | 31.83 | −4.547 | B+AD+CF |
| 4 | 9.34 | −14.742 | 61.09 | 11.63 | 29.57 | 3.022 | C+AE+BF |
| 5 | 29.15 | 0.402 | 34.22 | 3.01 | 36.63 | −3.507 | D+AB+EF |
| 6 | 10.52 | 10.852 | 49.58 | −10.01 | 39.91 | −0.737 | E+AC+DF |
| 7 | 19.01 | −4.312 | 41.51 | −2.79 | 39.48 | 7.002 | F+BC+DE |
| 8 | 1.09 | −0.047 | 56.95 | 2.97 | 41.97 | 3.112 | AF+BE+CD |
| No. | Å3 | Effect | Calculated Effects |
|---|---|---|---|
| 1 | 46.29 | 46.496 | Average |
| 2 | 46.602 | 0.311 | A+BD+CE |
| 3 | 46.143 | −0.013 | B+AD+CF |
| 4 | 46.776 | 0.086 | C+AE+BF |
| 5 | 46.483 | 0.078 | D+AB+EF |
| 6 | 46.637 | −0.160 | E+AC+DF |
| 7 | 46.445 | −0.027 | F+BC+DE |
| 8 | 46.593 | −0.081 | AF+BE+CD |
| No. | Hardness | Weight Loss | Calculated Effects | ||
|---|---|---|---|---|---|
| HV100 | Effect | mg | Effect | ||
| 1 | 833 | 781.75 | 79.23 | 83.095 | Average |
| 2 | 679 | −142.5 | 80.95 | −0.99 | A+BD+CE |
| 3 | 877 | −1.5 | 86.13 | 0.52 | B+AD+CF |
| 4 | 693 | 22.5 | 83.25 | 1.41 | C+AE+BF |
| 5 | 859 | −15.5 | 86.73 | −0.7 | D+AB+EF |
| 6 | 759 | 26.5 | 84.43 | −0.41 | E+AC+DF |
| 7 | 843 | −30.5 | 82.27 | −4.08 | F+BC+DE |
| 8 | 711 | −0.5 | 81.77 | 1.6 | AF+BE+CD |
© 2019 by the authors. Licensee MDPI, Basel, Switzerland. This article is an open access article distributed under the terms and conditions of the Creative Commons Attribution (CC BY) license (http://creativecommons.org/licenses/by/4.0/).
Share and Cite
Gonzalez-Pociño, A.; Alvarez-Antolin, F.; Asensio-Lozano, J. Influence of Thermal Parameters Related to Destabilization Treatments on Erosive Wear Resistance and Microstructural Variation of White Cast Iron Containing 18% Cr. Application of Design of Experiments and Rietveld Structural Analysis. Materials 2019, 12, 3252. https://doi.org/10.3390/ma12193252
Gonzalez-Pociño A, Alvarez-Antolin F, Asensio-Lozano J. Influence of Thermal Parameters Related to Destabilization Treatments on Erosive Wear Resistance and Microstructural Variation of White Cast Iron Containing 18% Cr. Application of Design of Experiments and Rietveld Structural Analysis. Materials. 2019; 12(19):3252. https://doi.org/10.3390/ma12193252
Chicago/Turabian StyleGonzalez-Pociño, Alejandro, Florentino Alvarez-Antolin, and Juan Asensio-Lozano. 2019. "Influence of Thermal Parameters Related to Destabilization Treatments on Erosive Wear Resistance and Microstructural Variation of White Cast Iron Containing 18% Cr. Application of Design of Experiments and Rietveld Structural Analysis" Materials 12, no. 19: 3252. https://doi.org/10.3390/ma12193252
APA StyleGonzalez-Pociño, A., Alvarez-Antolin, F., & Asensio-Lozano, J. (2019). Influence of Thermal Parameters Related to Destabilization Treatments on Erosive Wear Resistance and Microstructural Variation of White Cast Iron Containing 18% Cr. Application of Design of Experiments and Rietveld Structural Analysis. Materials, 12(19), 3252. https://doi.org/10.3390/ma12193252