Optical Magnetometry Based on Nanodiamonds with Nitrogen-Vacancy Color Centers

 , , ,
, , ,  ,
,  and
and 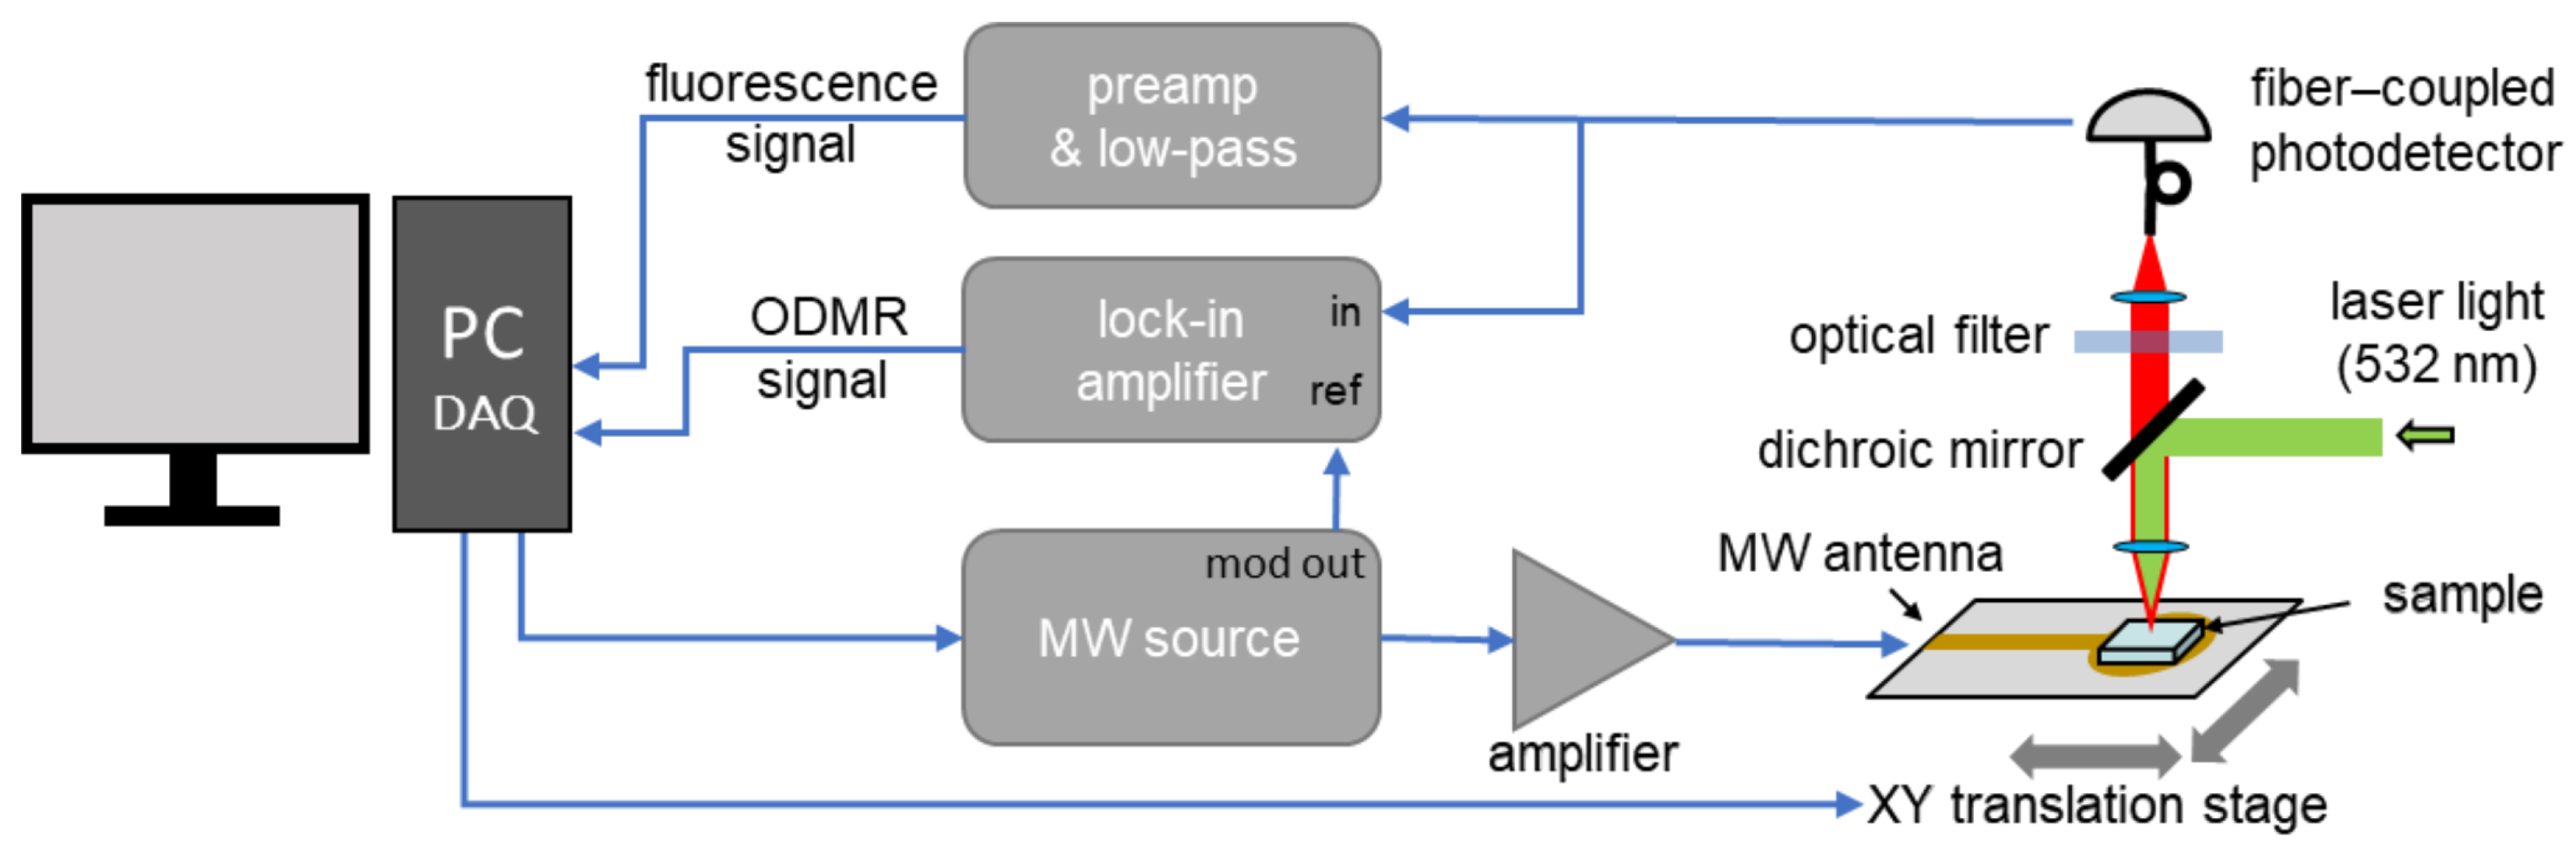
Abstract
1. Introduction
2. Experimental Methods and Materials
3. Results
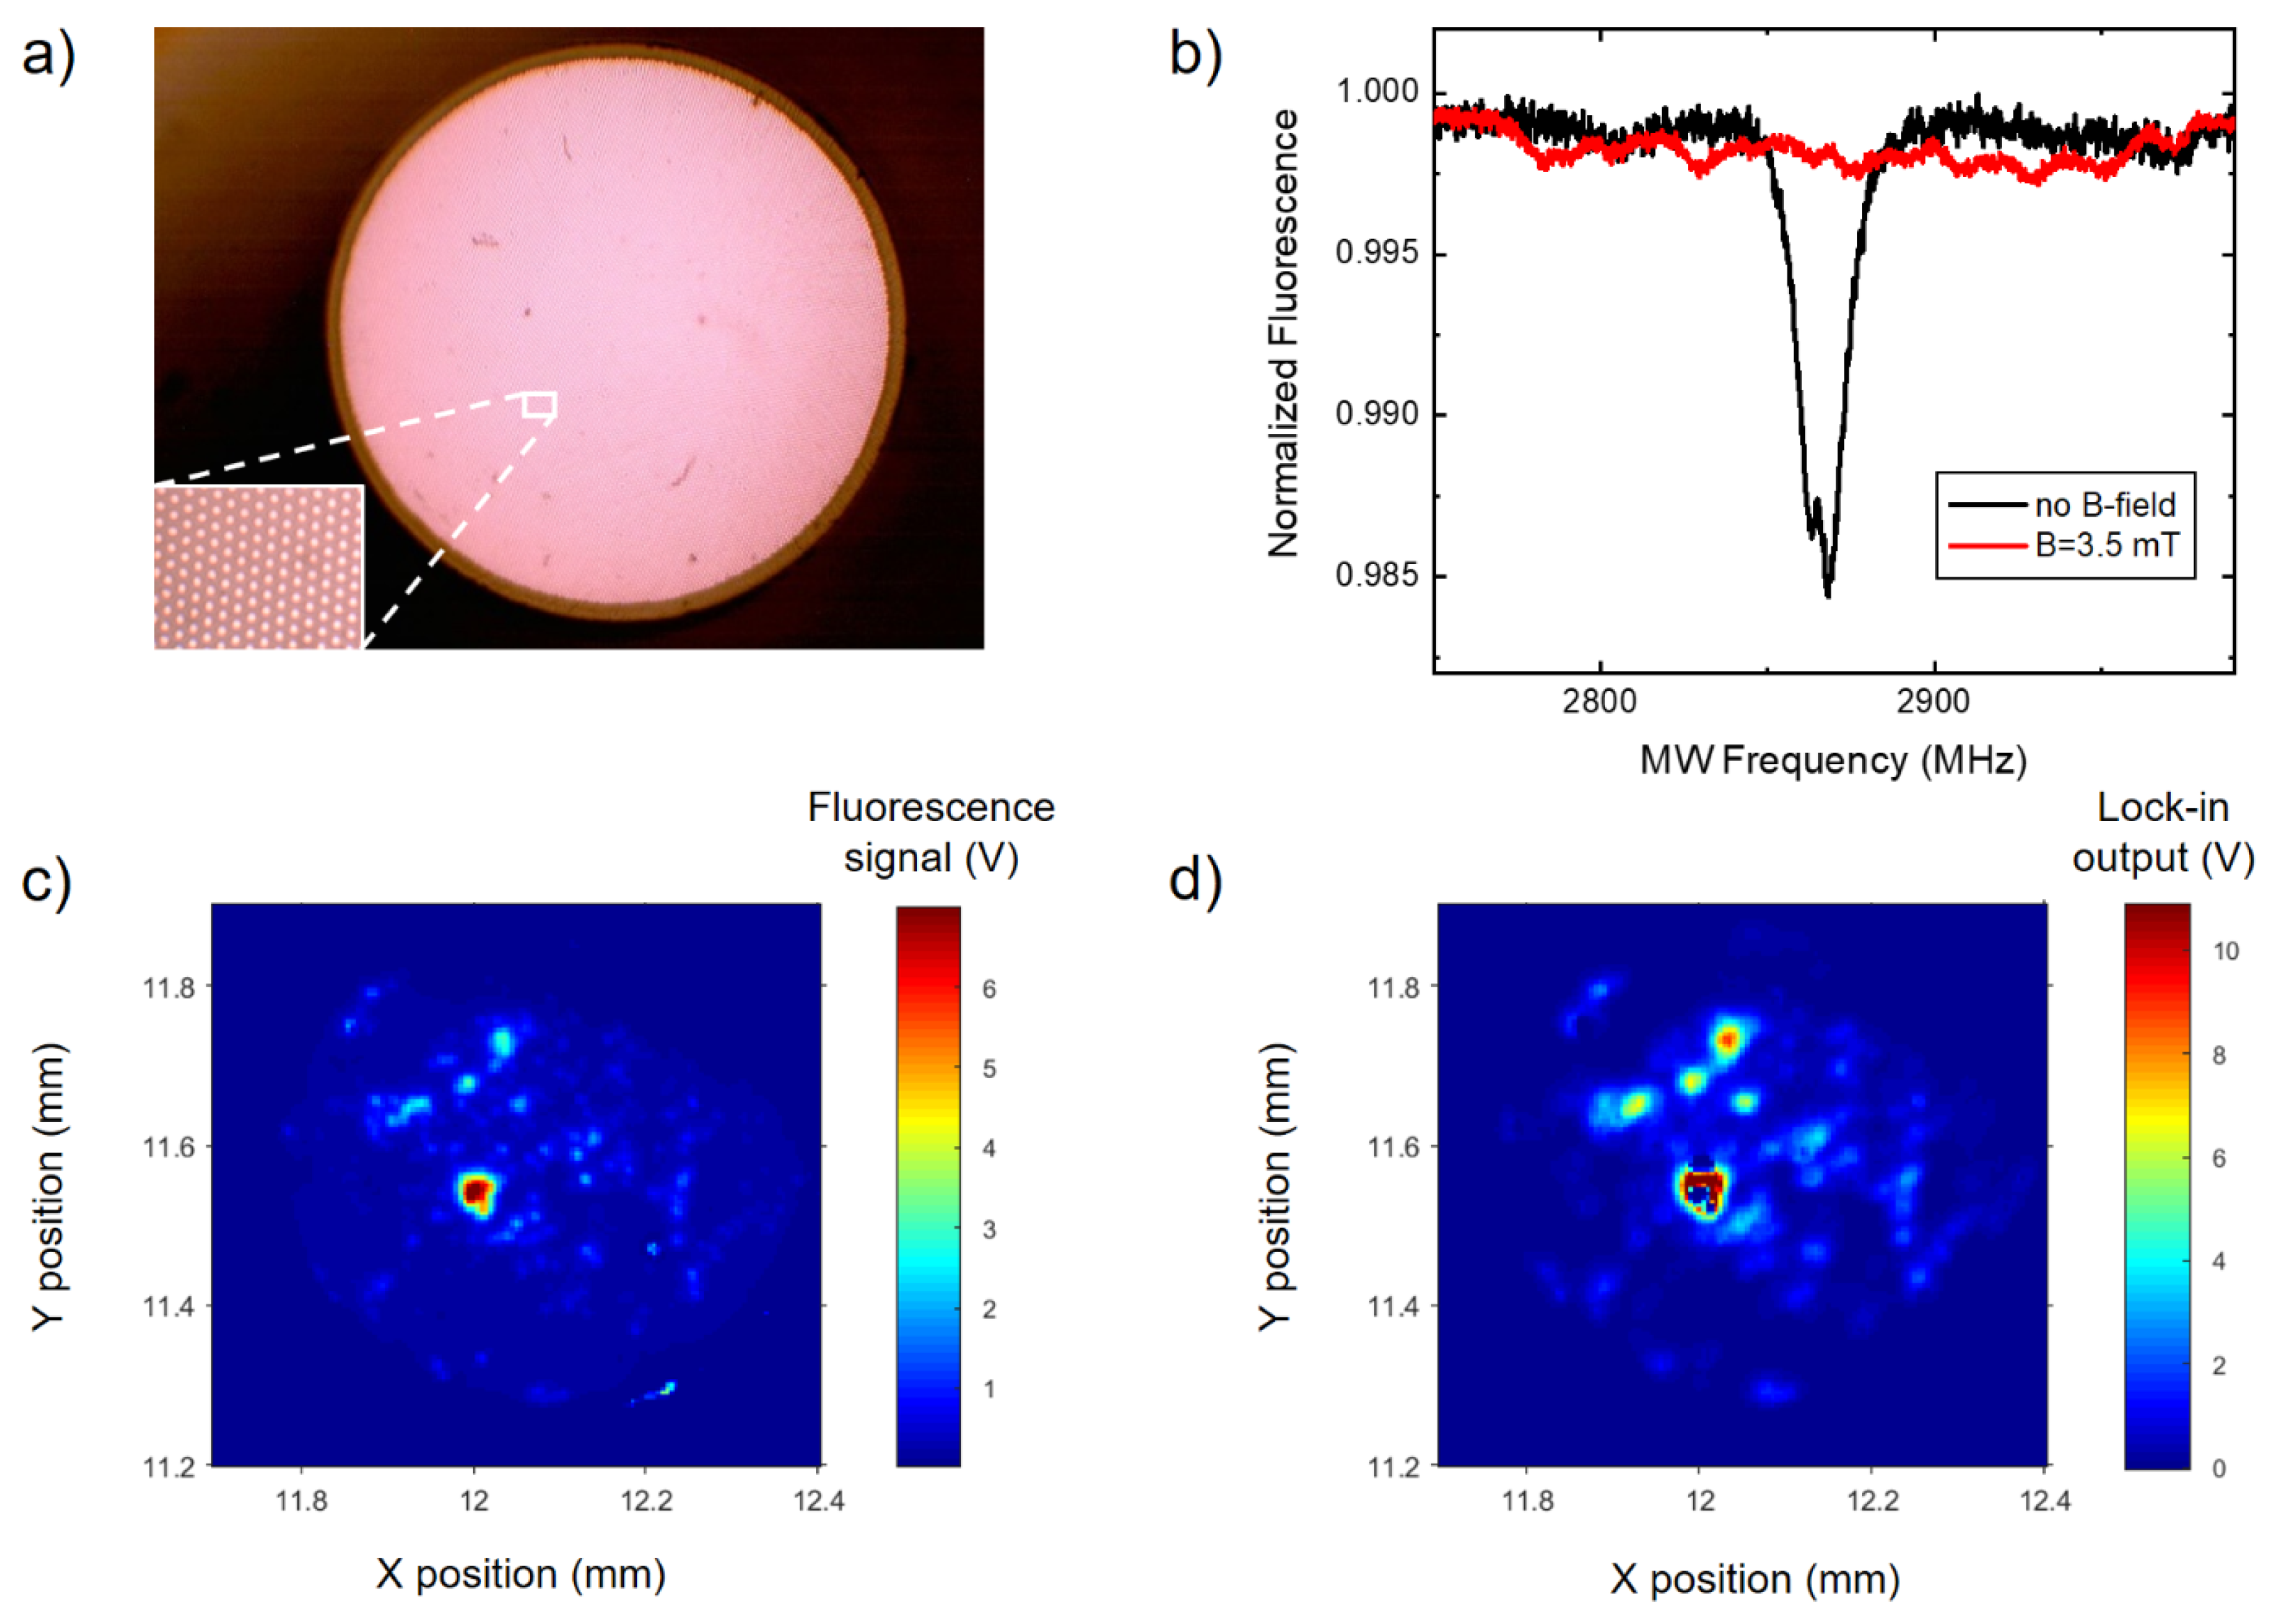
3.1. Dried-Out Nanodiamond Layers
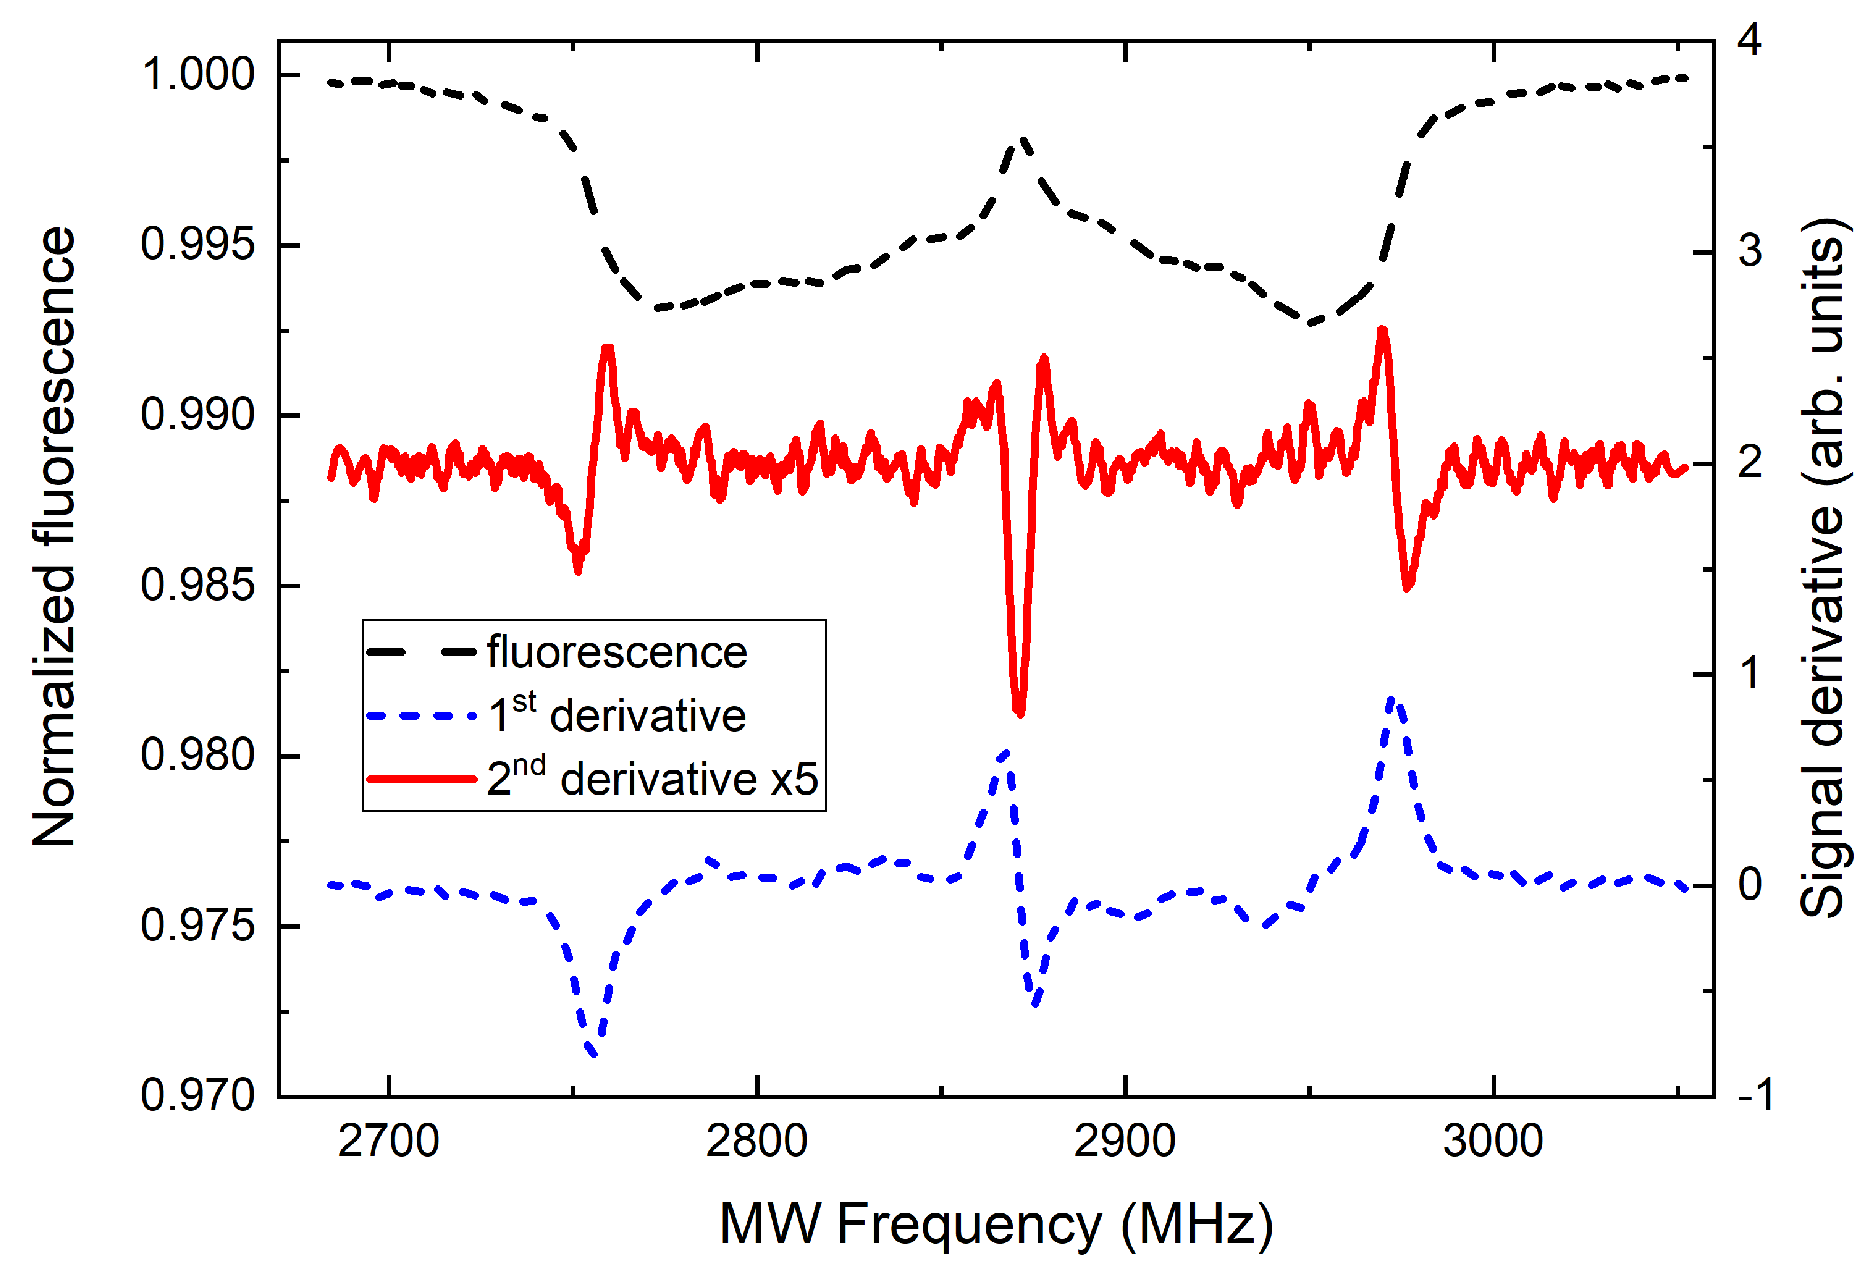
3.2. Magnetic-Field Sensing with ND Ensembles
3.3. ND-Coated Imaging Fiber Bundle
4. Summary and Conclusions
Author Contributions
Funding
Acknowledgments
Conflicts of Interest
References
- Doherty, M.W.; Manson, N.B.; Delaney, P.; Jelezko, F.; Wrachtrup, J.; Hollenberg, L.C. The nitrogen-vacancy colour centre in diamond. Phys. Rep. 2013, 528, 1–45. [Google Scholar] [CrossRef]
- Rondin, L.; Tetienne, J.P.; Hingant, T.; Roch, J.F.; Maletinsky, P.; Jacques, V. Magnetometry with nitrogen-vacancy defects in diamond. Rep. Prog. Phys. 2014, 77, 056503. [Google Scholar] [CrossRef] [PubMed]
- Balasubramanian, G.; Neumann, P.; Twitchen, D.; Markham, M.; Kolesov, R.; Mizuochi, N.; Isoya, J.; Achard, J.; Beck, J.; Tissler, J.; et al. Ultralong spin coherence time in isotopically engineered diamond. Nat. Mater. 2009, 8, 383–387. [Google Scholar] [CrossRef] [PubMed]
- Mrózek, M.; Rudnicki, D.; Kehayias, P.; Jarmola, A.; Budker, D.; Gawlik, W. Longitudinal spin relaxation in nitrogen-vacancy ensembles in diamond. EPJ Quantum Technol. 2015, 2, 22. [Google Scholar] [CrossRef]
- Acosta, V.M.; Bauch, E.; Ledbetter, M.P.; Santori, C.; Fu, K.M.; Barclay, P.E.; Beausoleil, R.G.; Linget, H.; Roch, J.F.; Treussart, F.; et al. Diamonds with a high density of nitrogen-vacancy centers for magnetometry applications. Phys. Rev. B 2009, 80, 115202. [Google Scholar] [CrossRef]
- Childress, L.; Hanson, R. Diamond NV centers for quantum computing and quantum networks. MRS Bull. 2013, 38, 134–138. [Google Scholar] [CrossRef]
- Northup, T.E.; Blatt, R. Quantum information transfer using photons. Nat. Photonics 2014, 8, 356–363. [Google Scholar] [CrossRef]
- Unden, T.; Balasubramanian, P.; Louzon, D.; Vinkler, Y.; Plenio, M.B.; Markham, M.; Twitchen, D.; Stacey, A.; Lovchinsky, I.; Sushkov, A.O.; et al. Quantum metrology enhanced by repetitive quantum error correction. Phys. Rev. Lett. 2016, 116, 230502. [Google Scholar] [CrossRef] [PubMed]
- Schirhagl, R.; Chang, K.; Loretz, M.; Degen, C.L. Nitrogen-vacancy centers in diamond: Nanoscale sensors for physics and biology. Annu. Rev. Phys. Chem. 2014, 65, 83–105. [Google Scholar] [CrossRef] [PubMed]
- Maze, J.R.; Stanwix, P.L.; Hodges, J.S.; Hong, S.; Taylor, J.M.; Cappellaro, P.; Jiang, L.; Dutt, M.V.G.; Togan, E.; Zibrov, A.S.; et al. Nanoscale magnetic sensing with an individual electronic spin in diamond. Nature 2008, 455, 644–647. [Google Scholar] [CrossRef] [PubMed]
- Balasubramanian, G.; Chan, I.Y.; Kolesov, R.; Al-Hmoud, M.; Tisler, J.; Shin, C.; Kim, C.; Wojcik, A.; Hemmer, P.R.; Krueger, A.; et al. Nanoscale imaging magnetometry with diamond spins under ambient conditions. Nature 2008, 455, 648–651. [Google Scholar] [CrossRef] [PubMed]
- Maletinsky, P.; Hong, S.; Grinolds, M.S.; Hausmann, B.; Lukin, M.D.; Walsworth, R.L.; Loncar, M.; Yacoby, A. A robust scanning diamond sensor for nanoscale imaging with single nitrogen-vacancy centres. Nat. Nanotechnol. 2012, 7, 320–324. [Google Scholar] [CrossRef] [PubMed]
- Staudacher, T.; Shi, F.; Pezzagna, S.; Meijer, J.; Du, J.; Meriles, C.A.; Reinhard, F.; Wrachtrup, J. Nuclear Magnetic Resonance Spectroscopy on a (5-Nanometer)3 Sample Volume. Science 2013, 339, 561–563. [Google Scholar] [CrossRef] [PubMed]
- DeVience, S.J.; Pham, L.M.; Lovchinsky, I.; Sushkov, A.O.; Bar-Gill, N.; Belthangady, C.; Casola, F.; Corbett, M.; Zhang, H.; Lukin, M.; et al. Nanoscale NMR spectroscopy and imaging of multiple nuclear species. Nat. Nanotechnol. 2015, 10, 129–134. [Google Scholar] [CrossRef] [PubMed]
- Acosta, V.M.; Budker, D.; Hemmer, P.R.; Maze, J.R.; Walsworth, R.L. Optical magnetometry with nitrogen-vacancy centers in diamond. In Optical Magnetometry; Budker, D., Jackson Kimball, D.F., Eds.; Cambridge University Press: Cambridge, UK, 2013; pp. 142–166. [Google Scholar]
- Wojciechowski, A.M.; Karadas, M.; Huck, A.; Osterkamp, C.; Jankuhn, S.; Meijer, J.; Jelezko, F.; Andersen, U.L. Contributed Review: Camera-limits for wide-field magnetic resonance imaging with a nitrogen-vacancy spin sensor. Rev. Sci. Instrum. 2018, 89, 031501. [Google Scholar] [CrossRef] [PubMed]
- Mochalin, V.N.; Shenderova, O.; Ho, D.; Gogotsi, Y. The properties and applications of nanodiamonds. Nat. Nanotechnol. 2012, 7, 11–23. [Google Scholar] [CrossRef] [PubMed]
- Horowitz, V.R.; Aleman, B.J.; Christle, D.J.; Cleland, A.N.; Awschalom, D.D. Electron spin resonance of nitrogen-vacancy centers in optically trapped nanodiamonds. Proc. Natl. Acad. Sci. USA 2012, 109, 13493–13497. [Google Scholar] [CrossRef] [PubMed]
- Alkahtani, M.H.; Alghannam, F.; Jiang, L.; Almethen, A.; Rampersaud, A.A.; Brick, R.; Gomes, C.L.; Scully, M.O.; Hemmer, P.R. Fluorescent nanodiamonds: Past, present, and future. Nanophotonics 2018, 7, 1423–1453. [Google Scholar] [CrossRef]
- Vervald, A.; Burikov, S.; Borisova, N.; Vlasov, I.; Laptinskiy, K.; Laptinskaya, T.; Shenderova, O.; Dolenko, T. Fluorescence properties of nanodiamonds with NV centers in water suspensions. Physica Status Solidi A 2016, 213, 2601–2607. [Google Scholar] [CrossRef]
- Shenderova, O.A.; McGuire, G.E. Science and engineering of nanodiamond particle surfaces for biological applications (Review). Biointerphases 2015, 10, 030802. [Google Scholar] [CrossRef]
- Krueger, A.; Ozawa, M.; Jarre, G.; Liang, Y.; Stegk, J.; Lu, L. Deagglomeration and functionalisation of detonation diamond. Physica Status Solidi A 2007, 204, 2881–2887. [Google Scholar] [CrossRef]
- Ozawa, M.; Inaguma, M.; Takahashi, M.; Kataoka, F.; Krüger, A.; Ōsawa, E. Preparation and Behavior of Brownish, Clear Nanodiamond Colloids. Adv. Mater. 2007, 19, 1201–1206. [Google Scholar] [CrossRef]
- Sasaki, K.; Monnai, Y.; Saijo, S.; Fujita, R.; Watanabe, H.; Ishi-Hayase, J.; Itoh, K.M.; Abe, E. Broadband, large-area microwave antenna for optically detected magnetic resonance of nitrogen-vacancy centers in diamond. Rev. Sci. Instrum. 2016, 87, 053904. [Google Scholar] [CrossRef] [PubMed]
- Głowacki, M.J.; Sawczak, M.; Ficek, M.; Gardas, M.; Bogdanowicz, R. Preparation of fluorescent nanodiamond suspensions using bead-assisted ultrasonic disintegration. In 12th Conference on Integrated Optics: Sensors, Sensing Structures, and Methods; Pustelny, T., Struk, P., Eds.; SPIE: Bellingham, WA, USA, 2017; Volume 10455, p. 104550E. [Google Scholar]
- Deegan, R.D.; Bakajin, O.; Dupont, T.F.; Huber, G.; Nagel, S.R.; Witten, T.A. Capillary flow as the cause of ring stains from dried liquid drops. Nature 1997, 389, 827–829. [Google Scholar] [CrossRef]
- Chung, P.H.; Perevedentseva, E.; Cheng, C.L. The particle size-dependent photoluminescence of nanodiamonds. Surf. Sci. 2007, 601, 3866–3870. [Google Scholar] [CrossRef]
- Acosta, V.M.; Bauch, E.; Ledbetter, M.P.; Waxman, A.; Bouchard, L.S.; Budker, D. Temperature dependence of the nitrogen-vacancy magnetic resonance in diamond. Phys. Rev. Lett. 2010, 104. [Google Scholar] [CrossRef] [PubMed]
- Wojciechowski, A.M.; Karadas, M.; Osterkamp, C.; Jankuhn, S.; Meijer, J.; Jelezko, F.; Huck, A.; Andersen, U.L. Precision temperature sensing in the presence of magnetic field noise and vice-versa using nitrogen-vacancy centers in diamond. Appl. Phys. Lett. 2018, 113. [Google Scholar] [CrossRef]
- Fedotov, I.V.; Doronina-Amitonova, L.V.; Sidorov-Biryukov, D.A.; Safronov, N.A.; Levchenko, A.O.; Zibrov, S.A.; Blakley, S.; Perez, H.; Akimov, A.V.; Fedotov, A.B.; et al. Fiber-optic magnetometry with randomly oriented spins. Opt. Lett. 2014, 39, 6755–6758. [Google Scholar] [CrossRef] [PubMed]
- Teeling-Smith, R.M.; Jung, Y.W.; Scozzaro, N.; Cardellino, J.; Rampersaud, I.; North, J.A.; Šimon, M.; Bhallamudi, V.P.; Rampersaud, A.; Johnston-Halperin, E.; et al. Electron Paramagnetic Resonance of a Single NV Nanodiamond Attached to an Individual Biomolecule. Biophys. J. 2016, 110, 2044–2052. [Google Scholar] [CrossRef]
- Barry, J.F.; Turner, M.J.; Schloss, J.M.; Glenn, D.R.; Song, Y.; Lukin, M.D.; Park, H.; Walsworth, R.L. Optical magnetic detection of single-neuron action potentials using quantum defects in diamond. Proc. Natl. Acad. Sci. USA 2016, 113, 14133–14138. [Google Scholar] [CrossRef]
- El-Ella, H.A.R.; Ahmadi, S.; Wojciechowski, A.M.; Huck, A.; Andersen, U.L. Optimised frequency modulation for continuous-wave optical magnetic resonance sensing using nitrogen-vacancy ensembles. Opt. Express 2017, 25, 14809. [Google Scholar] [CrossRef] [PubMed]
- Morova, B.; Bavili, N.; Yaman, O.; Yigit, B.; Zeybel, M.; Aydin, M.; Dogan, B.; Kasztelanic, R.; Pysz, D.; Buczynski, R.; et al. Fabrication and characterization of large numerical aperture, high-resolution optical fiber bundles based on high-contrast pairs of soft glasses for fluorescence imaging. Opt. Express 2019, 27, 9502–9515. [Google Scholar] [CrossRef] [PubMed]
- Sample Availability: Samples of ND structures are available from the authors upon reasonable request.


© 2019 by the authors. Licensee MDPI, Basel, Switzerland. This article is an open access article distributed under the terms and conditions of the Creative Commons Attribution (CC BY) license (http://creativecommons.org/licenses/by/4.0/).
Share and Cite
Wojciechowski, A.M.; Nakonieczna, P.; Mrózek, M.; Sycz, K.; Kruk, A.; Ficek, M.; Głowacki, M.; Bogdanowicz, R.; Gawlik, W. Optical Magnetometry Based on Nanodiamonds with Nitrogen-Vacancy Color Centers. Materials 2019, 12, 2951. https://doi.org/10.3390/ma12182951
Wojciechowski AM, Nakonieczna P, Mrózek M, Sycz K, Kruk A, Ficek M, Głowacki M, Bogdanowicz R, Gawlik W. Optical Magnetometry Based on Nanodiamonds with Nitrogen-Vacancy Color Centers. Materials. 2019; 12(18):2951. https://doi.org/10.3390/ma12182951
Chicago/Turabian StyleWojciechowski, Adam M., Paulina Nakonieczna, Mariusz Mrózek, Krystian Sycz, Andrzej Kruk, Mateusz Ficek, Maciej Głowacki, Robert Bogdanowicz, and Wojciech Gawlik. 2019. "Optical Magnetometry Based on Nanodiamonds with Nitrogen-Vacancy Color Centers" Materials 12, no. 18: 2951. https://doi.org/10.3390/ma12182951
APA StyleWojciechowski, A. M., Nakonieczna, P., Mrózek, M., Sycz, K., Kruk, A., Ficek, M., Głowacki, M., Bogdanowicz, R., & Gawlik, W. (2019). Optical Magnetometry Based on Nanodiamonds with Nitrogen-Vacancy Color Centers. Materials, 12(18), 2951. https://doi.org/10.3390/ma12182951