Structural, Magnetic and Optical Properties of Gd and Co Co-Doped YFeO3 Nanopowders


Abstract
:1. Introduction
2. Experimental Procedures
3. Results and Discussions
4. Conclusions
Author Contributions
Funding
Conflicts of Interest
References
- Dho, J.; Blamire, M. Competing functionality in multiferroic YMnO3. Appl. Phys. Lett. 2005, 87, 2504. [Google Scholar] [CrossRef]
- Wang, L.J.; Feng, S.M.; Zhu, J.L.; Yu, R.C.; Jin, C.Q.; Yu, W.; Wang, X.H.; Li, L.T. Ferroelectricity of multiferroic hexagonal TmMnO3 ceramics synthesized under high pressure. Appl. Phys. Lett. 2007, 91, 172502. [Google Scholar] [CrossRef]
- Cherry, M.; Islam, M.S.; Catlow, C.R.A. Oxygen ion migration in perovskite-type oxides. J. Solid State Chem. 1995, 118, 125–132. [Google Scholar] [CrossRef]
- Minh, N.Q. Ceramic fuel cells. J. Am. Ceram. Soc. 1993, 76, 563–588. [Google Scholar] [CrossRef]
- Sharon, M.; Prasad, B.M. Preparation and photocharacterization of YFeO3 semiconductor. Electrochim. Acta 1985, 30, 331–334. [Google Scholar] [CrossRef]
- Traversa, E.; Nunziante, P.; Sangaletti, L.; Allieri, B.; Depero, L.E.; Aono, H.; Sadaoka, Y. Synthesis and structural characterization of trimetallic perovskite-type rare-earth orthoferrites, LaxSm1-xFeO3. J. Am. Ceram. Soc. 2000, 83, 1087–1092. [Google Scholar] [CrossRef]
- Butler, M.A.; Ginley, D.S.; Eibschutz, M. Photoelectrolysis with YFeO3 electrodes. J. Appl. Phys. 1977, 48, 3070–3072. [Google Scholar] [CrossRef]
- Mathur, S.; Veith, M.; Rapalaviciute, R.; Shen, H.; Goya, G.F.; Filho, W.L.M.; Berquo, T.S. Molecule derived synthesis of nanocrystalline YFeO3 and investigations on its weak ferromagnetic behavior. Chem. Mater. 2004, 16, 1906–1913. [Google Scholar] [CrossRef]
- Schmool, D.S.; Keller, N.; Guyot, M.; Krishnan, R.; Tessier, M. Magnetic and magneto-optic properties of orthoferrite thin films grown by pulsed-laser deposition. J. Appl. Phys. 1999, 86, 5712–5717. [Google Scholar] [CrossRef]
- Shang, M.; Wang, C.; Chen, Y.; Sun, F.; Yuan, H. The multiferroic epitaxial thin film YFeO3. Mater. Lett. 2016, 175, 23–26. [Google Scholar] [CrossRef]
- Akbashev, A.; Semisalova, A.; Perov, N.; Kaul, A. Weak ferromagnetism in hexagonal orthoferrites RFeO3 (R = Lu, Er-Tb). Appl. Phys. Lett. 2011, 99, 122502. [Google Scholar] [CrossRef]
- Hemberger, J.; Schrettle, F.; Pimenov, A.; Lunkenheimer, P.; Ivanov, V.Y.; Mukhin, A.A.; Balbashov, A.M.; Loidl, A. Multiferroic phases of Eu1-xYxMnO3. Phys. Rev. B Condens. Matter 2007, 75, 5118. [Google Scholar] [CrossRef]
- Zhang, W.; Fang, C.; Yin, W.; Zeng, Y. One-step synthesis of yttrium orthoferrite nanocrystals via sol-gel auto-combustion and their structural and magnetic characteristics. Mater. Chem. Phys. 2013, 137, 877–883. [Google Scholar] [CrossRef]
- Van Tac, D.; Mittova, V.; Mittova, I.Y. Influence of lanthanum content and annealing temperature on the size and magnetic properties of sol–gel derived Y1−xLaxFeO3 nanocrystals. Inorg. Mater. 2011, 47, 521–526. [Google Scholar] [CrossRef]
- Yuan, X.; Sun, Y.; Xu, M. Effect of Gd substitution on the structure and magnetic properties of YFeO3 ceramics. J. Solid State Chem. 2012, 196, 362–366. [Google Scholar] [CrossRef]
- Khalifa, N.O.; Widatallah, H.M.; Gismelseed, A.M. Magnetic and Mössbauer studies of pure and Ti-doped YFeO3 nanocrystalline particles prepared by mechanical milling and subsequent sintering. Hyperfine Interact. 2016, 237, 1–11. [Google Scholar] [CrossRef]
- Shi, L.R.; Xia, Z.C.; Huang, S.; Xiao, G.L.; Jin, Z.; Wei, M.; Chen, B.R.; Shang, C.; Cheng, H.; Ouyang, Z.W. The magnetization reversal and high temperature dielectric response in Y1−xHxFe0.5Cr0.5O3. Ceram. Int. 2016, 42, 10808–10812. [Google Scholar] [CrossRef]
- Ma, Y.; Wu, Y.J.; Lin, Y.Q.; Chen, X.M. Microstructures and multiferroic properties of YFe1-xMnxO3 ceramics prepared by spark plasma sintering. J. Mater. Sci. Mater. Electron. 2010, 21, 838–843. [Google Scholar] [CrossRef]
- Wang, M.; Wang, T.; Song, S.; Tan, M. Structure-controllable synthesis of multiferroic YFeo3 nanopowders and their optical and magnetic properties. Materials 2017, 10, 626. [Google Scholar] [CrossRef]
- Shannon, R.D. Revised effective ionic radii and systematic studies of interatomic distances in halides and chalcogenides. Acta Crystallogr. A 1976, 32, 751–767. [Google Scholar] [CrossRef]
- Chakrabarti, K.; Das, K.; Sarkar, B.; Ghosh, S.; De, S.K.; Sinha, G.; Lahtinen, J. Enhanced magnetic and dielectric properties of Eu and Co co-doped BiFeO3 nanoparticles. Appl. Phys. Lett. 2012, 101, 759. [Google Scholar] [CrossRef]
- Yang, L.P.; Zhang, A.M.; Dai, Y.; Wu, X.S. The effect of Dy–Fe co-doping on the structural and magnetic properties of h-YMnO3. J. Mater. Sci. Mater. Electron. 2017, 28, 8872–8877. [Google Scholar] [CrossRef]
- Wu, L.; Yu, J.C.; Zhang, L.; Wang, X.; Li, S. Selective self-propagating combustion synthesis of hexagonal and orthorhombic nanocrystalline yttrium iron oxide. J. Solid State Chem. 2004, 177, 3666–3674. [Google Scholar] [CrossRef]
- Ma, Y.; Chen, X.M.; Lin, Y.Q. Relaxorlike dielectric behavior and weak ferromagnetism in YFeO3 ceramics. J. Appl. Phys. 2008, 103, 124111. [Google Scholar] [CrossRef]
- Moriya, T. New mechanism of anisotropic superexchange interaction. Phys. Rev. Lett. 1960, 4, 228–230. [Google Scholar] [CrossRef]
- Dzyaloshinsky, I. A thermodynamic theory of weak ferromagnetism of antiferromagnetics. J. Phys. Chem. Solids 1958, 4, 241–255. [Google Scholar] [CrossRef]
- Arlt, G.; Hennings, D.; With, G.D. Dielectric properties of fine-grained barium titanate ceramics. J. Appl. Phys. 1985, 58, 1619–1625. [Google Scholar] [CrossRef]
- Zhang, Y.; Yang, J.; Xu, J.; Gao, Q.; Hong, Z. Controllable synthesis of hexagonal and orthorhombic YFeO3 and their visible-light photocatalytic activities. Mater. Lett. 2012, 81, 1–4. [Google Scholar] [CrossRef]
- Mocherla, P.S.V.; Karthik, C.; Ubic, R.; Rao, M.S.R.; Sudakar, C. Tunable bandgap in BiFeO3 nanoparticles: The role of microstrain and oxygen defects. Appl. Phys. Lett. 2013, 103, 2463–2485. [Google Scholar] [CrossRef]
- Zhang, Q.; Zhu, X.; Xu, Y.; Gao, H.; Xiao, Y.; Liang, D.; Zhu, J.; Zhu, J.; Xiao, D. Effect of La3+ substitution on the phase transitions, microstructure and electrical properties of Bi1-xLaxFeO3 ceramics. J. Alloys Compd. 2013, 546, 57–62. [Google Scholar] [CrossRef]
- Shen, T.; Hu, C.; Yang, W.L.; Liu, H.C.; Wei, X.L. Theoretical investigation of magnetic, electronic and optical properties of orthorhombic YFeO3: A first-principle study. Mater. Sci. Semicond. Process. 2015, 34, 114–120. [Google Scholar] [CrossRef]
- Liu, J.; He, F.; Chen, L.; Qin, X.; Zhao, N.; Huang, Y.; Peng, Y. Novel hexagonal-YFeO3/α-Fe2O3 heterojunction composite nanowires with enhanced visible light photocatalytic activity. Mater. Lett. 2016, 165, 263–266. [Google Scholar] [CrossRef]

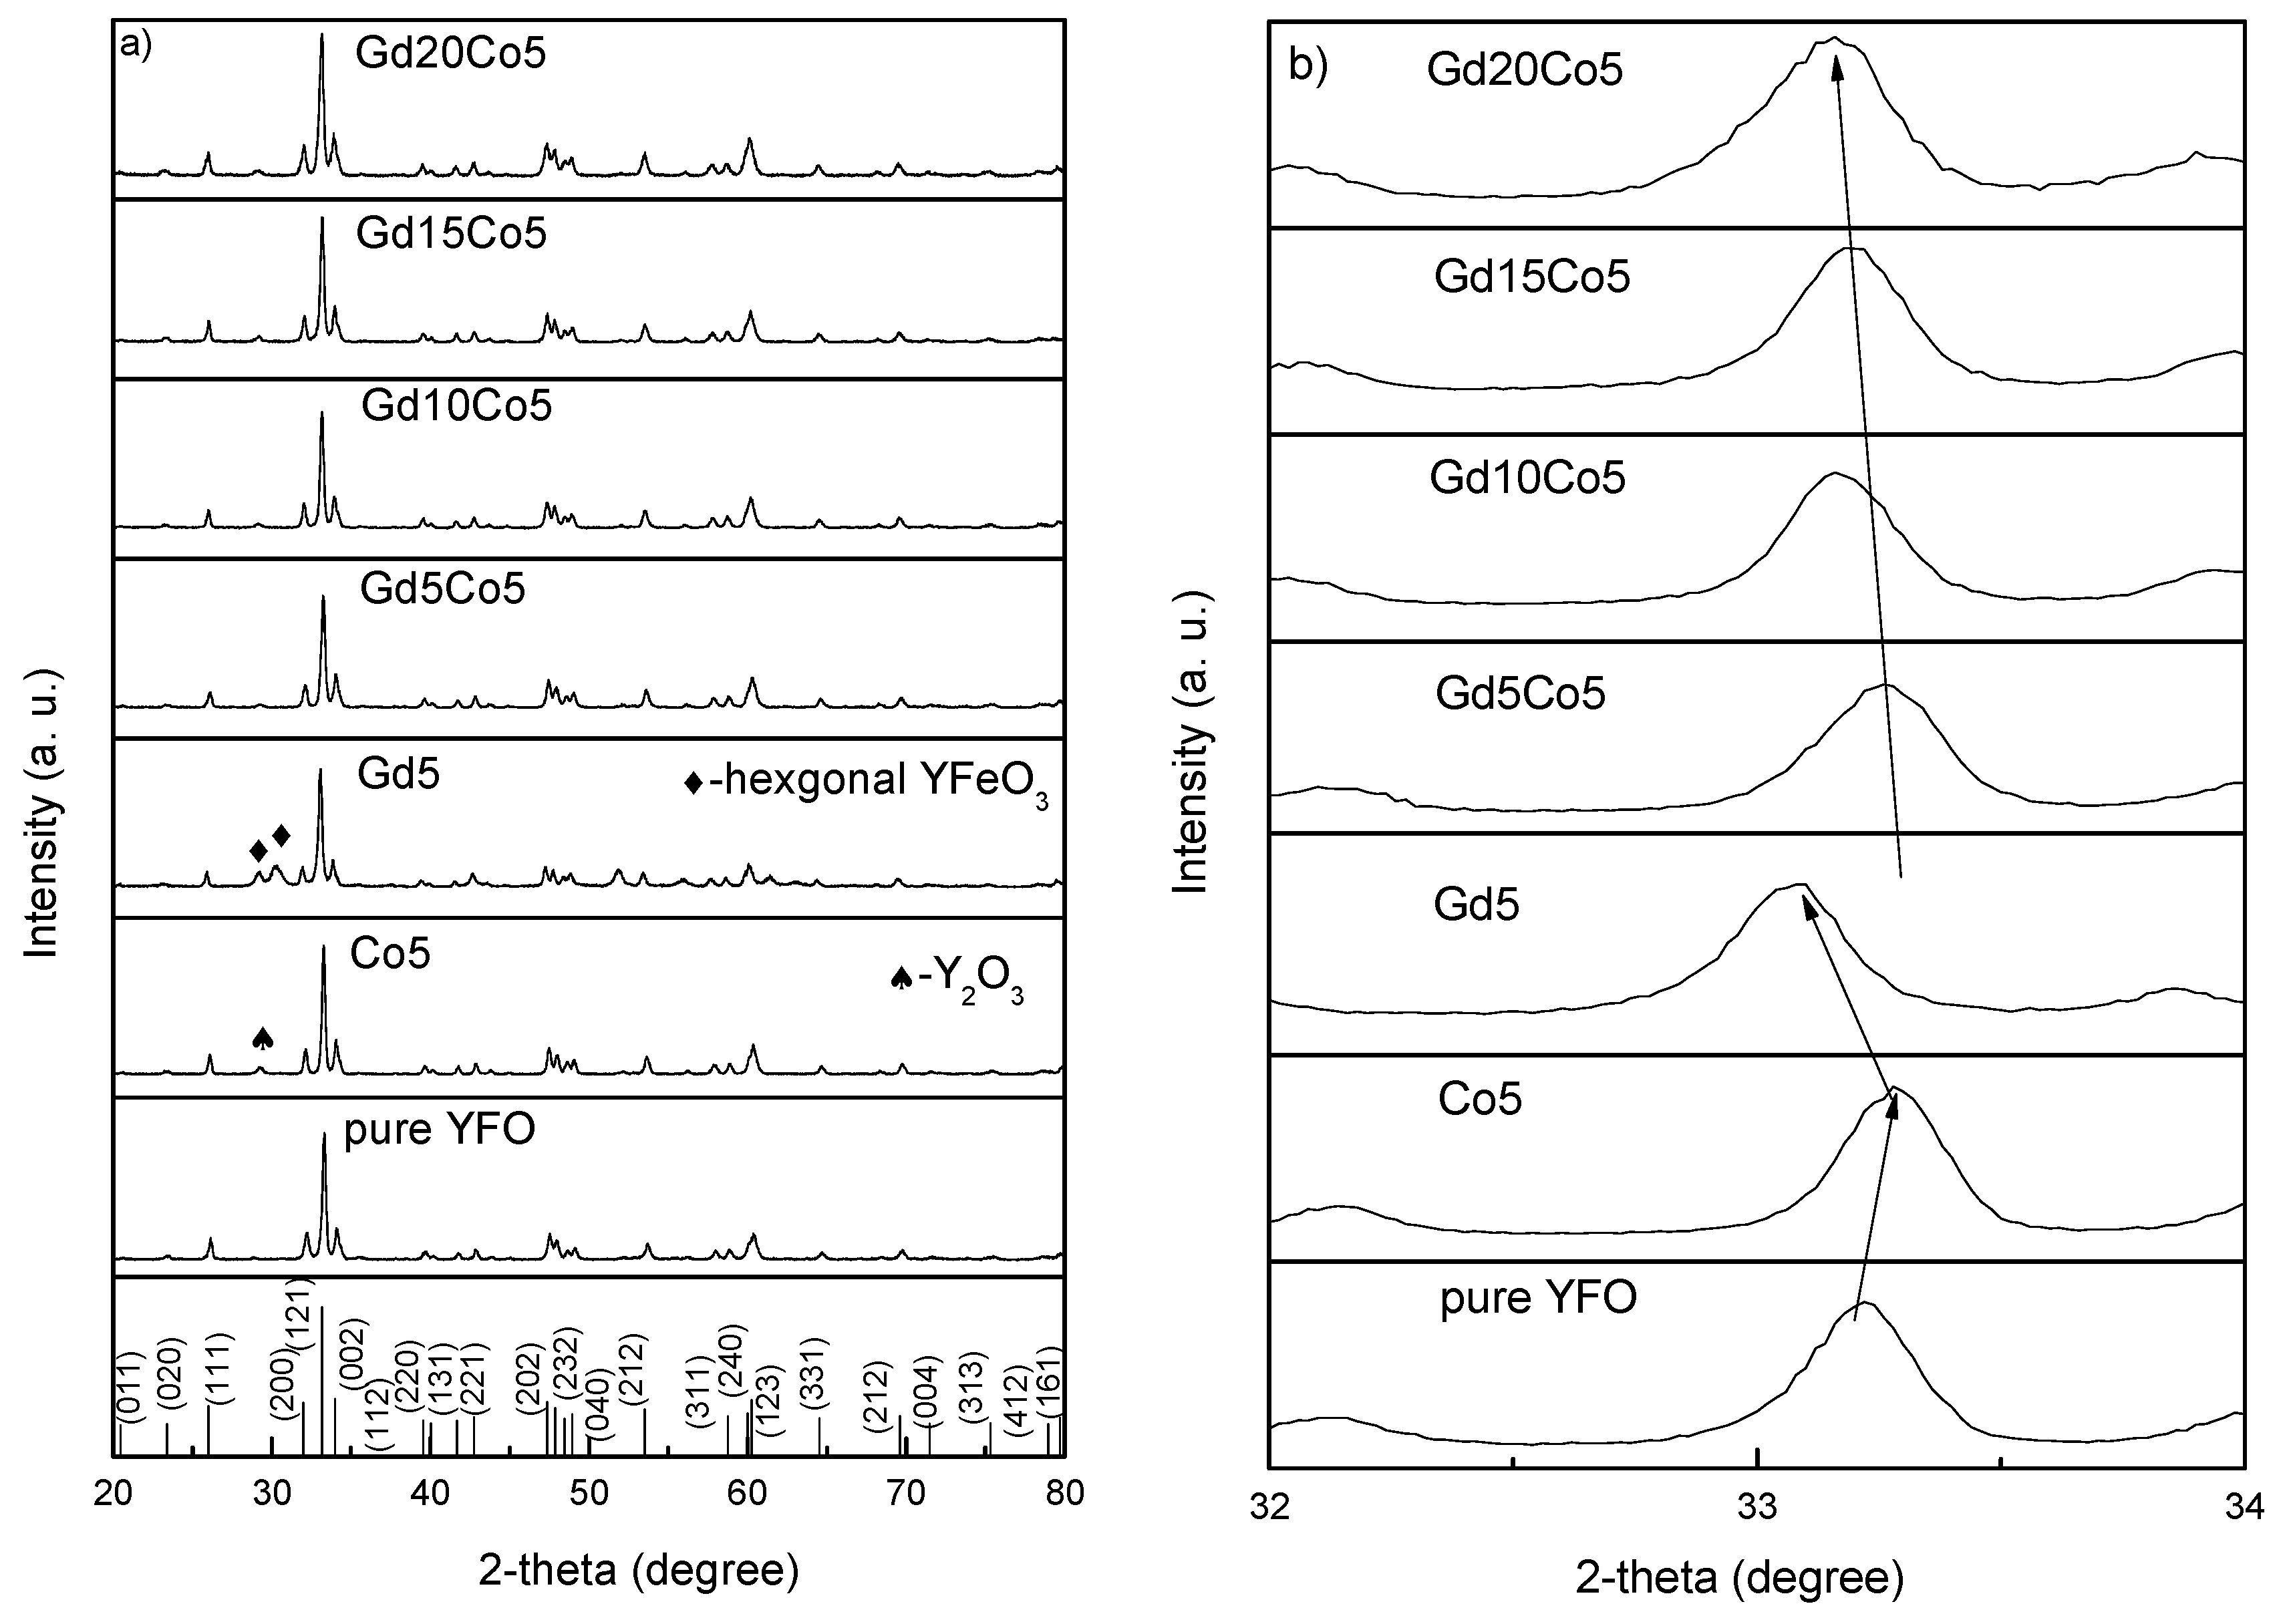
| Sample | a (Å) | b (Å) | c (Å) | Volume (Å 3) |
|---|---|---|---|---|
| Pure YFO | 5.58079 | 5.27096 | 7.58866 | 223.23 |
| Co5 | 5.57756 | 5.26958 | 7.58258 | 222.86 |
| Gd5 | 5.58195 | 5.27209 | 7.5924 | 223.43 |
| Gd5Co5 | 5.58018 | 5.27106 | 7.58943 | 223.23 |
| Gd10Co5 | 5.58255 | 5.27279 | 7.59356 | 223.52 |
| Gd15Co5 | 5.58303 | 5.27411 | 7.59364 | 223.60 |
| Gd20Co5 | 5.58523 | 5.27791 | 7.59615 | 223.92 |
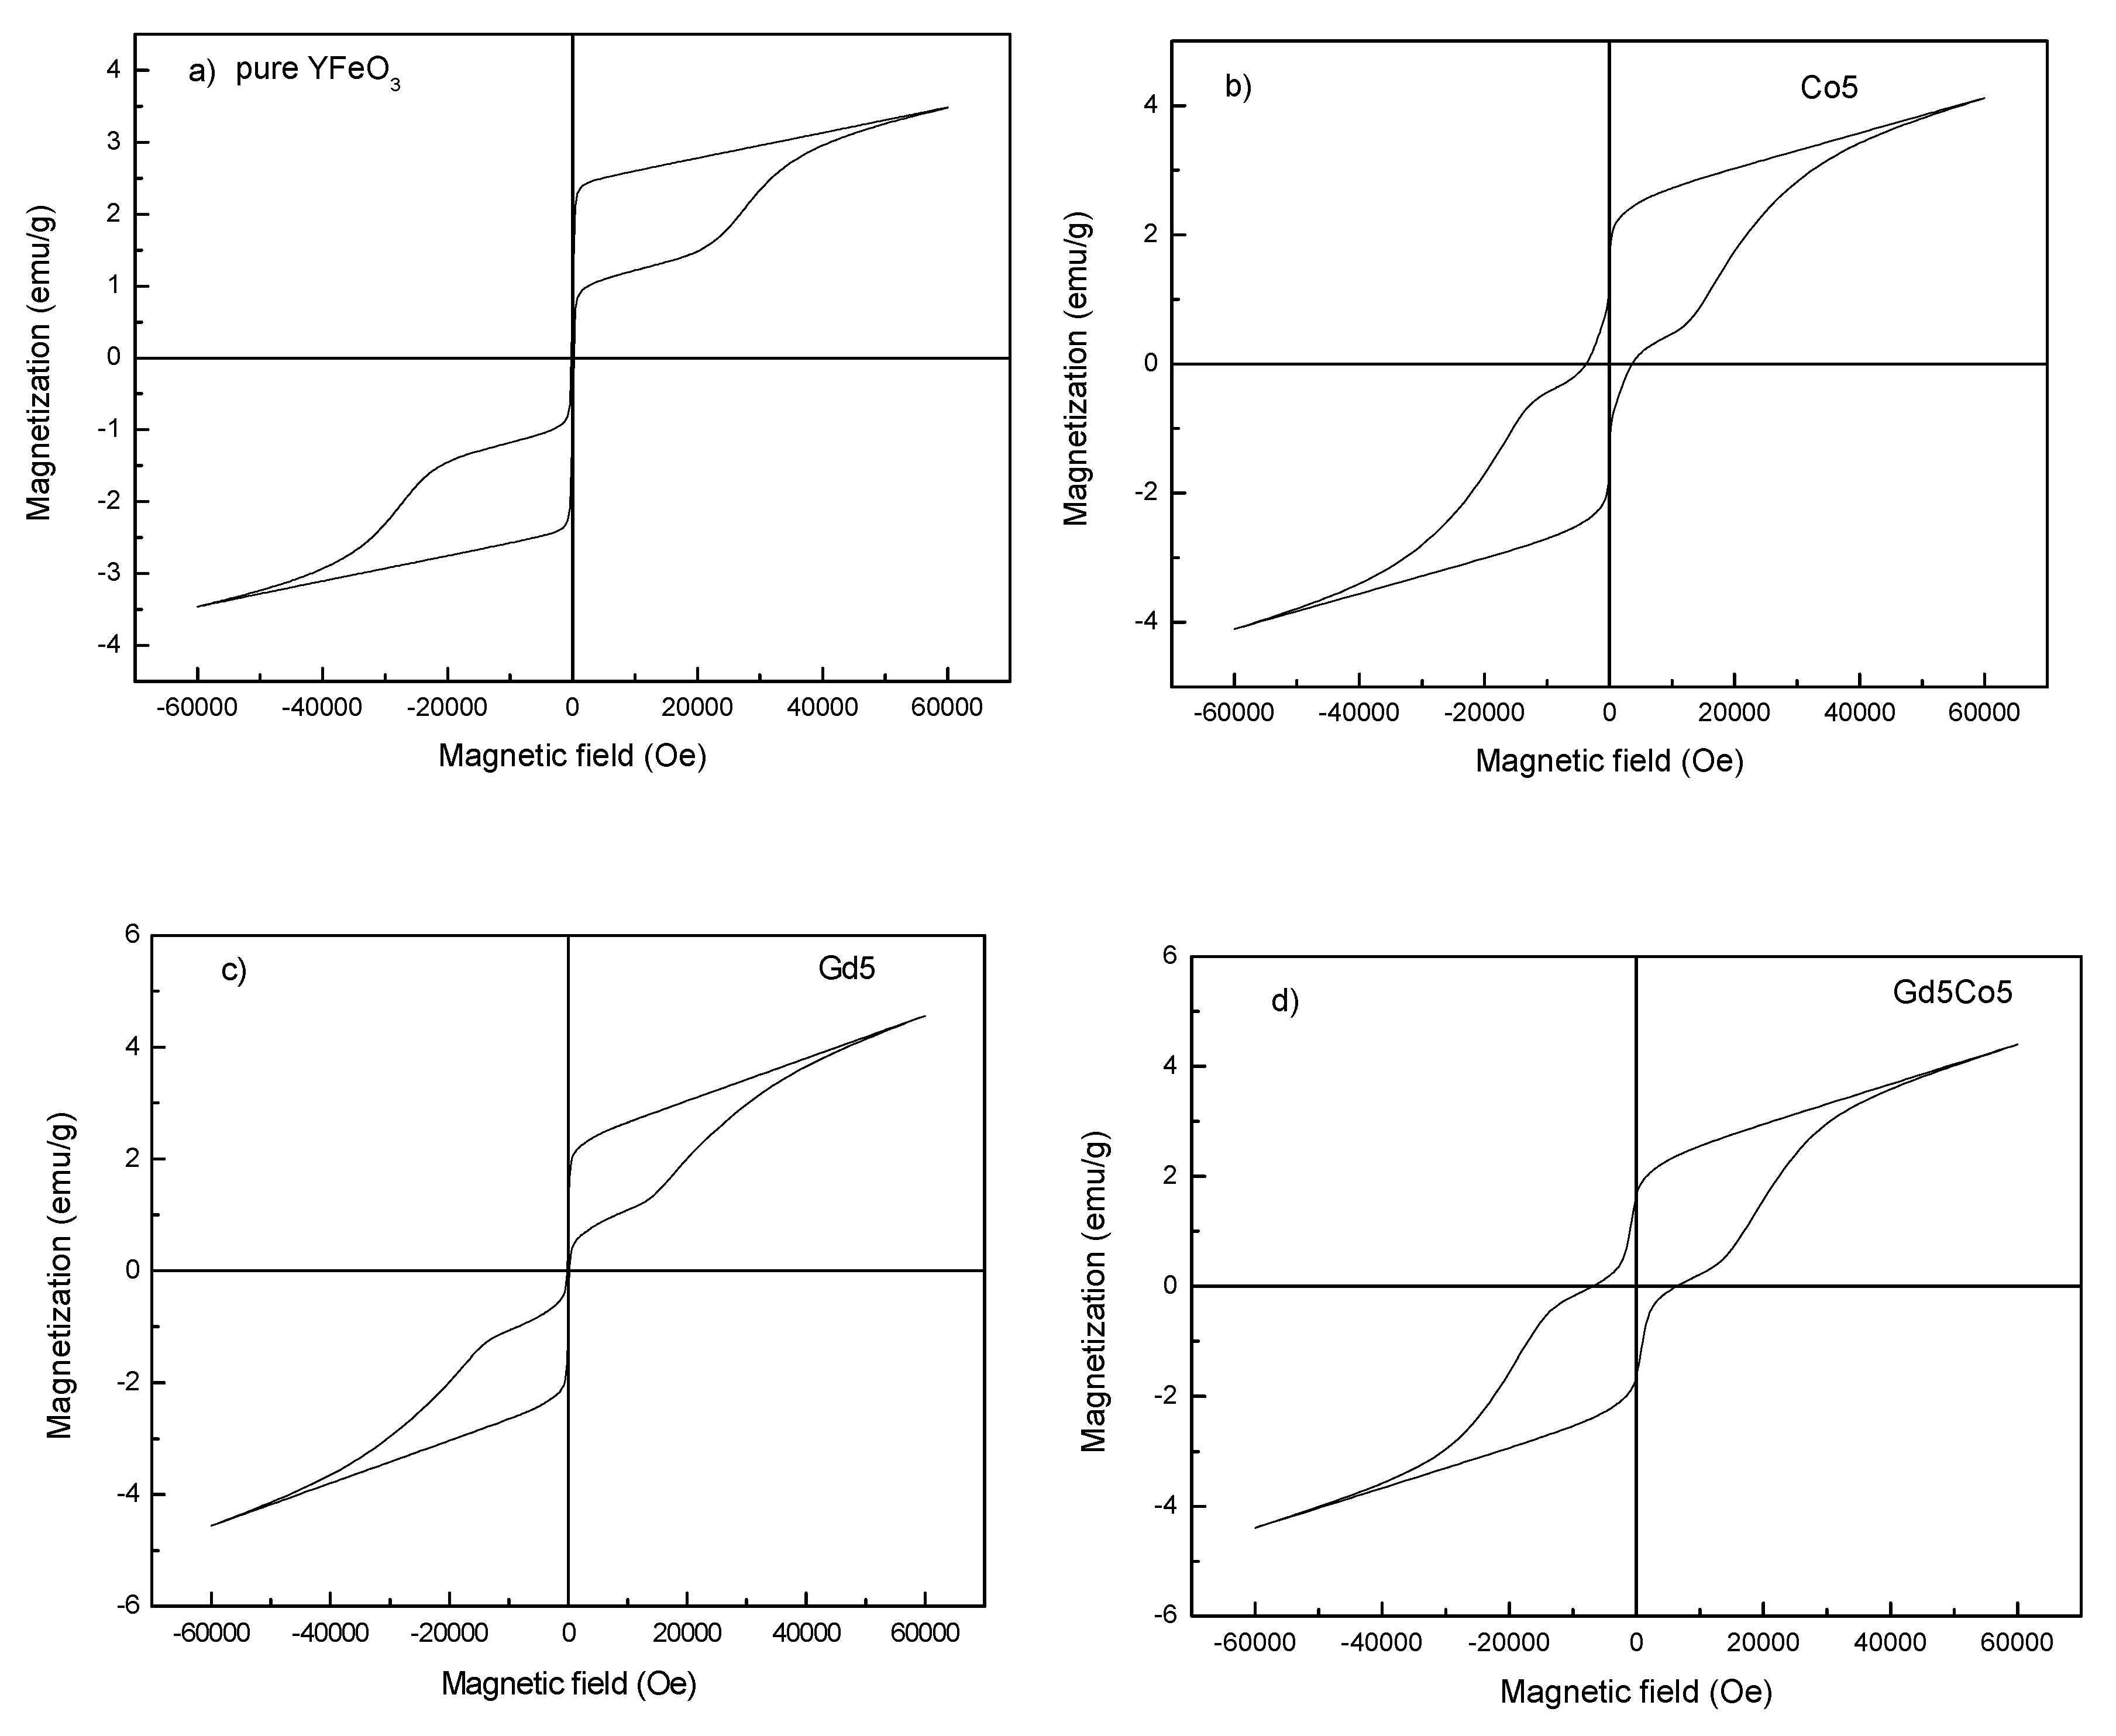
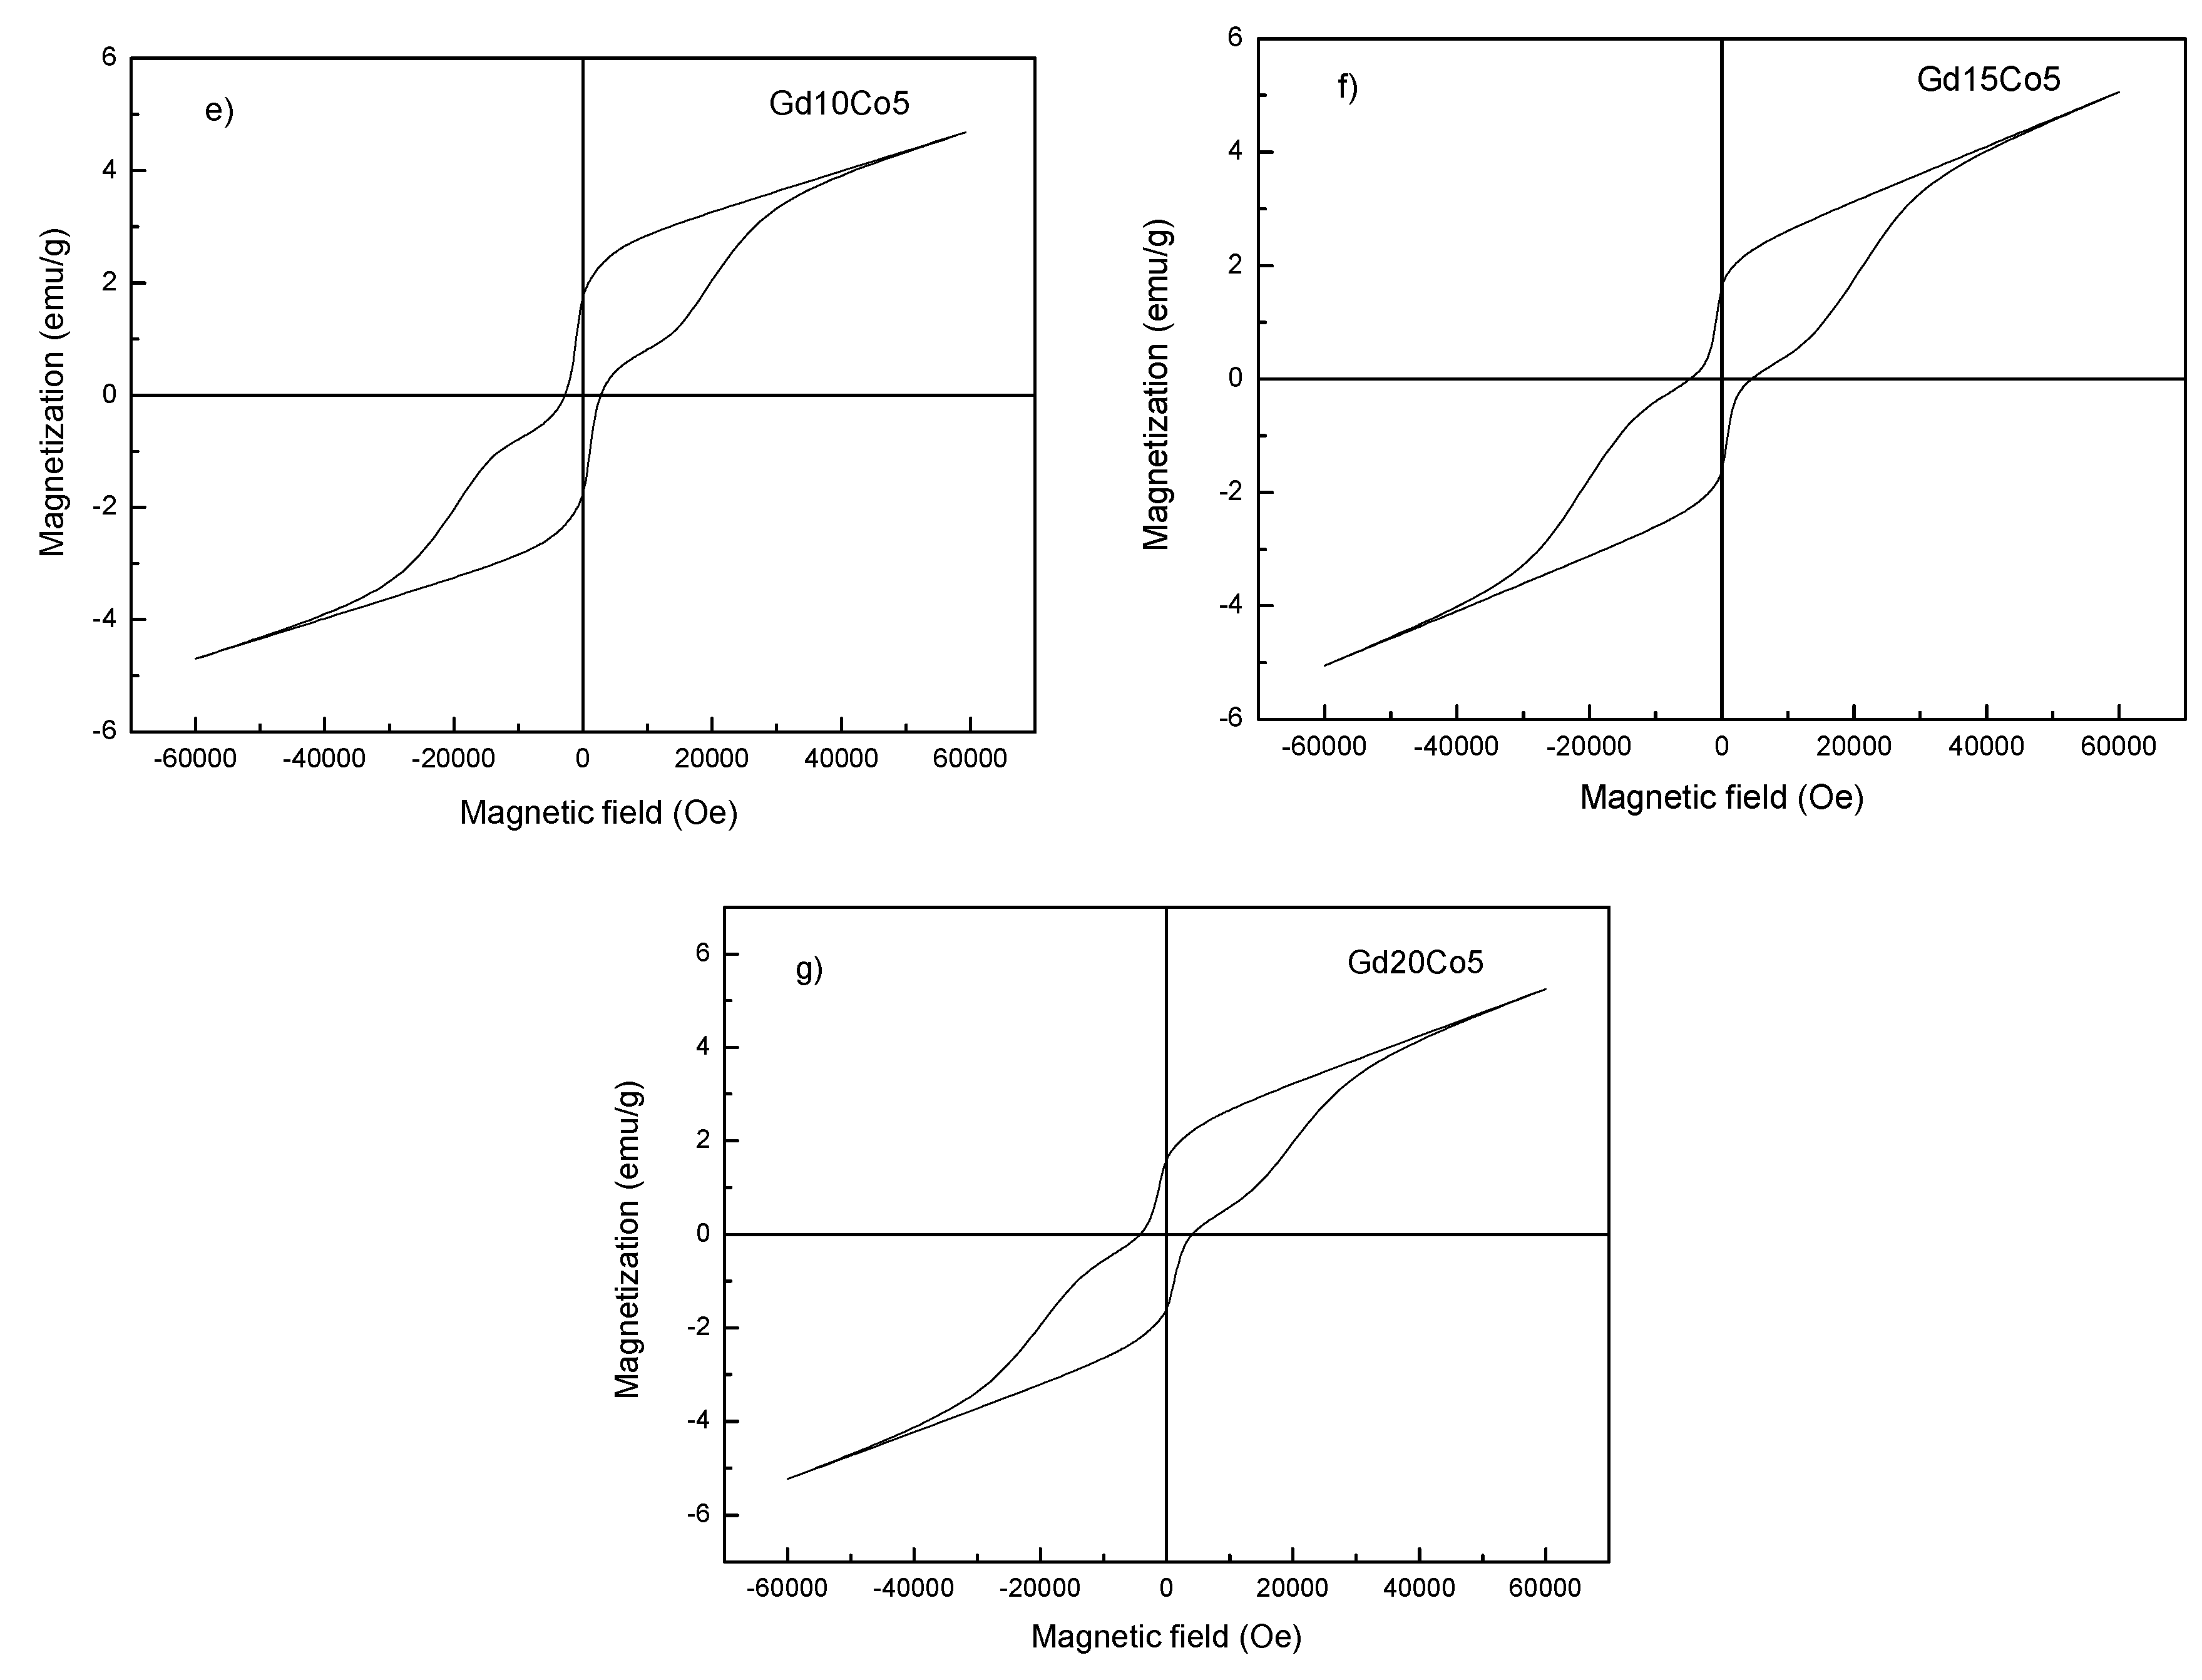
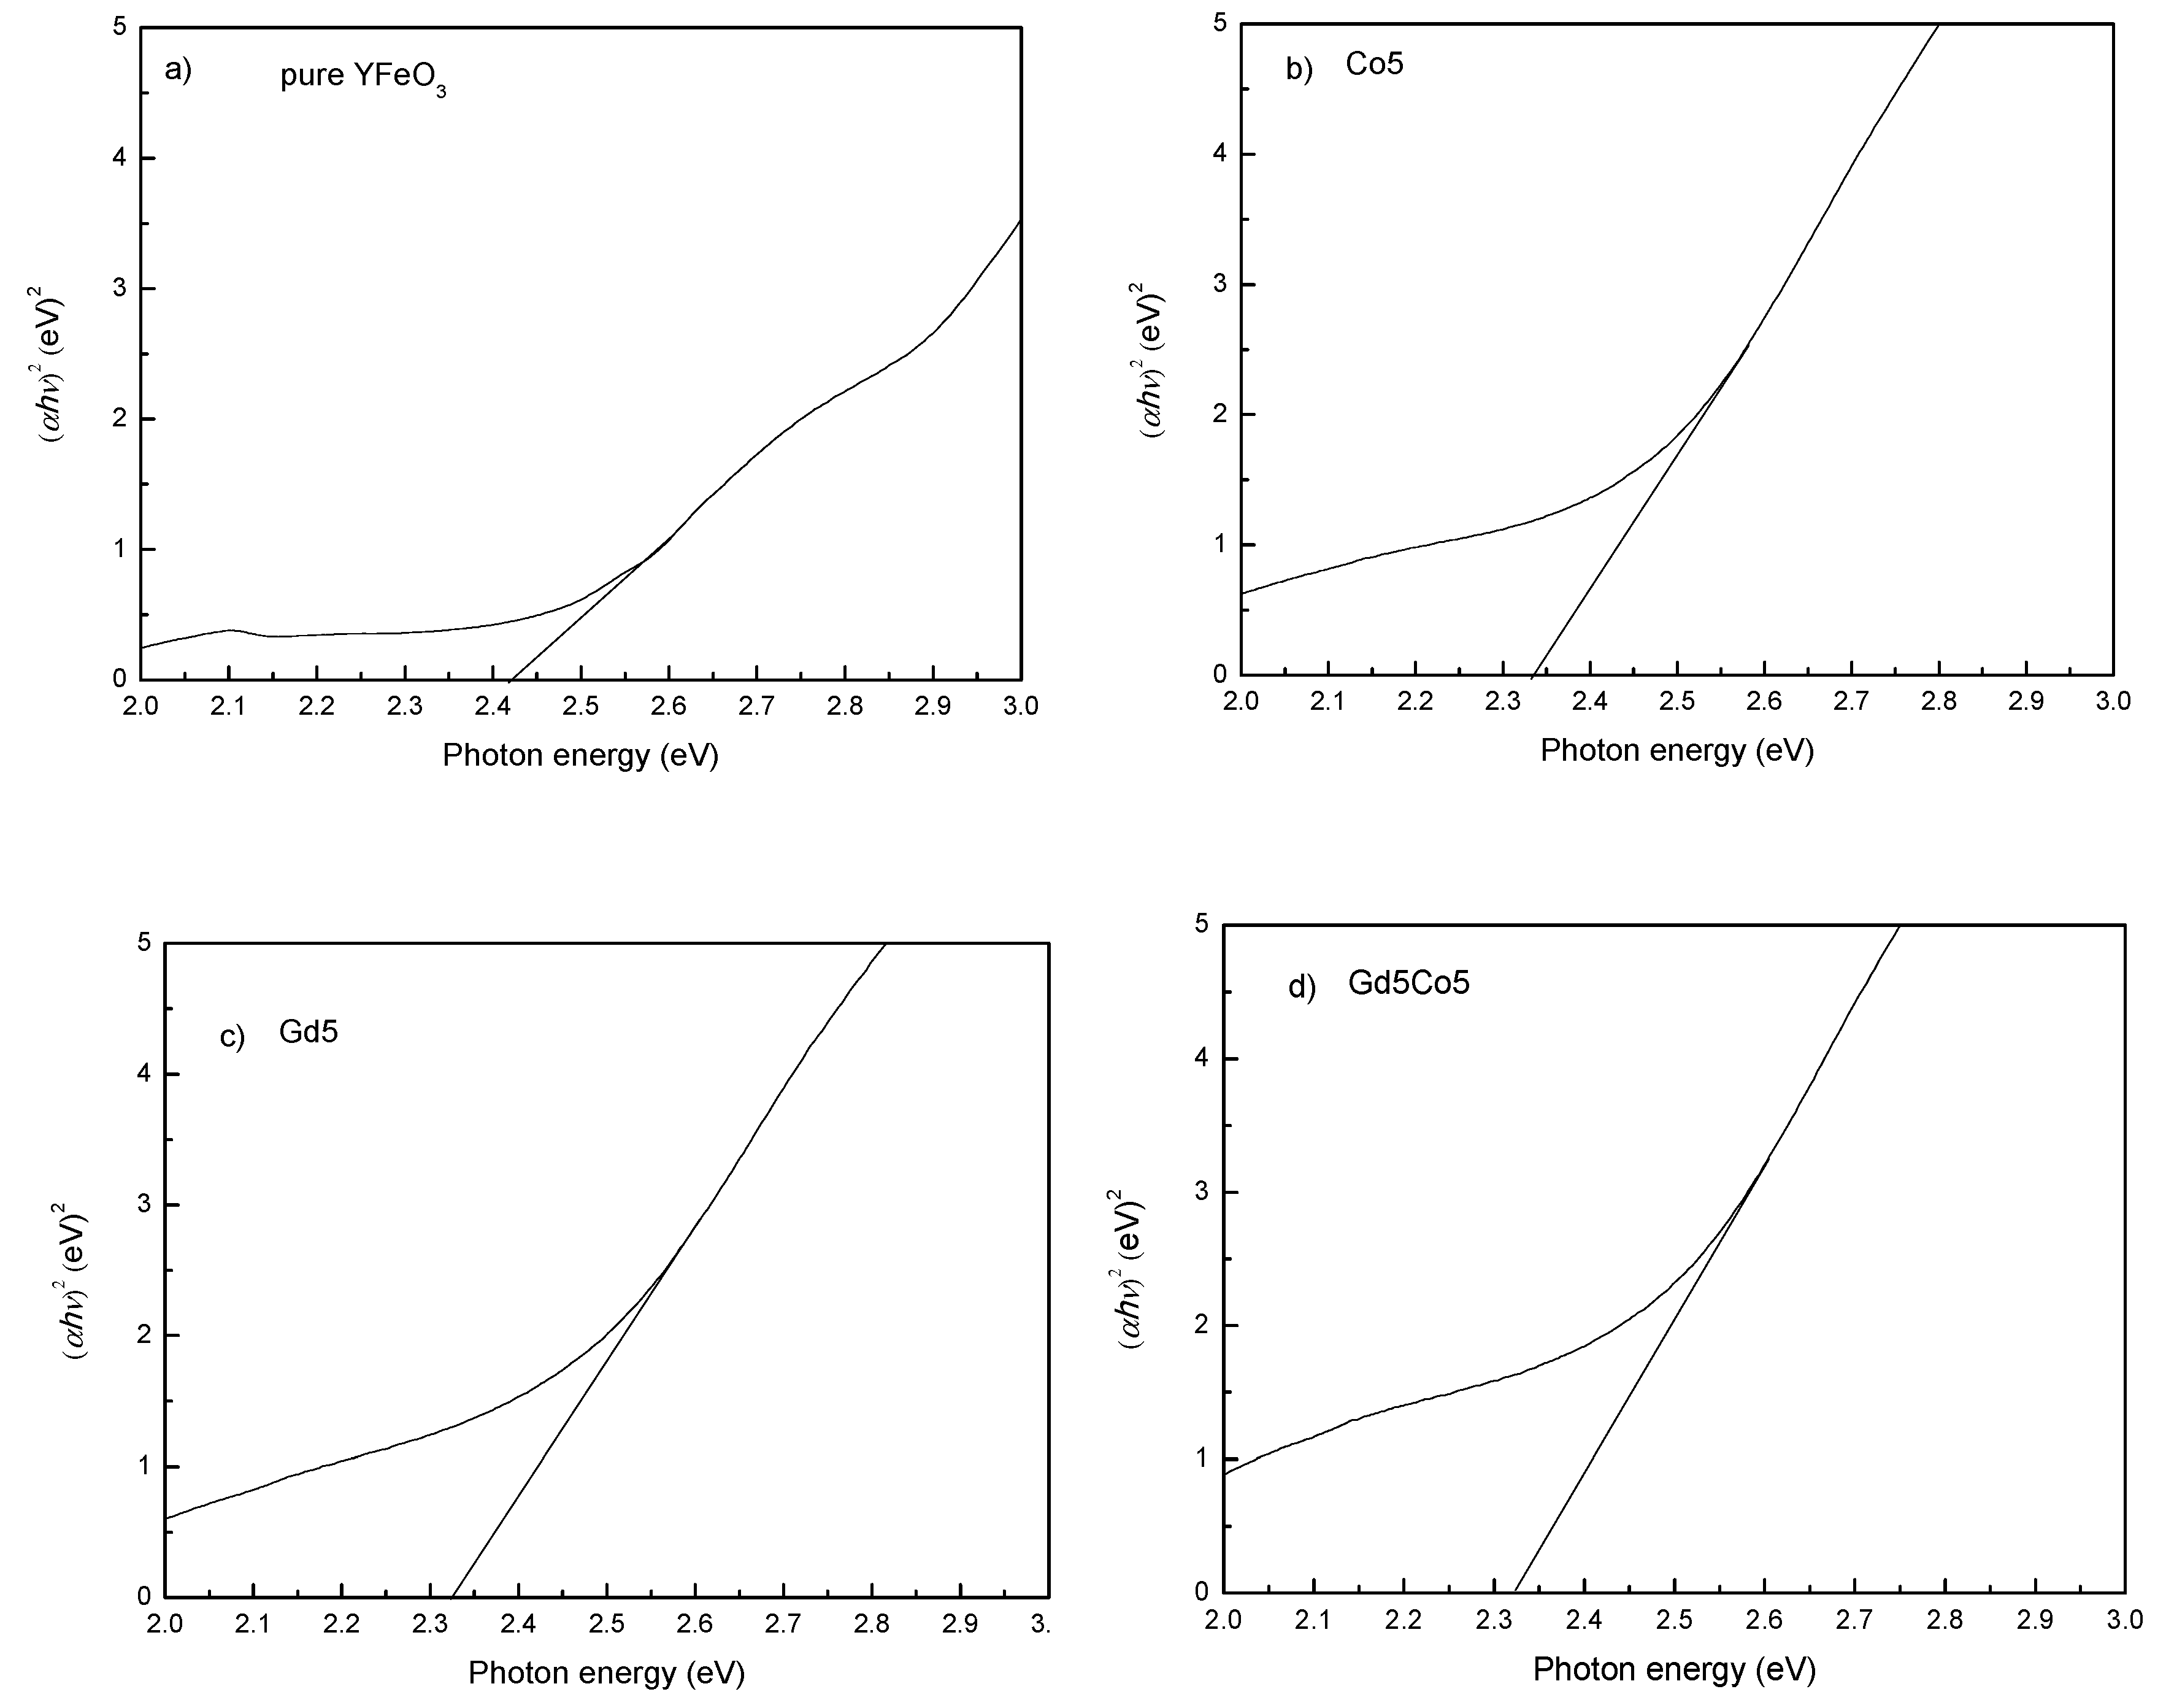
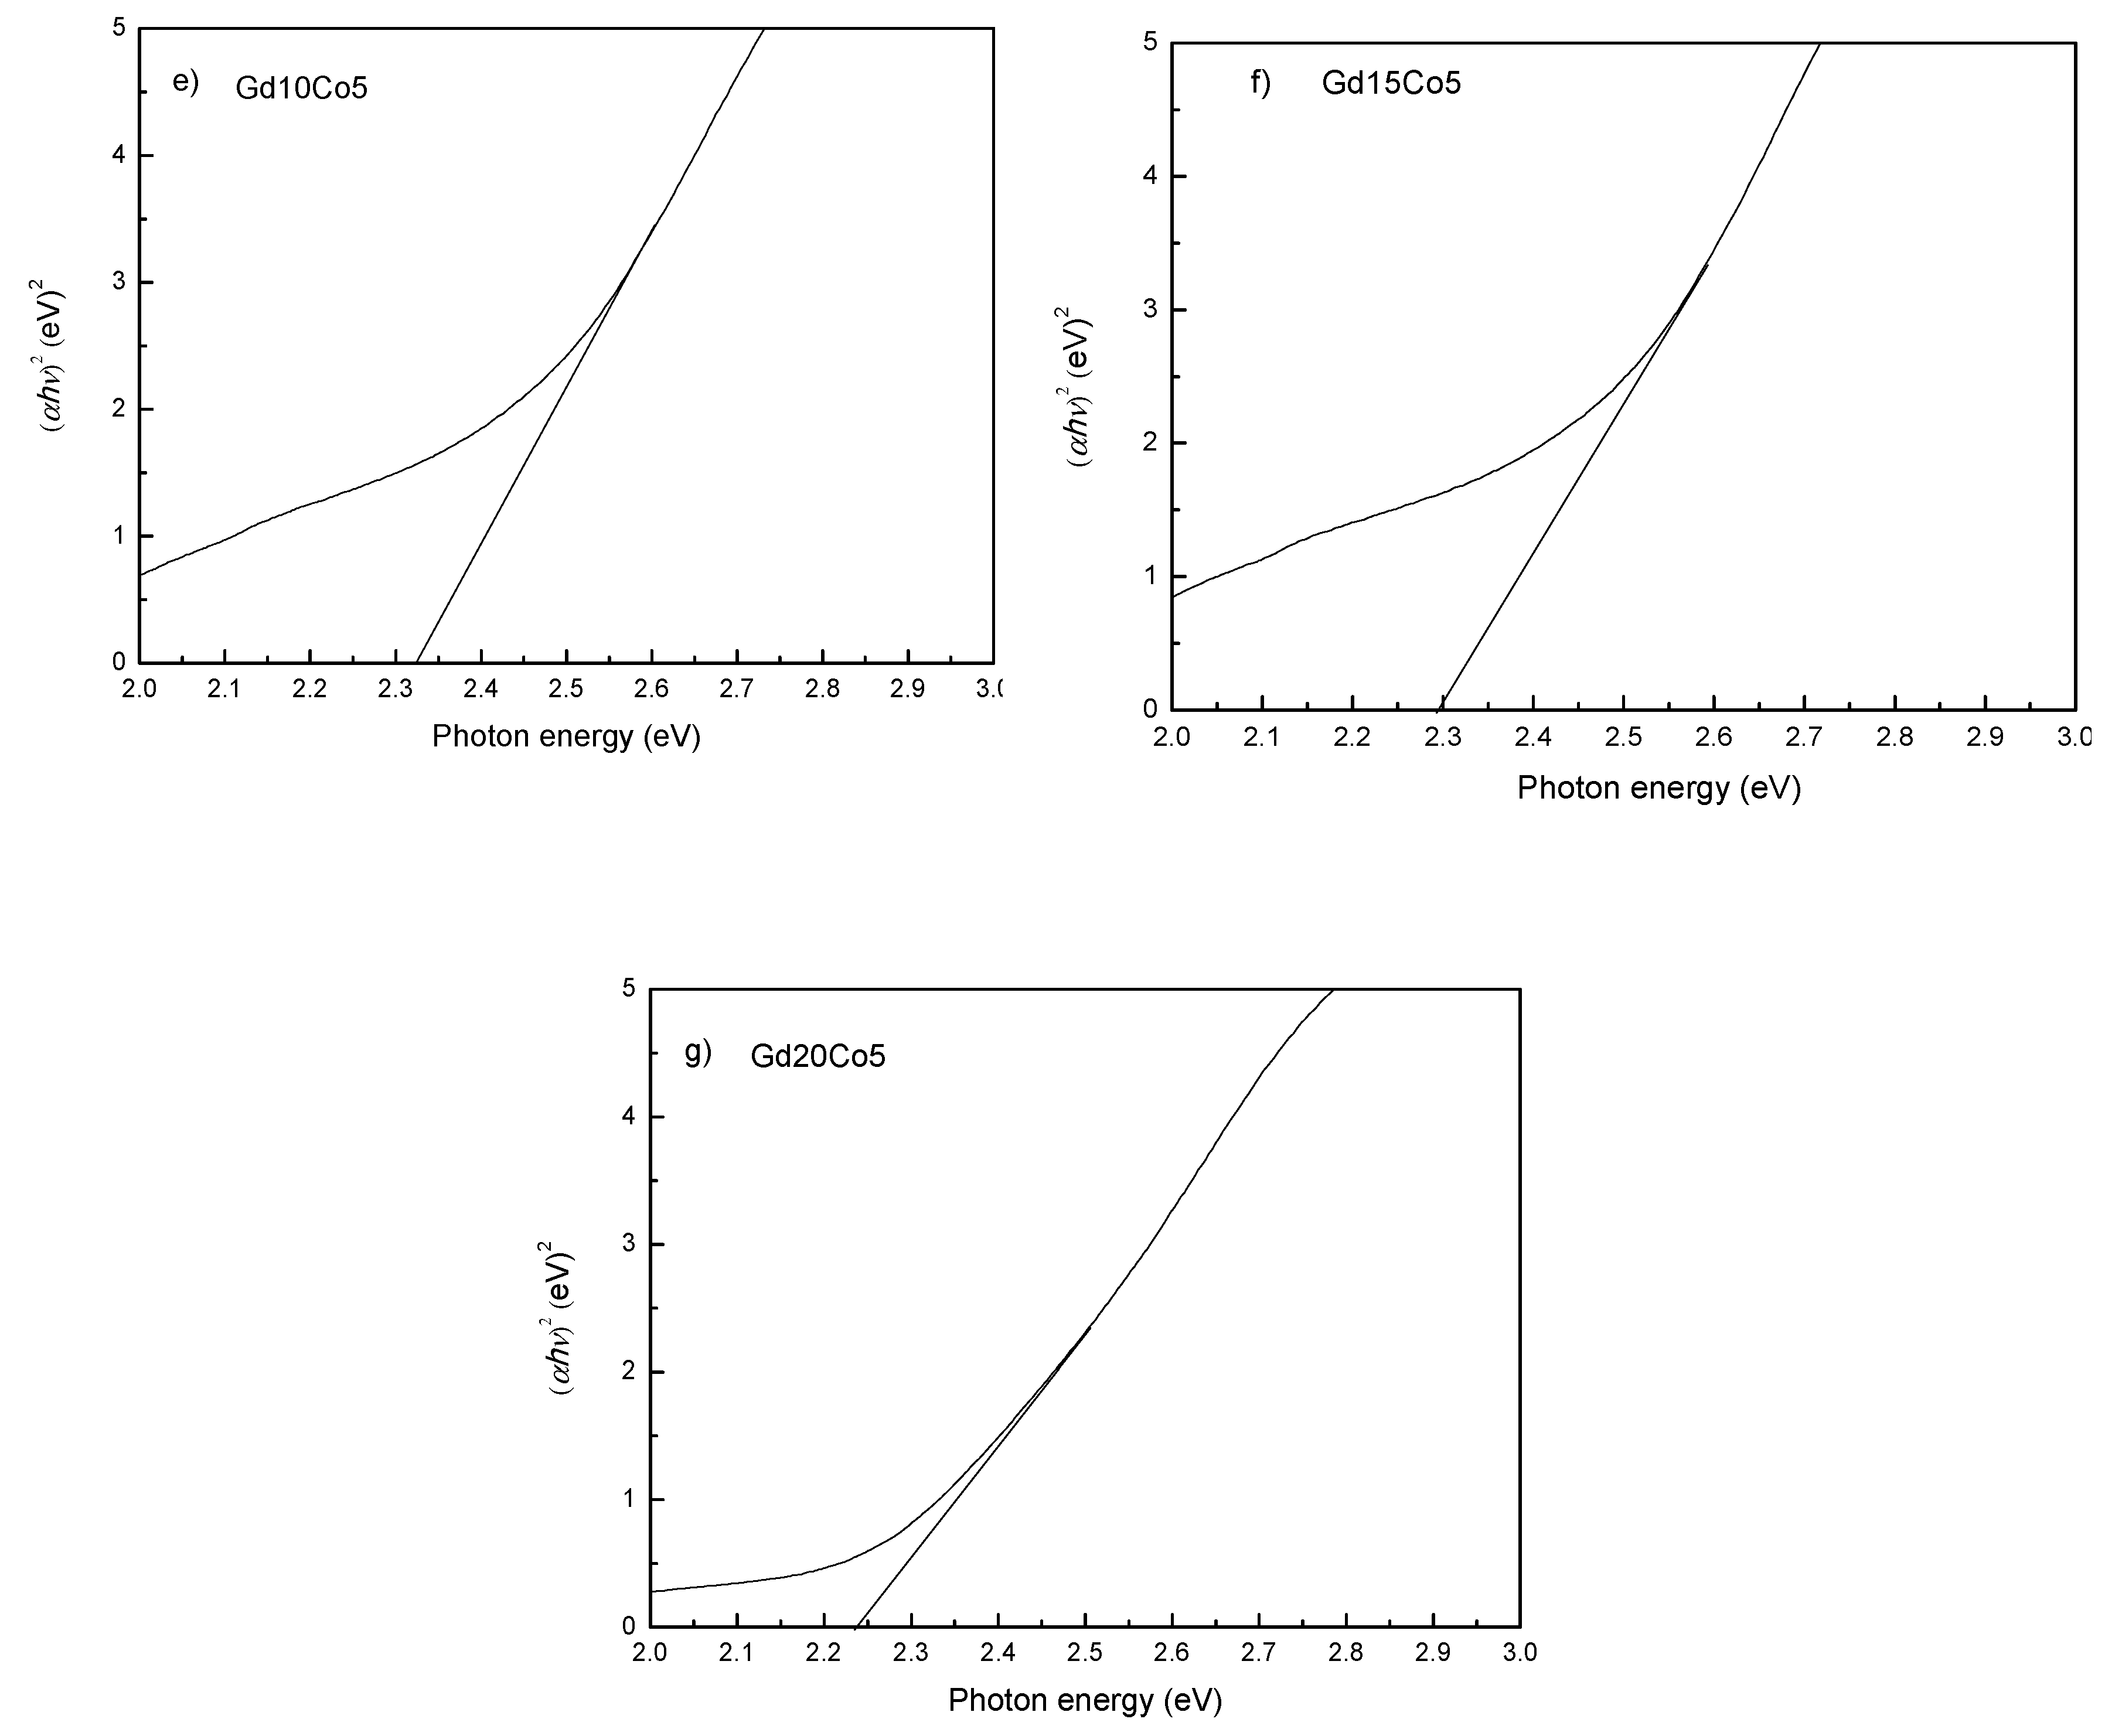
| Sample | Mm (emu/g) | Mr (emu/g) | Hc (kOe) | Photon Energy (eV) |
|---|---|---|---|---|
| Pure YFO | 3.49 | 0.88 | 160 | 2.42 |
| Co5 | 4.10 | 1.47 | 3700 | 2.34 |
| Gd5 | 4.56 | 0.84 | 170 | 2.33 |
| Gd5Co5 | 4.40 | 1.66 | 6800 | 2.32 |
| Gd10Co5 | 4.68 | 1.76 | 2800 | 2.32 |
| Gd15Co5 | 5.05 | 1.62 | 4800 | 2.29 |
| Gd20Co5 | 5.24 | 1.60 | 4200 | 2.24 |
© 2019 by the authors. Licensee MDPI, Basel, Switzerland. This article is an open access article distributed under the terms and conditions of the Creative Commons Attribution (CC BY) license (http://creativecommons.org/licenses/by/4.0/).
Share and Cite
Wang, M.; Wang, T. Structural, Magnetic and Optical Properties of Gd and Co Co-Doped YFeO3 Nanopowders. Materials 2019, 12, 2423. https://doi.org/10.3390/ma12152423
Wang M, Wang T. Structural, Magnetic and Optical Properties of Gd and Co Co-Doped YFeO3 Nanopowders. Materials. 2019; 12(15):2423. https://doi.org/10.3390/ma12152423
Chicago/Turabian StyleWang, Meng, and Ting Wang. 2019. "Structural, Magnetic and Optical Properties of Gd and Co Co-Doped YFeO3 Nanopowders" Materials 12, no. 15: 2423. https://doi.org/10.3390/ma12152423
APA StyleWang, M., & Wang, T. (2019). Structural, Magnetic and Optical Properties of Gd and Co Co-Doped YFeO3 Nanopowders. Materials, 12(15), 2423. https://doi.org/10.3390/ma12152423