Xenon Diffusion Mechanism and Xenon Bubble Nucleation and Growth Behaviors in Molybdenum via Molecular Dynamics Simulations


Abstract
1. Introduction
2. Simulation Method
2.1. The Interatomic Potential
2.2. The MD Simulation Setup
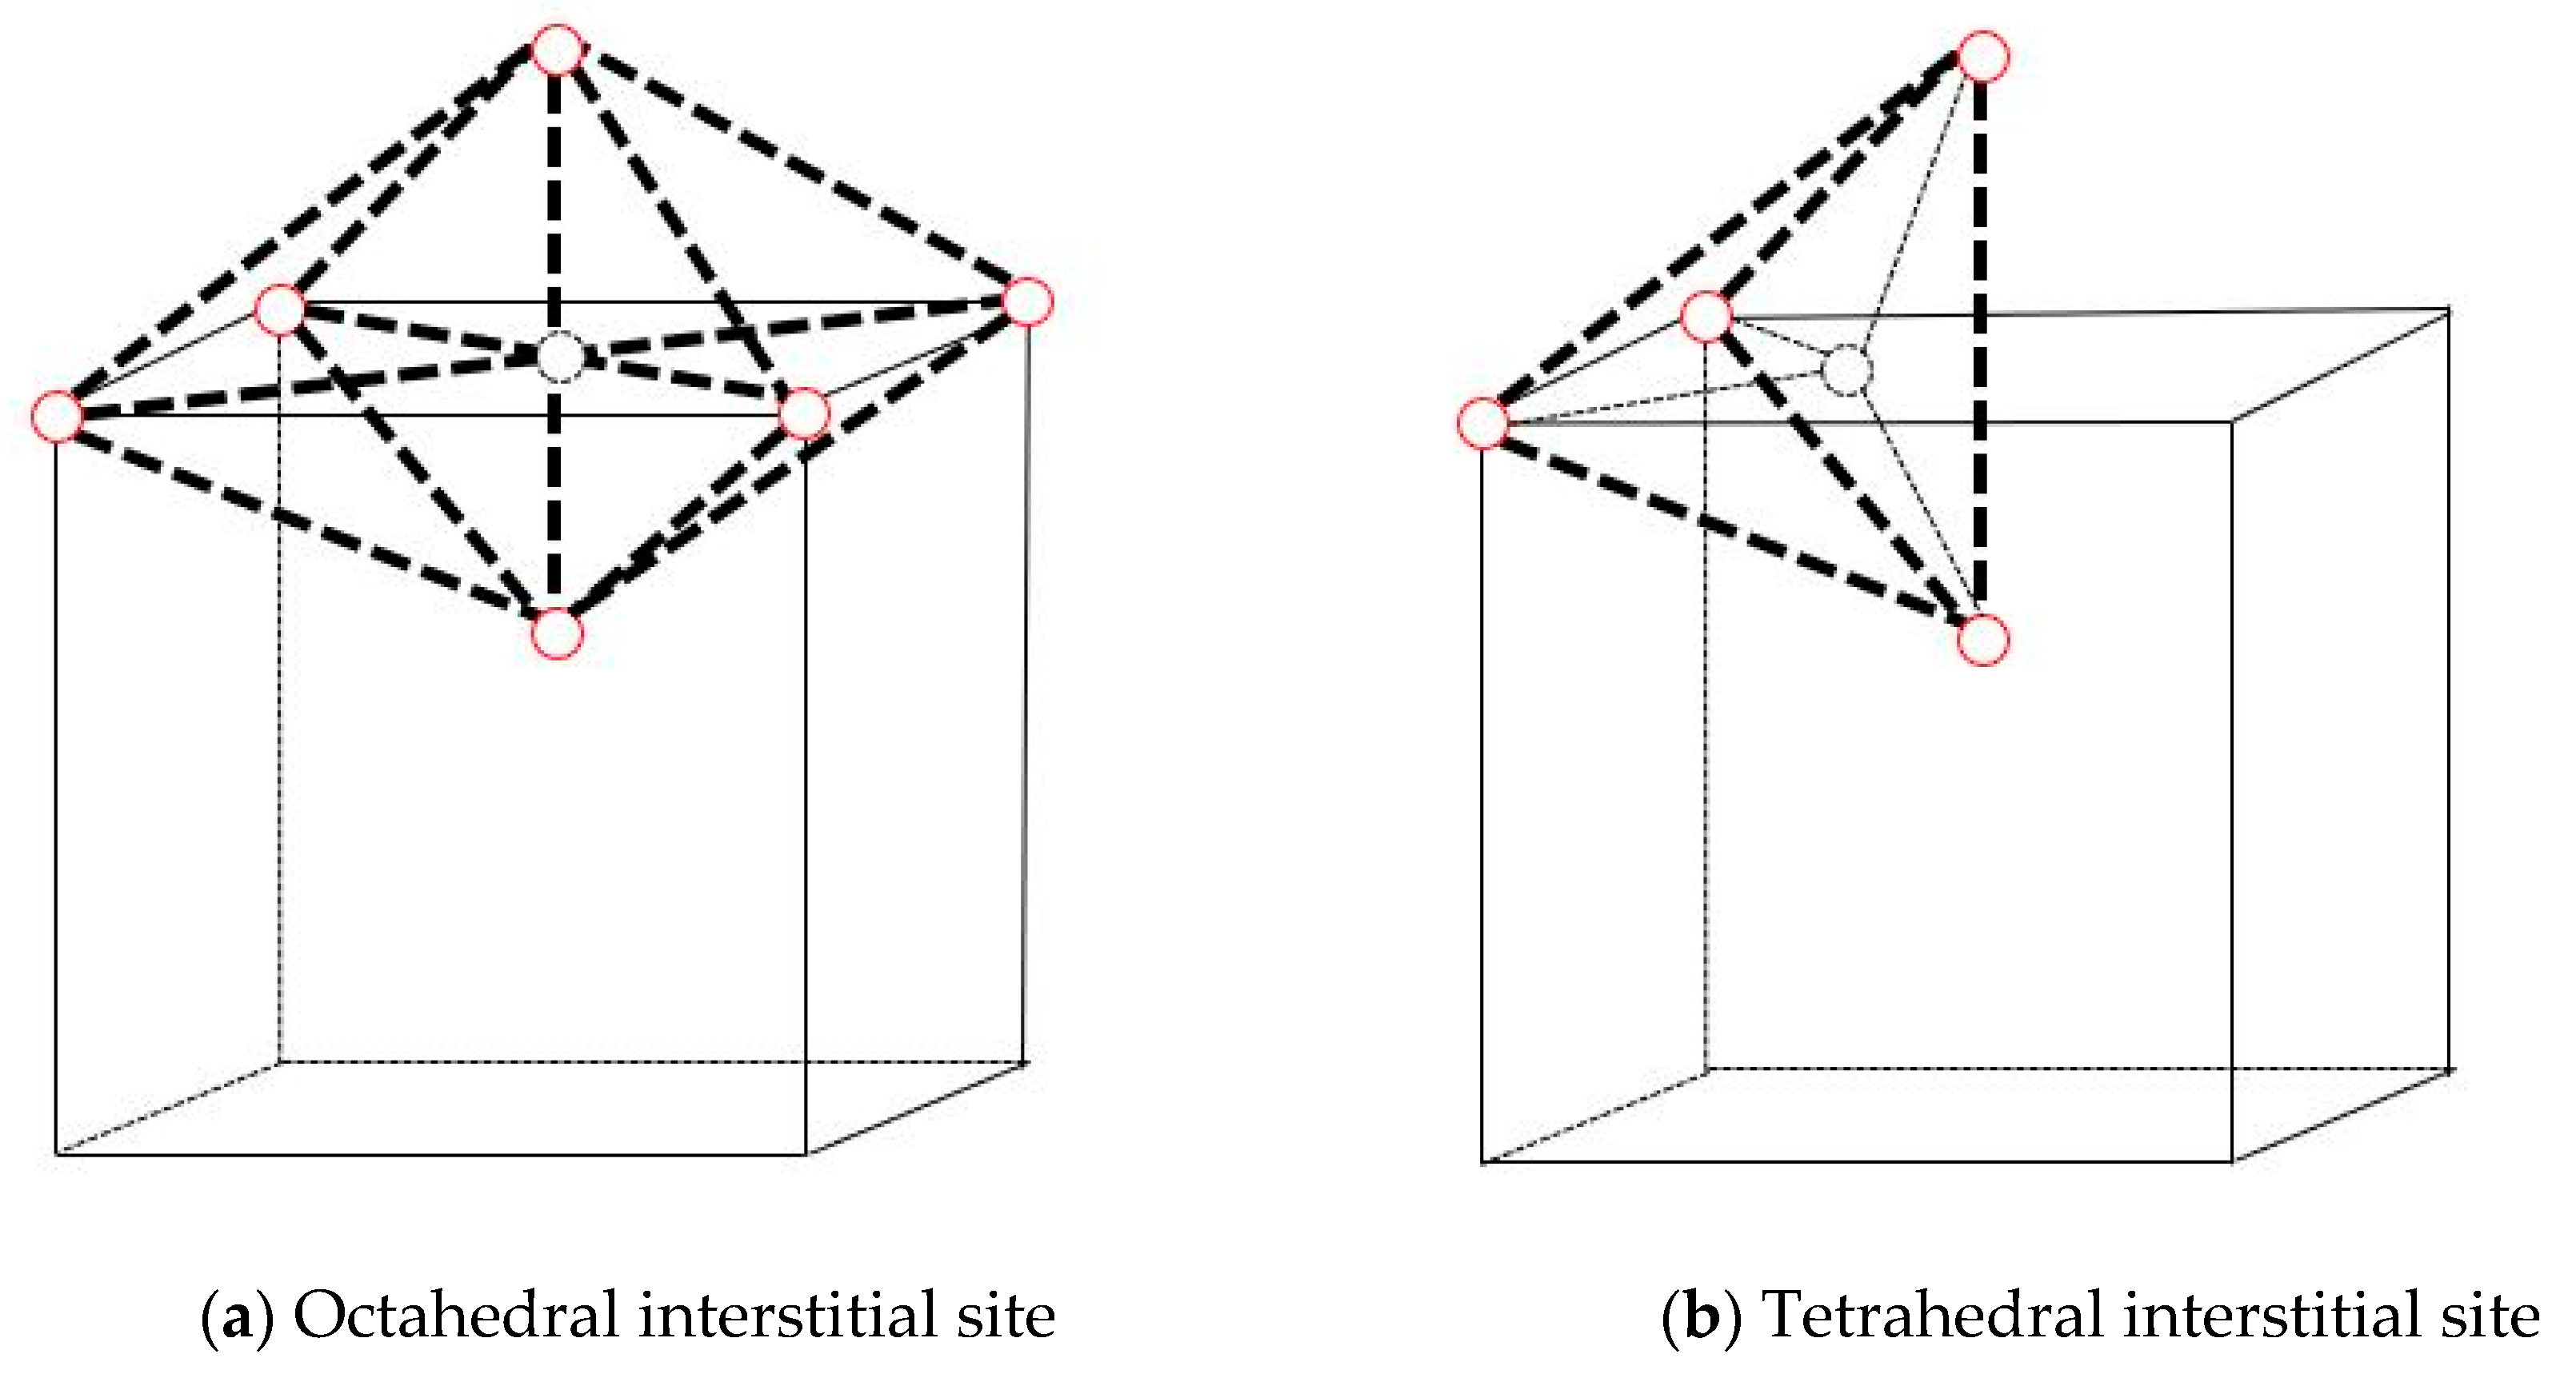
2.2.1. Stable Configuration of Xe in Mo
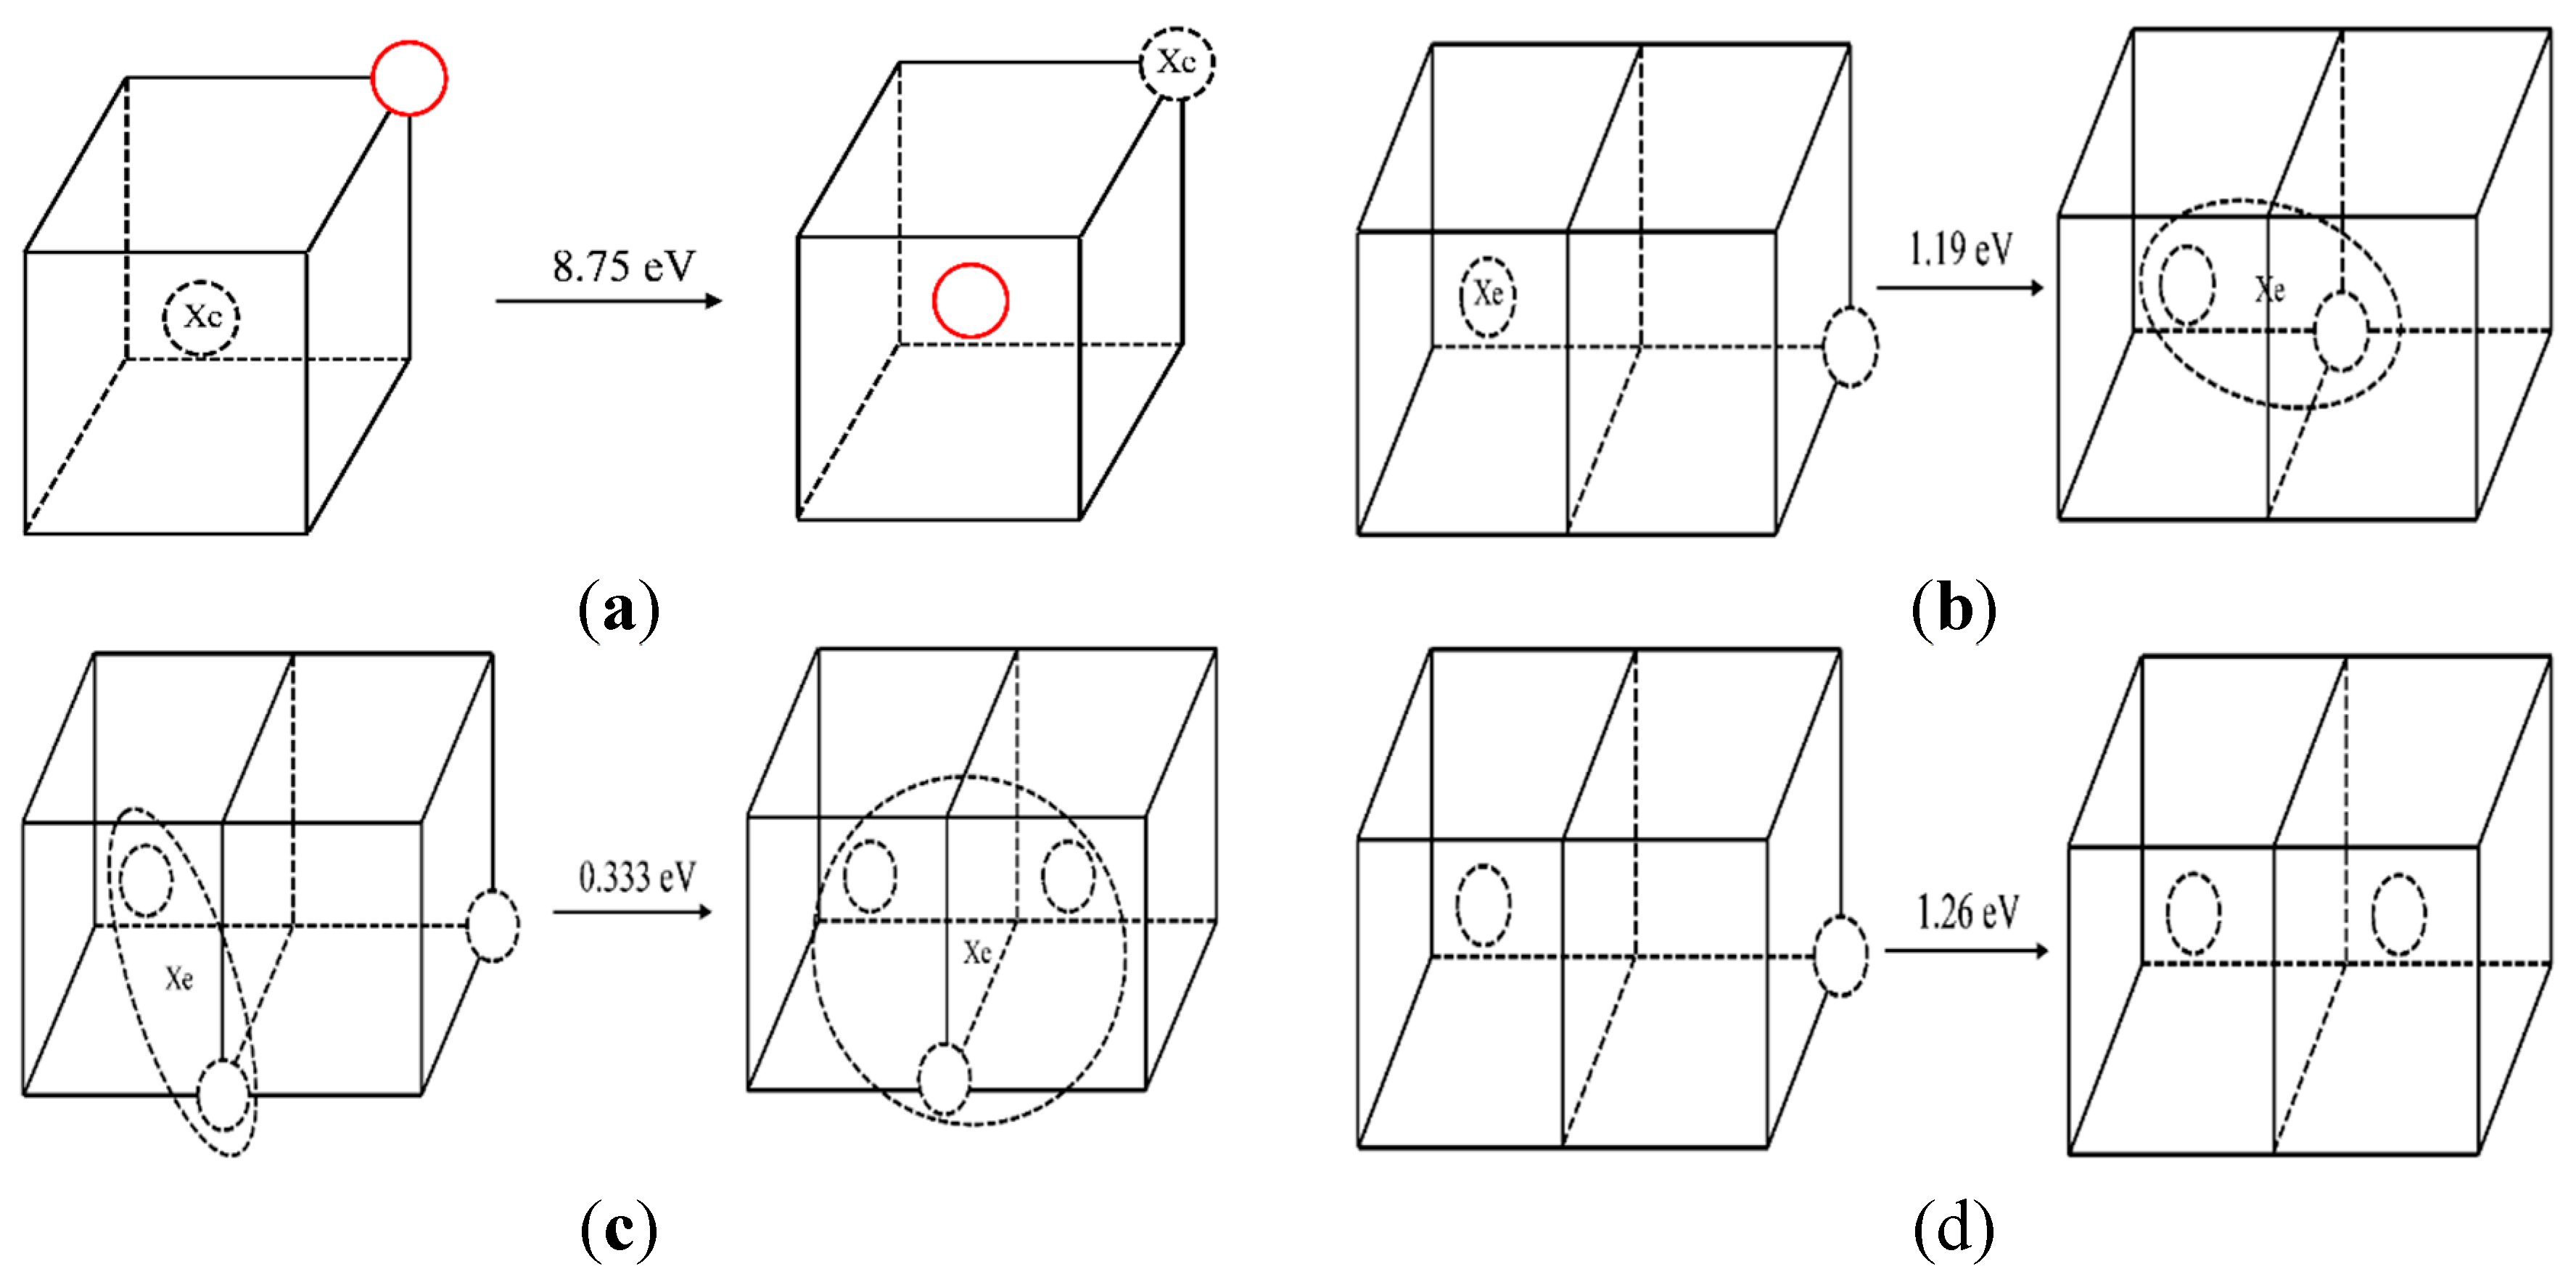
2.2.2. The Diffusion Mechanism of Xe in Mo
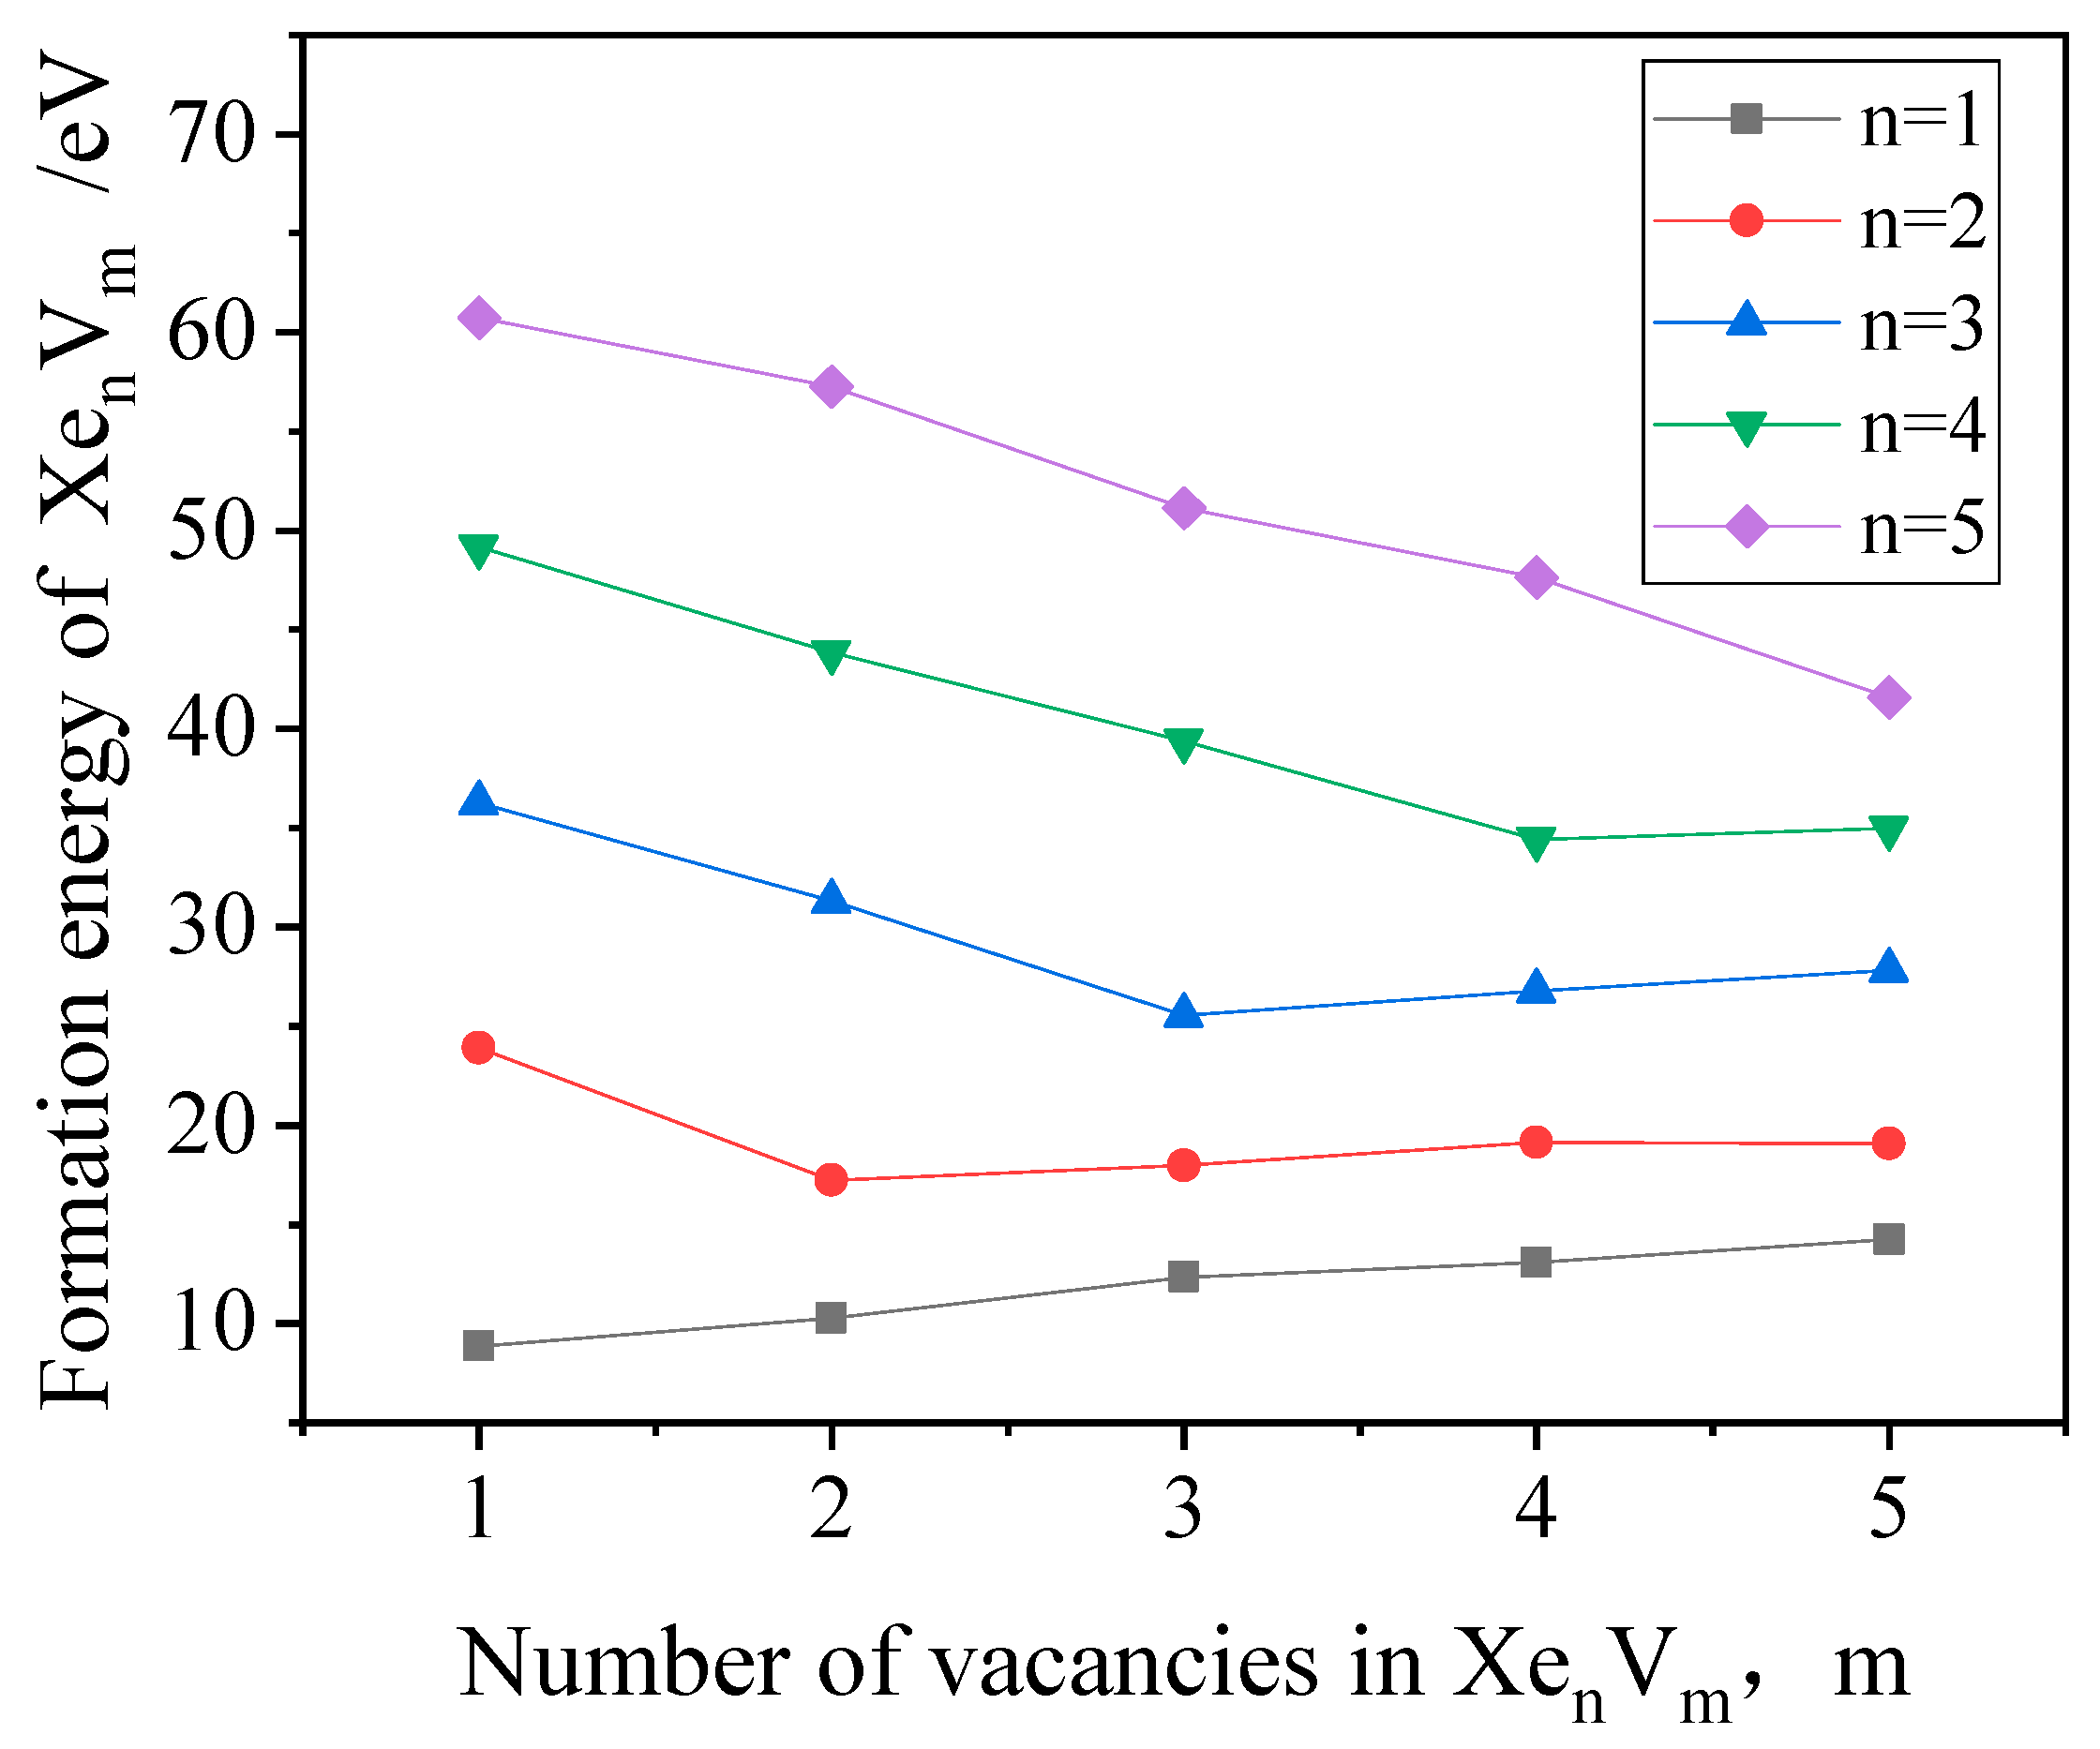
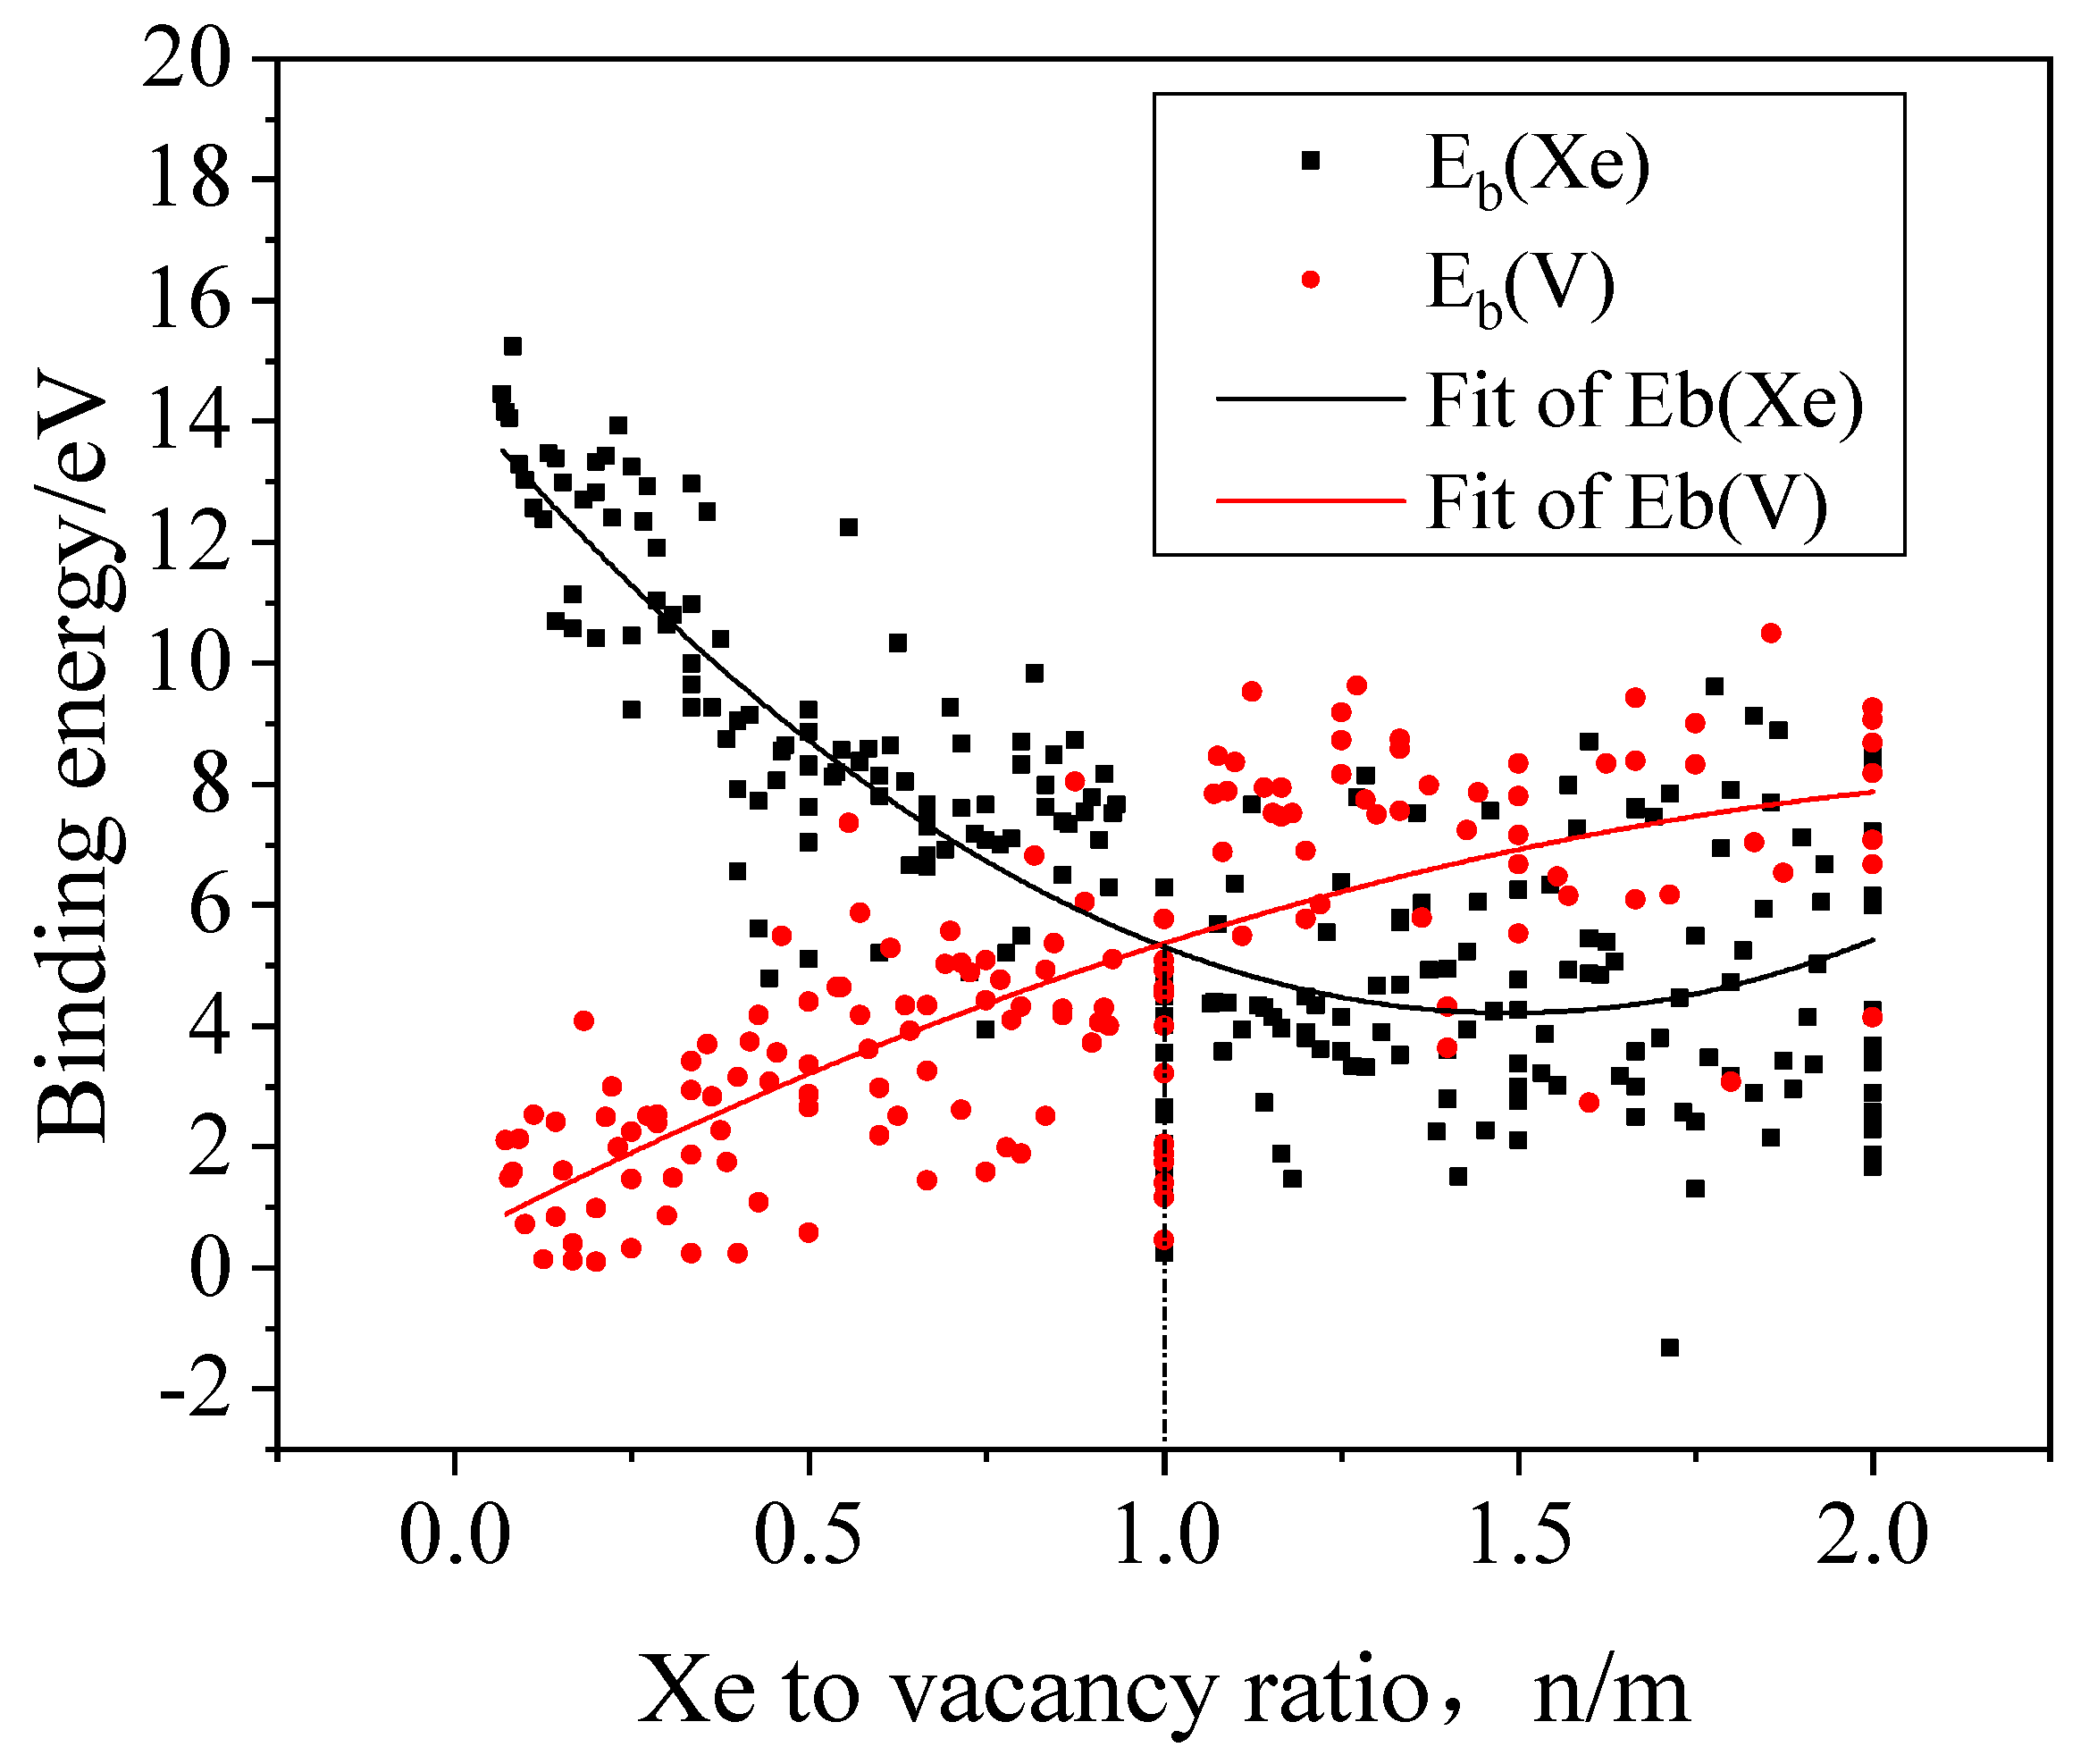
2.2.3. The Nucleation of Xe Bubbles in Mo
2.2.4. The Influence of Xe Bubbles on the Surrounding Vacancies
3. Results
3.1. Stable Configuration of Xe in Mo
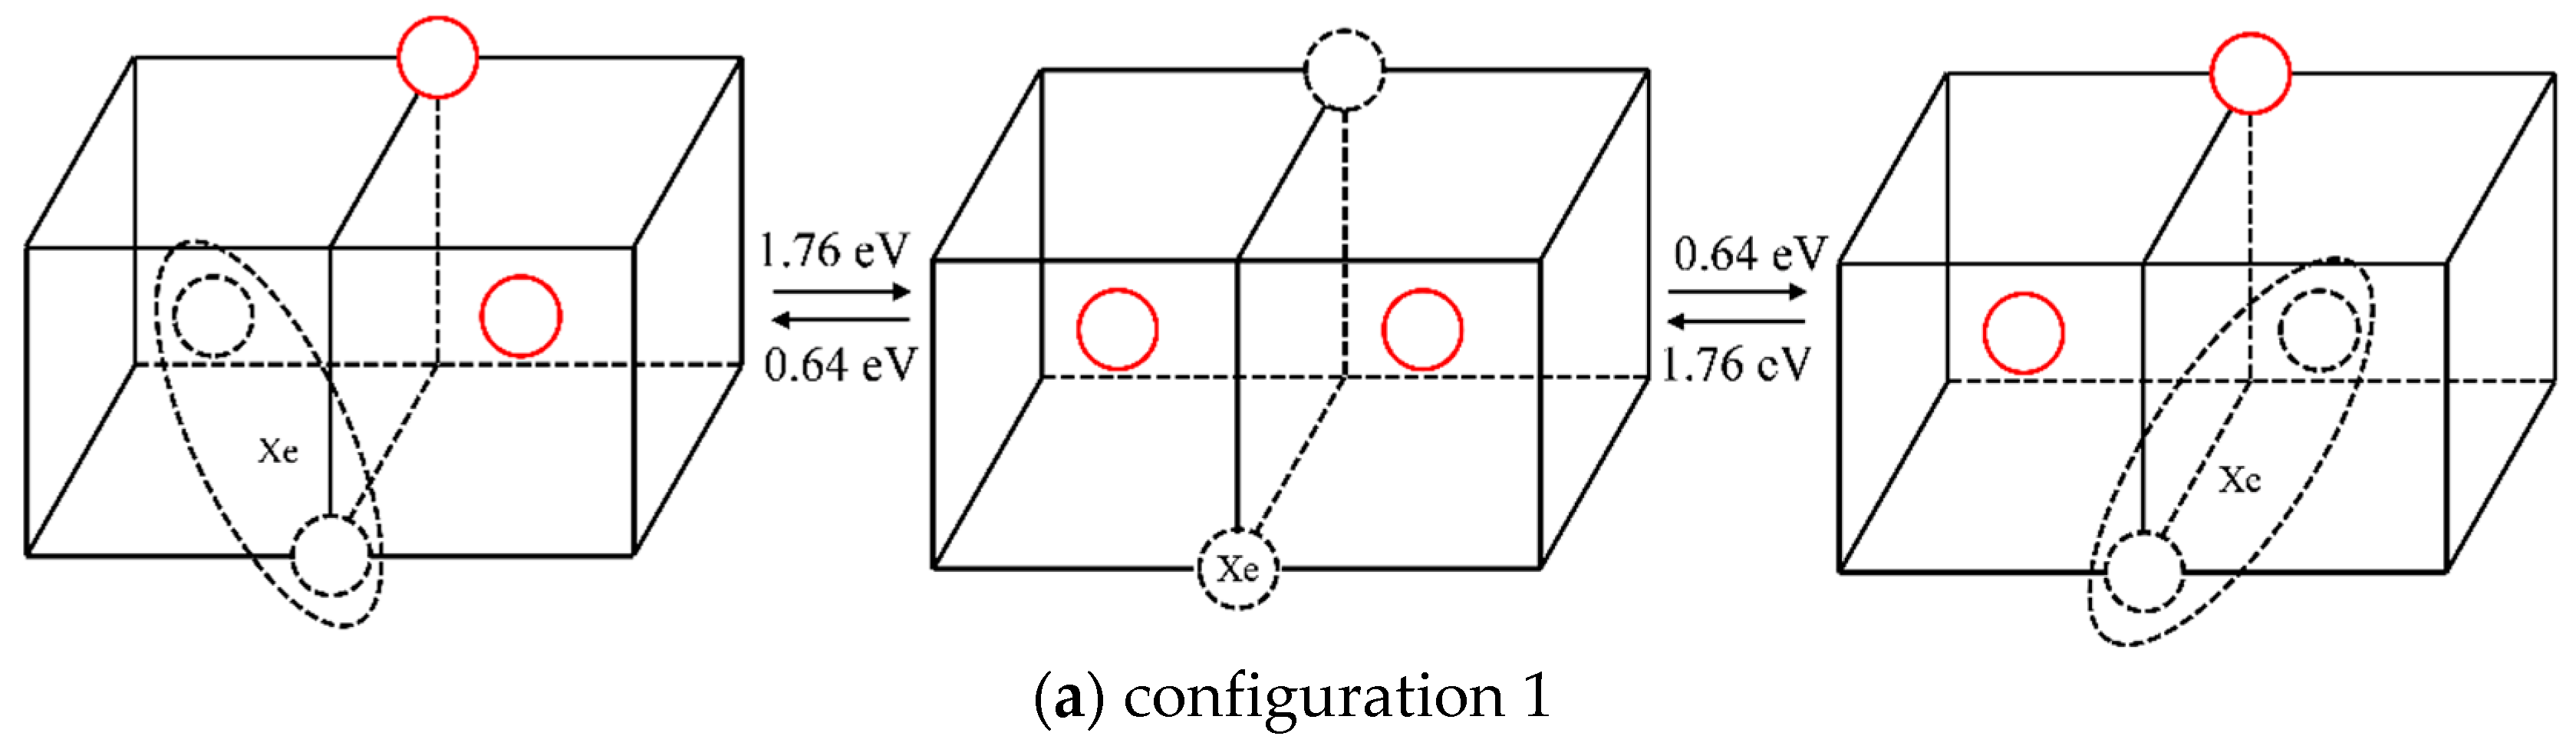
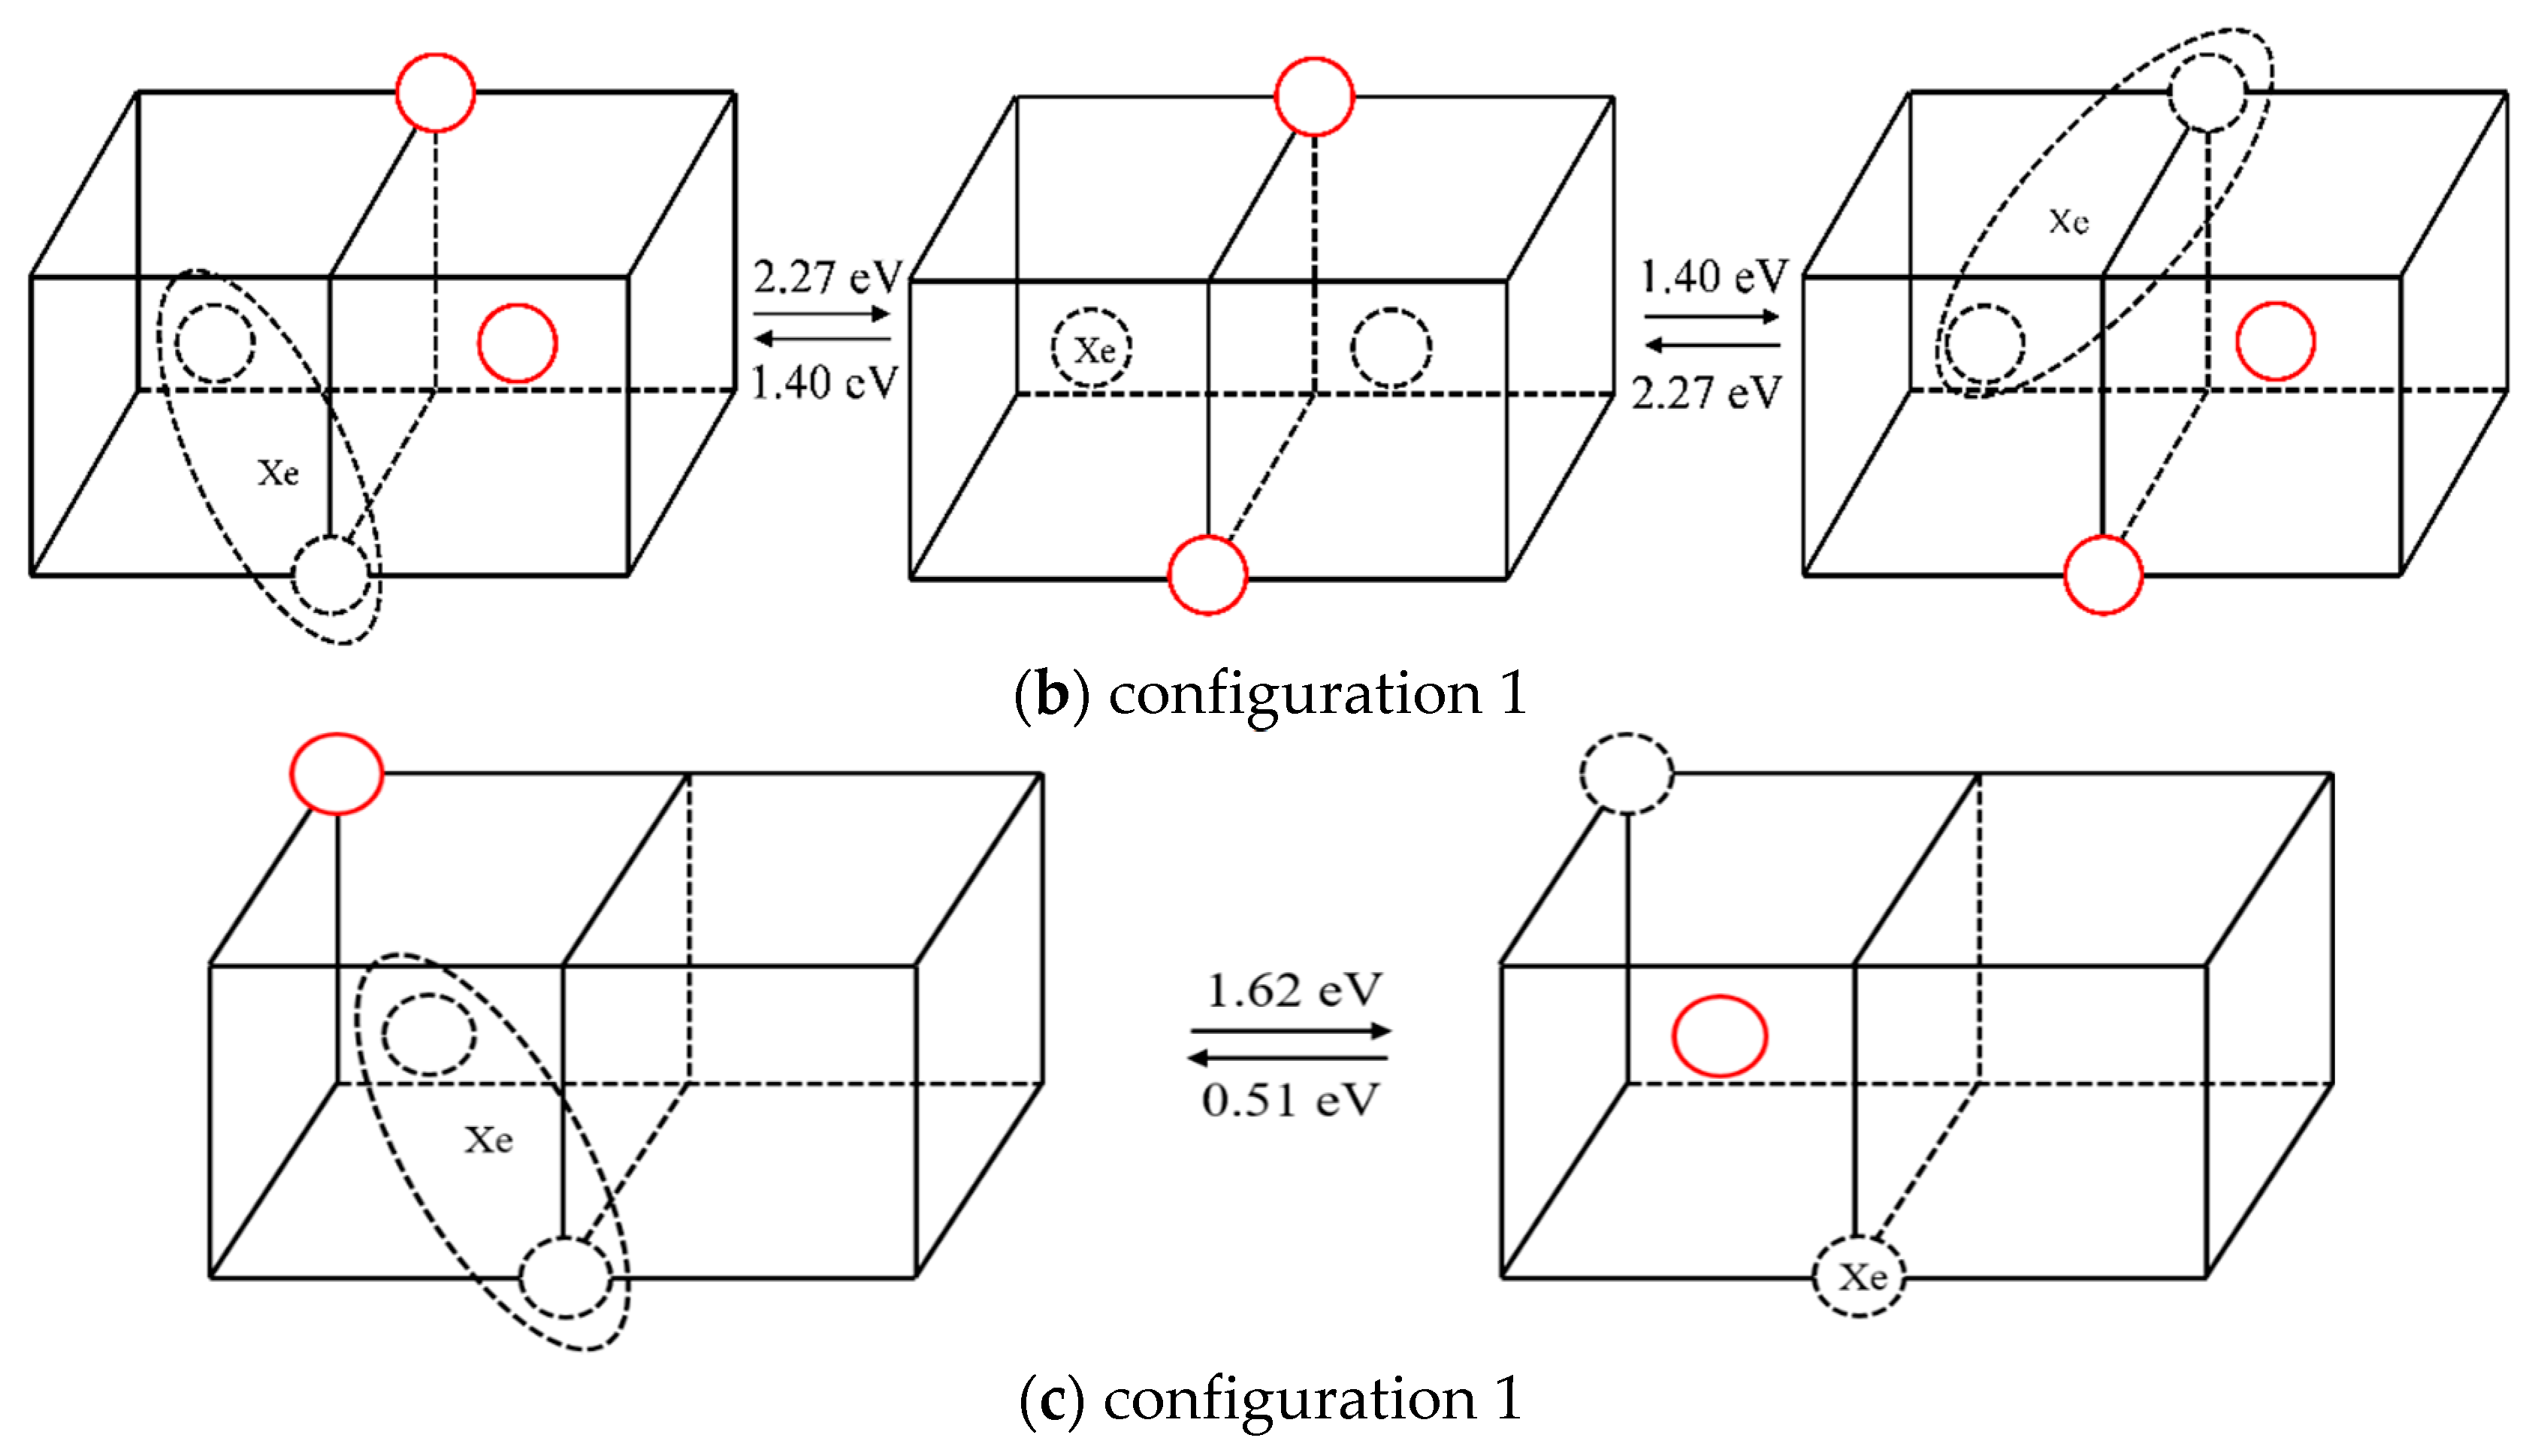
3.2. The Diffusion Mechanism of Xe in Mo
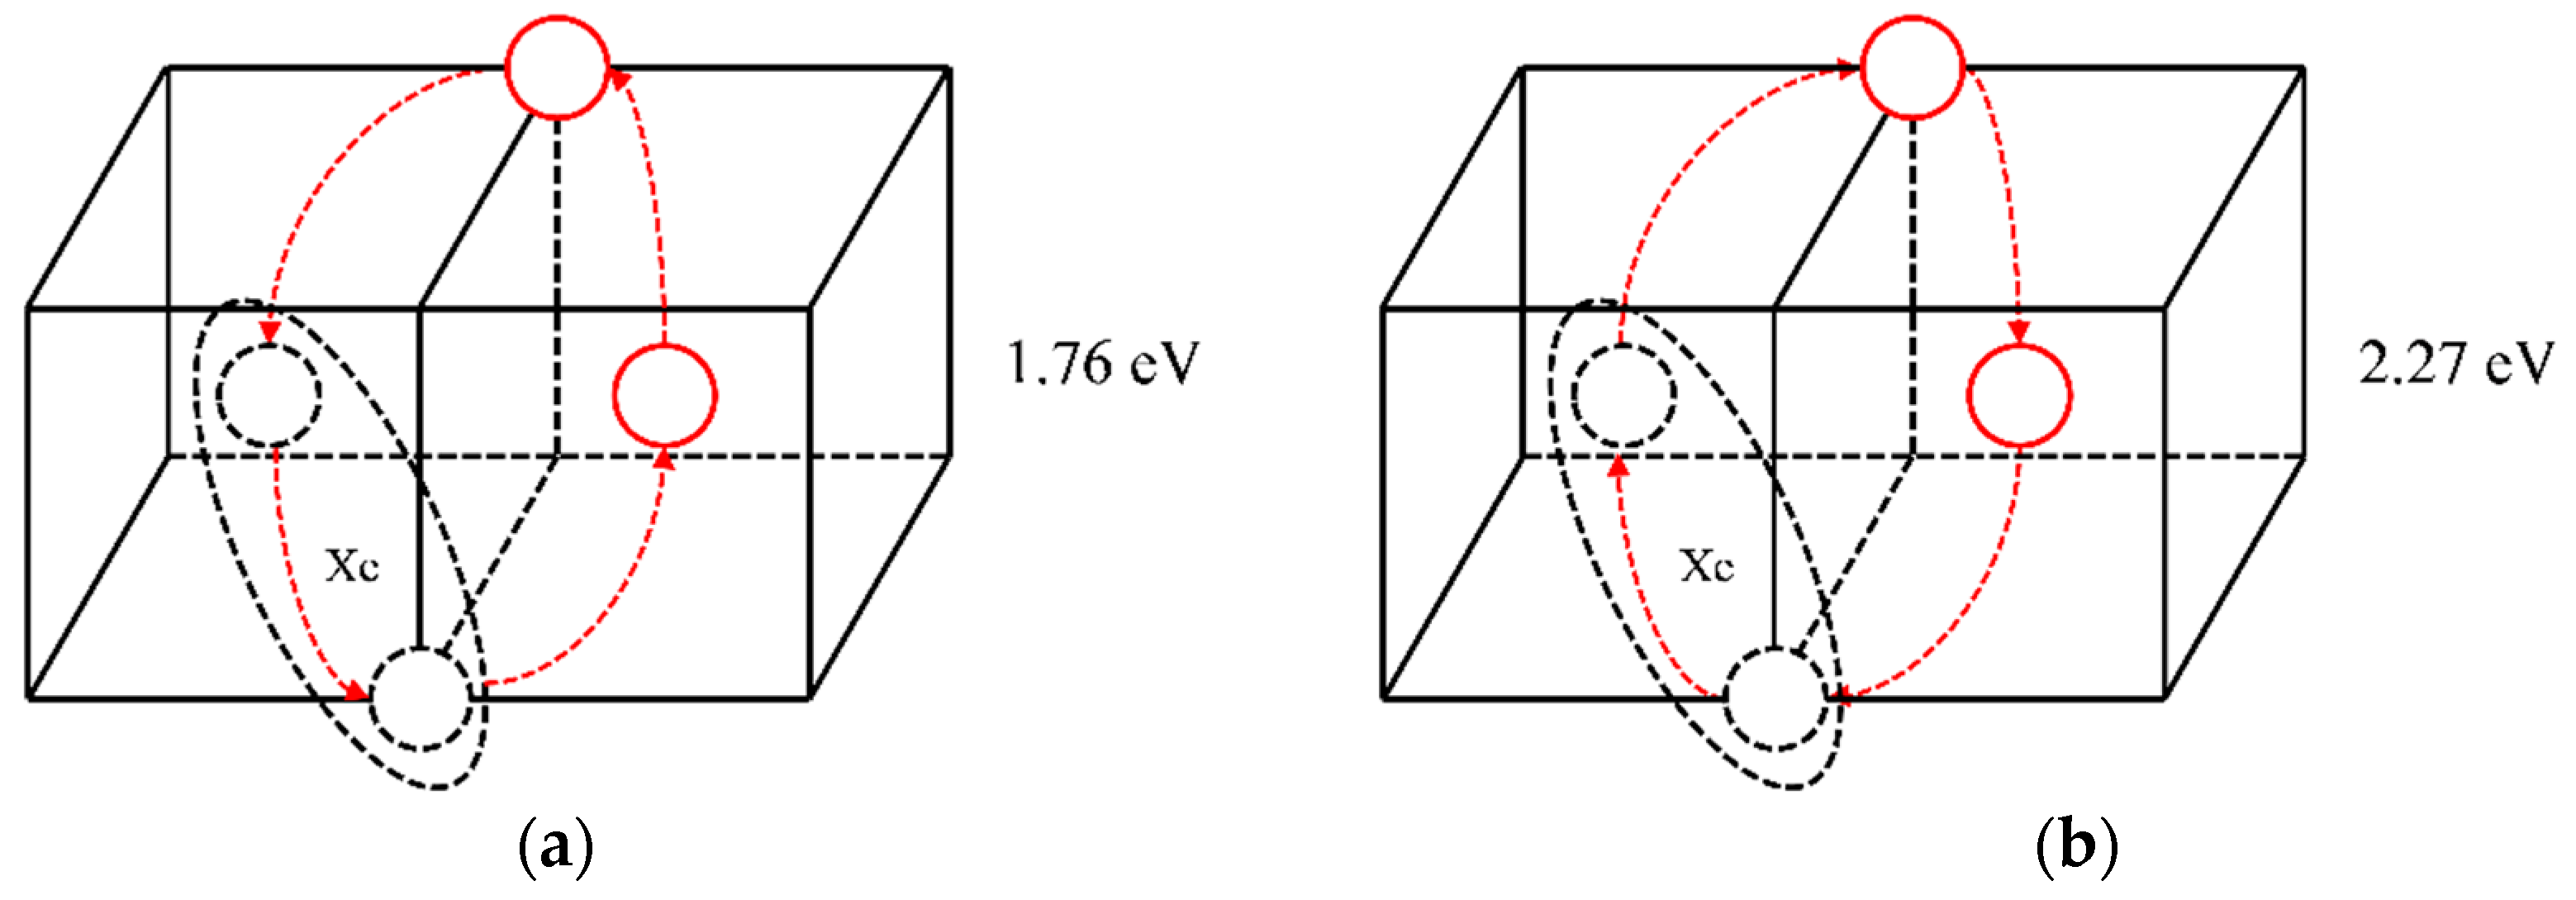
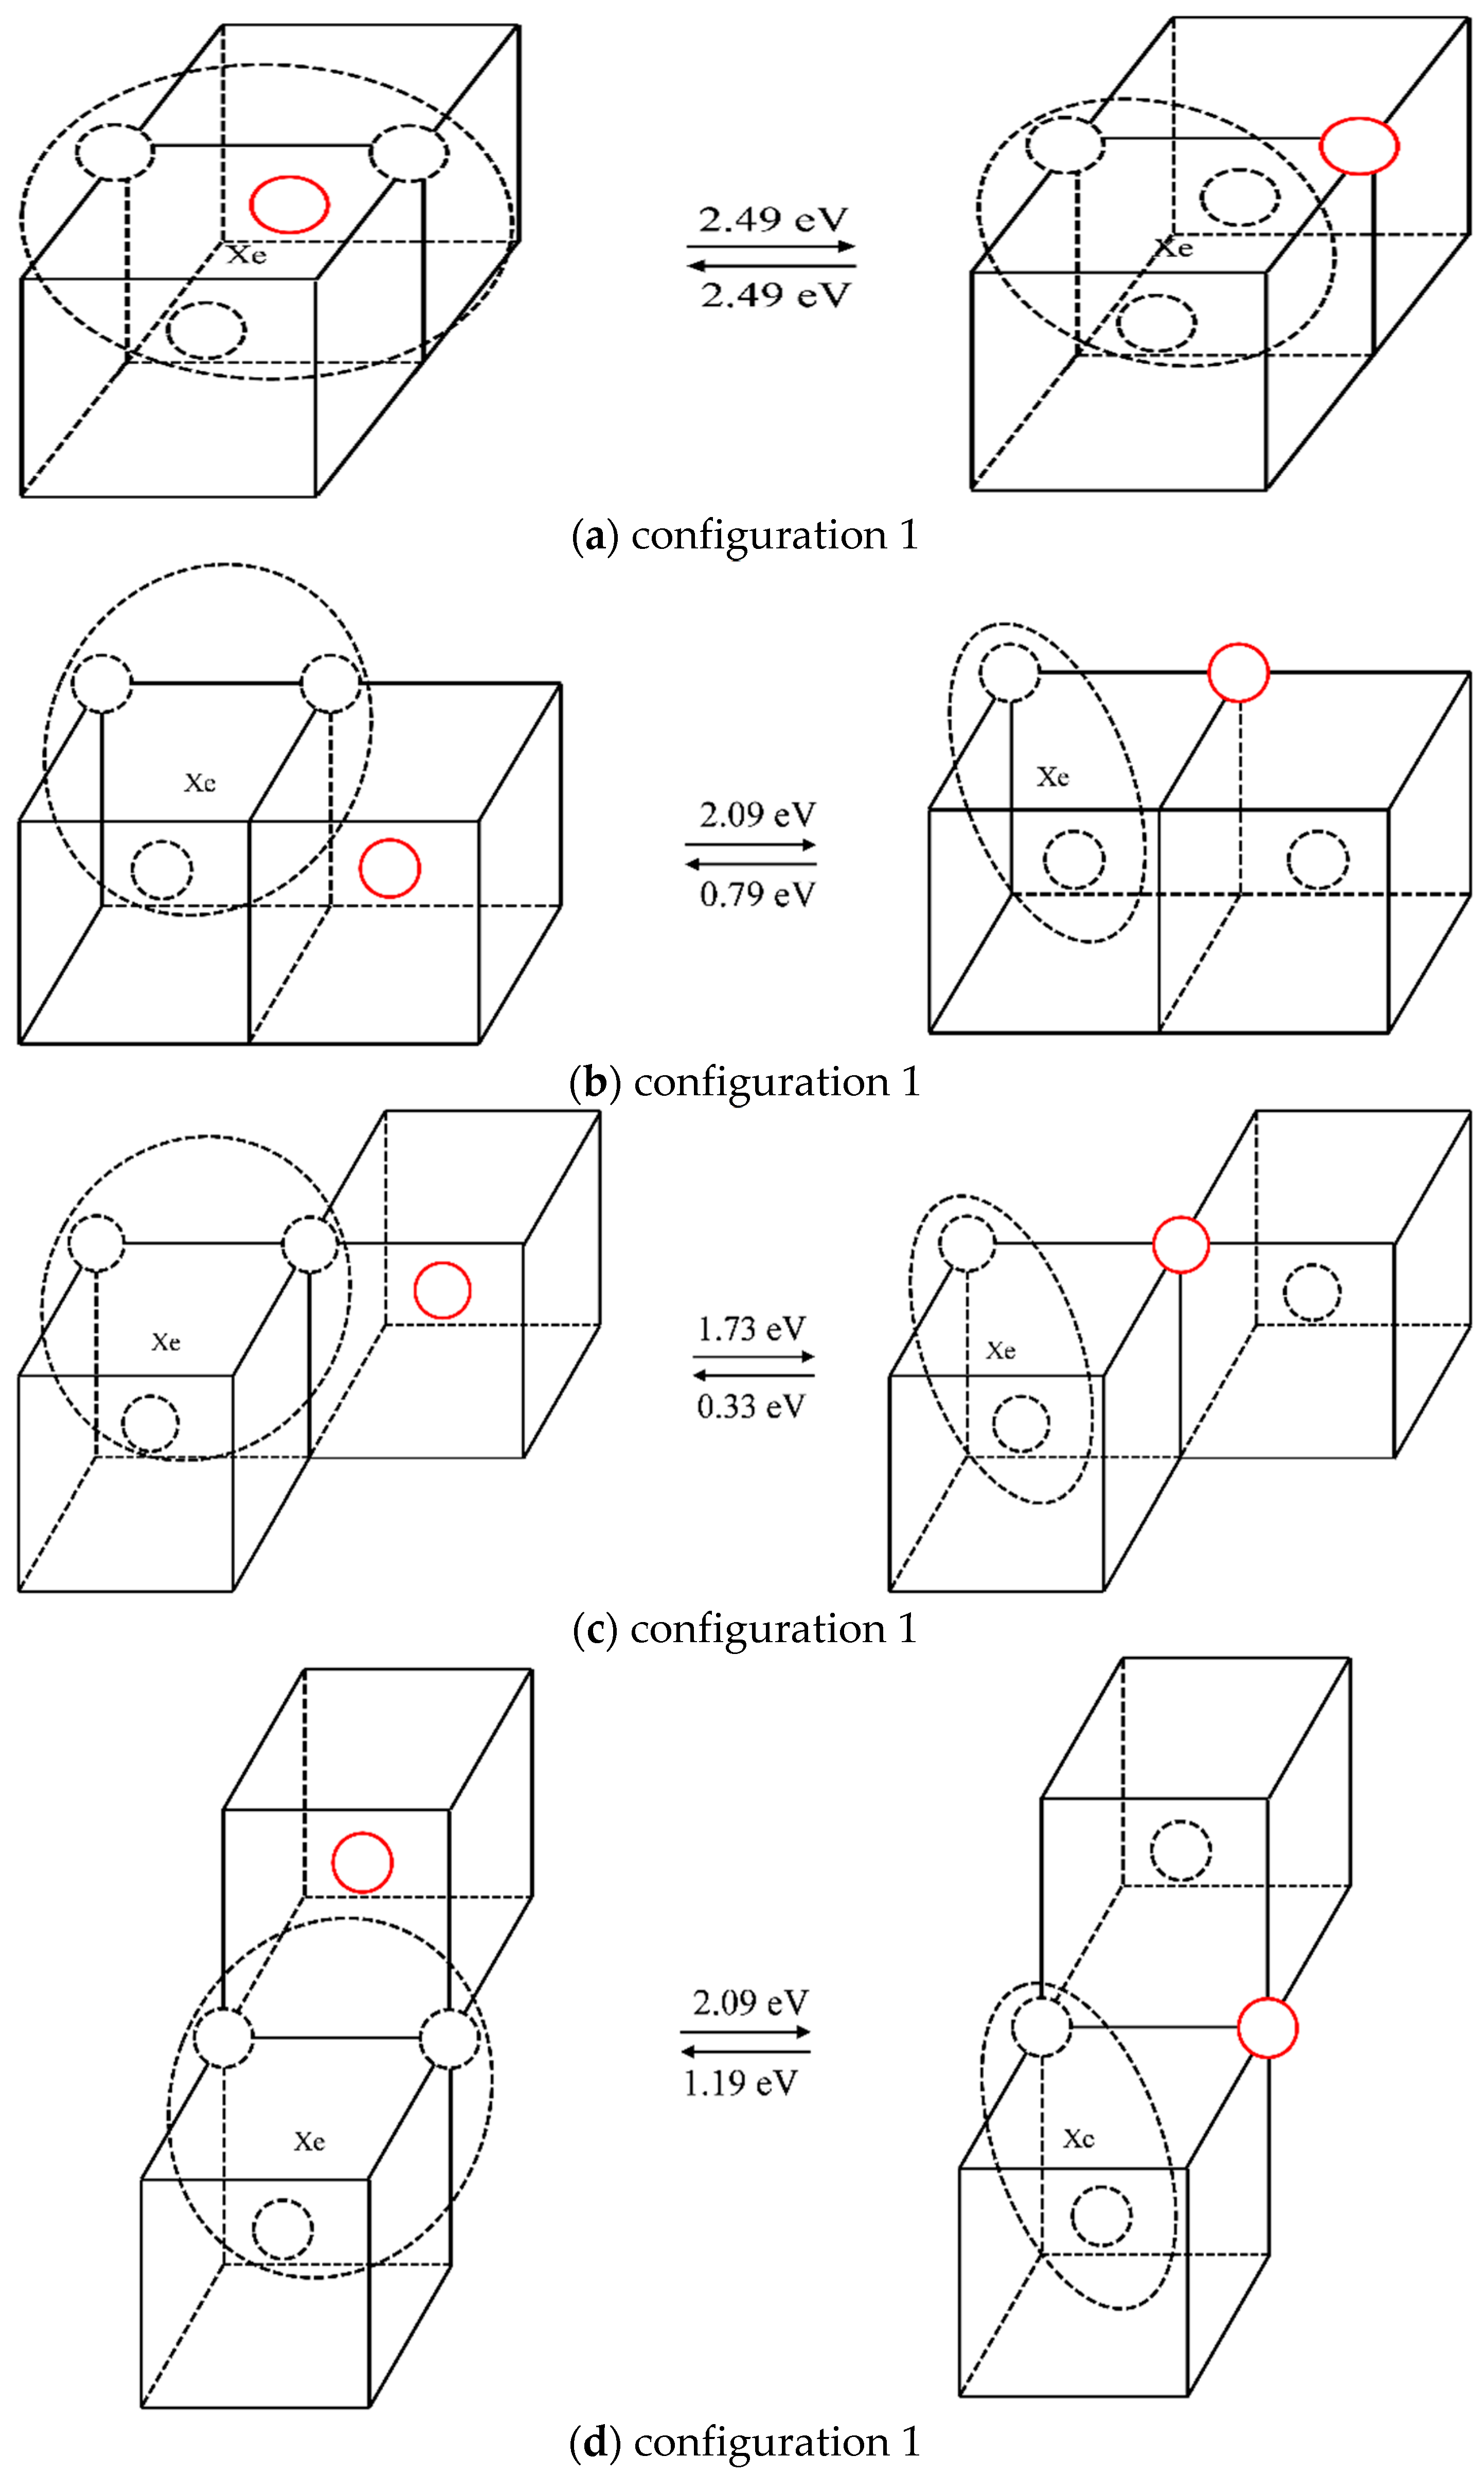
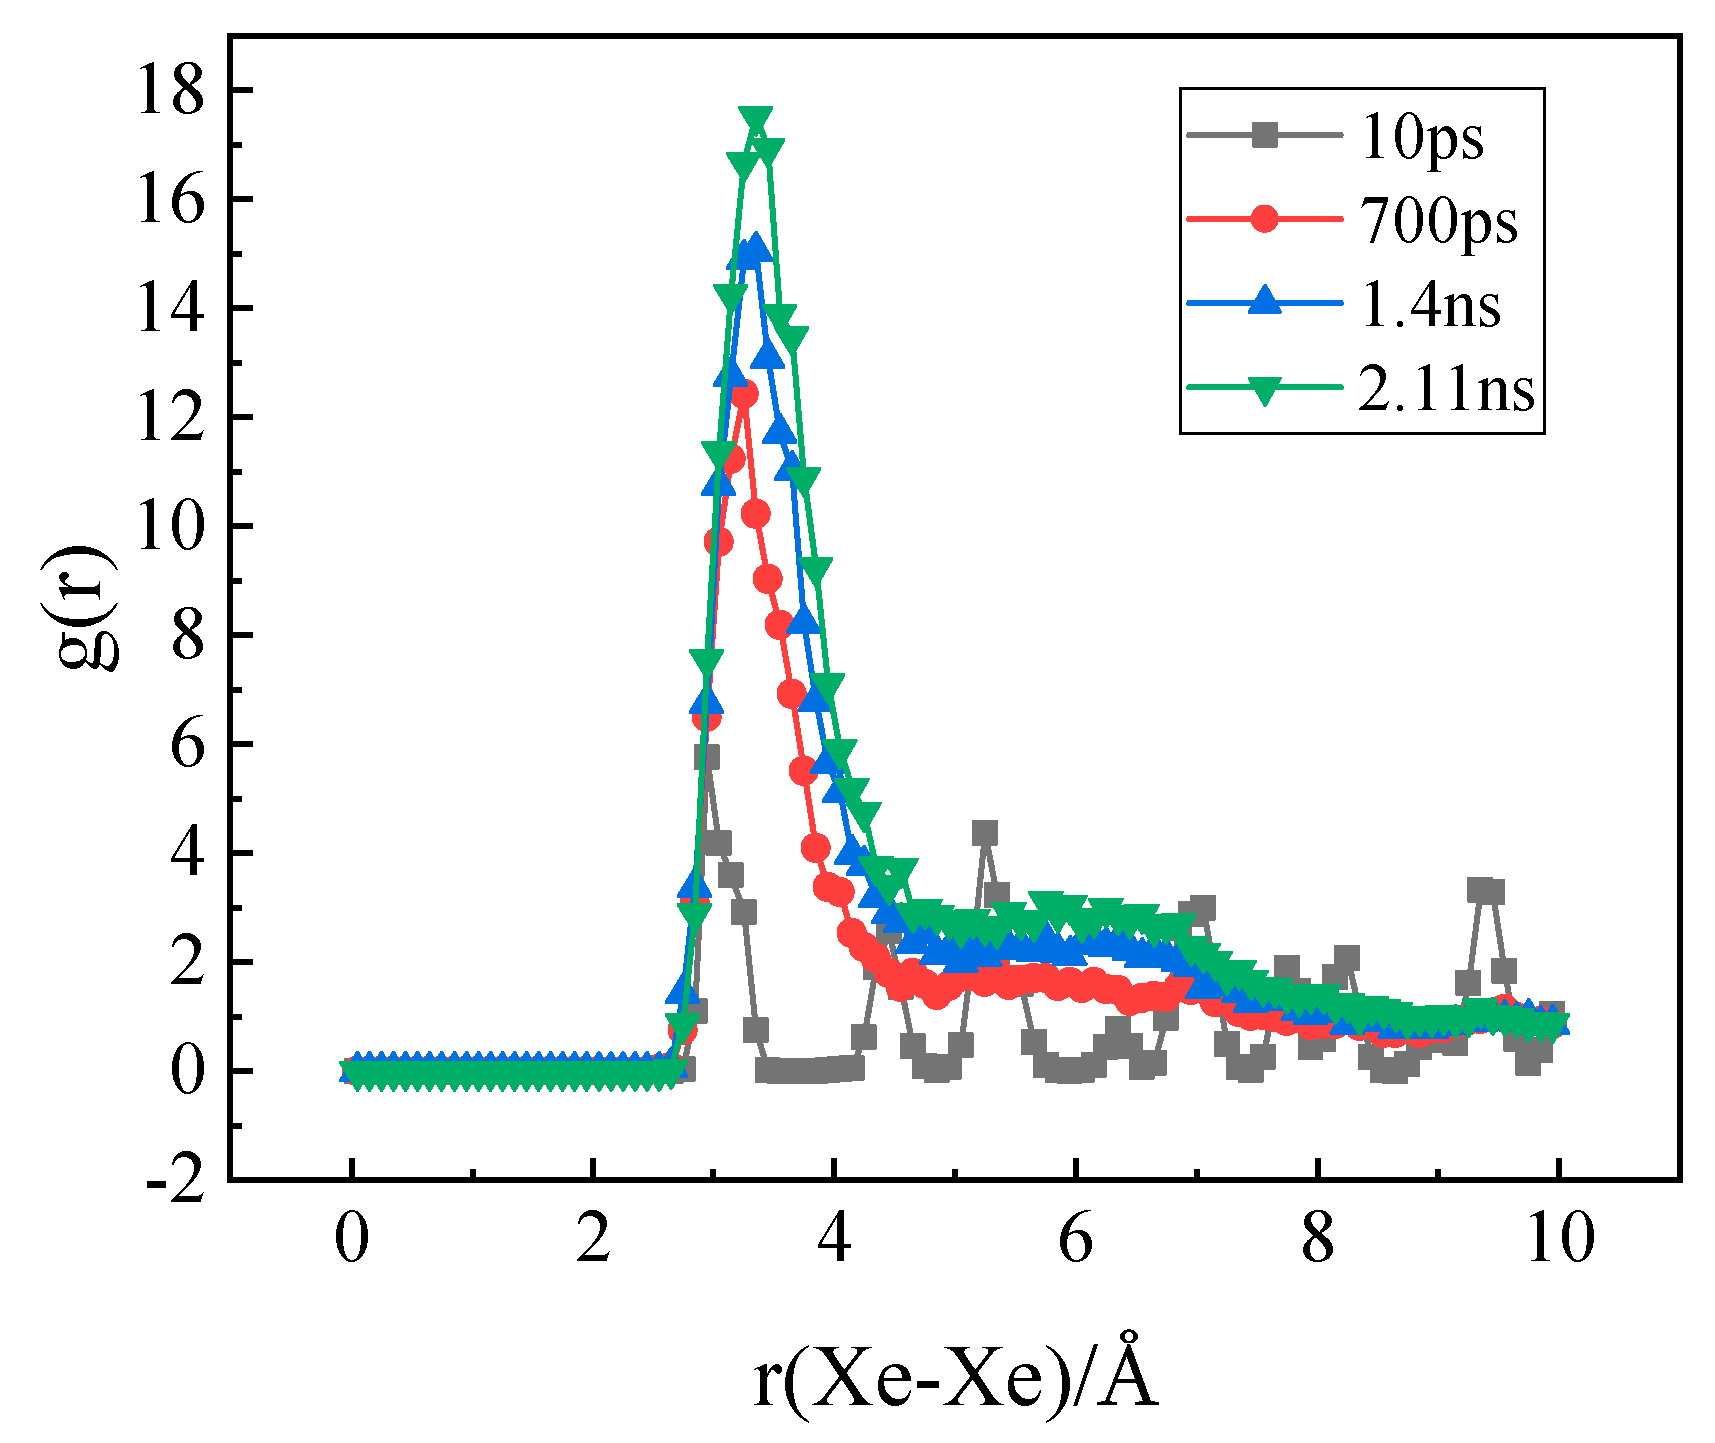
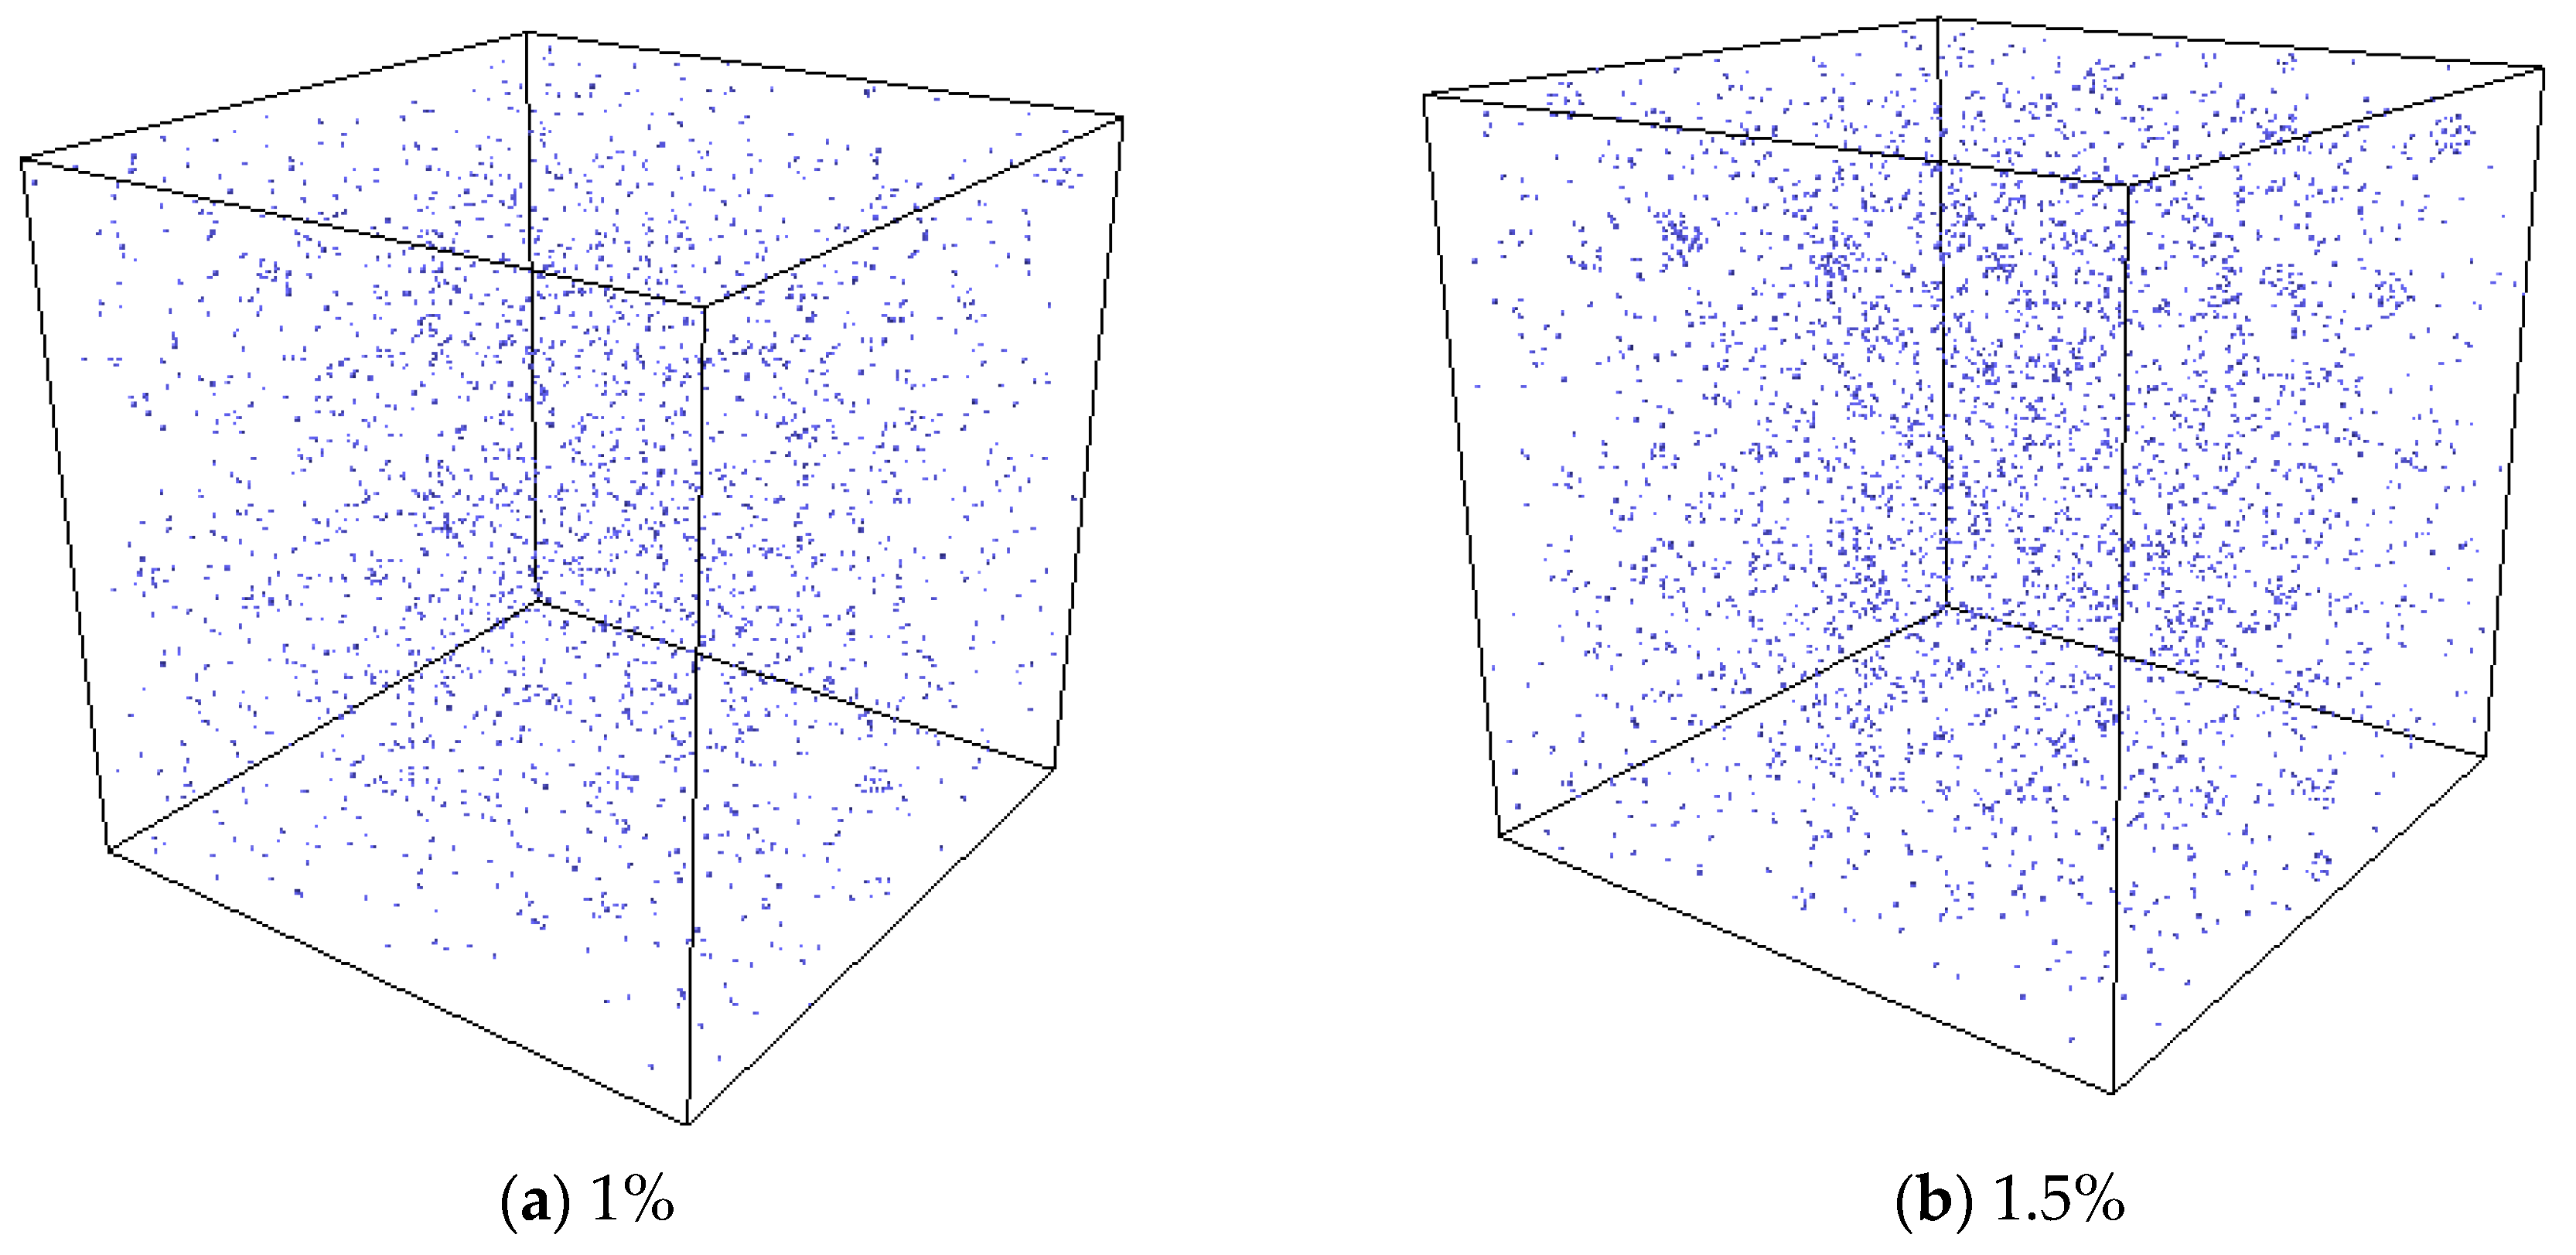
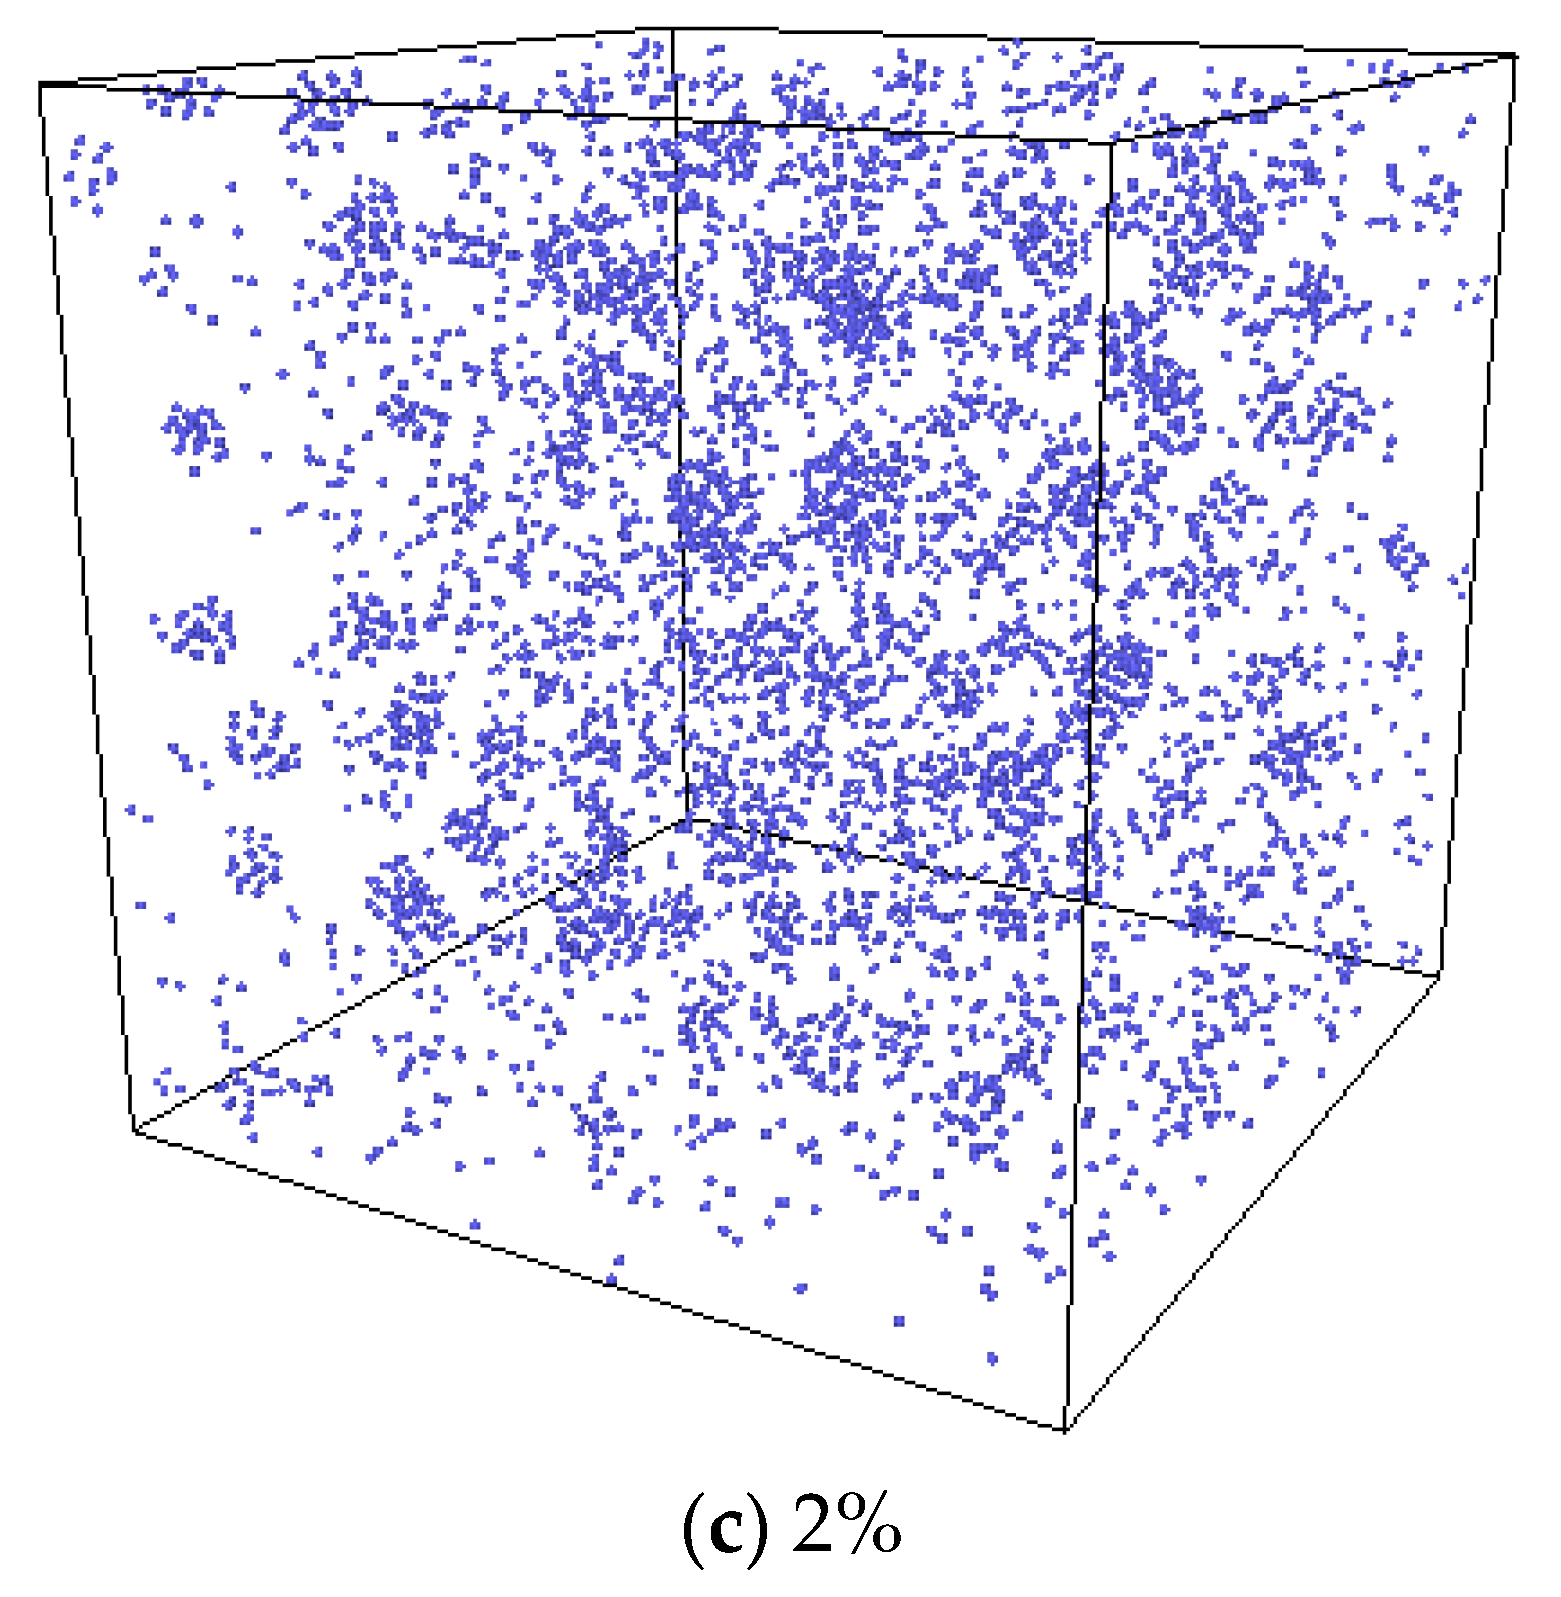
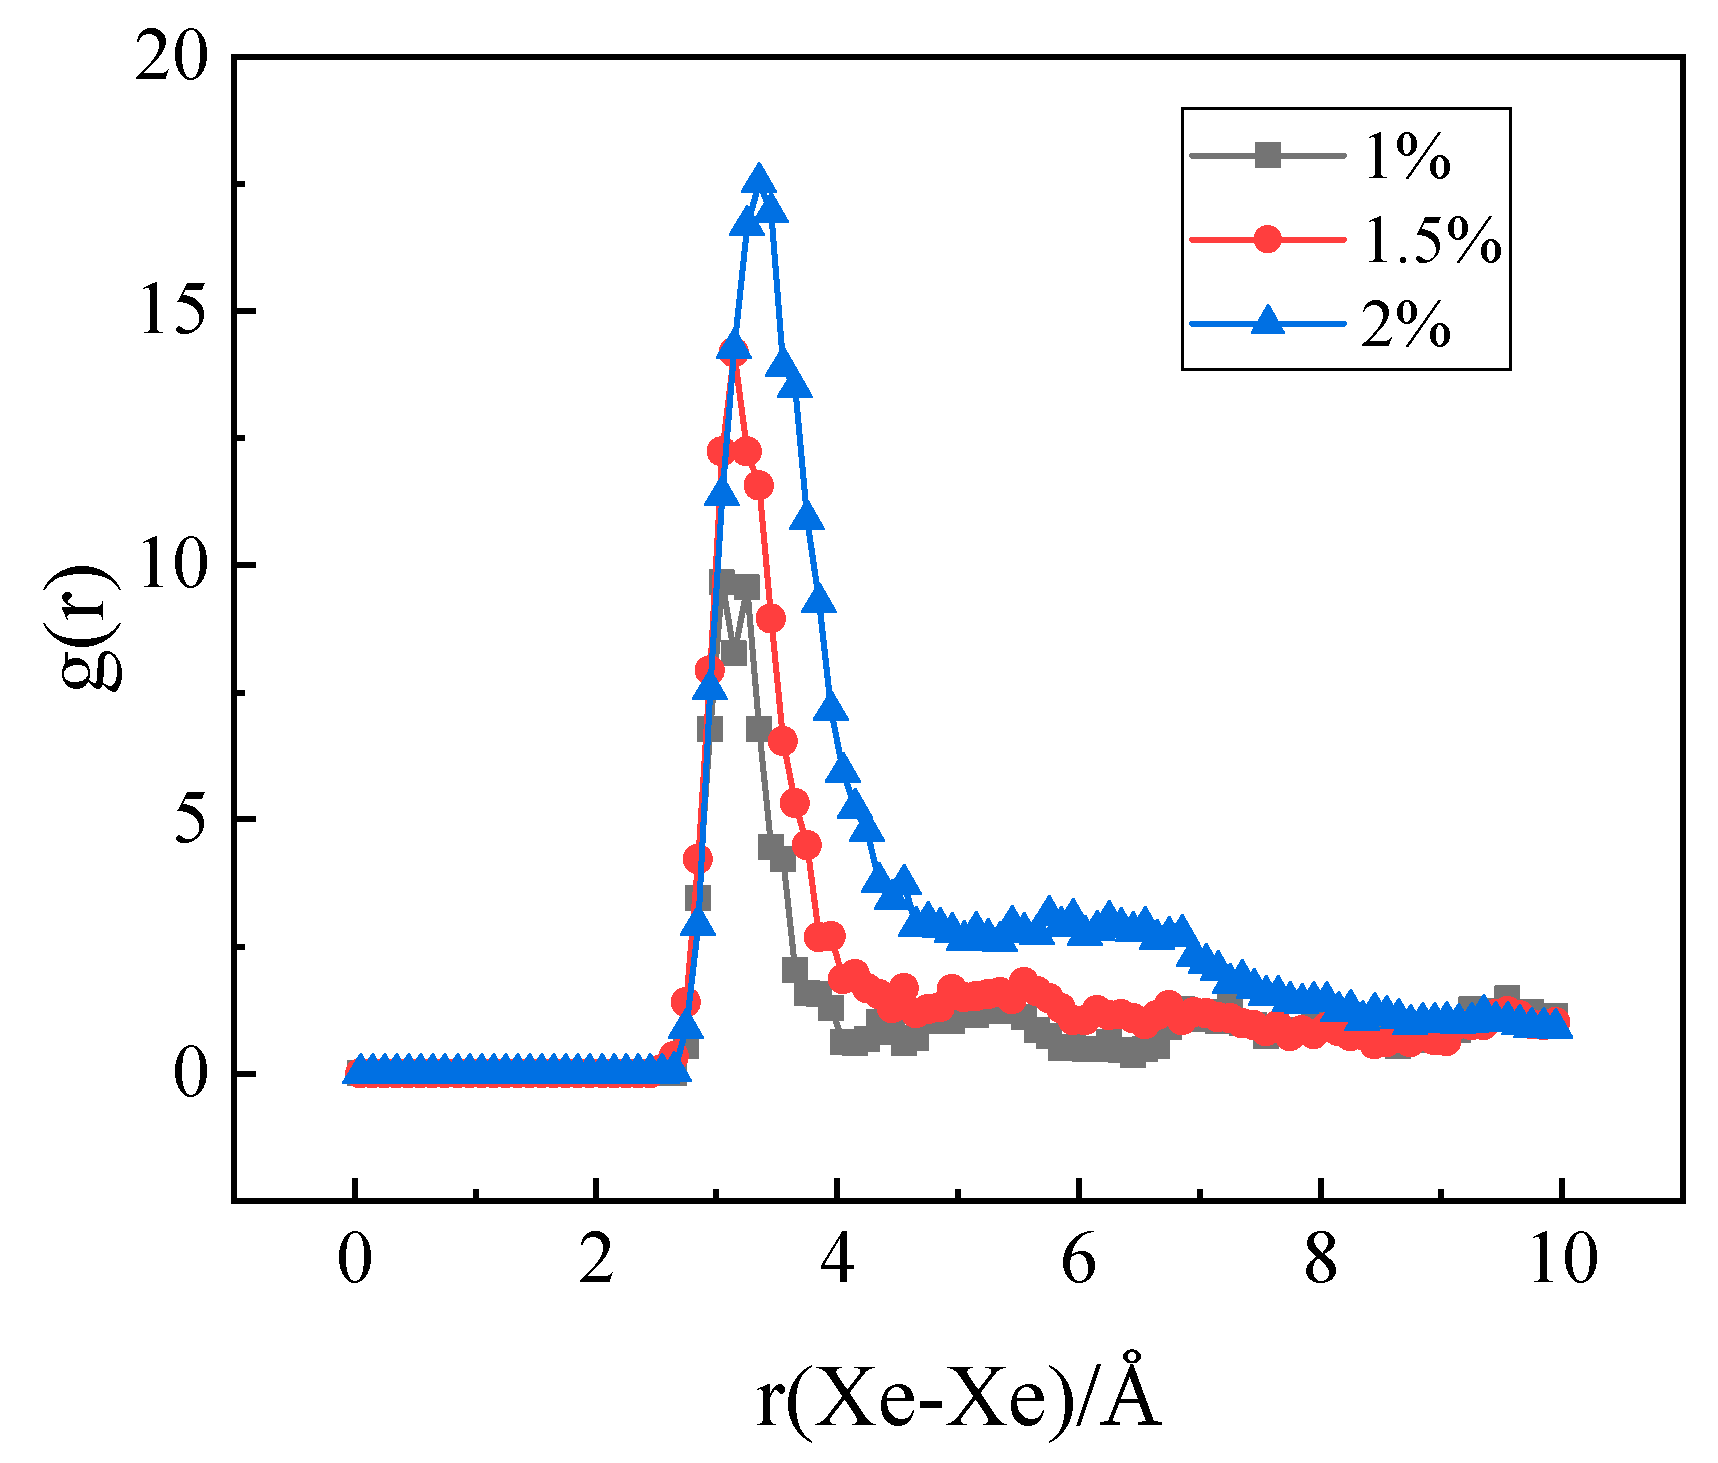
3.3. The Nucleation of Xe Bubbles in Mo
3.4. The Influence of Xe Bubbles on the Surrounding Vacancies
4. Summary
Supplementary Materials
Author Contributions
Funding
Conflicts of Interest
References
- Zimmermann, H. Investigations on swelling and fission gas behaviour in uranium dioxide. J. Nucl. Mater. 1978, 75, 154–161. [Google Scholar] [CrossRef]
- Kim, Y.S.; Hofman, G.L. Fission product induced swelling of U–Mo alloy fuel. J. Nucl. Mater. 2011, 419, 291–301. [Google Scholar] [CrossRef]
- Ray, I.L.F. Transmission electron microscopy study of fission product behaviour in high burnup UO2. J. Nucl. Mater. 1992, 188, 90–95. [Google Scholar] [CrossRef]
- Djourelov, N.; Marchand, B.; Marinov, H.; Moncoffre, N.; Pipon, Y.; Nédélec, P.; Toulhoat, N.; Sillou, D. Variable energy positron beam study of Xe-implanted uranium oxide. J. Nucl. Mater. 2013, 432, 287–293. [Google Scholar] [CrossRef]
- Gan, J.; Keiser, D.D.; Wachs, D.M.; Robinson, A.B.; Miller, B.D.; Allen, T.R. Transmission electron microscopy characterization of irradiated U–7Mo/Al–2Si dispersion fuel. J. Nucl. Mater. 2010, 396, 234–239. [Google Scholar] [CrossRef]
- Schwen, D.; Averback, R.S. Intragranular Xe bubble population evolution in UO2: A first passage Monte Carlo simulation approach. J. Nucl. Mater. 2010, 402, 116–123. [Google Scholar] [CrossRef]
- Sabathier, C.; Vincent, L.; Garcia, P.; Garrido, F.; Carlot, G.; Thome, L.; Martin, P.; Valot, C. In situ TEM study of temperature-induced fission product precipitation in UO2. Nucl. Instrum. Methods Phys. Res. 2008, 266, 3027–3032. [Google Scholar] [CrossRef]
- Hayns, M.R.; Wood, M.H. On the rate theory model for fission-gas behaviour in nuclear fuels. J. Nucl. Mater. 1976, 59, 293–302. [Google Scholar] [CrossRef]
- Skorek, R.; Maillard, S.; Michel, A.; Carlot, G.; Gilabert, E.; Jourdan, T. Modelling fission gas bubble distribution in UO2. Defect Diffus. Forum 2012, 323, 209–214. [Google Scholar] [CrossRef]
- Millett, P.C.; El-Azab, A.; Wolf, D. Phase-field simulation of irradiated metals: Part II: Gas bubble kinetics. Comput. Mater. Sci. 2011, 50, 960–970. [Google Scholar] [CrossRef]
- Rest, J. Comprehensive Nuclear Materials, Modeling of Fission-Gas-Induced Swelling of Nuclear Fuels. Elsevier 2012, 3, 579–627. [Google Scholar]
- Bartel, T.J.; Bertolus, M.; Besmann, T.M.; Blanc, V.; Bouineau, V.; Carlot, G.; Chernatynskiy, A.; Clarno, K.; Desgranges, C.; Devanathan, R.; et al. State-of-the-Art Report on Multi-Scale Modelling of Nuclear Fuels; Nuclear Energy Agency-Energy Agency Organisation for Economic Co-Operation and Development: Paris, France, 2015. [Google Scholar]
- Ball, R.G.J.; Grimes, R.W. Diffusion of Xe in UO2. J. Chem. Soc. Faraday Trans. 1990, 86, 1257–1261. [Google Scholar] [CrossRef]
- Liu, X.; Uberuaga, B.P.; Andersson, D.A.; Stanek, C.R.; Sickafus, K. Mechanism for transient migration of Xe in UO2. Appl. Phys. Lett. 2011, 98, 1–3. [Google Scholar]
- Govers, K.; Lemehov, S.E.; Verwerft, M. Molecular dynamics study of grain boundary diffusion of fission gas in uranium dioxide. Defect Diffus. Forum 2012, 323–325, 215–220. [Google Scholar] [CrossRef]
- Moore, E.; Corrales, L.R.; Desai, T.; Devanathan, R. Molecular dynamics simulation of Xe bubble nucleation in nanocrystalline UO2 nuclear fuel. J. Nucl. Mater. 2011, 419, 140–144. [Google Scholar] [CrossRef]
- Murphy, S.T.; Chartier, A.; Van, B.L.; Crocombette, J. Free energy of Xe incorporation at point defects and in nanovoids and bubbles in UO2. Phys. Rev. B 2012, 85, 1–9. [Google Scholar] [CrossRef]
- Liu, X.; Andersson, D.A. Molecular dynamics study of fission gas bubble nucleation in UO2. J. Nucl. Mater. 2015, 462, 8–14. [Google Scholar] [CrossRef]
- Tian, X.F.; Long, C.S.; Zhu, Z.H.; Gao, T. Molecular dynamics simulation of collective behaviour of Xe in UO2. Chin. Phys. B 2010, 19, 1–6. [Google Scholar]
- Yun, D.; Kirk, M.A.; Baldo, P.M.; Rest, J.; Yacout, A.M.; Insepov, Z.Z. In situ TEM investigation of Xe ion irradiation induced defects and bubbles in pure molybdenum single crystal. J. Nucl. Mater. 2013, 437, 240–249. [Google Scholar] [CrossRef]
- Smirnova, D.E.; Kuksin, A.Y.; Starikov, S.V.; Stegailov, V.V.; Insepov, Z.; Rest, J.; Yacout, A.M. A ternary EAM interatomic potential for U–Mo alloys with Xe. Model. Simul. Mater. Sci. Eng. 2013, 21, 035011. [Google Scholar] [CrossRef]
- Xiao, H.; Long, C.; Tian, X.; Li, S. Atomistic simulations of the small Xenon bubble behavior in U–Mo alloy. Mater. Des. 2015, 74, 55–60. [Google Scholar] [CrossRef]
- Hu, S.; Setyawan, W.; Joshi, V.; Lavender, C.A. Atomistic simulations of thermodynamic properties of Xe gas bubbles in U10Mo fuels. J. Nucl. Mater. 2017, 490, 49–58. [Google Scholar] [CrossRef]
- Plimpton, S. Fast parallel algorithms for short-range molecular dynamics. J. Comp. Phys. 1995, 117, 1–19. [Google Scholar] [CrossRef]
- Sheppard, D.; Terrell, R.; Henkelman, G. Optimization methods for finding minimum energy paths. J. Chem. Phys. 2008, 128, 1–10. [Google Scholar] [CrossRef]
- Henkelman, G.; Uberuaga, B.P.; Jónsson, H. A climbing image nudged elastic band method for finding saddle points and minimum energy paths. J. Chem. Phys. 2000, 113, 9901–9904. [Google Scholar] [CrossRef]
- Henkelman, G.; Jónsson, H. Improved tangent estimate in the nudged elastic band method for finding minimum energy paths and saddle points. J. Chem. Phys. 2000, 113, 9978–9985. [Google Scholar] [CrossRef]
- So/Rensen, M.R.; Voter, A.F. Temperature-accelerated dynamics for simulation of infrequent events. J. Chem. Phys. 2000, 112, 9599–9606. [Google Scholar] [CrossRef]
- Starikov, S.V.; Insepov, Z.; Rest, J.; Kuksin, A.Y.; Norman, G.E.; Stegailov, V.V.; Yanilkin, A.V. Radiation-induced damage and evolution of defects in Mo. Phys. Rev. B 2011, 84, 1–8. [Google Scholar] [CrossRef]
- Li, X.C.; Liu, Y.N.; Yu, Y.; Luo, G.N.; Shu, X.; Lu, G.H. Helium defects interactions and mechanism of helium bubble growth in tungsten: A molecular dynamics simulation. J. Nucl. Mater. 2014, 451, 356–360. [Google Scholar] [CrossRef]
- Beeler, B.; Good, B.; Rashkeev, S.; Deo, C.; Baskes, M.; Okuniewski, M. First-principles calculations of the stability and incorporation of helium, Xe and krypton in uranium. J. Nucl. Mater. 2012, 425, 2–7. [Google Scholar] [CrossRef]
- Sangiovanni, D.G.; Hellman, O.; Alling, B.; Abrikosov, I.A. Efficient and accurate determination of lattice-vacancy diffusion coefficients via nonequilibrium ab initio molecular dynamics. Phys. Rev. B 2016, 93, 094305. [Google Scholar] [CrossRef]
- Stukowski, A. Visualization and analysis of atomistic simulation data with OVITO—The Open Visualization Tool. Model. Simul. Mater. Sci. Eng. 2010, 18, 015012. [Google Scholar] [CrossRef]
- Olander, D.R. Fundamental aspects of nuclear reactor fuel elements: Solutions to problems. Metall. Rev. 2013, 22, 258–259. [Google Scholar]


| Octahedral | Tetrahedral | Substitutional Xe+SIA | Substitutional Xe | |
|---|---|---|---|---|
| Ef(MD)/eV | 16.8 | 16.3 | 15.3 | 8.8 |
| Ef(DFT)/eV [29] | 17.1 | 16.2 | 15.8 | 8.8 |
| Configuration | Forward Barrier (eV) | Reverse Barrier (eV) |
|---|---|---|
| 1 | 1.76 | 0.64 |
| 2 | 2.27 | 1.40 |
| 3 | 1.62 | 0.51 |
| Configurations | Forward Barrier (eV) | Reverse Barrier (eV) |
|---|---|---|
| 1 | 2.49 | 2.49 |
| 2 | 2.09 | 0.79 |
| 3 | 1.73 | 0.33 |
| 4 | 2.09 | 1.19 |
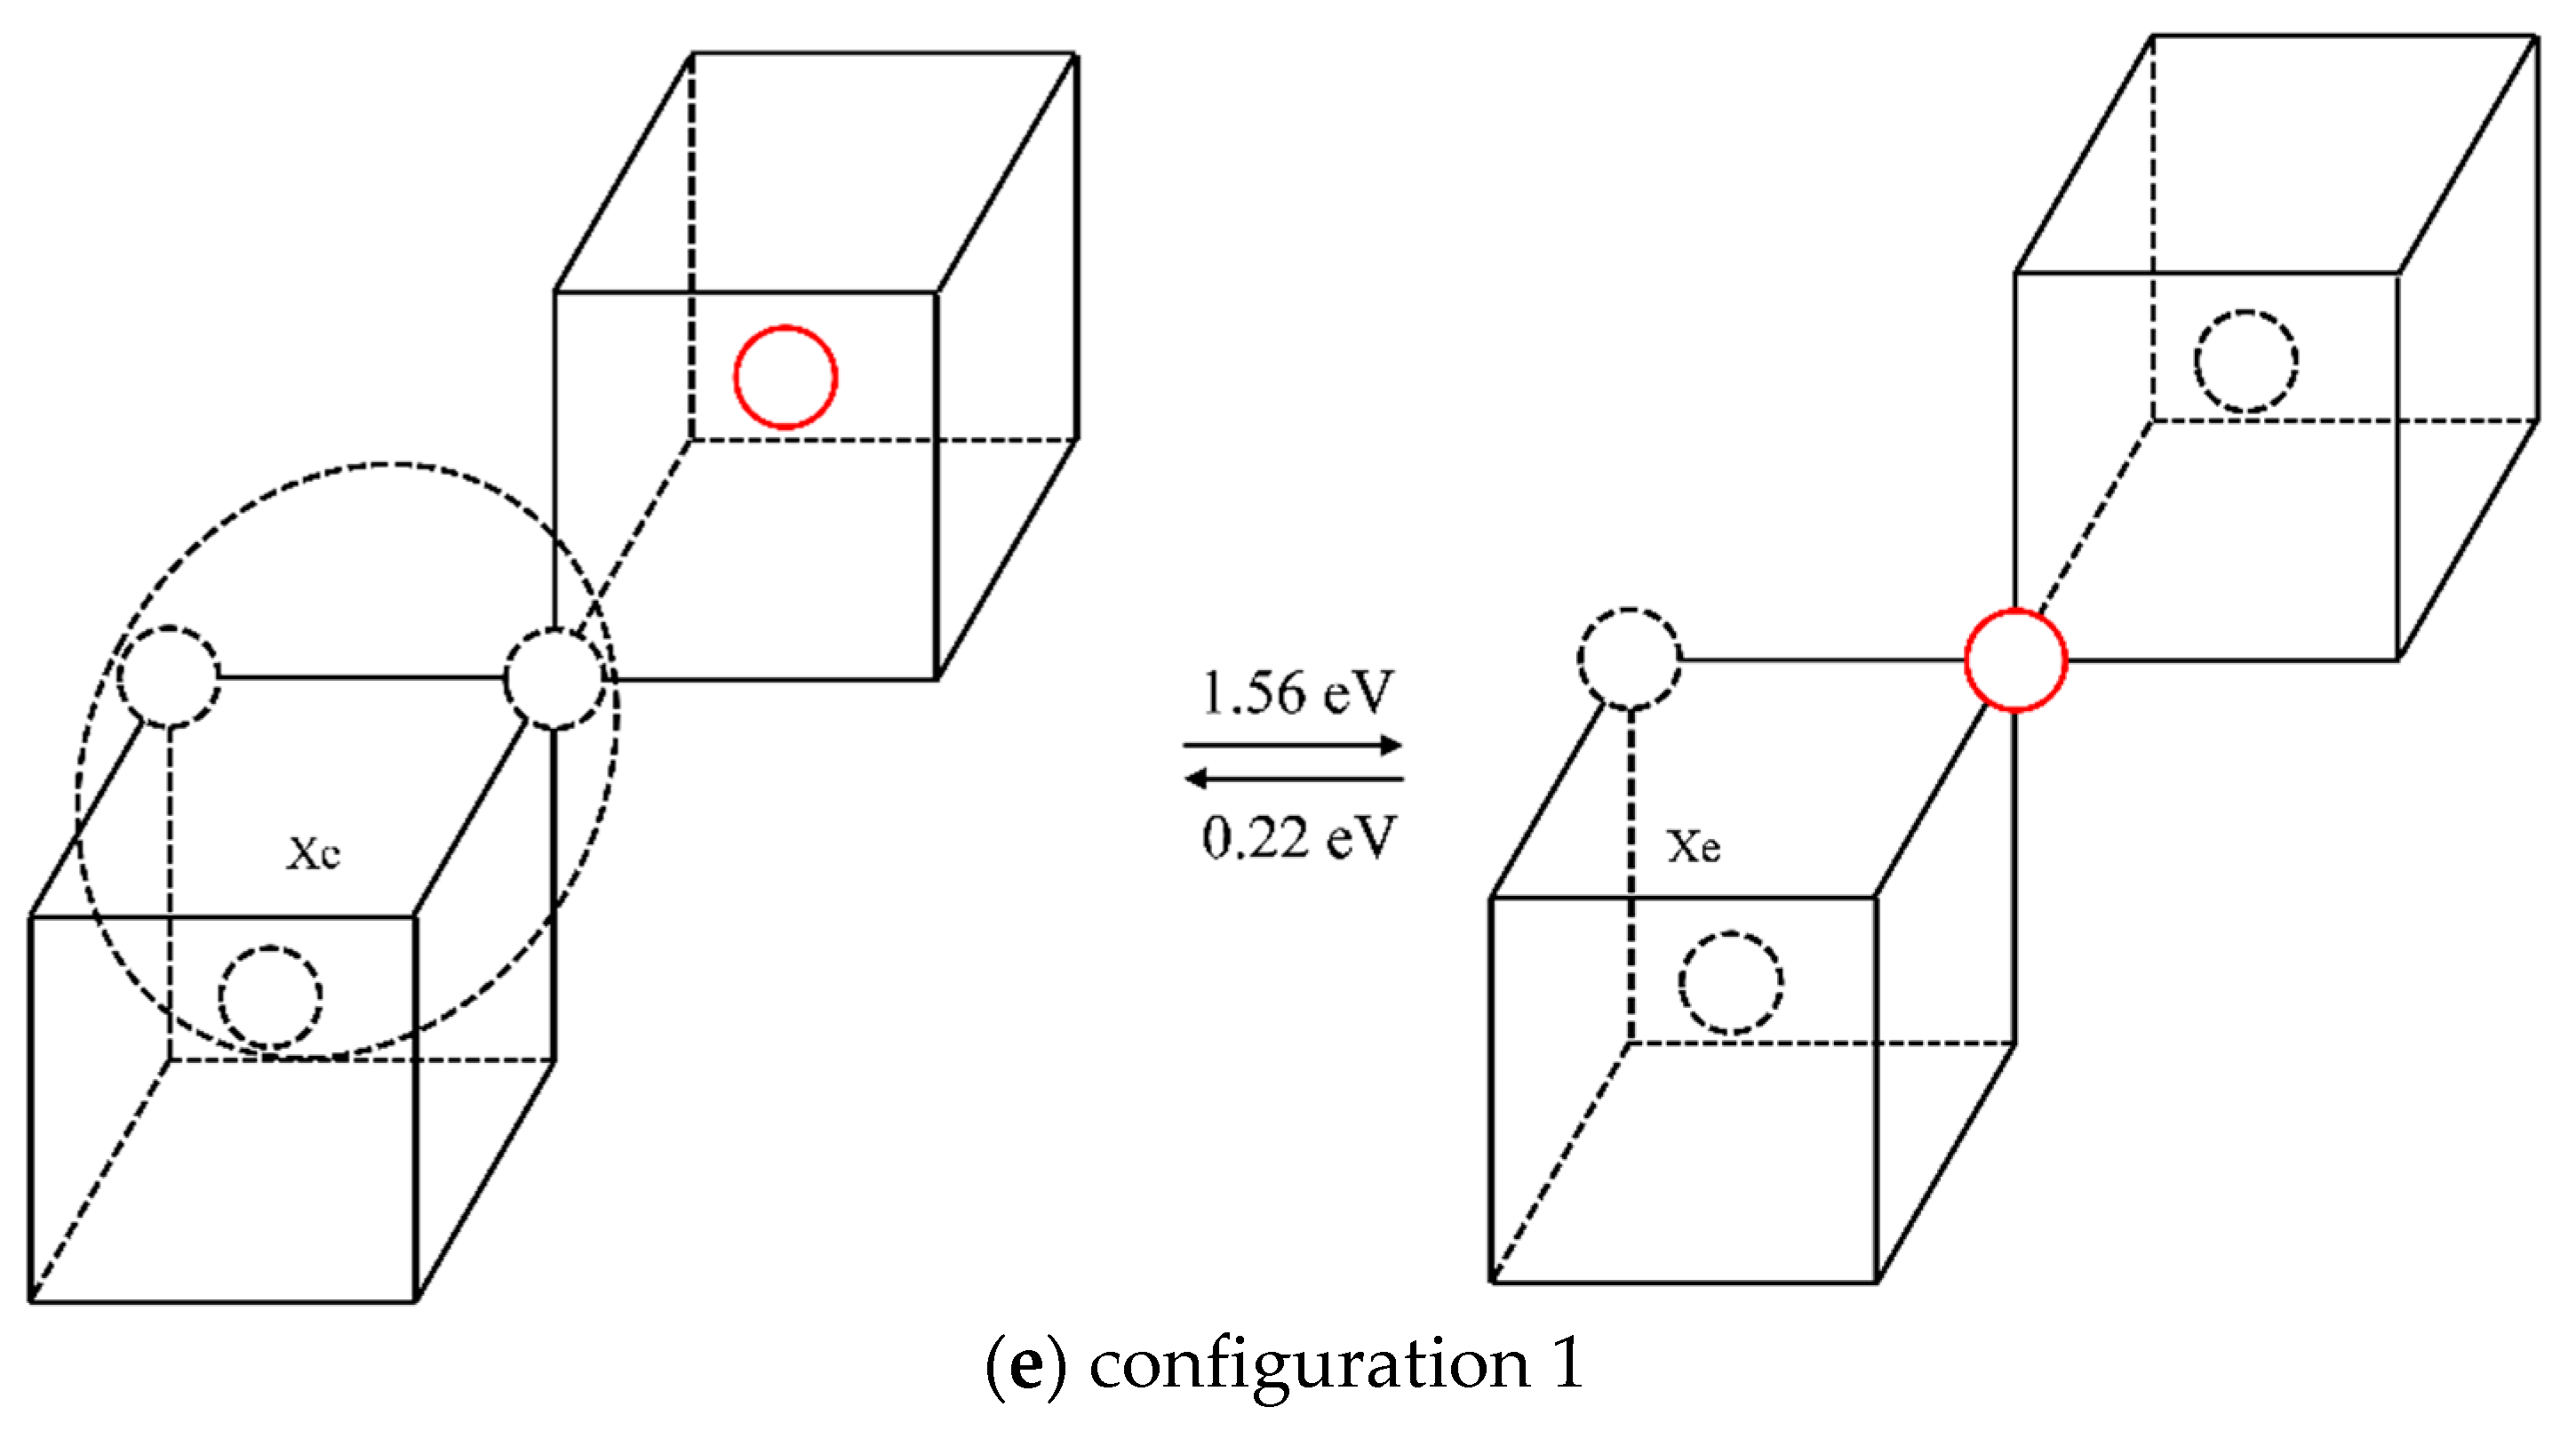
| 5 | 1.56 | 0.22 |
| Radius/Angstrom | Density/g·cm−3 | |||
|---|---|---|---|---|
| 2.08 | 4.16 | 6.25 | 8.33 | |
| 5 | 5 | 10 | 15 | 20 |
| 10 | 40 | 80 | 120 | 160 |
© 2019 by the authors. Licensee MDPI, Basel, Switzerland. This article is an open access article distributed under the terms and conditions of the Creative Commons Attribution (CC BY) license (http://creativecommons.org/licenses/by/4.0/).
Share and Cite
Zhang, W.; Yun, D.; Liu, W. Xenon Diffusion Mechanism and Xenon Bubble Nucleation and Growth Behaviors in Molybdenum via Molecular Dynamics Simulations. Materials 2019, 12, 2354. https://doi.org/10.3390/ma12152354
Zhang W, Yun D, Liu W. Xenon Diffusion Mechanism and Xenon Bubble Nucleation and Growth Behaviors in Molybdenum via Molecular Dynamics Simulations. Materials. 2019; 12(15):2354. https://doi.org/10.3390/ma12152354
Chicago/Turabian StyleZhang, Wenhua, Di Yun, and Wenbo Liu. 2019. "Xenon Diffusion Mechanism and Xenon Bubble Nucleation and Growth Behaviors in Molybdenum via Molecular Dynamics Simulations" Materials 12, no. 15: 2354. https://doi.org/10.3390/ma12152354
APA StyleZhang, W., Yun, D., & Liu, W. (2019). Xenon Diffusion Mechanism and Xenon Bubble Nucleation and Growth Behaviors in Molybdenum via Molecular Dynamics Simulations. Materials, 12(15), 2354. https://doi.org/10.3390/ma12152354