Article

Assessment of Validity of Selected Criteria of Fatigue Life Prediction

Department of Mechanics and Machine Design, Opole University of Technology, 45-271 Opole, Poland
*
Author to whom correspondence should be addressed.
Materials 2019, 12(14), 2310; https://doi.org/10.3390/ma12142310
Submission received: 7 June 2019 / Revised: 12 July 2019 / Accepted: 14 July 2019 / Published: 19 July 2019
(This article belongs to the Special Issue Deformation, Fatigue and Fracture of Materials)

Abstract

:
The paper reports on the results of a comparison involving mathematical models applied for fatigue life calculations where the mean load value is taken into account. Several models based on the critical plane approach and energy density parameter were tested and analyzed. A fatigue test results for three types of materials are presented in this paper. The specimens were subjected to bending, torsion and a combination of bending with torsion with mean value of the load. Analysis of the calculation results show that the best fatigue life estimations are obtained by using models that are sensitive to the changes of material behavior under fatigue loading in relation to the specified number of cycles of the load.

1. Introduction

The phenomenon of material fatigue is a known effect which is of fundamental importance when designing structures working under variable load conditions. Despite the large number of research works, it was not possible to develop a single, universal calculation algorithm that can be used in a wide range of construction materials as well as load conditions of the structure. The formation and accumulation of fatigue damage is a complex phenomenon and depends on many factors, e.g., the type and state of material, geometry of the element, type of loading or stress state [1,2,3].
The fatigue of materials is usually referred to simple stress states, e.g., uniaxial tension-compression, where material characteristics are limited to determining the relationship between the number of cycles to failure and the level of the applied load. In the case of operational loads, the most common is a complex stress state, and in this case, we refer to the results of calculations to uniaxial characteristics using the appropriate hypotheses (calculation models) [1,4,5,6,7].
Among the large number of fatigue hypotheses and computational models, it is difficult to find one universal that would contain a wide range of factors describing the fatigue cracks creation. Moreover, neither of them can offer a comprehensive tool that makes them adequate to use in any kind of the material, geometry and load conditions. The literature in the area contains a variety of fatigue criteria. They are based on various assumptions and parameters describing the process of fatigue. One can distinguish criteria based on stresses, strains and the so-called energy, taking into account both, the state of stress and strain.
In the case of a complex stress state, such parameters as the stress amplitude and the mean stress value cause a change in the orientation of the principal stresses, so their impact on the fatigue life is difficult to predict. The mean value of stress, different from zero, often comes as a result of the own weight of the operating element or of the entire structure, and can arise from preloading of carriers (e.g., V-belts in the gear units). Technological aspects of manufacture of constructions, technologies of joining elements (e.g., welding, explosive welding) are a source of residual stresses, which introduce significant mean loads to the structure. In the situation when the object does not transfer loads with the mean value of the load, omitting the residual stress can introduce a significant error in estimating fatigue life [8,9,10].
The aim of this paper is comparison of the efficiency for selected and most frequently used fatigue life estimation criteria taking into account the effect of the mean stress in multiaxial loading conditions: Gerber [11], Findley [12], Dang Van [13], Carpinteri-Spagnoli [3], Smith-Watson-Topper (SWT) parameter [14], and the stress models by: Kluger-Łagoda [15,16], which were modified with the use of two-parameter fatigue characteristics describing the relation between the values of amplitude and mean stress of Pawliczek-Gasiak model [17]. The paper presents experimental results with calculations for the analyzed models.

2. Analyzed Fatigue Models

2.1. Models Based on Haigh Diagram

Models described below are given among the group of models that apply mathematical description of Haigh diagram of stress amplitude change σaa) and mean stress value σmm). Despite the fact that some of these criteria use parameters not related to material behavior under fatigue load conditions, they are often used due to the simplicity of computational algorithms and are the basis for reference and verification of the efficiency of more advanced computational models.
By adapting the assumption that the maximum stress, which can be carried out by a material in a single loading state is the stress, which defines the ultimate tensile strength σU, Goodman [18,19] proposed a linear description of the dependence between the stress amplitude change and the mean stress value using the formula:
σ aeq σ eq + σ meq σ U = 1
The study by Soderberg [20] suggested that for materials in elastic-plastic state, a practical criterion defining material failure is the state during which the yield strength σy is exceeded. Hence, Equation (1) takes the following form:
σ aeq σ eq + σ meq σ y = 1
Non-linear properties (σam) (τam) were considered in the model introduced by Gerber [11]:
σ aeq σ eq + ( σ meq σ U ) 2 = 1
As the criterion, the value the equivalent stress σeq is
σ eq = σ aeq 1 ( σ meq σ i ) q
and it is used to calculate the degree of damage based on the fatigue characteristics in simple load conditions (e.g., in a tension-compression test). Exponent q and σi in Equation (4) adapt the values of: q = 1, σi = σU for Goodman’s model, q = 1, σi = σy for the normalized Soderberg model, and q = 2, σi = σU for the non-linear Gerber equation, respectively.
For all models presented above, stress σaeq and σmeq are amplitude and mean value of equivalent stress, respectively. The Huber-Mises hypothesis forms the most common one and is used most frequently, as it is able to specify equivalent stress amplitude and mean stress value for multi-axial load for the case of multi-axial fatigue.
As a result of developing and transforming dependencies based on the mean loading value on Haigh diagram (σam and τam), their limit for stress level corresponding to the unlimited life (fatigue limit) is indicated. It was indicated that material sensitivity on mean loading is not a material constant and depends on the number of the cycles corresponding to the failure of an element. This postulate is the basis for a modification of transforming dependencies for two-parameter fatigue characteristics of metals presented by Gasiak and Pawliczek [21]. The effect of loading conditions and material sensitivity change on mean loading value, together with the number of destructive cycles for SJ355 steel are presented in [17]. The proposed model for calculation of the equivalent amplitude of normal stresses σaeq has a form:
σ aeq = σ aT 2 + k τ aT 2
where: k = 3 according to the Huber-Mises hypothesis or k = σafaf, while σaT, τaT—the amplitude of the corresponding normal and shear stress components is calculated as follows:
σ a T = σ a + ψ σ ( N ) σ m
τ a T = τ a + ψ τ ( N ) τ m
The material sensitivity factor for the asymmetry of cycle ψσ ψτ is applied in Equations (6) and (7), and its value is derived for normal and shear stresses. When determining the ψ factor, the change in its value is considered by considering the number of cycles equal to N. Changes in material sensitivity on the asymmetry of cycles can be determined by the experimental dependency [17]:
ψ = η N λ
The approximate values of η and λ coefficients for structural steel for a limited lifetime can be calculated as:
λ = 0.588 log ( 10 4.7 a + b 1 10 6.4 a + b 1 )
η = 1 0 4 . 7 ( a λ ) + b 1 0 4 . 7 λ
where: a = 1 A w 1 A j , b = B j A j B w A w , while Aj, Bj, Aw, Bw are the coefficients of regression line for limited lifetime derived on the basis of fatigue test results for fully reversed loading and repeated—one direction loading. We can note that for complex stress state, these parameters should be designated, both for normal and shear stresses. After determining the amplitudes transformed as in Equations (6) and (7), equivalent stresses should be designated according to the adapted hypothesis on material effort.

2.2. Models Based on Critical Plane Approach

The following models belong to the group of models based on stresses and are applied to consider the aspect of critical plane [7]. It is defined as the one, in which maximum failure occurs and the fatigue life depends on a combination of stresses and/or strains acting along a plane. Depending on the state of stresses, environment, geometry of the element and on the amplitude of stresses, the fatigue process is dominated by the formation of cracks in the plane of maximal shear stress or normal stress. Criteria based on the analysis of stress state in the critical plane are considered to refer to factors that destroy material, as they relate to planes in which fatigue cracks initiate and develop. It is believed that they are the closest to fatigue processes occurring in materials. These criteria belong to the group of the most widely developed computational models and have received numerous modifications.

2.2.1. Findley’s Model

Findley proposed the model [12] considering the effect of mean value of stress, where the equivalent amplitude of shear stress on the critical plane (shear plane in this case) takes the form:
τ aeq = τ n , a + k σ n , max
Weight factor k is specifying the effect of normal stress, and according to Findley, it depends on the number of cycles to failure, and maximal stress on critical plane is σn,max = σn,m + σn,a. Findley assumed that the principal directions for proportional loading do not change. The k parameter is determined by fatigue limits in alternating torsion τaf and fully reversed bending σaf by solving the following equation:
σ af τ af = 2 1 + k 2 1 + k 2 + k

2.2.2. Dang Van’s Fatigue Model

The Dang Van fatigue criterion [13] is distinguished by mesoscopic (grain boundary) stress observation scale. The Dang Van criterion assumes that fatigue of a material does not occur, if all grains reach a stable state of elastic deformations. It means that after the initial period of loading (after several cycles), the material goes into isotropic hardening and further relationship between stress and strain will occur in the elastic state.
The condition of exceeding the critical deformations depends on the value of the mesoscopic shear stresses τμ and hydrostatic stresses σH,max.
The above-mentioned stresses are combined by a linear function designating equivalent stress:
τ aeq = | τ μ | + k σ H , max
where
k = τ af σ af 2 σ af 3
The value of maximum mesoscopic shear stress τμ is calculated in terms of principal stresses, according to the Tresca hypothesis.

2.2.3. Model Based on the Carpinteri-Spagnoli Criterion

Carpinteri and Spagnoli [22] developed a criterion based on the Gough’s empirical criterion, in which the equivalent stress is calculated by the relation:
σ aeq = σ n , max 2 + k 2 τ n , a 2
and the coefficient k is determined from the expression:
k = σ af τ af
The critical plane is defined with respect to mean directions ( 1 ^ , 2 ^ , 3 ^ ) of principal stresses, determined by the method where weight function is used. The critical plane lies in the plane 1 ^ , 3 ^ and is rotated by the angle δ around the axis 2 ^ . The value of the angle δ depends on the coefficient k as a function.
δ = 3 π 8 [ 1 1 k 2 ]

2.2.4. Model by McDiarmid

The proposed McDiarmid criterion [23,24] for high cycle multiaxial fatigue can be expressed by equivalent stress in the form of
τ aeq = | τ max | + k σ n
Equation (18) implies that the fatigue failure is caused by a linear combination of normal stresses and shear stresses at the critical plane, being defined by the maximum value of shear stresses. The coefficient k considers a different number of normal stresses during the process of determining fatigue life and is presented by the relation
k = τ af 2 σ U

2.2.5. Model by Papadopoulos

Papadopoulos [25,26] proposed the fatigue criterion, which combines the approach applied used for the group of criteria based on invariants of the stress state, criteria based on stress mean values and criteria using the concept of the critical plane. Fatigue strength is determined upon a linear combination of the maximum hydrostatic stress σH,max and the amplitude of generalized shear stress T a being defined on the critical plane, while the equivalent value can be represented by:
τ aeq = T a + k σ H , max
where:
k = 3 τ af σ af 1 2

2.2.6. Model by Matake

On the basis of observations of the fatigue crack propagation directions that overlap the planes of the maximum shear stresses, Matake [27] has a proposed stress criterion, in which the critical plane is the plane of the maximum shear stress. Normal stress σn(t) acting on the plane accelerates the crack initiation process as the linear function of shear stress. The equivalent stress takes the form of
τ aeq = τ n , a + k σ n , a
The material constant k can be specified on the basis of fatigue limits for fully reversed bending and torsion.
k = 2 τ af σ af 1
In the case, when several planes reach the same maximum shear stress value, it is assumed that the critical plane is the surface with higher normal stress.

2.2.7. Model by Kluger-Lagoda

Kluger and Łagoda [15] had proposed a criterion to describe the effect of mean stress, the equivalent value of which is presented in the form:
σ aeq = B τ n + K σ n = B ( τ n , a + τ n , m ) + K ( σ n , a + σ n , m )
If an element is under loading by stress amplitude σa (for bending or tension-compression) and τa (for torsion), the value of the amplitude of normal stresses in the direction n can be written as
σ n , a = σ a cos α 2 + τ a sin 2 α
and the amplitude of shear stresses in the direction s as:
τ n , a = 0.5 σ a sin 2 α + τ a cos 2 α
The mean values of normal stresses in the direction n can adapt the form of
σ n , m = σ m , p cos α 2 + τ m , p sin 2 α
whereas, mean values of the mean shear stresses in the direction s as
τ n , m = 0.5 σ m , p sin 2 α + τ m , p cos 2 α
where the angle α is the critical plane orientation angle.
The mean stresses of σm,k and τm,k, applying a correction are used to calculate the normal σn,m and shear τns,m components, designated based on the formula:
σ m , p = k σ σ m
τ m , p = p τ 1 p τ 2 p m
Coefficients pσ, pτ1, pτ2 are derived experimentally, based on the analysis of fatigue test results and their values are, respectively [15]:
p σ = σ max σ f
where σmax = σa + σm,
p τ 1 = τ a 2 τ m + τ a
p τ 2 = 1 + σ m σ m + τ m
Equivalent stress forms a linear combination of nominal and shear stresses. The ratio of particular components of stress state in the fatigue process depends on B and K factors:
B = σ a ( N f ) τ a ( N f )
K = 2 σ a ( N f ) τ a ( N f )
Values of σa(Nf) and τa(Nf) are derived on the basis of fatigue equations S-N for simple loading states: Tension (bending), shear (torsion), respectively. In this case, it is important to pay attention to the parallelism of characteristics in the entire range of the high-cycle fatigue. It should be noted that for aluminum alloys, a change in slope factor values of characteristics is very common, so this phenomenon may affect the results of calculations [28].

2.3. Models Based on Energy Approach

Smith-Watson-Topper Model

Smith, Watson and Topper in the study [14] proposed for description of fatigue phenomenon to consider in calculations, both the stresses and strains. The parameter elaborated by the authors is known as the pSWT parameter and in the group of energy models. Socie [29] proposed a modification to the SWT parameter, which subsequently offers the estimation of the multiaxial fatigue life of proportional and non-proportional cyclic loading. The modification is based on the assumption that stresses and strains are calculated as sizes acting perpendicular to the critical plane. The proposed modification is the most common form that is applied for writing the SWT parameter in the critical plane of the maximal range of normal strain Δε1 in the form:
p SWT = σ n , max Δ ε 1 2
By adapting the Manson-Coffin dependency as the effort function, fatigue lifetime can be estimated using:
p SWT = σ n , max Δ ε 1 2 = σ f 2 2 ( 2 N f ) 2 b + σ f ε f ( 2 N f ) b + c

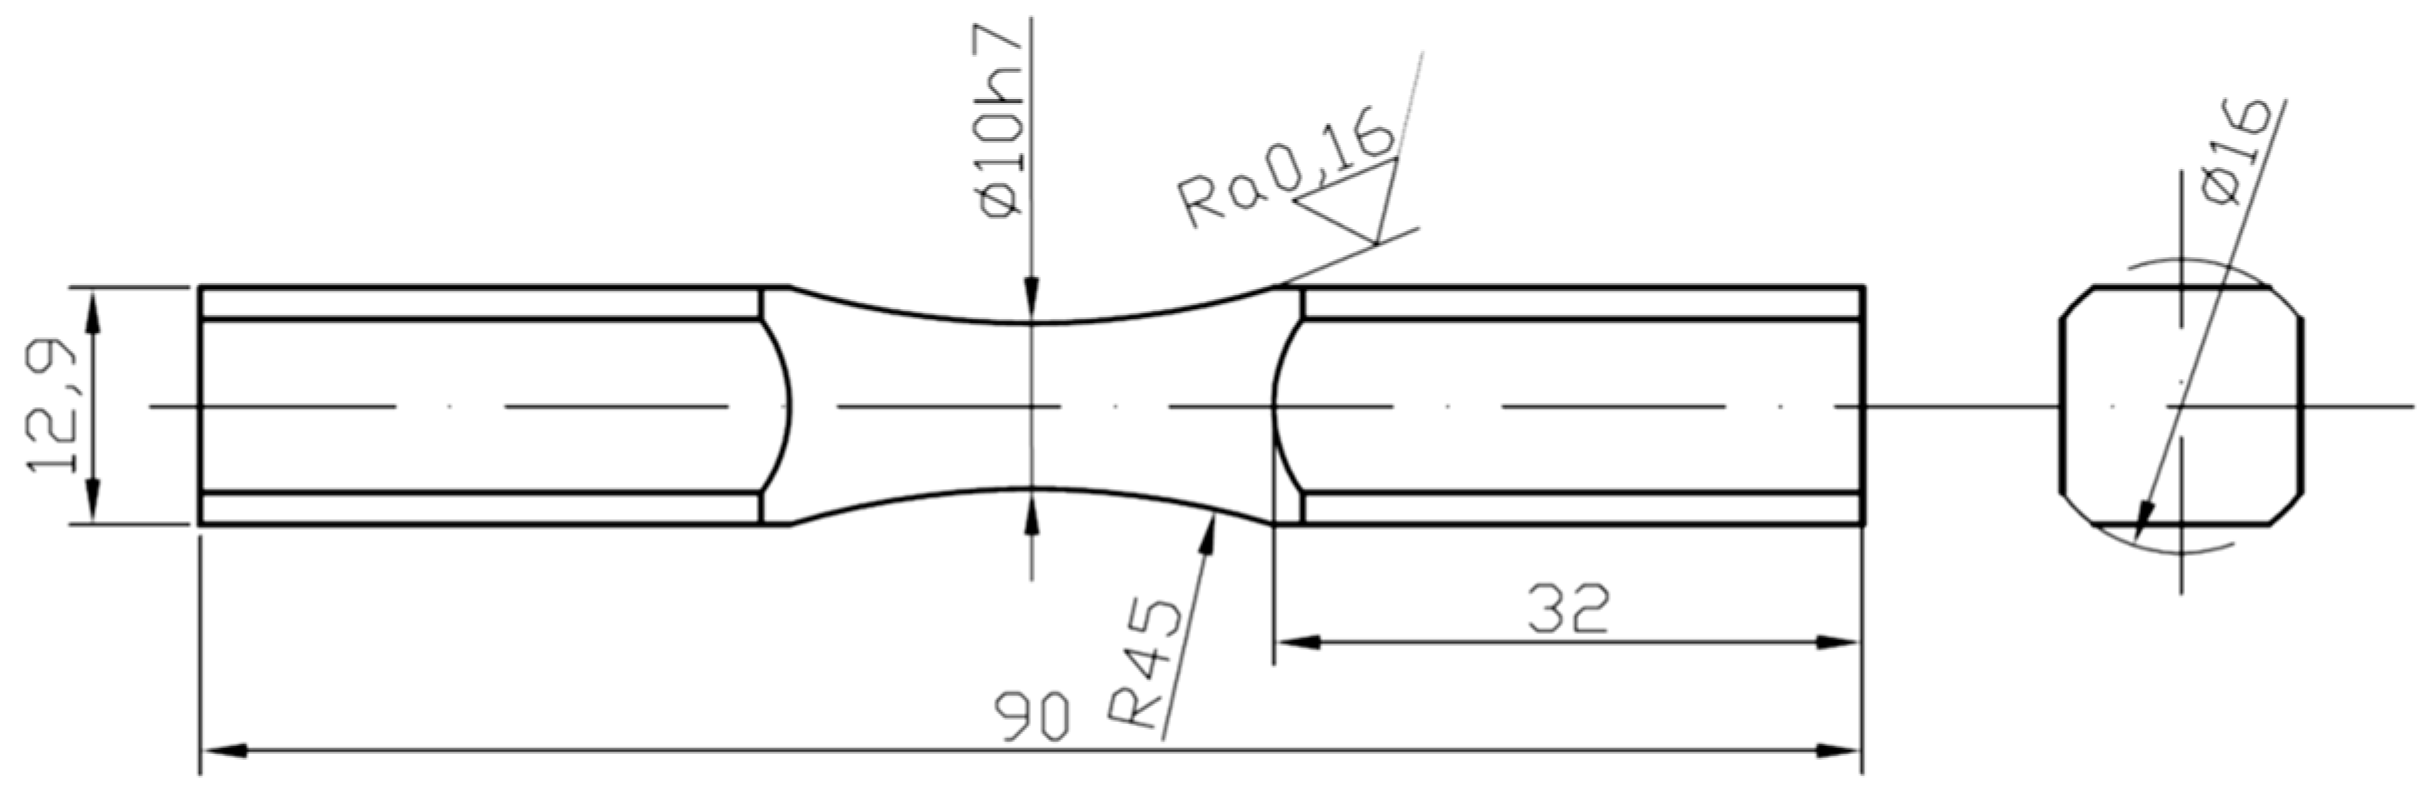
3. Experimental Study

A fatigue test was performed in specimens made of 2017A-T4 [15] and 6082-T6 [15,30] aluminum alloys and also of S355J0 [31] steel alloy. Strength properties of the analyzed materials are provided in Table 1. For the 2017A-T4 aluminum alloy and S355J0 steel alloy, the tests included bending, torsion conditions and two combinations of constant-amplitude of proportional bending with torsion, for which τ(t) = σ(t) and τ(t) = 0.5σ(t) with zero and non-zero mean value. For the 6082-T6 aluminum alloy, additional combinations of constant-amplitude of bending with torsion, for which τ(t) = 0.25σ(t) were analyzed.
The tests projected in this study were performed in room temperature by using the MZGS100 fatigue testing machine that can apply the control of the resultant moment of loading the specimen, on specimens presented in Figure 1. The loads were of a sinusoidal nature with a frequency of about 25–29 Hz. The amplitudes and the mean value of the load were changed according to the test requirements. For each combination of load at least two or three specimens were used. The nominal stress amplitude and nominal mean stress value were used in calculations.
For S355J0 steel, functions for calculations of material sensitivity factor on the asymmetry of cycles for normal and shear stresses were defined experimentally [31]:
—For bending: ψσ(N) = 3.124⋅N−0.162,
—For torsion ψσ (N) = 2.890⋅N−0.148.

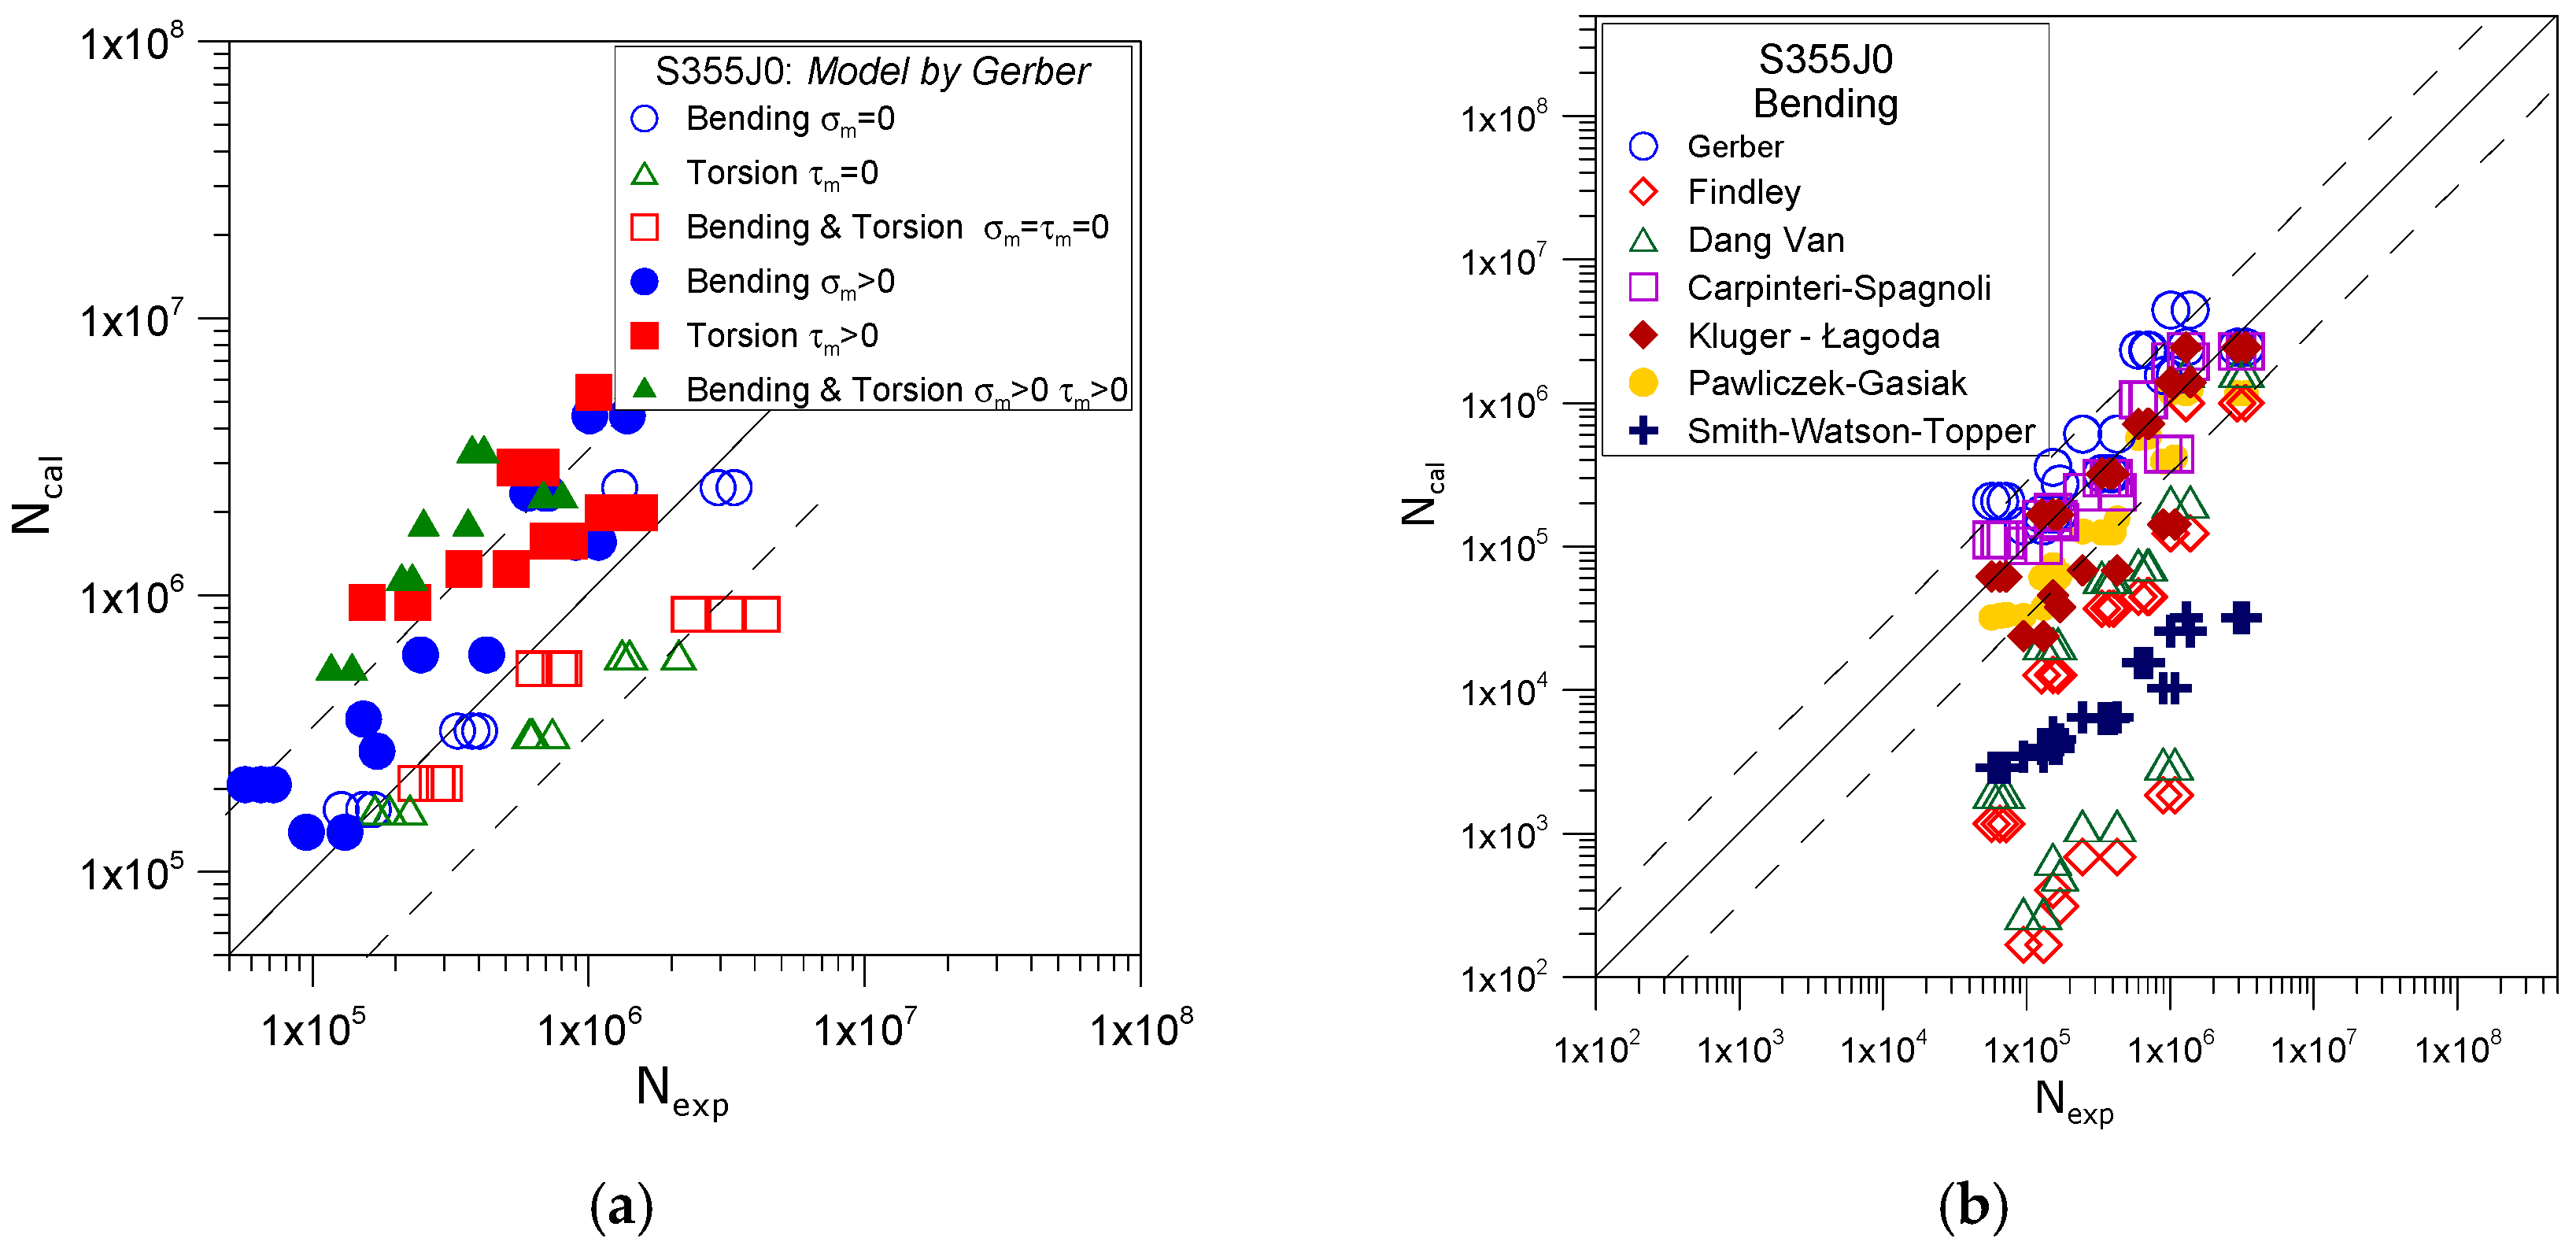
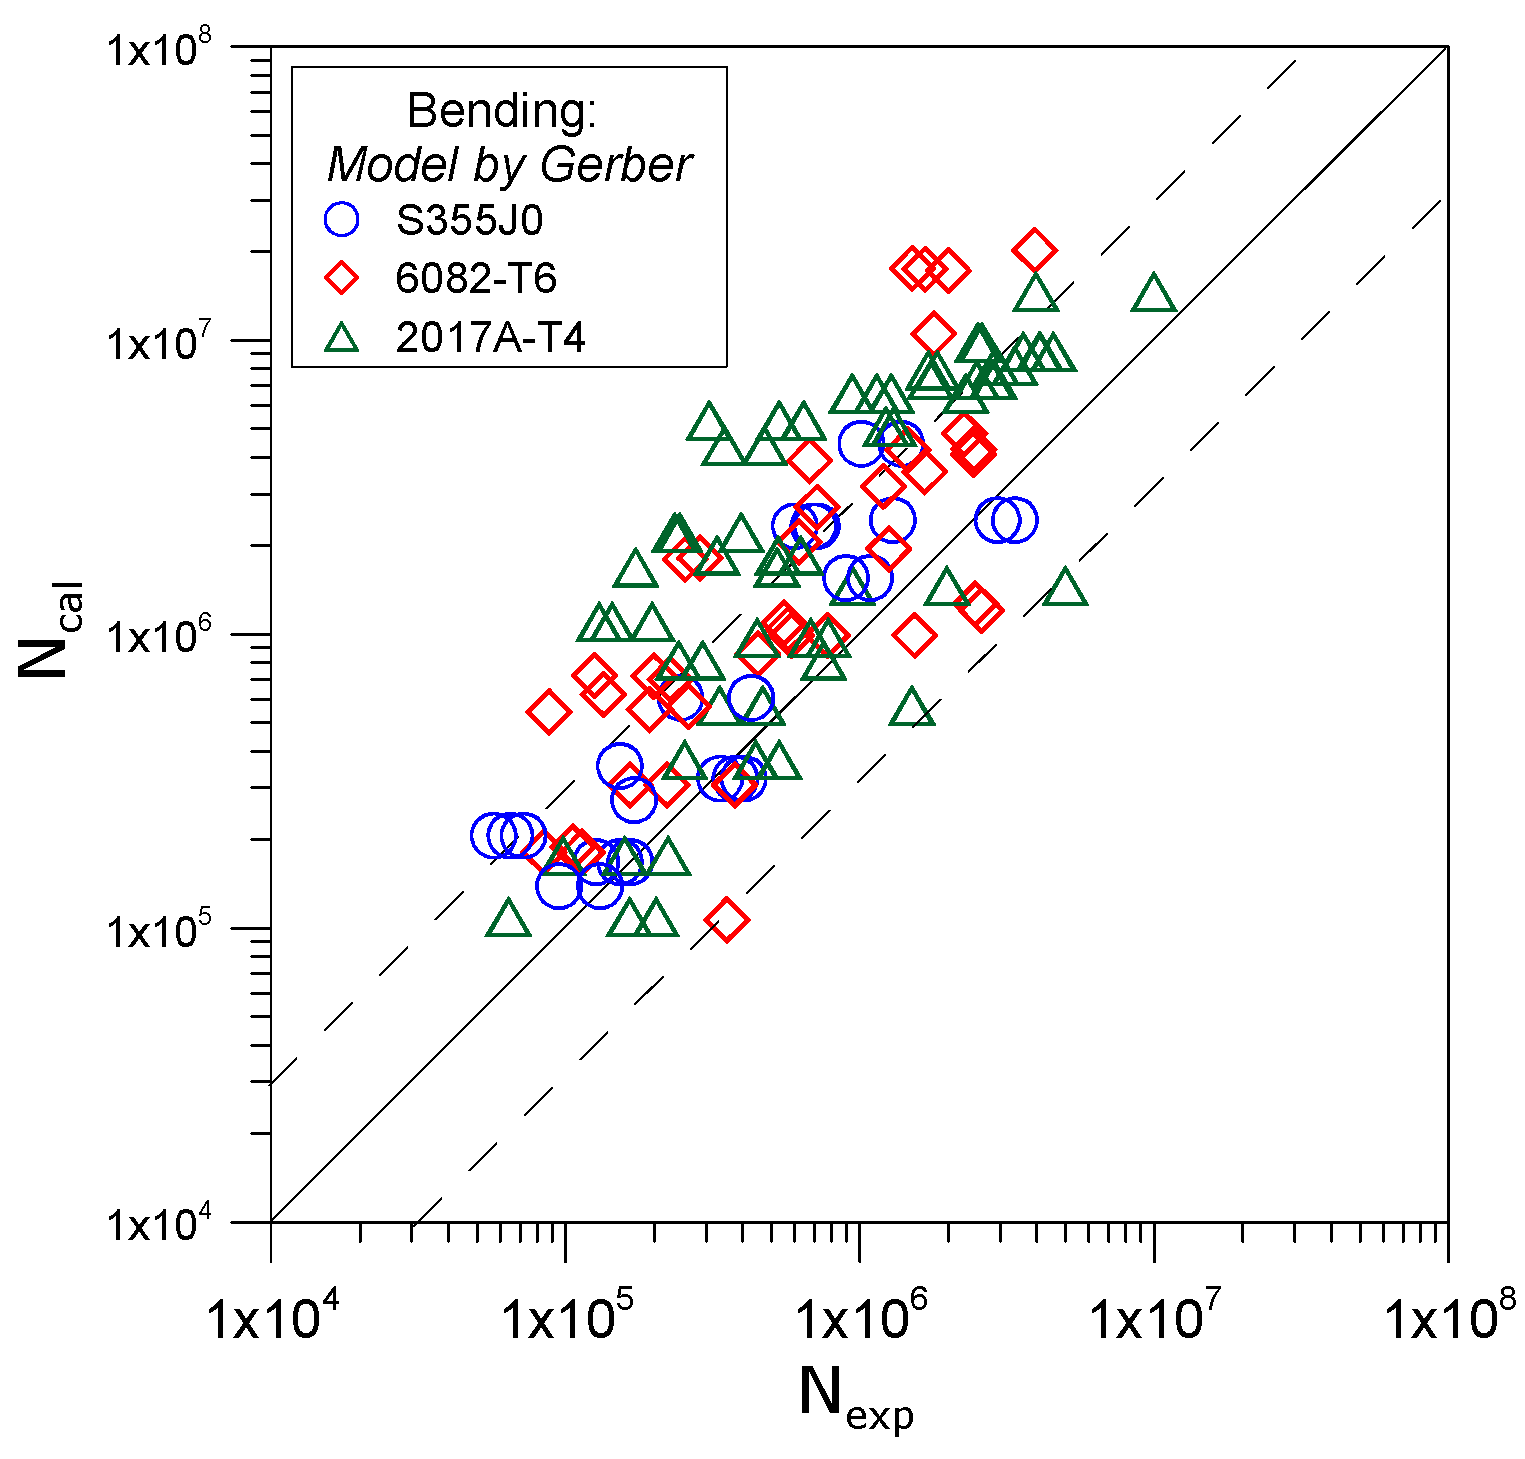
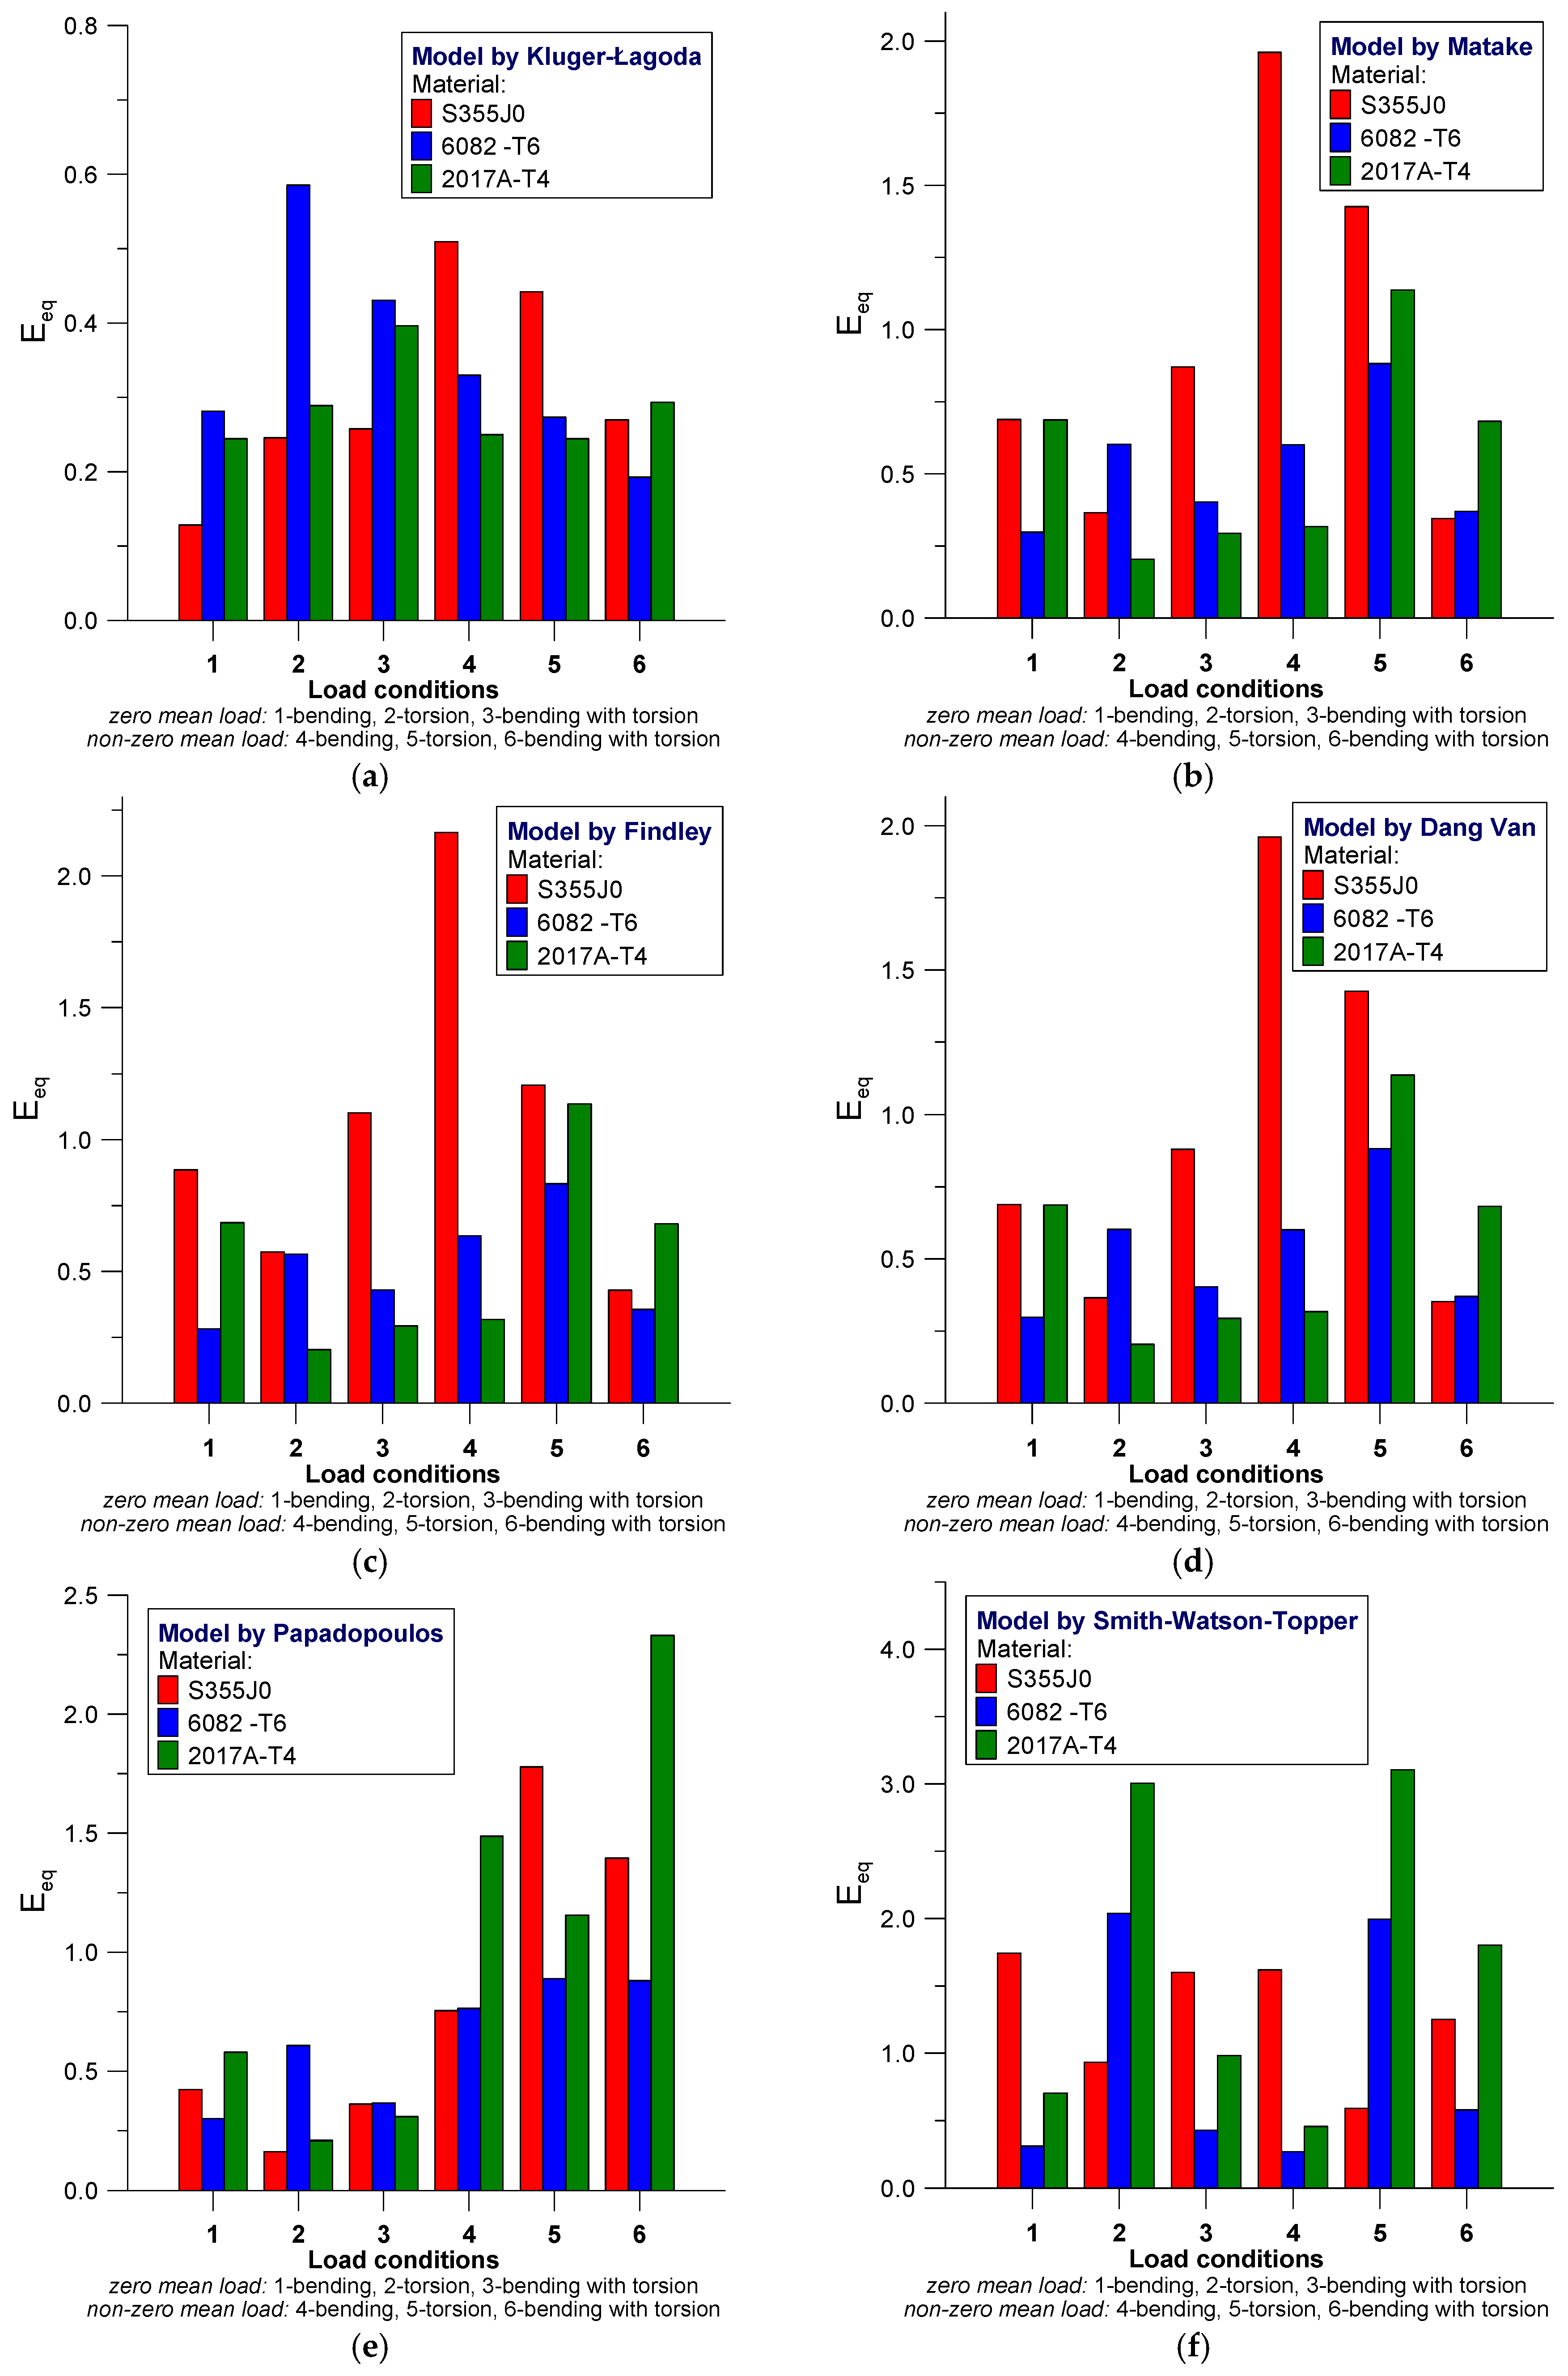
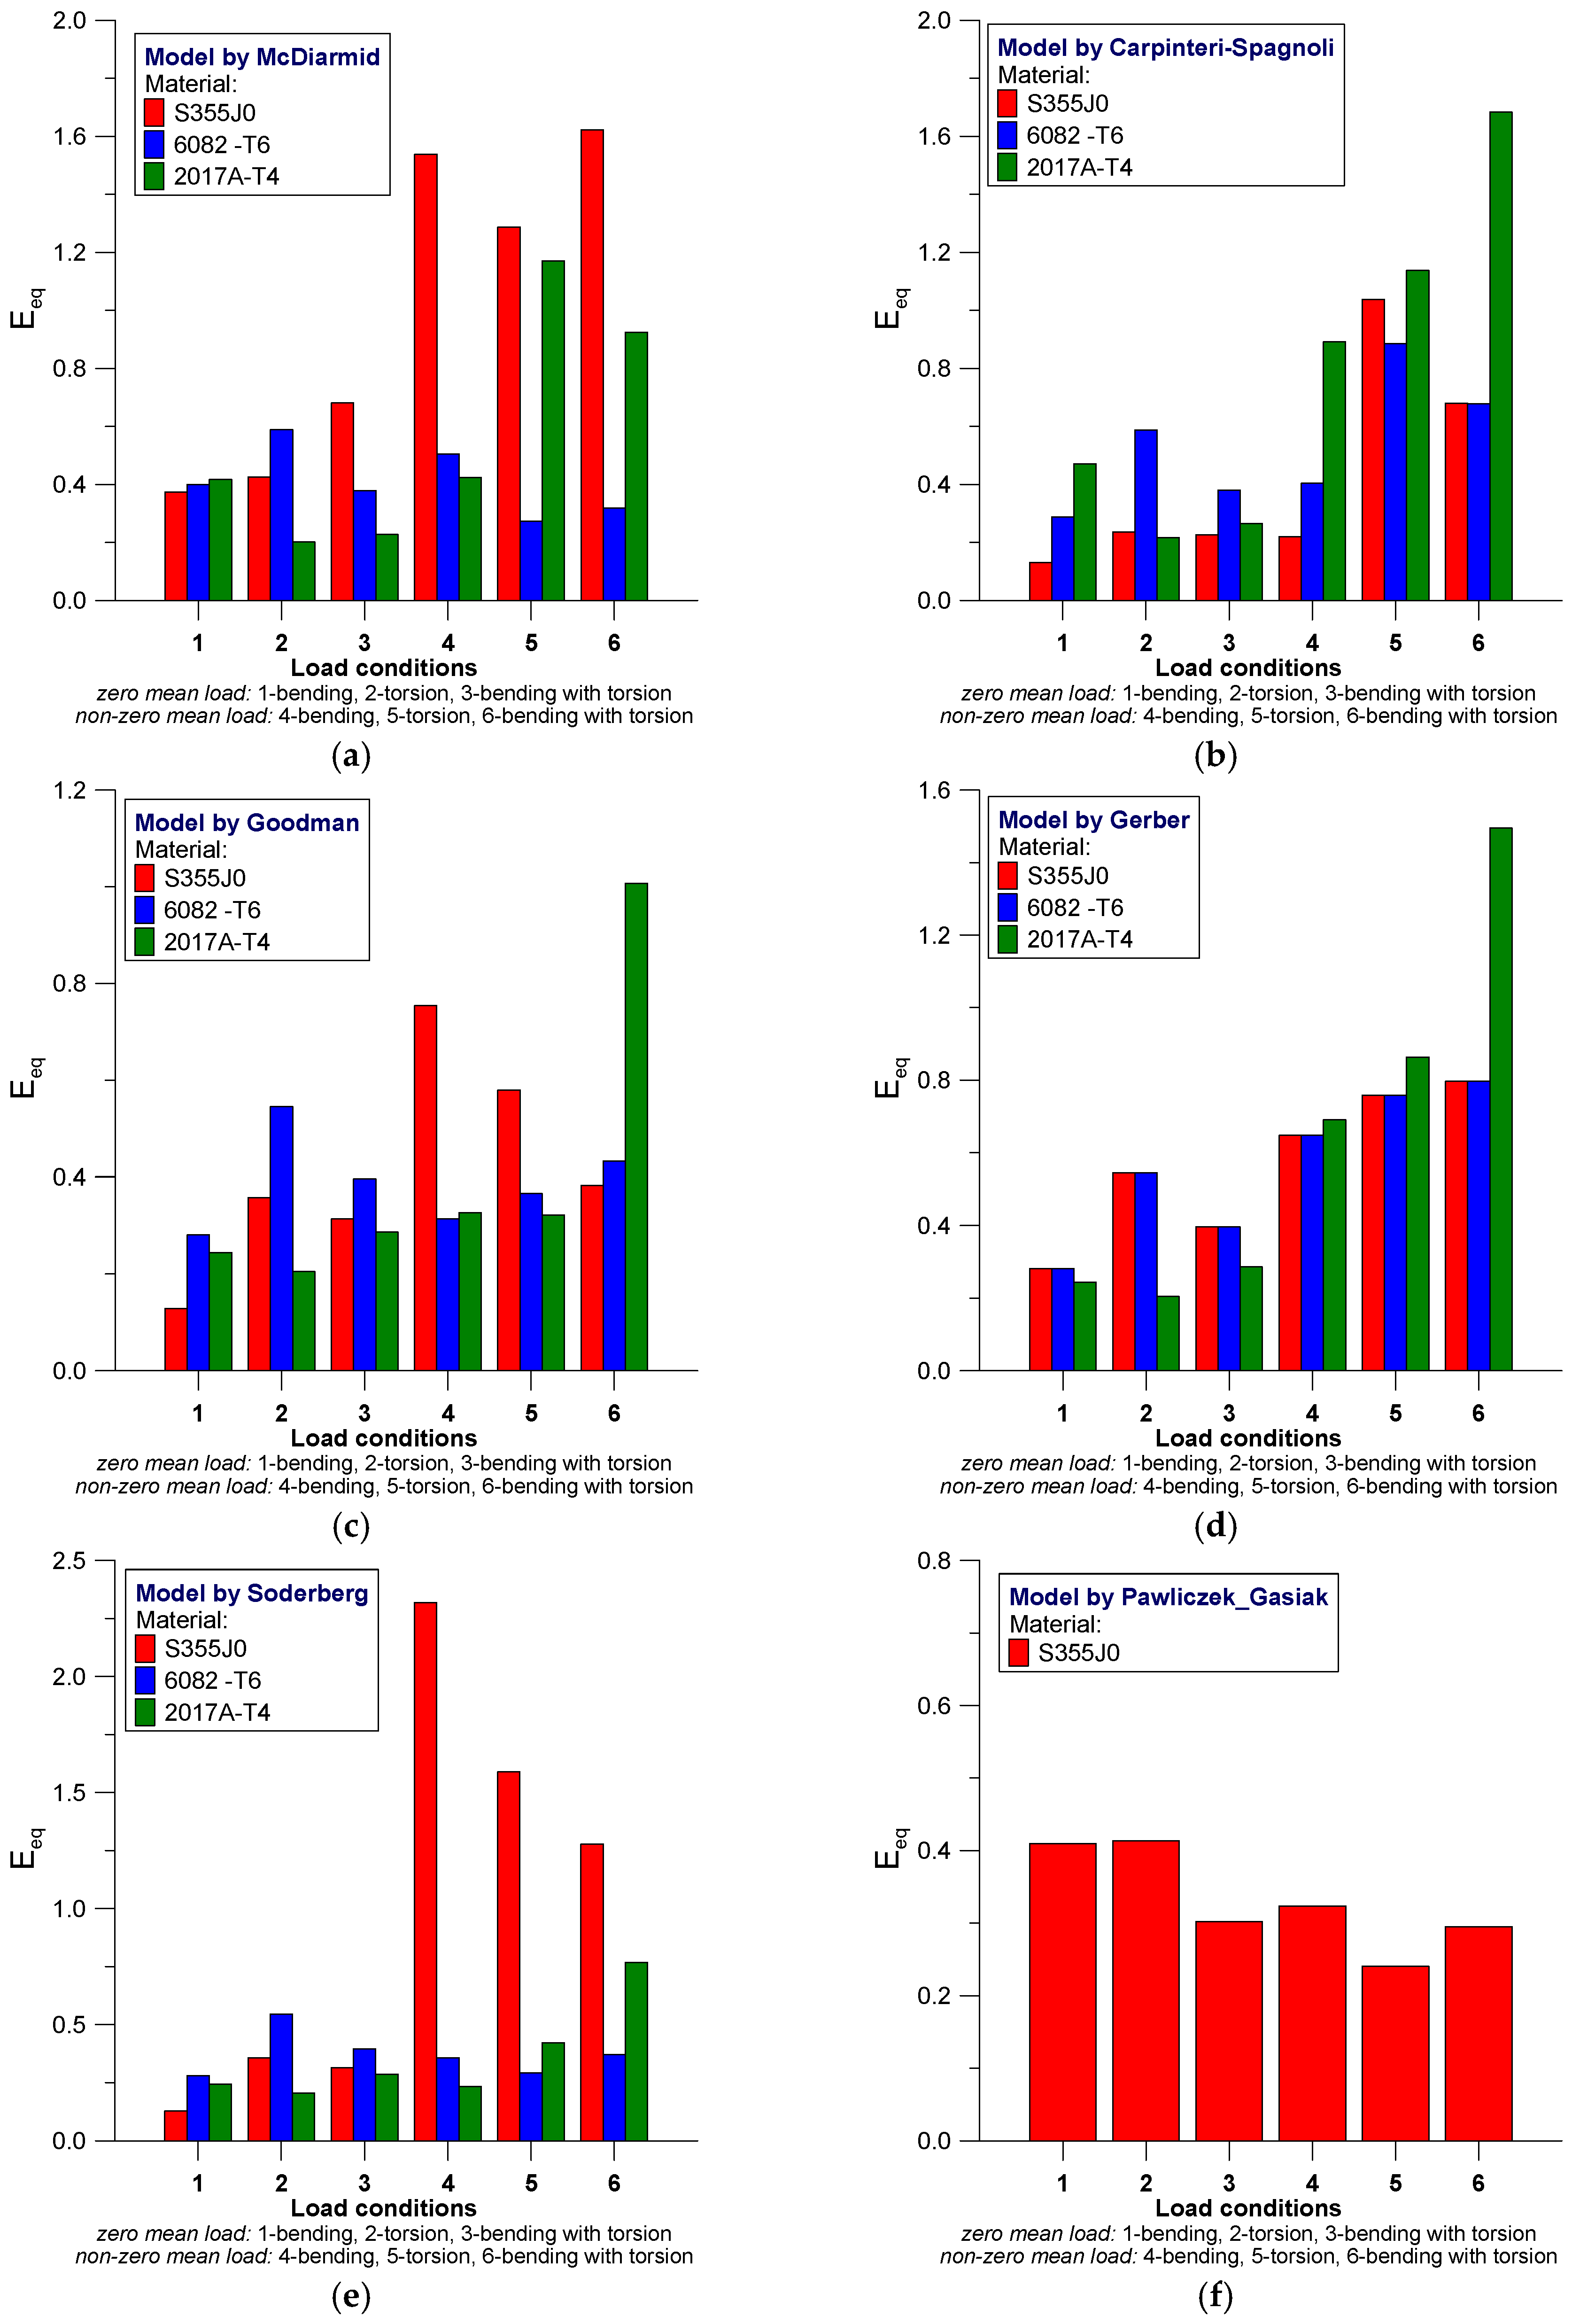
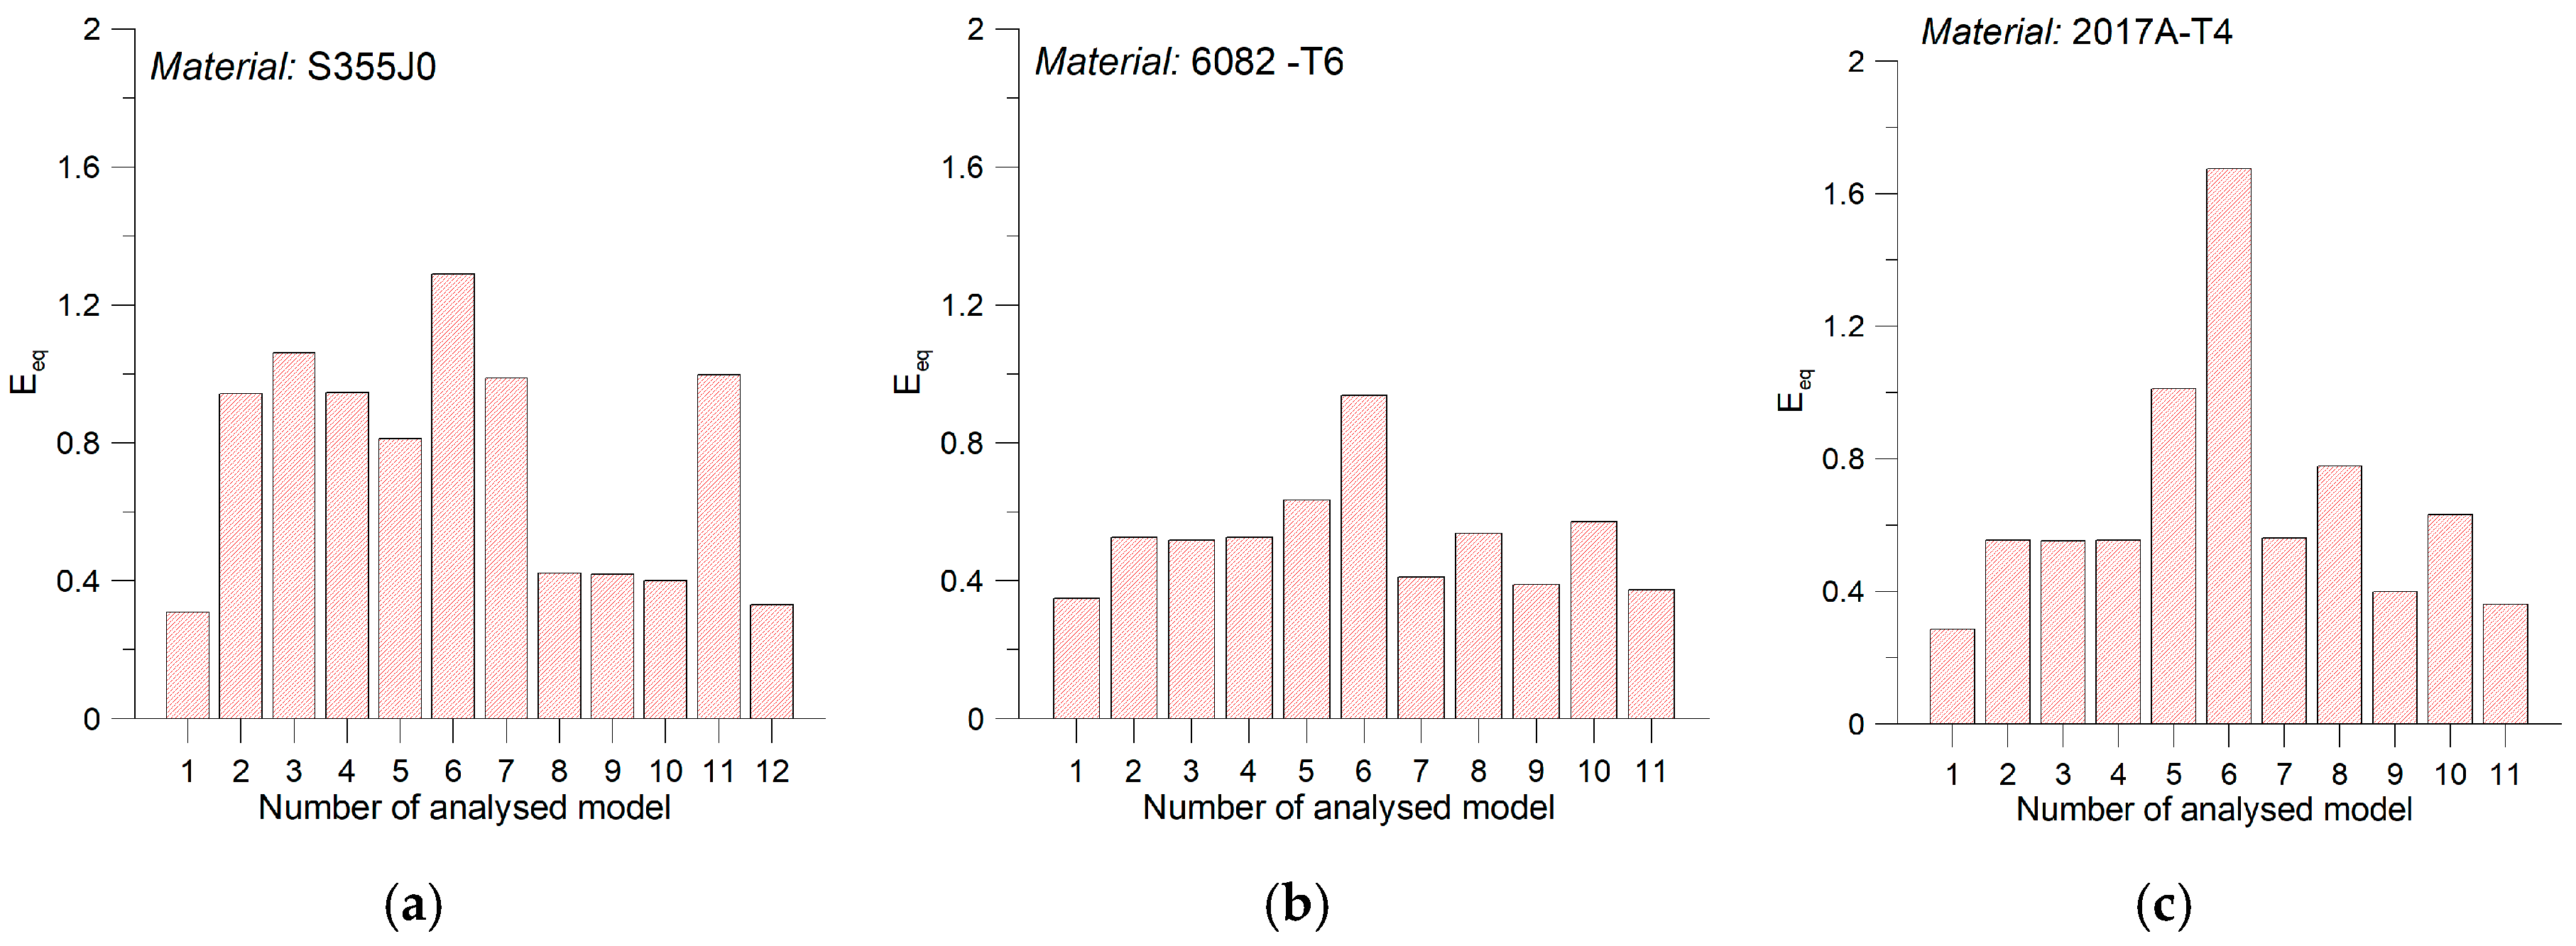
4. Analysis of Results

A wide range of empirical research tests allows for estimation of the effectiveness of fatigue life prediction using the analyzed models regarding the impact of mean loading. The estimation involved the computational models for each material in cases of various loading. The application of various materials for the purpose of this study allowed for performing estimation of fatigue life prediction in selected models in relation to the material grade.
Figure 2 illustrates an exemplary comparison of the calculated fatigue life (Ncal) and the one derived experimentally (Nexp) for S355J0 steel under various loading conditions using the Gerber’s model (Figure 2a) and a comparison of the applied computational models according to one type of loading-bending (Figure 2b). The equivalent stress σeq was determined using the Gerber model (Equation (3)). This stress was used to determine the calculated fatigue life Ncal using a standard S-N curve for bending (see Table 1, slope factor and intercept).
Application in the study of different materials also offered the assessment of the efficiency of fatigue life prediction in selected models with respect to the type of the material. Figure 3 presents an exemplary graph comparing the stability of computational results with those obtained experimentally by using Gerber’s model.
The solid line in Figure 2 and Figure 3 represents perfect compatibility between the results derived in calculations and experimental ones. The dotted lines represent the range of scatter of results, for which the ratio of the number of cycles to failure derived by calculations Ncal and those derived experimentally Nexp corresponds to results the value of 3 and ⅓.
The feasibility of the analyzed computational models and results obtained by an empirical test was estimated by the analysis of computational scatter-band as [1,32]:
E eq = E m 2 + E std 2
where Em is the mean scatter, while Estd is the standard deviation to mean scatter, respectively derived from the relation:
E m = 1 n i = 1 1 E i ,
E std = 1 n 1 i = 1 1 ( E i E m ) 2
where n is the number of specimens. The scatter band for the particular results was determined as
E i = log N i , cal N i , exp
The scatter values derived on the basis of Equation (38) for analyzed models according to the materials used in the test are presented in Figure 4 and Figure 5.
In most cases, it can be seen that efficiency in estimating fatigue life depends on the manner of loading and type of material. We can note that the use of Kluger-Lagoda model (Figure 4a) does not lead to scatter bands not exceeding the value of 0.6 and the maximum values are received for torsion in 6082-T6 aluminum alloy and S355J0 steel under bending and torsional loading with mean value of loading. By using the model by Matake (Figure 4b) greater scatters are received for non-zero mean value of loading under bending and torsion in S355J0 steel, wherein, the case of bending relates also to aluminum alloys. For Findley’s model (Figure 4c) the largest scatter bands are derived for S355J0 steel, regardless of the manner of loading, whereas in the case of complex loading with non-zero mean value, satisfactory results of fatigue life estimation were obtained, which were comparable for all analyzed materials. The Dang Van fatigue model (Figure 4d) yields very similar results in terms of the nature and values as they are derived from Findley’s model. Additionally, the fatigue life prediction for S355J0 steel demonstrates large scatters. Models proposed by Papadopoulos (Figure 4e) are characterized by wide-ranging scatter plots of results for non-zero mean value loads in all of the analyzed materials, while loading with zero mean value indicates two to three times lower scatters. The Smith-Watson-Topper model (Figure 4f) demonstrates extended scatters for both tested aluminum alloys under torsion loading with—both for zero as well as the non-zero mean value, where the scatter band receive the values: Eeq = 2 and 3 for 6082-T6 and 2017A-T4, respectively. For S355J0 steel the scatter bands are ranging from 0.5 to 1.75.
Figure 5 shows the continuation of the analysis for the remaining models.
Scatter bands of fatigue life estimation results calculated according to the model by McDiarmid is presented in Figure 5a, wherein for loading with mean value, the poor results were obtained for S355J0 steel and 2017A-T4 alloy under torsion and bending with torsion with mean value of loading. Moreover, in the Carpinteri-Spadnoli model (Figure 5b) the poorest estimation results are derived under loading with mean value for bending, torsion and torsion with bending.
Fatigue life estimations based on models by Goodman (Figure 5c) and Gerber (Figure 5d) are characterized by similarity of scatter bands, wherein, the dependence by Gerber seems to be more sensitive to the type of test material—scatter levels for all of the analyzed cases of loading are similar for three of the analyzed materials. For 2017A-T4 alloy in complex stress state with mean value, both of the analyzed dependencies indicate approximately two times wide-ranging scatter bands than the other cases of loading. As a result of the application of the model proposed by Soderberg (Figure 5e), three to four times larger scatters with regard to the estimation results for S355J0 steel, being tested under loading with mean stress values. For S355J0 steel the fatigue life prediction was additionally performed using the model proposed by Pawliczek and Gasiak (Figure 5f). This model is characterized by a scatter plot on the results that ranged from 0.25 to 0.4 for all the analyzed cases of loading with both, the zero and non-zero mean values of stress.
The above observations indicate that most of these models demonstrate high sensitivity to loading conditions. In certain cases, there can be seen larger discrepancies between computational results and experimental results under loading with non-zero mean values.
In order to assess the flexibility of the analyzed calculation models considering the effect of mean load and the type of loading (i.e., simple or complex), mean value of scatter bands Eeq were subsequently derived for each of the materials (Figure 6). For S355J0 steel the most adequate averaged results were obtained for models by Kluger-Lagoda, Carpinteri-Spagnoli, Goodman, Gerber and Pawliczek-Gasiak, where scatter band of the results was Eeq < 0.4. In the case of aluminum alloys, the discrepancy was not equally evident in terms of the analyzed calculation models, however, the most efficient results of computations were obtained for the Kluger-Lagoda dependency, and then for Goodman and Soderberg’s models.

5. Conclusions and Finding

The study reported in this paper was concerned with the discussion of the results of a fatigue test performed for three materials: S355J0 steel alloy and two aluminum alloys designated as: 6082-T6 and 2017A-T4. Specimens were tested under bending, torsion, and various combinations of bending with torsion. To estimate fatigue life under multiaxial loading including the influence of the mean value, a several, well known-models for High diagram σamam) description were used. Models based on the critical plane, where the maximum stresses as the sum of the amplitude of stress and the mean value have been investigated. The paper also presents the model taking into account changes of the sensitivity of the material to mean loads depending on the number of cycles to failure. The scatter-band of results expressed as the relationship between the fatigue lifetime based on calculations Ncal and the fatigue life based on empirical tests Nexp were also applied as the criteria for estimating the suitability of the models.
Results from the analysis results in the statement of the following conclusions:
  • For S355J0 steel the most accurate mean conformity of the calculated and experimental results was obtained for models by Kluger-Lagoda, Carpinteri-Spagnoli, Goodman, Gerber and Pawliczek-Gasiak;
  • For both aluminum alloys, the models proposed by Kluger-Lagoda and also by Goodman and Soderberg proved to be most adequate, other models indicate higher discrepancies for cases of loading with load mean values;
  • In the case of aluminum alloys, the Smith-Watson-Topper model demonstrates higher sensitivity in specimens subjected to torsional loading;
  • Models in which the mean load is considered as a total of stress amplitude and mean stress (maximum stress as a criterion value) produce highly deteriorated fatigue life estimation results;
  • For the analyzed loading conditions, the most accurate fatigue life estimations are obtained by using models that consider the material sensitivity change as the load mean value varies according to the number of cycles to failure (Pawliczek-Gasiak) and those taking into account the relationship between basic fatigue characteristics for bending and torsion (Kluger-Lagoda).

Author Contributions

Conceptualization, K.K.; resources, all authors; experiment and data analysis, all authors; writing—original draft preparation, R.P.; writing—review and editing, K.K.; supervision, R.P.

Funding

This research was funded by project financially co-supported by Minister of Science and Higher Education in the range of the program entitled "Regional Initiative of Excellence" for the years 2019-2022, Project No. 017/RID/2018/19, amount of funding 12.000.000 PLN.

Conflicts of Interest

The authors declare no conflict of interest.

Nomenclature

bfatigue strength exponent
B, Kweight factors depending on the number of cycles to failure
cfatigue ductility exponent
Eeqcomputational scatter-band
Eiscatter-band for the individual results
Emthe mean scatter-band
Estdthe standard deviation to mean scatter-band
kweight factor
Nfnumber of cycles to failure
Ni,calcalculated fatigue life for individual specimens
Ni,expexperimental fatigue life for individual specimens
pSWTSmith-Watson-Topper parameter
pσ, pτ1, pτ2coefficients derived experimentally
T a amplitude of generalized shear stress
αcritical plane orientation angle
δangle of rotation of the principal stress directions
Δε1normal strain range on the critical plane
ε′ffatigue ductility coefficient
η, λfactors determined based on the Haigh diagram for normal and shear stresses, respectively
σ′ffatigue strength coefficient
σaamplitude of normal stress
σaeqamplitude of equivalent normal stress calculated for multiaxial stress state
σaffatigue limits for fully reversed bending
σaTtransformed normal stress amplitude due to the mean value
σeqamplitude of equivalent stress for fully reversed uniaxial stress
σH,maxhydrostatic stresses
σmmean value of normal stress
σmeqmean value of equivalent stress calculated for multiaxial stress state
σnthe tensile normal stress on the plane of maximum shear stress
σn,anormal stress amplitude on critical plane
σn,mnormal mean stress on critical plane
σn,maxmaximal, normal stress on critical plane
σUultimate tensile strength
σyyield strength
τaffatigue limit for alternating torsion
τμmesoscopic shear stresses
ψσ ψτmaterial sensitivity factor for the asymmetry of cycle
τaamplitude of shear stress
τaeqamplitude of equivalent shear stress calculated for multiaxial stress state
τaTtransformed shear stress amplitude due to the mean value
τmmean value of shear stress
τmaxthe maximal shear stress
τnshear stress on critical plane
τn,ashear stress amplitude on the critical plane
τn,mshear mean stress on the critical plane

References

  1. Kluger, K.; Łagoda, T. Fatigue life of metallic material estimated according to selected models and load conditions. J. Theor. Appl. Mech. 2013, 51, 581–592. [Google Scholar]
  2. Skibicki, D.; Sempruch, J.; Pejkowski, L. Model of non-proportional fatigue load in the form of block load spectrum. Mater. Sci. Eng. Techonl. 2014, 45, 68–78. [Google Scholar] [CrossRef]
  3. Carpinteri, A.; Karolczuk, A.; Macha, E.; Vantadori, S. Expected position of the fatigue fracture plane by using the weighted mean principal Euler angles. Int. J. Fract. 2002, 115, 87–99. [Google Scholar] [CrossRef]
  4. Liu, Y.; Mahadevan, S. Multiaxial high-cycle fatigue criterion and life prediction for metals. Int. J. Fatigue 2005, 27, 790–800. [Google Scholar] [CrossRef]
  5. Liu, Y.; Zenner, H. The fatigue limit of ductile metals under multiaxial loading. Eur. Struct. Integr. Soc. 2003, 31, 147–164. [Google Scholar]
  6. Papuga, J. A survey on evaluating the fatigue limit under multiaxial loading. Int. J. Fatigue 2011, 33, 153–165. [Google Scholar] [CrossRef]
  7. Karolczuk, A.; Macha, E. Critical planes in multiaxial fatigue. Mater. Sci. Forum 2005, 482, 109–114. [Google Scholar] [CrossRef]
  8. Karolczuk, A.; Kowalski, M.; Kluger, K.; Żok, F. Identification of Residual Stress Phenomena Based on the Hole Drilling Method in Explosively Welded Steel-Titanium Composite. Arch. Metall. Mater. 2014, 59. [Google Scholar] [CrossRef]
  9. Youtsos, A. (Ed.) Residual Stress and Its Effects on Fatigue and Fracture: Proceedings of A Special Symposium Held within the 16th European Conference of Fracture—ECF16, Alexandroupolis, Greece, 3–7 July 2006; Springer: Dordrecht, The Netherlands, 2006. [Google Scholar]
  10. Zhuang, W.; Halford, G. Investigation of residual stress relaxation under cyclic load. Int. J. Fatigue 2001, 23, 31–37. [Google Scholar] [CrossRef]
  11. Gerber, W. Determination of permissible stresses in iron constructions. Z Bayer Arch. Ing. Ver. 1974, 6, 101–110. (In German) [Google Scholar]
  12. Findley, W. A theory for the effect of mean stress on fatigue of metals under combined torsion and axial load or bending. J. Eng. Ind. 1959, 81, 301–306. [Google Scholar] [CrossRef]
  13. Dang Van, K.; Cailletaud, G.; Flavenot, J.; Le Douaron, A.; Lieurade, H. Criterion for high cycle fatigue failure under multiaxial loading. In Biaxial and Multiaxial Fatigue; Brown, M., Miller, K.J., Eds.; Mechanical Engineering Publication: London, UK, 1989; pp. 459–478. [Google Scholar]
  14. Smith, K.; Watson, P.; Topper, T. Stress-strain function for fatigue of metals. J. Mater. 1970, 5, 767–778. [Google Scholar]
  15. Kluger, K. Fatigue life estimation for 2017A-T4 and 6082-T6 aluminium alloys subjected to bending-torsion with mean stress. Int. J. Fatigue 2015, 80, 22–29. [Google Scholar] [CrossRef]
  16. Kluger, K.; Łagoda, T. New energy model for fatigue life determination under multiaxial loading with different mean values. Int. J. Fatigue 2014, 66, 229–245. [Google Scholar] [CrossRef]
  17. Gasiak, G.; Pawliczek, R. Application of an energetic model for fatigue life prediction of the construction steels under bending, torsion and synchronous bending and torsion. Int. J. Fatigue 2003, 25, 1339–1346. [Google Scholar] [CrossRef]
  18. Goodman, J. Mechanics Applied to Engineering, 9th ed.; N Y Longmans Green Co.: New York, NY, USA, 1954. [Google Scholar]
  19. Suresh, S. Fatigue of Materials, 2nd ed.; Cambridge University Press: Cambridge, UK, 1998. [Google Scholar]
  20. Soderberg, C. Factor of Safety and Working Stress. Trans. ASME 1930, 52, 13–28. [Google Scholar]
  21. Szala, G.; Ligaj, B. Two-Parameter Fatigue Characteristics of Structural Steels and Their Experimental Verification; Monograph, J.S., Ed.; Scientific Publisher ITE: Bydgoszcz, Poland, 2011. (In Polish) [Google Scholar]
  22. Carpinteri, A.; Spagnoli, A.; Vantadori, S.; Bagni, C. Structural integrity assessment of metallic components under multiaxial fatigue: The C-S criterion and its evolution. Fatigue Fract. Eng. Mater. Struct. 2013, 36, 870–883. [Google Scholar] [CrossRef]
  23. McDiarmid, D. A shear stress based critical-plane criterion of multiaxial fatigue failure for design and life prediction. Fatigue Fract. Eng. Mater. Struct. 1994, 17, 475–484. [Google Scholar] [CrossRef]
  24. McDiarmid, D. A general criterion for high cycle multiaxial fatigue failure. Fatigue Fract. Eng. Mater. Struct. 1991, 14, 429–453. [Google Scholar] [CrossRef]
  25. Papadopoulos, I. Critical plane approaches in high-cycle fatigue: On the definition of the amplitude and mean value of the shear stress acting on the critical plane. Fatigue Fract. Eng. Mater. Struct. 1998, 21, 269–285. [Google Scholar] [CrossRef]
  26. Papadopoulos, I.; Davoli, P.; Gorla, C.; Filippini, M.; Bernasconi, A. A comparative study of multiaxial high-cycle fatigue criteria for metals. Int. J. Fatigue 1997, 19, 219–235. [Google Scholar] [CrossRef]
  27. Matake, T. An Explanation on Fatigue Limit under Combined Stress. Bull. JSME 1977, 20, 257–263. [Google Scholar] [CrossRef]
  28. Karolczuk, A.; Kluger, K. Analysis of the coefficient of normal stress effect in chosen multiaxial fatigue criteria. Theor. Appl. Fract. Mech. 2014, 73, 39–47. [Google Scholar] [CrossRef]
  29. Socie, D. Multiaxial fatigue damage models. ASME J. Eng. Mater. Technol. 1987, 109, 292–298. [Google Scholar] [CrossRef]
  30. Niesłony, A.; Łagoda, T.; Walat, K.; Kurek, M. Multiaxial fatigue behaviour of AA6068 and AA2017A aluminium alloys under in-phase bending with torsion loading condition. Mater. Sci. Eng. Technol. 2014, 45, 947–952. [Google Scholar] [CrossRef]
  31. Pawliczek, R. Fatigue Fracture Plane Orientation under Combined Bending and Torsion for 18G2A (S355J0) Steel; Opole University of Technology, Faculty of Mechanical Engineering: Opole, Poland, 2000. [Google Scholar]
  32. Karolczuk, A. Plastic strains and the macroscopic critical plane orientations under combined bending and torsion with constant and variable amplitudes. Eng. Fract. Mech. 2006, 73, 1629–1652. [Google Scholar] [CrossRef]
Figure 1. Shape and dimensions (in millimetres) of the specimen of the analyzed materials used in fatigue tests.
Materials 12 02310 g001
Figure 2. Comparison of calculated and experimental fatigue life for S355J0 steel; (a) for the Gerber model and various types of load; (b) for bending and various calculation models.
Materials 12 02310 g002
Figure 3. Comparison of calculated and experimental fatigue life by applying Gerber’s model for three tested materials subjected to bending.
Materials 12 02310 g003
Figure 4. Scatter bands Eeq for the analyzed models corresponding to tested materials. (a) Kluger-Lagoda; (b) Matake; (c) Findley; (d) Dang Van; (e) Papadopoulos; (f) Smith-Watson-Topper.
Materials 12 02310 g004
Figure 5. Scatter bands Eeq for the analyzed models corresponding to tested materials, cont. (a) McDiarmid; (b) Carpinteri-Spagnoli; (c) Goodman; (d) Gerber; (e) Soderberg; (f) Pawliczek-Gasiak.
Materials 12 02310 g005
Figure 6. Average scatter bands Eeq for materials (a) S355J0; (b) 6082-T6; (c) 2117A-T4 for the analyzed models: 1. Kluger-Łagoda; 2. Matake; 3. Findley; 4. Dang Van; 5. Papadopoulos; 6. Smith-Watson-Topper; 7. McDiarmid; 8. Carpinteri-Spagnoli; 9. Goodman; 10. Gerber; 11. Soderberg; 12. Pawliczek-Gasiak.
Materials 12 02310 g006
Table 1. Strength and fatigue properties of the analyzed materials.
PropertiesDesignation and Unit2017A-T46082-T6S355J0
Young’s modulusE, [GPa]7272213
Tensile strength limitσu, [MPa]545385611
Yield strength limitσy, [MPa]395365394
Fatigue strength coefficientσ′f, [MPa]643651880
Slope factor of S-N curves (for bending)mσ7.038.007.10
Intercept of S-N curves (for bending)Aσ21.8723.8323.80
Slope factor of S-N curves (for torsion)mτ6.877.711.7
Intercept of S-N curves (for torsion)Aτ19.9421.432.8
Fatigue limit for bendingσaf, [MPa]142126271
Fatigue limit for torsionτaf, [MPa]7874175

