Abstract
To increase transmission efficiency and reduce operation cost, dual-phase (DP) steels have been considered for pipeline applications. Welding has to be involved in such applications, which would cause a localized alteration of materials and cause many potential fatigue issues to arise under cyclic loading. In this work, the fatigue crack propagation and fatigue life of simulated heat-affected zone (HAZ) were examined. Results indicate that when the maximum stress is at the same magnitude, the fatigue life at a peak temperature of 1050 °C is very close to that of a peak temperature of 850 °C, and both of them are higher than that of a peak temperature of 1350 °C. The changes in da/dN with ΔK for HAZ subregions are attributed to the variation of crack path and fracture mode during the crack propagation. The fatigue cracks may propagate along the bainite lath preferentially in coarse-grained HAZ (CGHAZ), and the prior austenite grain boundaries can change the crack growth direction. A considerable amount of highly misoriented grain boundaries in fine-grained HAZ (FGHAZ) and intercritical-grained HAZ (ICHAZ) increase the crack growth resistance. The difference of fatigue crack propagation behavior in HAZ subregions between actual and simulated welded joints was also discussed.
1. Introduction
Dual-phase (DP) steel, a type of advanced high-strength steel (AHSS), is being increasingly used in the transportation of oil and natural gas due to its good processability and balanced combination of strength and ductility [,,]. This excellent performance is attributed to dual-phase microstructural characteristics. For the ferrite/bainite DP steel, the ferrite as a soft phase have higher ductility, and the bainite as a hard phase is strong [,]. A high-strength pipeline steel with excellent deformability is obtained. However, a microstructure evolution will occur in and around the welded area during the welding process, which leads to the deterioration of performance in welded joints [,].
From a metallurgical point of view, welding can be identified as a thermal cycle that consists of continuous heating to a certain peak temperature and cooling to room temperature []. The weld thermal cycle changes the base metal and results in an inhomogeneous microstructure in heat-affected zone (HAZ) []. The previous research reported that HAZ is often the most critical region with regard to potential fatigue failures, and this phenomenon is closely related to their microstructures [,,]. The evaluation and prediction of fatigue behavior are very important to avoid catastrophic failure particularly in welded DP steel structures [,]. Therefore, the fatigue properties of HAZ for DP steel should be given more attention.
In most previous studies, the welded joint specimens were usually used to study the effect of microstructures of HAZ on fatigue behavior [,,]. However, research of the HAZ in actual welded joints is not easy due to the narrowness of the HAZ []. As a suitable method to prepare specimens, welding thermal simulation was used to investigate and identify the various HAZ subregions [,]. Hutchinson et al. used simulation to show the relationships between HAZ microstructures and toughness []. Boumerzoug et al. investigated the effect of heat treatment obtained by thermal cycles simulation on low carbon steel microstructure and indicated that microstructures correspond exactly to those observed in actual welded joint [].
In this paper, the fatigue life and crack propagation behaviors of simulated HAZ for DP pipeline steel were investigated. The difference of fatigue crack propagation behavior in HAZ subregions between actual and simulated welded joints was also discussed. This study provided beneficial experimental data for safe designs of gas transmission pipelines.
2. Materials and Methods
In this work, a commercial ferrite/bainite DP X80 pipeline was selected. The chemical composition and microstructure characterizations of DP steel are shown in Table 1 and Figure 1a. DP steel consists of as-rolled mixed microstructure of polygonal ferrite (PF) and bainite (BF).

Table 1.
Chemical composition (in wt %) of the X80 steel selected in the present study.
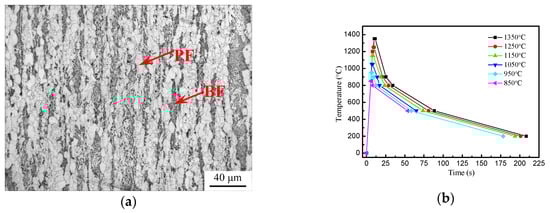
Figure 1.
(a) Optical micrographs of base metal; (b) Thermal cycle procedure for the experiments.
Thermal cycling simulations typical of the thermal cycles of the HAZ were performed using samples of 10×10×65 mm dimensions in a thermomechanical Gleeble-3800 system. The heat input of thermal cycles was 45 kJ/cm, which corresponds to the practical production. Figure 1b shows the thermal cycle procedure based on ANSYS analysis. For example, the specimen of coarse-grained heat affected zone (CGHAZ) was heated up at a constant rate of 130 °C/s to a peak temperature of 1350 °C and held for 1 s, then cooled down to 800 °C in 24 s and to 500 °C in 54 s, respectively. The other thermal cycles were performed at different peak temperatures, and the cooling speeds from 800 °C to 200 °C were the same as that in the above thermal cycle.
After the HAZ thermo-mechanical simulations, fatigue tests were performed on two types of fatigue samples that were machined from HAZ samples, as shown in Figure 2. Stripe and single-edge notched bend (SENB) specimens were used in the fatigue life test and fatigue crack propagation test, respectively.
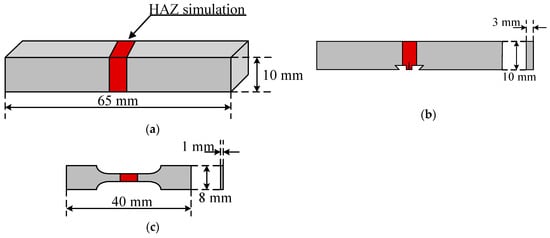
Figure 2.
(a) Geometry of the thermal cycling simulations test; (b) Geometry of fatigue crack propagation test; (c) Geometry of fatigue life and tensile test specimens.
The fatigue life tests were executed through an MTS servo-hydraulic universal testing machine (MTS 858, MTS, U.S.). The sinusoidal waveform and a stress ratio (R = σmin/σmax) of 0.1 were applied to specimens at a frequency of 20 Hz. The total fatigue cycles of each fatigue specimen were counted and considered as the fatigue life. The fatigue crack propagation tests were performed using an MTS 858 Mini Bionix testing machine (MTS, U.S.). The R-ratio and frequency were set at 0.1 and 20 Hz, respectively. The fatigue pre-cracking of each SENB specimen located in simulated zone and was generated by cyclic loading until a crack with the desired length was formed. Tensile tests were performed using an MTS 858 Mini Bionix testing machine at a strain rate of 1 × 10⁻³ s−1. An extensometer with a gauge length of 10 mm and a strain limit of 20% was used to measure strain during the tensile test. This procedure was conducted following the ASTM standard [,]. All of the above test and parameters are shown in Table 2.
Table 2.
Experimental projects and parameters in this study.
The analysis of microstructures was performed by optical microscopy (OM, Axiover 200MAT, ZEISS, Germany), scanning electron microscopy (SEM, S-4800, Hitachi, Japan), and electron back-scattered diffraction (EBSD, EDAX, U.S.). The SEM and EBSD were used to observe the fracture surface and the growth characteristic, respectively.
3. Results
3.1. Microstructure and Tensile Properties
Figure 3 shows OM images of the simulated welded microstructures at different peak temperatures. In CGHAZ (1350~1150 °C), granular bainite (GB) and the prior austenite grain boundary network exist in the microstructure (Figure 3a). GB is considered that some island constituents are distributed in matrix. Due to staying at a high temperature too long, the prior austenite grain size grows heavily. With the decrease of peak temperature, the prior austenite grain size decreases (Figure 3c). As the peak temperature decreases to 1150 °C, the microstructure mainly consists of quasi-polygonal ferrite (QF) and BF. The prior austenite grain boundaries disappear at the same time, which is regarded as fine-grained heat affected zone (FGHAZ) (Figure 3d). In intercritical-grained heat affected zone (ICHAZ), the as-rolled mixed microstructures of PF and BF appear in the microstructure (Figure 3f).
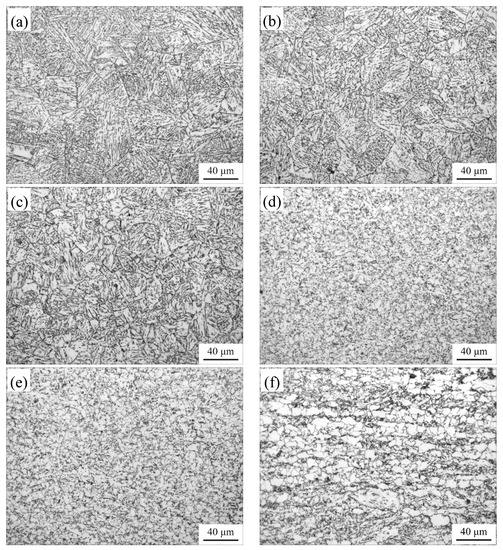
Figure 3.
OM images of the simulated welded microstructures (a) 1350 °C; (b) 1250 °C; (c) 1150 °C; (d) 1050 °C; (e) 950 °C; (f) 850 °C.
Figure 4 shows yield strength, tensile strength, and uniform elongation of samples after thermal cycling simulation. With the increase of peak temperature, the yield strength increases. The same variational trend is also found in the tensile strength. When the peak temperature is 950 °C, the yield strength and the tensile strength reach a minimum value. On the contrary, the uniform elongation increases with the increase of peak temperature first, then reduces and reaches the maximum at a peak temperature of 1050 °C.
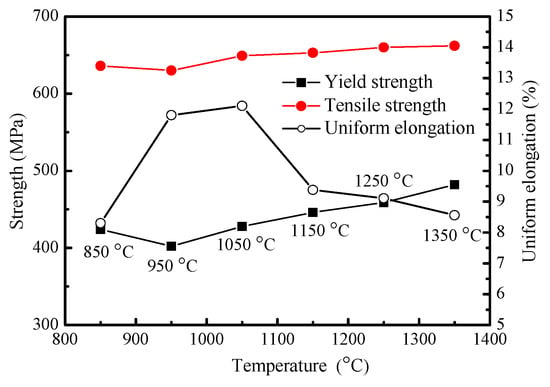
Figure 4.
Tensile property under different peak temperatures.
3.2. Fatigue Properties
The S−N curves obtained by the load control fatigue test are plotted in Figure 5. When the maximum stress is at the same magnitude, the fatigue life at a peak temperature of 1050 °C is very close to that of a peak temperature of 850 °C, and both of them are higher than that of a peak temperature of 1350 °C. The peak temperature of 1350 °C, 1050 °C, and 850 °C correspond to CGHAZ, FGHAZ, and ICHAZ, respectively. Thus, compared with other subregions, the fatigue life declines severely in CGHAZ. As described above, each HAZ subregion demonstrates many different microstructure characteristics because of different peak temperatures, especially CGHAZ (Figure 3). Therefore, the results of fatigue life test may be related to the effect of microstructure on the crack propagation behavior.
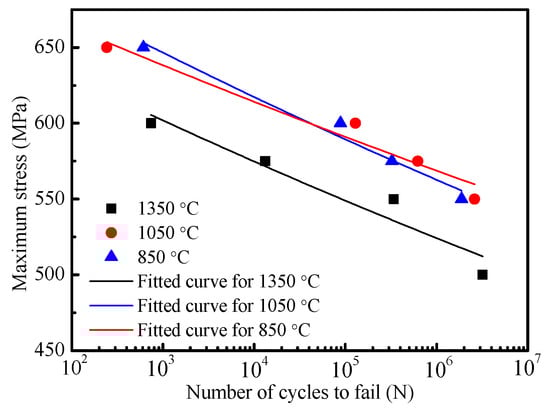
Figure 5.
Fatigue life at different peak temperatures.
Since a fatigue pre-crack is not formed, the full fatigue life is composed of a cycle of fatigue crack initiation, propagation, and fracture in the fatigue life test. The fatigue crack growth rate (da/dN) that is used as a basis to predict the fatigue life was also measured in the fatigue crack growth test. Figure 6 shows the relationship of da/dN with a stress intensity factor of crack tip (ΔK) for subareas of HAZ. When ΔK exceeds 27 MPa∙m1/2, da/dN in CGHAZ, ICHAZ, and FGHAZ have the same tendency of changes with ΔK before ultimate fracture region. As ΔK is less than 27 MPa∙m1/2, da/dN is the maximum in CGHAZ, is higher in FGHAZ, and is the minimum in ICHAZ. At the early crack propagation stage, fatigue cracks in CGHAZ grow fast and are easy to form large-size cracks in a short time. The subsequent accelerates cracks entering into ultimate fracture stage, which may explain why the fatigue life declines severely in CGHAZ.
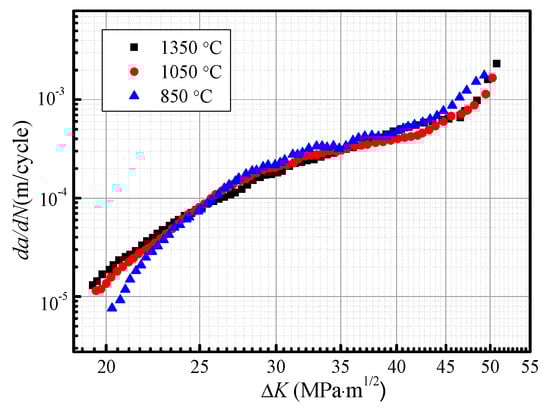
Figure 6.
Fatigue crack growth rate as a function of ΔK.
3.3. Fracture Analysis
Figure 7 shows the SEM fracture surface of the specimen at a peak temperature of 1350 °C in fatigue crack growth test. The river line patterns fanning out and flowing along the crack propagation direction are visible in early propagation region (Figure 7a). Whereas, some local river lines have different characters in direction, which may be related to orientation distributions of the bainite lath. In addition, the fracture surface features appear as the fatigue striation and fine second crack (Figure 7b). With the growth of fatigue crack, the characteristics of fracture surface differ. The spacing of fatigue striation increases, and some large second cracks can be observed (Figure 7c,d).
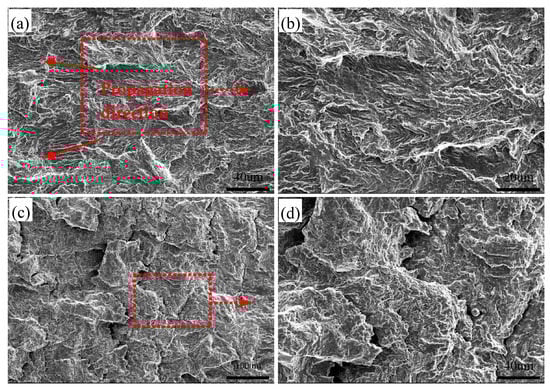
Figure 7.
Typical SEM micrographs of fracture surface at peak temperature of 1350 °C. (a) the fracture surface in the early stage; (b) magnified view of the dashed box in (a); (c) the area far away from the crack source; (d) magnified view of the dashed box in (c).
Figure 8 illustrates the characteristics of the fracture surface of the specimen at a peak temperature of 1050 °C. In the early propagation region, the fracture surface shows the ductile feature of flat facets and a small amount of second cracks (Figure 8a,b). As the crack continues to propagate inward, the size of flat facets and second cracks increase, and the fracture surface turns from initially rough into smooth (Figure 8c). With the increase of crack growth rate, the number of second cracks increases significantly and flake-like structures appear in the fracture surface (Figure 8d).
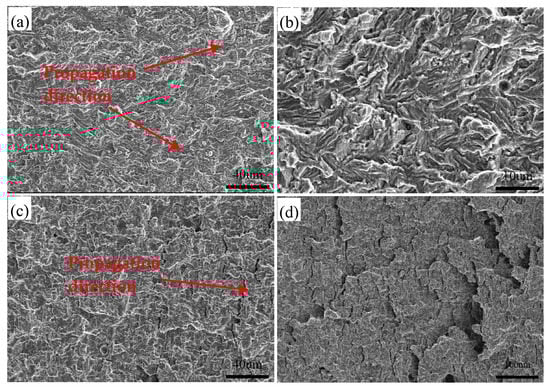
Figure 8.
Typical SEM micrographs of fracture surface at peak temperature of 1050 °C. (a) the fracture surface in the early stage; (b) magnified view in (a); (c) the area far away from the crack source; (d) the area close to ultimate fracture region.
Figure 9 shows the SEM fracture surface of the specimen at a peak temperature of 850 °C. The fracture surface feature is similar to that of the specimen at a peak temperature of 1050 °C. The fatigue striations and second cracks are visible, and some flat facets exist near the second cracks (Figure 9a,b). With the growth of fatigue crack, the plastic deformation of flat facets is accelerated and its size increases (Figure 9c). The large second cracks perpendicular to the propagation direction exist along the boundaries of the fracture facet (Figure 9d).
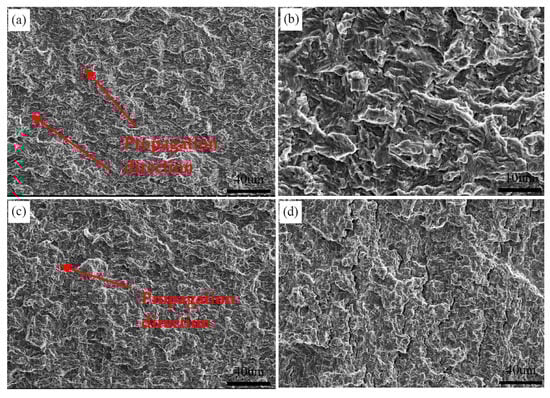
Figure 9.
Typical SEM micrographs of fracture surface at peak temperature of 850 °C. (a) the fracture surface in the early stage; (b) magnified view in (a); (c) the area far away from the crack source; (d) the area close to ultimate fracture region.
4. Discussion
4.1. Effect of Microstructure on Fatigue Crack Growth Behavior
The fatigue properties and the fracture surface features show that obvious differences exist in fatigue crack growth behaviors for different HAZ subregions. This result is related to the changes in crack path and fracture mode because of the possible microstructural sensitivity of fatigue crack propagation behavior.
The fatigue life test shows that the fatigue life declines severely in CGHAZ (Figure 5). As mentioned before, this result is caused by the higher da/dN in CGHAZ at the early crack propagation stage. Figure 10 shows the details of crack propagation path in HAZ subregions. When the cracks across the bainite colonies, the extended direction parallels to the lath BF boundaries (in Figure 10a designated A), and a few deflections occur in the prior austenite grain boundaries (in Figure 10a designated B). This phenomenon is also in accordance with the observation that the fracture surface appears local river lines with different characters in direction (Figure 7a). Previous studies have indicated that highly misoriented grain boundaries can efficiently arrest the propagation of cleavage micro-cracks [,]. For CGHAZ, bainite lath boundaries are mostly low-misorientation-angle boundaries (Figure 11). Thus, the fatigue crack may propagate along the bainite lath preferentially because of a weaker crack propagation resistance. Whereas, a considerable amount of highly misoriented grain boundaries exist in ferrite-ferrite and ferrite-BF boundaries because of a mixture of fine BF and ferrite microstructures (Figure 12). As shown in Figure 13, the number fraction of highly misoriented angle in FGHAZ is far more than that in CGHAZ, which implies more crack propagation resistance in FGHAZ. That is why the crack path in FCHAZ is more tortuous and appears some branches (Figure 10b). Therefore, da/dN in FGHAZ reduces compared with that in CGHAZ on account of the crack path deflection that decreases the local driving force for crack propagation.
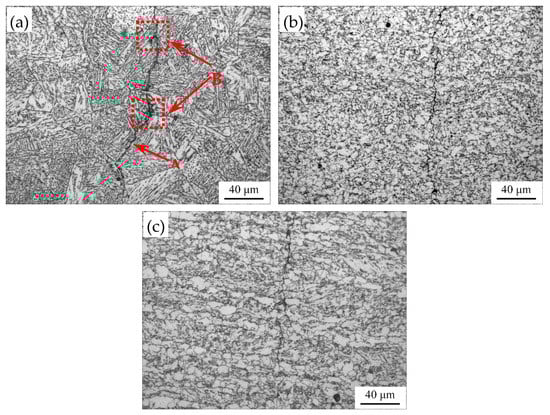
Figure 10.
Typical OM micrographs of the fatigue crack path (a) 1350 °C; (b) 1050 °C; (c) 850 °C.
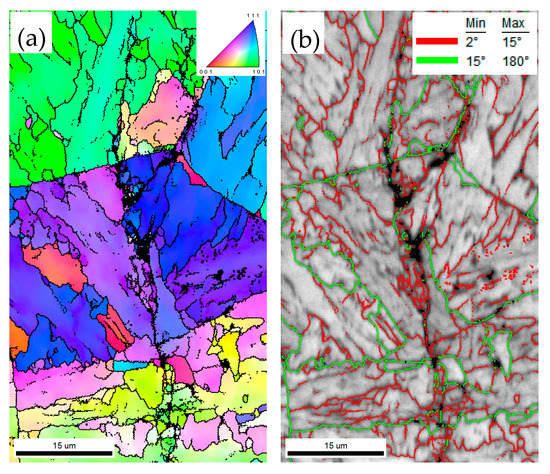
Figure 11.
Crystallographic characteristics of the fatigue cracks at peak temperature of 1350 °C. (a) Orientation image maps; (b) Image quality maps with grain boundary misorientation distribution.
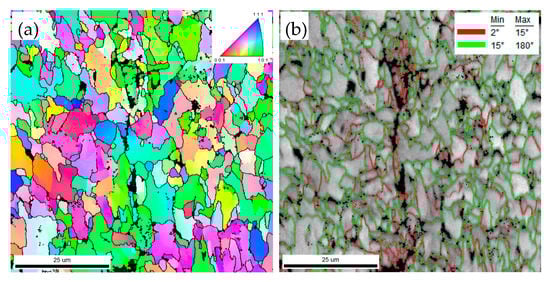
Figure 12.
Crystallographic characteristics of the fatigue cracks at peak temperature of 1050 °C. (a) Orientation image maps; (b) Image quality maps with grain boundary misorientation distribution.
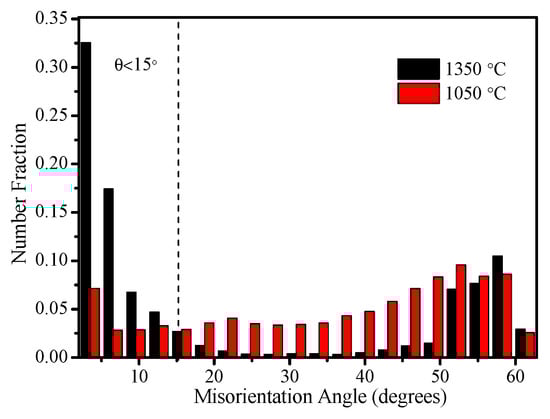
Figure 13.
Number fraction of misoriented angles at different peak temperatures.
Moreover, some micro-cracks and micro-voids appear near the main crack and most of them exist in the boundaries (Figure 12). Owning to the difference between BF and ferrite in strength, the incoordinate deformation may occur under cycle loading []. Slip bands are generated in the crack tip plasticity zone and accumulate against ferrite-BF boundaries [,]. Along with accumulative plastic strain intensifying, the micro-cracks form near the main crack, which is in accordance with the observation that numerous plastic deformations and clear second cracks exist around the flat facets (Figure 8a,b). This phenomenon also appears in ICHAZ (Figure 9 and Figure 14). The formation of these second cracks consumes a substantial energy of the main crack propagation to some extent. This is one of the reasons da/dN in FGHAZ and ICHAZ reduces compared with that in FGHAZ. In the case of ICHAZ, it is noteworthy that the ΔK and da/dN plot is more curve and seems to be a transition point. The results are similar to that described in previous studies [,].
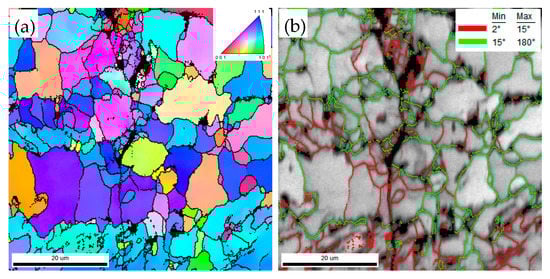
Figure 14.
Crystallographic characteristics of the fatigue cracks at peak temperature of 850 °C. (a) Orientation image maps; (b) Image quality maps with grain boundary misorientation distribution.
4.2. Difference between Simulated and Actual Welded Joints in Fatigue Crack Growth Behavior
To compare and analyze the difference between simulated and actual welded joints in fatigue crack growth behavior, a da/dN-ΔK curve after mosaic is obtained by thermal simulation samples, as shown in Figure 15. The simulated curve consists of different stages of each da/dN-ΔK curves in HAZ subregions. The variation trends between simulated and actual crack growth curve are basically consistent with an increase of ΔK. The maximum growth rate of da/dN is in CGHAZ, diminishes up to FGHAZ, then increases to ICHAZ. The crack growth curve can be described by Paris model base on the corresponding subregions [], given by Equation (1)
where C and m are constants with materials. The calculated C and m of different subregions in simulated and actual crack growth curve are listed in Table 3. The difference of da/dN and growth rate exist in different subregions. In CGHAZ, the crack growth curve of simulated samples is located below that of actual welded joint, i.e., da/dN of simulated samples is lower when ΔK at the same magnitude. This result is related to an increase of crack propagation resistance because of the changes in the size of prior austenite grain. As stated above, the prior austenite grain boundaries play an important role to arrest fatigue crack growth (Figure 10a) [,]. For simulated samples, the size of prior austenite grain remains substantially constant. On the contrary, the grain sizes gradually decrease with distance from the fusion line for actual welded joint []. As a result, the number of prior austenite grain boundary per unit area increases during the crack growth process and the resistance of fatigue crack propagation also increases, which is consistent with the variation that da/dN growth rate decreases with a increase of ΔK. In fact, the size of prior austenite grains close to the fusion line is larger than that of simulated specimen at a peak temperature of 1350 °C []. Therefore, da/dN of actual welded joint reaches a higher level at the early crack propagation stage.
da/dN = C(ΔK)m,
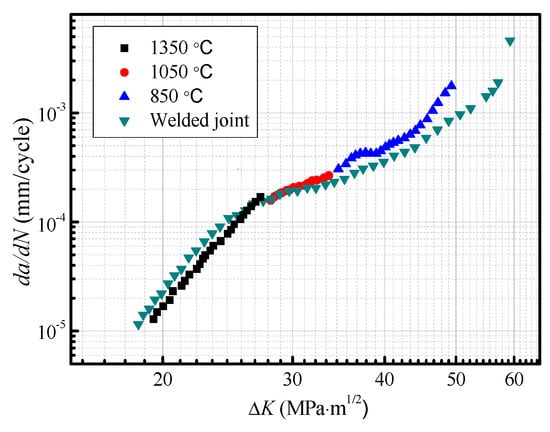
Figure 15.
The difference between the actual welded joint specimen and thermal simulation specimen.
Table 3.
The different fitting parameters of the da/dN-ΔK curves between the welded joint specimen and thermal simulation sample.
In FGHAZ, the crack growth curve of actual welded joint agrees with that of simulated samples. The reason is that the microstructure has less change with the increase of peak temperature in FGHAZ because of the smaller grain (Figure 3d,e). When the fatigue crack propagates toward ICHAZ, the m value of simulated curve is similar with the actual crack growth curve, but da/dN is different. In general, although the variation trends between simulated and actual crack growth curve are basically consistent with the increase of ΔK, some differences of da/dN and its growth rate exist in different subregions. In other words, the samples obtained by thermal cycling simulation can be used to research the microstructure and the fatigue crack growth behavior of HAZ. For the propagation life prediction of actual welded joint, however, the simulated crack growth curve exists some deviations.
5. Conclusions
(1) When the maximum stress is at the same magnitude, the fatigue life for X80 steel at a peak temperature of 1050 °C is very close to that of a peak temperature of 850 °C, and both of them are higher than that of a peak temperature of 1350 °C.
(2) When ΔK exceeds 27 MPa∙m1/2, da/dN in CGHAZ, ICHAZ, and FGHAZ have the same tendency of changes with ΔK before ultimate fracture region. As ΔK is less than 27 MPa∙m1/2, da/dN is the maximum in CGHAZ, is higher in FGHAZ, and is the minimum in ICHAZ.
(3) The changes in da/dN with ΔK for subregions are attributed to the variation of the crack path and the fracture mode during fatigue crack propagation. The fatigue crack may propagate along the bainite lath preferentially in CGHAZ, and the prior austenite grain boundaries can change the crack growth direction. A considerable amount of highly misoriented grain boundaries in FGHAZ and ICHAZ increase the crack growth resistance, thus the fatigue life is developed.
(4) The samples obtained by thermal cycling simulation can be used to research the microstructure and fatigue crack growth behavior in HAZ. For the propagation life prediction of actual welded joint, however, the simulated crack growth curve exists some deviations.
Author Contributions
Writing—review and editing, Z.Z.; formal analysis, P.X. and F.X.; investigation, H.C. and J.M.
Funding
This research was funded by [the Fundamental Research funds for the Central Universities] grant number [2018B13214].
Acknowledgments
This work was financially supported by the Fundamental Research funds for the Central Universities (No. 2018B13214), the National Natural Science Foundation of China (No. 51609078), and the National Natural Science Foundation of China (No. 51171162).
Conflicts of Interest
The authors declare no conflict of interest.
References
- Park, G.; Bae, G. Characterization of mechanical and metallurgical notch effects of DP980 steel weld joints in fatigue performance. Metall. Mater. Trans. A 2019, 50, 1297–1307. [Google Scholar] [CrossRef]
- Zhang, X.Y.; Gao, H.L. Effect of volume fraction of bainite on microstructure and mechanical properties of X80 pipeline steel with excellent deformability. Mater. Sci. Eng. A 2012, 531, 84–90. [Google Scholar] [CrossRef]
- Zhao, Z.P.; Qiao, G.Y. Fatigue properties of X80 pipeline steels with ferrite/bainite dual-phase microstructure. Mater. Sci. Eng. A 2016, 657, 96–103. [Google Scholar] [CrossRef]
- Zhao, Z.P.; Qiao, G.Y. Study of Fatigue Crack Propagation Behavior for Dual-Phase X80 Pipeline Steel. Ironmak. Steelmak. 2018, 7, 635–640. [Google Scholar] [CrossRef]
- Yang, Y.H.; Shi, L. Fracture toughness of the materials in welded joint of X80 pipeline steel. Eng. Fract. Mech. 2015, 118, 337–349. [Google Scholar] [CrossRef]
- Kim, S.; Kang, D. Fatigue crack growth behavior of the simulated HAZ of 800 MPa grade high-performance steel. Mater. Sci. Eng. A 2011, 528, 2331–2338. [Google Scholar] [CrossRef]
- Zhao, M.; Wei, F. Experimental and numerical investigation on combined girth welding of API X80 pipeline steel. Sci. Technol. Weld. Join. 2015, 20, 622–630. [Google Scholar] [CrossRef]
- Singh, M.P.; Kumar, R. Phase transformation and impact toughness in HAZ of micro alloyed X80 line pipe steel. Mater. Res. Express 2018, 6, 026561. [Google Scholar] [CrossRef]
- Farabi, N.; Chen, D.L. Microstructure and mechanical properties of laser welded DP600 steel joints. Mater. Sci. Eng. A 2010, 527, 1215–1222. [Google Scholar] [CrossRef]
- Ma, C.; Chen, D.L. Microstructure and fracture characteristics of spot-welded DP600 steel. Mater. Sci. Eng. A 2008, 485, 334–346. [Google Scholar] [CrossRef]
- Zhang, Y.M.; Fan, M. Fatigue analysis on offshore pipelines with embedded cracks. Ocean Eng. 2016, 117, 45–56. [Google Scholar] [CrossRef]
- Zhao, Z.P.; Qiao, G.Y. Fatigue properties of ferrite/bainite dual-phase X80 pipeline steel welded joints. Sci. Technol. Weld. Join. 2017, 22, 217–226. [Google Scholar] [CrossRef]
- Boumerzoug, Z.; Raouache, E. Thermal cycle simulation of welding process in low carbon steel. Mater. Sci. Eng. A 2011, 530, 191–195. [Google Scholar] [CrossRef]
- Ci, Y.; Zhang, Z.Z. Simulation study on heat-affected zone of high-strain X80 pipeline steel. J. Iron Steel Res. Int. 2017, 21, 966–972. [Google Scholar] [CrossRef]
- Mohammadi, F.; Eliyan, F.F. Corrosion of simulated weld HAZ of API X-80 pipeline steel. Corros. Sci. 2012, 63, 323–333. [Google Scholar] [CrossRef]
- Hutchinson, B.; Komenda, J. Heat affected zone microstructures and their influence on toughness in two microalloyed HSLA steels. Acta Mater. 2015, 97, 380–391. [Google Scholar] [CrossRef]
- ASTM. ASTM: E647; ASTM International Publisher: West Conshohocken, PA, USA, 2008. [Google Scholar]
- ASTM. ASTM: A370, Standard Test Methods and Definitions for Mechanical Testing of Steel Products, 2014.
- Lambert, A.; Garat, X. Application of acoustic emission to the study of cleavage fracture mechanism in a HSLA steel. Scr. Mater. 2000, 43, 161–166. [Google Scholar] [CrossRef]
- Lambert-Perlade, A.; Gourgues, A.F. Austenite to bainite phase transformation in the heat-affected zone of a high strength low alloy steel. Acta Mater. 2004, 52, 2337–2348. [Google Scholar] [CrossRef]
- Ishikawa, N.; Yasuda, K. Microscopic deformation and strain hardening analysis of ferrite-bainite dual-phase steels using micro-grid method. Acta Mater. 2015, 97, 257–268. [Google Scholar] [CrossRef]
- Paris, P.; Erdogan, F.J. A critical analysis of crack propagation laws. J. Basic Eng. Trans. ASME 1963, 85, 528–534. [Google Scholar] [CrossRef]
- Chen, X.W.; Qiao, G.Y. Effects of Mo, Cr and Nb on microstructure and mechanical properties of heat affected zone for Nb-bearing X80 pipeline steels. Mater. Des. 2014, 53, 888–901. [Google Scholar] [CrossRef]
© 2019 by the authors. Licensee MDPI, Basel, Switzerland. This article is an open access article distributed under the terms and conditions of the Creative Commons Attribution (CC BY) license (http://creativecommons.org/licenses/by/4.0/).